peat stability – risk and hazard assessment - igiigi.ie/assets/files/peat_stability/08 risk...
TRANSCRIPT

Peat Stability – Risk and Hazard Peat Stability – Risk and Hazard Assessment
Ian Uglow
Technical Director, SLR Consulting
7th October 2010

What goes into a Peat Stability Risk Assessment?
You will need:
• An understanding of what peat is – it is not an engineering soil
• How it is formed, and
• What are the influences on Peat stability?
The big question
Can we determine the shear strength of peat with any certainty?
You may consider:
• Assume very weak peat throughout
• Avoid quoting specific factors of safety for slope stability
• Assess the potential for instability by looking at the field indicators
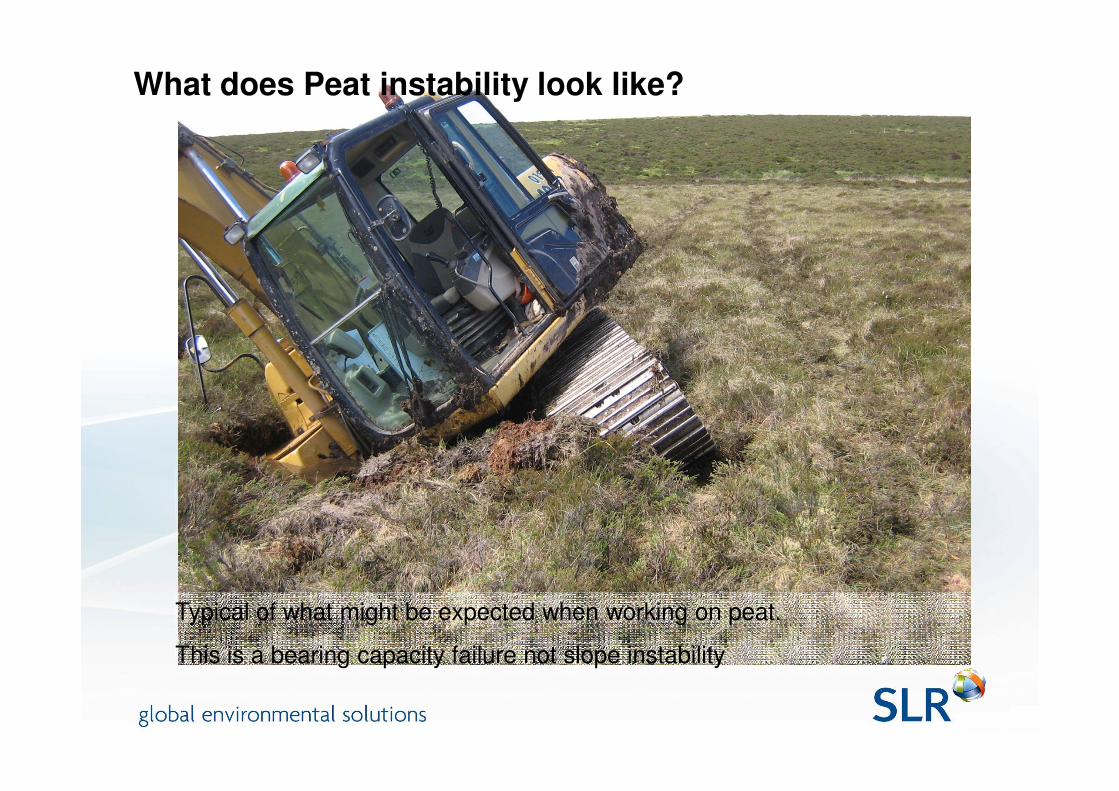
What does Peat instability look like?
Typical of what might be expected when working on peat.
This is a bearing capacity failure not slope instability

Type text here• Volume – certainly in excess of
200,000 m3
• Distance – up to 2.5km
• Effects – up to 20km in water
courses
• Delay – ?? years
• Impact on subsequent schemes -
Derrybrien Peat Slide Oct 2003
• Impact on subsequent schemes -
significant
Image courtesy R Lindsay UEL

More instability
Forest clearing for drainage run and
access track
• Drainage ditch was originally
straight
• Would a stability analysis predict
this situation?
• What is the residual stability for
the slope?
• What are the construction
Image courtesy O.M.Bragg, Dundee University
implications?
• Would you drive a 150 tonne
crane down the track?

Obvious Peat instability on a comparatively steep slope
These are naturally occurring ‘hags’ in peat about 1m thick
Wide scale instability has the potential to seriously disrupt construction,
operation, maintenance of the development and the regional ecology
If this was on neighbouring land, would you be concerned??
Depends on what is down slope

Potential Peat Instability
• ‘Peat Pipe’ exposed in an access road cutting• ‘Peat Pipe’ exposed in an access road cutting
• An accidental blockage of this pipe, which is a natural drain could result in a significant bog burst
• Large pipes can be over 1m in diameter and falling into one of these is a serious business
• Always conduct peat surveys with two personnel within line of sight at all times

Topography
Climate / weather
Drainage
Inter-relationships that influence Peat Stability
What about shear strength?
Peat stability
weather
HistoryConstruction
Drainage
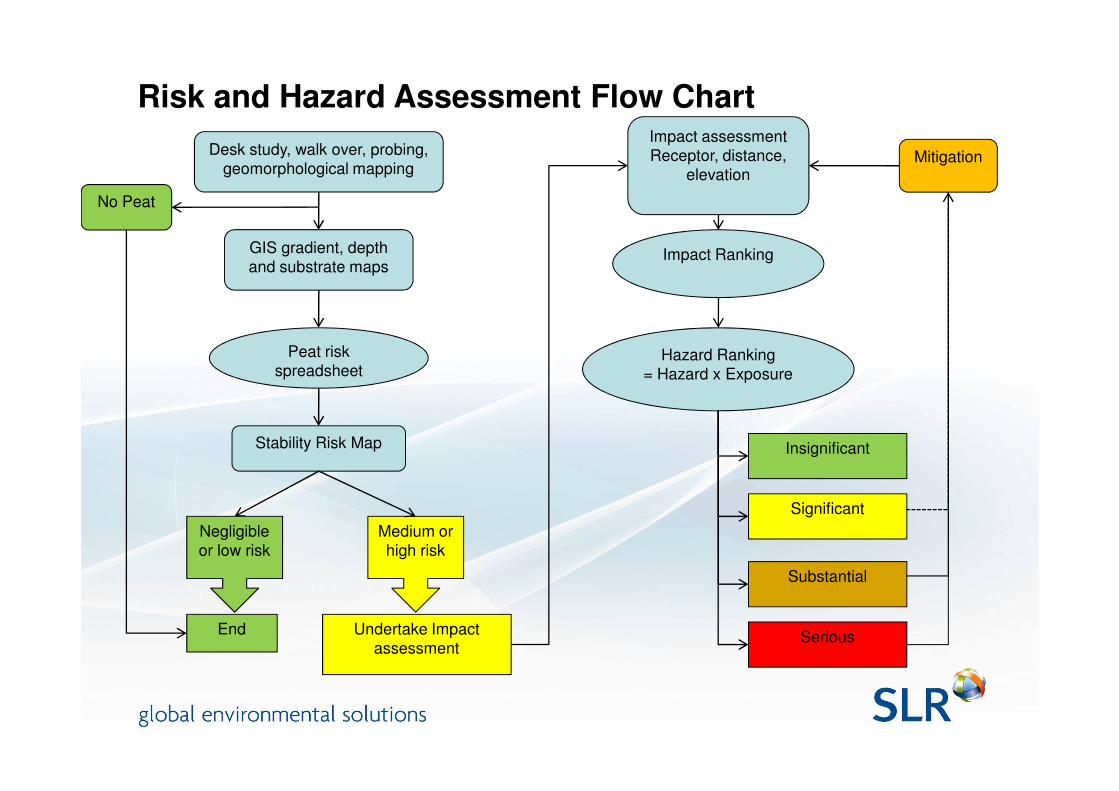
Risk and Hazard Assessment Flow Chart
Desk study, walk over, probing,
geomorphological mapping
GIS gradient, depth
and substrate maps
Peat risk
spreadsheet
Impact assessment
Receptor, distance,
elevation
Impact Ranking
Hazard Ranking
= Hazard x Exposure
No Peat
Mitigation
Stability Risk Map
End
Negligible
or low risk
Medium or
high risk
Undertake Impact
assessment
Insignificant
Significant
Substantial
Serious
Desk Study
Sources of information for a desk study:
• Aerial Photographs
• Land use records
• Regional geological maps
• Newspaper articles• Newspaper articles
• Landowner or tenant farmer
• Preliminary walk-over survey
• Ecology survey to identify peat areas
• Development layout if available
• Digital terrain model (DTM) recommend 1:5 000 or 1:10 000 and produce a
gradient map

Gradient Map
• Gradients determined from
data in DTM
• Assessment grid can be
varied from 5 to 50m (15m
used here)
• Gives clear and definitive
identification of steep slopes
• 50m stand-off to all mapped
water courseswater courses
• Extract gradient data and
plug into Risk Spreadsheet;
develop coefficients for
appropriate gradient ranges
Image courtesy of RES UK Ltd
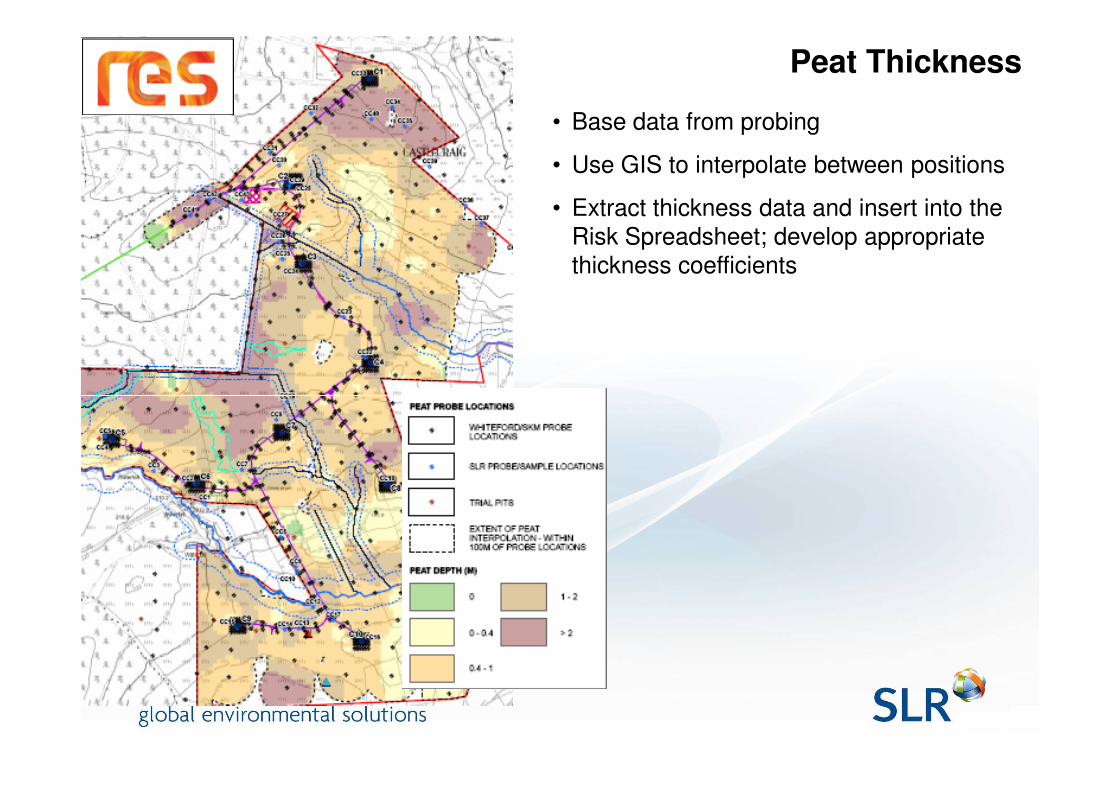
Peat Thickness
• Base data from probing
• Use GIS to interpolate between positions
• Extract thickness data and insert into the
Risk Spreadsheet; develop appropriate
thickness coefficients

Interpretation of Substrate
• Substrate can be determined from,
probing, trial pits, hand borings and
boreholes
• Interpretation from probing:
• Hard stop – rock or boulder
• Progressive or abrupt stop (no
noise) – stiff clay
• Progressive or abrupt stop
(grinding noise) – sand or gravel(grinding noise) – sand or gravel
• Gradual stop – soft clay
• Input substrate data in GIS to produce
map
• Input data to Risk Spreadsheet with
suitable coefficients
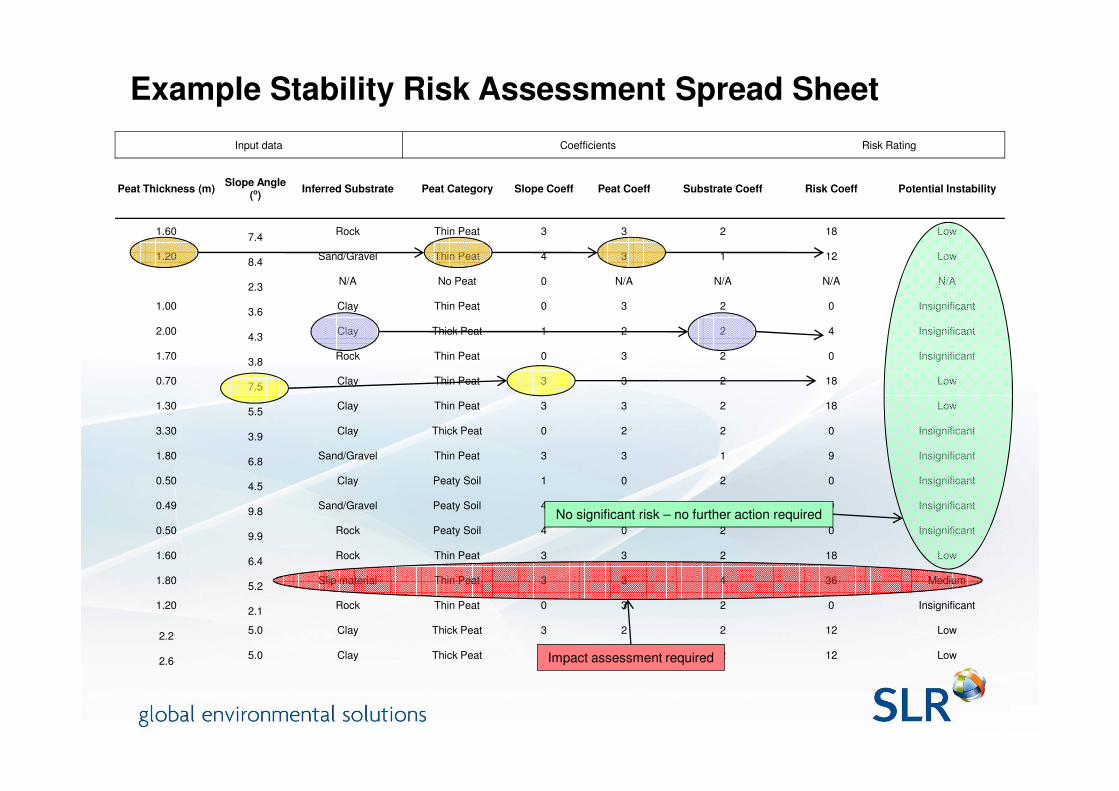
Input data Coefficients Risk Rating
Peat Thickness (m)Slope Angle
(o)Inferred Substrate Peat Category Slope Coeff Peat Coeff Substrate Coeff Risk Coeff Potential Instability
1.607.4
Rock Thin Peat 3 3 2 18 Low
1.208.4
Sand/Gravel Thin Peat 4 3 1 12 Low
2.3N/A No Peat 0 N/A N/A N/A N/A
1.003.6
Clay Thin Peat 0 3 2 0 Insignificant
2.004.3
Clay Thick Peat 1 2 2 4 Insignificant
1.703.8
Rock Thin Peat 0 3 2 0 Insignificant
0.707.5
Clay Thin Peat 3 3 2 18 Low
Example Stability Risk Assessment Spread Sheet
1.305.5
Clay Thin Peat 3 3 2 18 Low
3.303.9
Clay Thick Peat 0 2 2 0 Insignificant
1.806.8
Sand/Gravel Thin Peat 3 3 1 9 Insignificant
0.504.5
Clay Peaty Soil 1 0 2 0 Insignificant
0.499.8
Sand/Gravel Peaty Soil 4 0 1 0 Insignificant
0.509.9
Rock Peaty Soil 4 0 2 0 Insignificant
1.606.4
Rock Thin Peat 3 3 2 18 Low
1.805.2
Slip material Thin Peat 3 3 4 36 Medium
1.202.1
Rock Thin Peat 0 3 2 0 Insignificant
2.25.0 Clay Thick Peat 3 2 2 12 Low
2.65.0 Clay Thick Peat 3 2 2 12 Low
No significant risk – no further action required
Impact assessment required

Stability Risk Map
Risk map - stability coefficients and GIS
interpolation to produce four categories of risk.
Risk Coefficient Action
Negligible <10 No mitigation required although slide
management and monitoring shall be
developed including a site specific construction
and peat management plan
Low 11 – 20 Plus further assessment to consider mitigation
such as micro-siting
Medium 21 – 50 Plus Impact Assessment to consider
potential receptors
High >51 Unacceptable, avoid these areas. If this is not
possible, further detailed investigation
quantitative assessment with long term
monitoring
Coefficient ranges need to be set and then ‘truth
checked’ against site observations of peat
conditions.

Impact Assessment
If the risk of instability is negligible or low, no further action is required.
If we can demonstrate that the impact of any instability is low, there may be no
Hazard
( Note that the impact of instability could be from peat on the development or visa versa
and receptors outside the immediate development should be considered).
How to assess the Impact of instability; consider:How to assess the Impact of instability; consider:
1. Receptor vulnerability – non-critical, critical, sub-communities, community
2. Proximity – Distance and difference in elevation between the source and
receptor
3. Calculate an Impact rating – based on the cost of remediation relative to
development cost and the disruption to external receptors
4. Use coefficients for each to give a HAZARD RANKING
(stability risk rating x impact rating)

Hazard RankingHAZARD RANKING
HAZARD RANKING ZONE
ACTION(based on Scottish Executive guidance)
<4 INSIGNIFICANT No mitigation action required although slide management and monitoring shall be employed.Slide management shall include the development of a site specific construction plan for peat areas.
5 - 10 SIGNIFICANT As for Insignificant conditionplusFurther investigation to refine the assessment combined with detailed quantitative risk assessment to determine appropriate mitigation through relocation or re-design.mitigation through relocation or re-design.
11 - 16 SUBSTANTIAL Consideration of avoiding project development in these areas should be made unless hazard mitigation can be put in place without significant environmental effect.
17-25 SERIOUS Unacceptable level of hazard; part or all of the developmentshould be avoided.
Note that completion of the risk and hazard assessment does not guarantee
that all of the development is viable, there simply may not be an acceptable
mitigation measure.

Risk, Hazard Impact and Mitigation
• Risk of instability is high
• Hazard to structure and turbidity in loch
• Impact on ruin would be low, impact would
be high if the structure was a turbine house
• Mitigation
• Move building
• Construct deflector wall

Thank you