tellus border soil carbon and peat depth assessment ... · tellus border soil carbon and peat depth...
TRANSCRIPT
1
Tellus Border SOIL CARBON AND PEAT DEPTH ASSESSMENT
USING AIRBORNE GEOPHYSICAL DATA
Postdoctoral Fellow: Dr Antoinette Keaney
Project Supervisors: Drs Jennifer McKinley and Alastair Ruffell School of Geography, Archaeology and Palaeoecology
Queen’s University Belfast
1st October 2011 – 30th September 2013
Tellus Border Soil Carbon Project
2
Executive Summary
The Irish and UK governments have made a commitment to reduce emissions of greenhouse
gases. It is unlikely that this can be achieved by reducing emissions from the burning of fossil
fuels. As a result monitoring changes in stores of carbon in soils is crucial and the
conservation and restoration of peatlands has become increasingly important. The EU-funded
Tellus Border Soil Carbon and Peat Depth Assessment project was a two year postdoctoral
research project running from the 1st October 2011 – 30th September 2013. The overall aims
of the project were to:
• improve methodologies for estimating carbon in soil and peat depth;
• improve the estimate of carbon in soil and peat depths across Northern Ireland and the
bordering counties of the Republic of Ireland (RoI);
• contribute to peat management strategy in the study area.
Seven key deliverables were outlined to fulfil the aims of the project. These were
accomplished through 1) the examination of historical reports and previous surveys for both
NI and RoI to provide baseline data to monitor change in peat depth and soil organic carbon
and 2) the analysis of data from the Tellus Project, (Geological Survey of Northern Ireland,
GSNI) for Northern Ireland (NI) and the EU-funded Tellus Border project, GSNI and
Geological Survey of Ireland (GSI) for the Republic of Ireland (RoI). A Technical Advisory
Group (TAG) comprised of key stakeholders was established for the project.
This research applied spatial statistical techniques, including geostatistics and
geographical information systems (GIS), to investigate the use of airborne geophysical
integrated with soil geochemical data to provide information on the assessment of peat depths
and soil organic carbon (SOC). Saturated peat attenuates the radiometric signal from
underlying soils and rocks. A methodology, involving the use of cokriging, was developed to
integrate airborne geophysical (radiometric) data with ground-based measurements of peat
depth and SOC for soil carbon mapping. Contemporaneous ground-based measurements data
were collected to corroborate the mapped outputs. Estimations of peat depth are crucial for
providing accurate carbon stock calculations. These data were used to advise management
practices, in particular on two of the field site areas investigated; Ballynahone Bog, County
Londonderry (NI) and Sliabh Beagh, extending across the borders of Counties Tyrone and
Fermanagh (NI) and County Monaghan (RoI). Coordination with management committees
and presentation of data obtained on site provided a management toolbox allowing monitoring
of site remediation works and assessment of onsite conditions. Peat bogs are delicate
Tellus Border Soil Carbon Project
3
environments. Previous studies required extensive and time intensive ground-truthing. Data
from this project have provided a methodology which can be used to improve estimates of soil
carbon and peat depth across NI and the border regions of the RoI with minimal impact and
maximum output of data and knowledge. The use of the geostatistical approach enables a
spatial assessment of peat thickness and minimises destruction to a sensitive habitat. The
results from this research have a broader significance to promote the use of geostatistics and
remote sensing for spatial estimates of carbon stock.
Acknowledgements: This research is supported by the INTERREG IVA development programme of the European Regional Development Fund, which is managed by the Special EU Programmes Body (SEUPB). The views and opinions expressed in this report do not necessarily reflect those of the European Commission or the SEUPB.
The Tellus Project was funded by The Department for Enterprise, Trade and Investment (DETINI) and by the Building Sustainable Prosperity Scheme of the Rural Development Programme (Department of Agriculture and Rural Development of Northern Ireland). Geocorrected aerial orthophotography and Ordnance Survey of Northern Ireland (OSNI®) maps were reproduced from Land and Property Services data with the permission of the Controller of Her Majesty’s Stationery Office, Crown copyright and database rights MOU203. The Soil Carbon Project members comprised Drs Antoinette Keaney, Jennifer McKinley and Alastair Ruffell, The Queen’s University Belfast (QUB). The lead partners on the EU-funded Tellus Border project, Geological Survey of Northern Ireland (GSNI) and Geological Survey of Ireland (GSI) are thanked for their input on this research. The Technical Advisory Group (TAG) for the project made invaluable contribution to the completion of the project and enabled the outcomes from the research to impact peatland management policy. TAG members (Section 15, Table 15.1, page 9) comprised representatives from Agri-Food and Biosciences Institute (AFBI), Ballynahone Management Committee, British Geological Survey (BGS), Bord Na Móna, DOE Planning NI, Earthy Matters, ENVISION Community Heritage Project, the Environmental Protection Agency (EPA), ERA-Maptec Ltd, Friends of Ballynahone Bog (FoBB), Golder Associates, FracMan Technology Group, GSI, GSNI, Irish Planning Institute, Northern Ireland Environment Agency (NIEA), National University of Ireland, Galway (NUI Galway), Prifysgol Aberystwyth University, QUB, Royal Society for the Protection of Birds (RSPB), Sliabh Beagh hotel and tourism centre, Teagasc, University College Cork (UCC), University College Dublin (UCD), University of Limerick and Ulster Wildlife (UW),
Tellus Border Soil Carbon Project
4
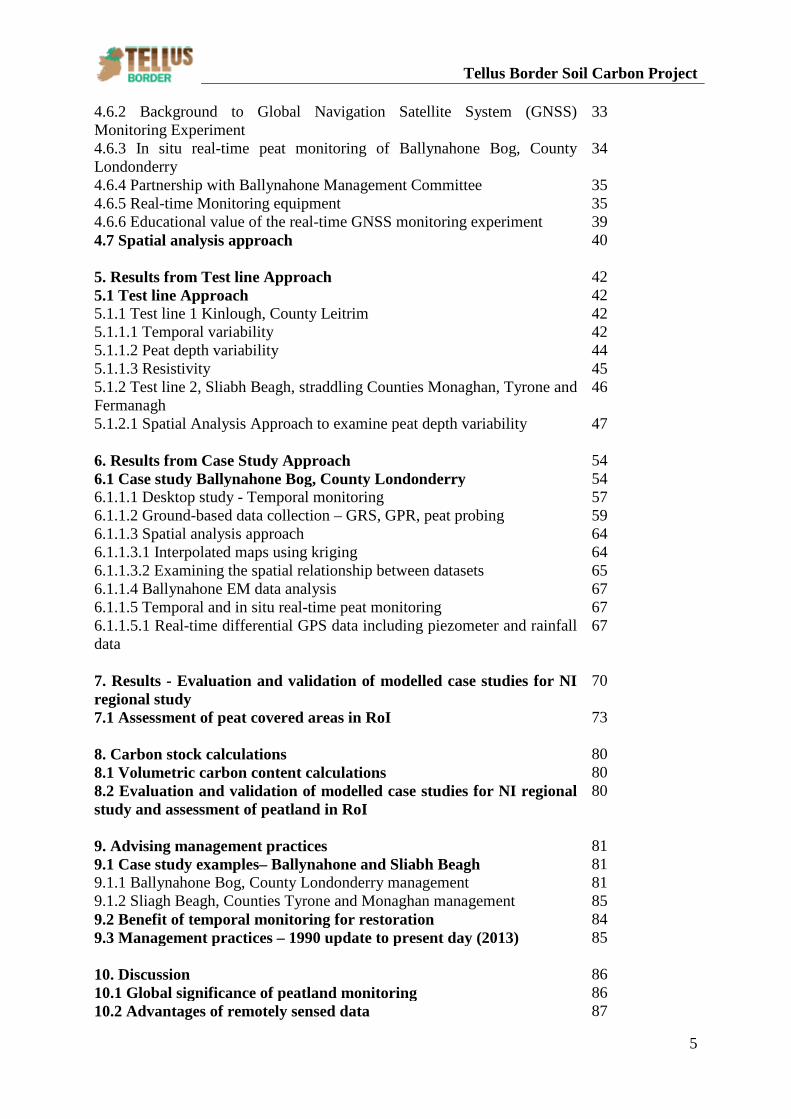
Soil Carbon and Peat Depth Assessment Using Airborne Geophysical Data Report
Table of Contents
Section Page Number
1. Introduction 9 1.1 United Nations’ Framework Convention on Climate Change 9 1.2 Estimates of soil carbon stores 10 1.3 Theoretical Framework 10 1.4 Overall aims and specific objectives of the Soil Carbon Project 11 1.5 Summary 12 2. Background to the Tellus and Tellus Border project 13 2.1 Tellus Survey (2004 – 2007) and Tellus Border project (2011 – 2013)
13
2.2 Airborne geophysical surveys 13 2.3 Ground based geochemical surveys 13 2.4 Summary 14 3. Historical and current information on soil carbon and peat depth 15 3.1 Review of historical and current databases (NI and RoI) 15 3.2 Historical and current databases (NI and RoI) 16 3.2.1 Issues identified within historical databases 17 3.2.2 Volumetric calculations from historical reports 18 3.3 Summary 19 4. Methodology 20 4.1 Test line approach 22 4.1.1 Test line 1, Kinlough, County Leitrim 23 4.1.2 Test line 2, Sliabh Beagh area, Counties Tyrone, Fermanagh and Monaghan
24
4.2 Case study approach 25 4.3 Field techniques 25 4.3.1 Handheld gamma-ray spectrometry (GRS) 25 4.3.2 Ground penetrating radar (GPR) 25 4.3.3 Resistivity 27 4.3.4 Magnetometry 27 4.3.4.1 Field procedure 27 4.3.5 Peat probing 28 4.4 Soil measurements 29 4.4.1 Soil geochemistry 29 4.4.2 Soil moisture 29 4.4.2.1 Sampling using corer ring 29 4.4.2.2 Sampling using Russian peat corer 30 4.4.3 Soil carbon density 31 4.5 Carbon stock calculations 32 4.5.1 Volumetric carbon content measurement 32 4.6 Temporal and in situ real-time peat monitoring 32 4.6.1 Introduction to real-time peat monitoring 32
Tellus Border Soil Carbon Project
5
4.6.2 Background to Global Navigation Satellite System (GNSS) Monitoring Experiment
33
4.6.3 In situ real-time peat monitoring of Ballynahone Bog, County Londonderry
34
4.6.4 Partnership with Ballynahone Management Committee 35 4.6.5 Real-time Monitoring equipment 35 4.6.6 Educational value of the real-time GNSS monitoring experiment 39 4.7 Spatial analysis approach 40 5. Results from Test line Approach 42 5.1 Test line Approach 42 5.1.1 Test line 1 Kinlough, County Leitrim 42 5.1.1.1 Temporal variability 42 5.1.1.2 Peat depth variability 44 5.1.1.3 Resistivity 45 5.1.2 Test line 2, Sliabh Beagh, straddling Counties Monaghan, Tyrone and Fermanagh
46
5.1.2.1 Spatial Analysis Approach to examine peat depth variability 47 6. Results from Case Study Approach 54 6.1 Case study Ballynahone Bog, County Londonderry 54 6.1.1.1 Desktop study - Temporal monitoring 57 6.1.1.2 Ground-based data collection – GRS, GPR, peat probing 59 6.1.1.3 Spatial analysis approach 64 6.1.1.3.1 Interpolated maps using kriging 64 6.1.1.3.2 Examining the spatial relationship between datasets 65 6.1.1.4 Ballynahone EM data analysis 67 6.1.1.5 Temporal and in situ real-time peat monitoring 67 6.1.1.5.1 Real-time differential GPS data including piezometer and rainfall data
67
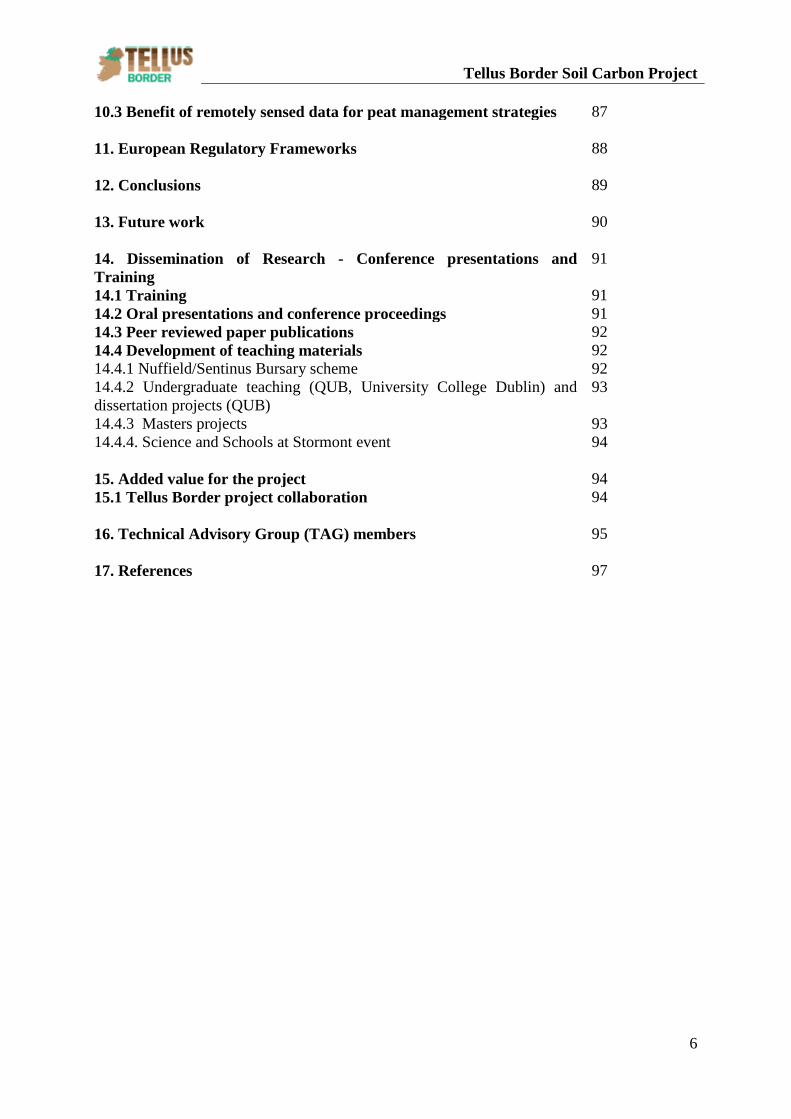
7. Results - Evaluation and validation of modelled case studies for NI regional study
70
7.1 Assessment of peat covered areas in RoI 73 8. Carbon stock calculations 80 8.1 Volumetric carbon content calculations 80 8.2 Evaluation and validation of modelled case studies for NI regional study and assessment of peatland in RoI
80
9. Advising management practices 81 9.1 Case study examples– Ballynahone and Sliabh Beagh 81 9.1.1 Ballynahone Bog, County Londonderry management 81 9.1.2 Sliagh Beagh, Counties Tyrone and Monaghan management 85 9.2 Benefit of temporal monitoring for restoration 84 9.3 Management practices – 1990 update to present day (2013) 85 10. Discussion 86 10.1 Global significance of peatland monitoring 86 10.2 Advantages of remotely sensed data 87
Tellus Border Soil Carbon Project
6
10.3 Benefit of remotely sensed data for peat management strategies 87 11. European Regulatory Frameworks
88
12. Conclusions 89 13. Future work 90 14. Dissemination of Research - Conference presentations and Training
91
14.1 Training 91 14.2 Oral presentations and conference proceedings 91 14.3 Peer reviewed paper publications 92 14.4 Development of teaching materials 92 14.4.1 Nuffield/Sentinus Bursary scheme 92 14.4.2 Undergraduate teaching (QUB, University College Dublin) and dissertation projects (QUB)
93
14.4.3 Masters projects 93 14.4.4. Science and Schools at Stormont event 94 15. Added value for the project 94 15.1 Tellus Border project collaboration 94 16. Technical Advisory Group (TAG) members 95 17. References 97
7
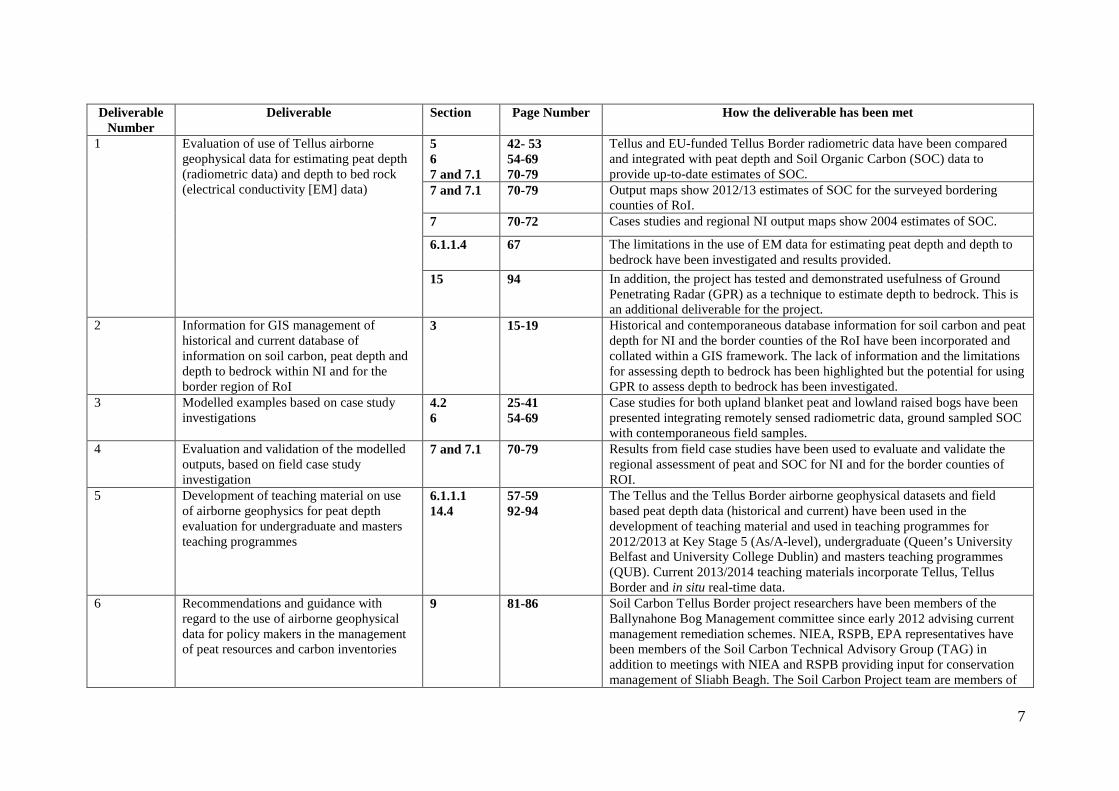
Deliverable Number
Deliverable Section Page Number How the deliverable has been met
1 Evaluation of use of Tellus airborne geophysical data for estimating peat depth (radiometric data) and depth to bed rock (electrical conductivity [EM] data)
5 6 7 and 7.1
42- 53 54-69 70-79
Tellus and EU-funded Tellus Border radiometric data have been compared and integrated with peat depth and Soil Organic Carbon (SOC) data to provide up-to-date estimates of SOC.
7 and 7.1 70-79 Output maps show 2012/13 estimates of SOC for the surveyed bordering counties of RoI.
7 70-72 Cases studies and regional NI output maps show 2004 estimates of SOC.
6.1.1.4
67
The limitations in the use of EM data for estimating peat depth and depth to bedrock have been investigated and results provided.
15 94 In addition, the project has tested and demonstrated usefulness of Ground Penetrating Radar (GPR) as a technique to estimate depth to bedrock. This is an additional deliverable for the project.
2 Information for GIS management of historical and current database of information on soil carbon, peat depth and depth to bedrock within NI and for the border region of RoI
3 15-19 Historical and contemporaneous database information for soil carbon and peat depth for NI and the border counties of the RoI have been incorporated and collated within a GIS framework. The lack of information and the limitations for assessing depth to bedrock has been highlighted but the potential for using GPR to assess depth to bedrock has been investigated.
3 Modelled examples based on case study investigations
4.2 6
25-41 54-69
Case studies for both upland blanket peat and lowland raised bogs have been presented integrating remotely sensed radiometric data, ground sampled SOC with contemporaneous field samples.
4 Evaluation and validation of the modelled outputs, based on field case study investigation
7 and 7.1 70-79 Results from field case studies have been used to evaluate and validate the regional assessment of peat and SOC for NI and for the border counties of ROI.
5 Development of teaching material on use of airborne geophysics for peat depth evaluation for undergraduate and masters teaching programmes
6.1.1.1 14.4
57-59 92-94
The Tellus and the Tellus Border airborne geophysical datasets and field based peat depth data (historical and current) have been used in the development of teaching material and used in teaching programmes for 2012/2013 at Key Stage 5 (As/A-level), undergraduate (Queen’s University Belfast and University College Dublin) and masters teaching programmes (QUB). Current 2013/2014 teaching materials incorporate Tellus, Tellus Border and in situ real-time data.
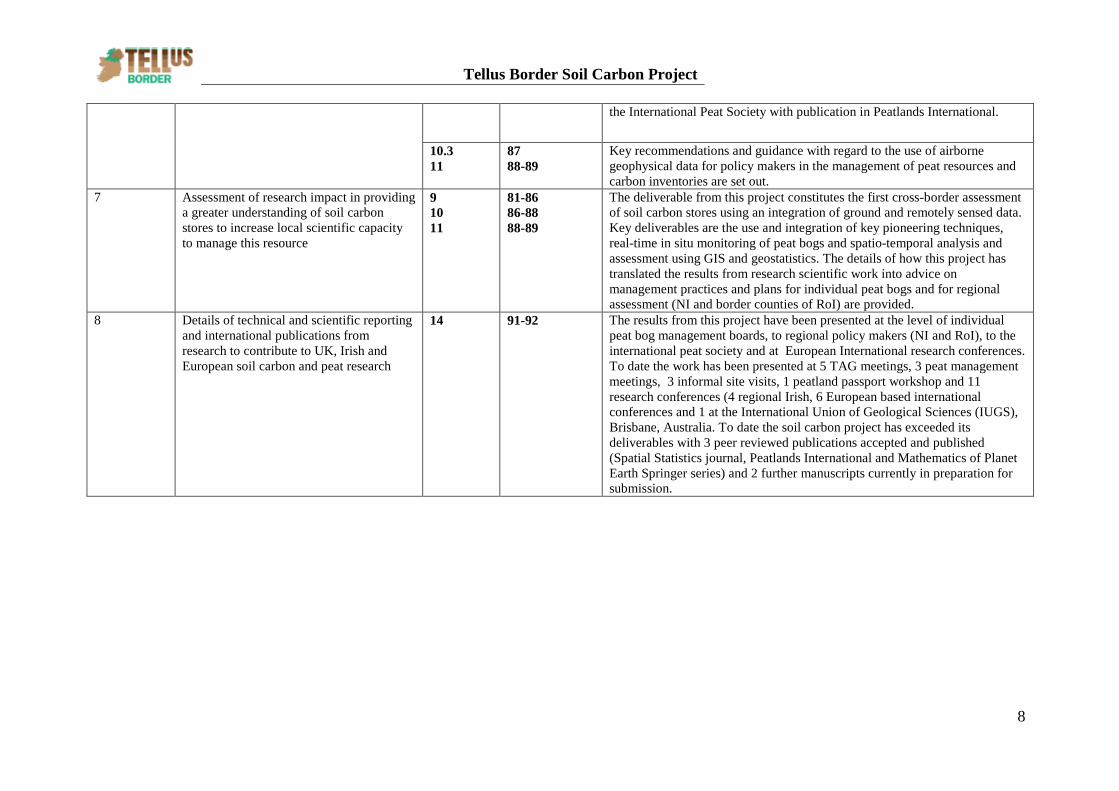
6 Recommendations and guidance with regard to the use of airborne geophysical data for policy makers in the management of peat resources and carbon inventories
9 81-86 Soil Carbon Tellus Border project researchers have been members of the Ballynahone Bog Management committee since early 2012 advising current management remediation schemes. NIEA, RSPB, EPA representatives have been members of the Soil Carbon Technical Advisory Group (TAG) in addition to meetings with NIEA and RSPB providing input for conservation management of Sliabh Beagh. The Soil Carbon Project team are members of
Tellus Border Soil Carbon Project
8
the International Peat Society with publication in Peatlands International.
10.3 11
87 88-89
Key recommendations and guidance with regard to the use of airborne geophysical data for policy makers in the management of peat resources and carbon inventories are set out.
7 Assessment of research impact in providing a greater understanding of soil carbon stores to increase local scientific capacity to manage this resource
9 10 11
81-86 86-88 88-89
The deliverable from this project constitutes the first cross-border assessment of soil carbon stores using an integration of ground and remotely sensed data. Key deliverables are the use and integration of key pioneering techniques, real-time in situ monitoring of peat bogs and spatio-temporal analysis and assessment using GIS and geostatistics. The details of how this project has translated the results from research scientific work into advice on management practices and plans for individual peat bogs and for regional assessment (NI and border counties of RoI) are provided.
8 Details of technical and scientific reporting and international publications from research to contribute to UK, Irish and European soil carbon and peat research
14 91-92 The results from this project have been presented at the level of individual peat bog management boards, to regional policy makers (NI and RoI), to the international peat society and at European International research conferences. To date the work has been presented at 5 TAG meetings, 3 peat management meetings, 3 informal site visits, 1 peatland passport workshop and 11 research conferences (4 regional Irish, 6 European based international conferences and 1 at the International Union of Geological Sciences (IUGS), Brisbane, Australia. To date the soil carbon project has exceeded its deliverables with 3 peer reviewed publications accepted and published (Spatial Statistics journal, Peatlands International and Mathematics of Planet Earth Springer series) and 2 further manuscripts currently in preparation for submission.
9
1. Introduction
1.1 United Nations’ Framework Convention on Climate Change
The Irish and UK governments have signed the Kyoto Protocol, an agreement within the
United Nations’ (UN) Framework Convention on Climate change that commits to reducing
emissions of greenhouse gases by 12.5% between 1990 and 2012. Soil carbon stores and
changes in these stores are a major component of the annual returns required by the Irish and
UK governments to the Intergovernmental Panel on Climate Change (IPCC). The importance
of peatlands particularly in relation to conservation and restoration is not a new phenomenon
and has been ongoing for many years. Projects such as the IUCN One programme 2013 –
2016 include the UK’s peatland conservation and restoration projects along with other
countries such as China, Russia, Germany and Australia. Links with the EPA Climate Change
Research Programme have also been established with Theme 1 addressing Greenhouse Gas
Emissions, Sinks and Management Systems (EPA, 2013). The high proportion of soil carbon
held within peat (42% of soil carbon in Northern Ireland) is due to the relatively high carbon
density of peat and organic-rich soils. Therefore it has become increasingly important to
measure and model soil carbon stocks and changes in peat stocks to facilitate the management
of carbon changes over time. This is particularly important for Ireland, where some 16% of
the surface is covered by peat bog. In Northern Ireland, the total amount of carbon stored in
vegetation has been estimated to be 4.4Mt compared to 386Mt stored within soils
(Cruickshank et al. 1998). When estimating carbon, there are three main variables necessary
for calculations: peat depth, peat bulk density and carbon content. The outcomes of the Soil
Carbon project are considered particularly beneficial with regards to the current EU policy
developments on ‘Soil organic matter management across the EU – best practices, constraints
and trade-offs’. The aims and objectives of this EU policy are “to assess the relative
contributions of the different inputs and outputs of organic carbon and organic matter to and
from the soil” (European Commission, 2012).
1.2 Estimates of Soil Carbon stores
Tomlinson (2004) stated that “Ireland’s agreed contribution to the EU aim of reducing
greenhouse gas emissions is to have a maximum increase of 13% by the 2008 – 12 period
over its 1990 emissions” (Tomlinson, 2004: A2). As discussed in Tomlinson (2004) due to
economic constraints, it is unlikely that this increase can be limited by reducing emissions
Tellus Border Soil Carbon Project
10
from the burning of fossil fuels. Thus limiting emissions from other sources is necessary and
increasing the sequestration of carbon into sinks may become more important.
1.3 Theoretical Framework
The research described in this report used the Tellus geophysical data and the newly acquired
data collected as part of the EU INTERREG IVA funded Tellus Border project to improve
peat depth models for Northern Ireland (NI) and the bordering counties of the Republic of
Ireland (RoI). It involved the use of airborne geophysical (radiometric and electromagnetic
conductivity [EM]) data to investigate the relationship between geophysical signals and peat
depths in peat covered areas. The aim of this research is to assess the usefulness of airborne
geophysical data integrated with ground-based data to improve current estimates of carbon in
soil and peat depths across Northern Ireland and the bordering counties of the Republic of
Ireland. The results and updated mapped estimates of carbon in soil and peat depths provide
information to contribute to peat management for individual peat bogs and for a regional (NI)
and county (RoI) assessment of soil carbon.
Previous work by the Geological Survey of Finland (Hyvönen et al., 2005), the Tellus project
GSNI (Beamish, 2013) and Queen’s University Belfast (QUB; Robinson, 2010) has
demonstrated that saturated peat attenuates gamma-radiation from underlying soils and rocks.
This attenuation of the radiometric signal from underlying rocks as a result of the saturated
peat can be used to estimate the thickness of peat, within certain limits. This project has used
individual peat bog case study sites within NI and the RoI to ground truth results generated
from airborne geophysical (radiometric and electromagnetic) surveys. At selected field sites
the techniques used included rainfall monitoring, peat depth probing, the use of ground
penetrating radar (GPR) combined with Differential Global Positioning Systems (DGPS) to
independently determine peat depth.
This research applies spatial statistical techniques, including uncertainty estimation through
geostatistical prediction, to investigate and model the use of airborne geophysical (radiometric
and electromagnetic) data to examine the relationship between geophysical data, in particular
the attenuation of radiometric signal, and peat depth. The results are used to update estimates
of peat depth and soil organic carbon. A methodology is developed to integrate airborne
geophysical (radiometric) data with ground-based measurements of peat depth and SOC for
soil carbon mapping.
Tellus Border Soil Carbon Project
11
1.4 Overall aims and specific objectives of the Soil Carbon Project The aims of this project are to:
• Improve methodologies for estimating carbon in soil and peat depth
• Improve the estimate of carbon in soil and peat depths across NI and the bordering
counties of the RoI
• Contribute to peat management strategy in the study area.
The specific objectives of the project activity that map onto the project deliverables are to:
1. Evaluate the use of airborne geophysical data to investigate the relationship between
reduced radioactivity signal and peat depth in peat covered areas.
2. Review and evaluate existing soil carbon and peat volume data and relevant current
research in RoI and NI.
3. Apply spatial statistical techniques to correlate peat depths with airborne radiometric
data using pre-existing Tellus and newly surveyed data.
4. Evaluate the use of variation in electrical conductivity to map depth to bedrock using
pre-existing Tellus and newly surveyed data
5. Evaluate the feasibility of using results from the spatial analysis approach to model
changes in peat depth and thus estimate effective capacity of soil carbon stocks both
within Northern Ireland (based on existing Tellus data) airborne data and in the border
counties of RoI, based on the newly collected data.
6. Integrate the use of airborne radiometric data with Ground Penetrating Radar (GPR),
depth probing, real time Differential Global Positioning Systems (DGPS) and site
rainfall monitoring on selected peat bogs within NI and across the survey area in RoI.
7. Validate the model approach using integrated data (GPR, peat depth probing and
logging) generated from case study field sites in peat bogs within NI and across the
Tellus Border survey area in RoI.
1.5 Summary
Both the Irish and UK governments have made a commitment to reducing emissions of
greenhouse gases. It is unlikely that this can be achieved by reducing emissions from the
burning of fossil fuels. As a result monitoring changes in stores of carbon in soils is crucial
and the conservation and restoration of peatlands has become increasingly important.
Tellus Border Soil Carbon Project
12
Historical reports and previous surveys for both NI and RoI provide baseline data to monitor
change in peat depth and soil organic carbon. Saturated peat attenuates the radiometric signal
from underlying rocks. Using this inverse relationship between airborne geophysical
(radiometric) data and peat depth, this report describes how spatial statistical techniques are
used to map peat depth and soil organic carbon. Contemporaneous ground-based
measurements data are collected to corroborate the mapped outputs. The aim is to improve
current estimates of carbon in soil and peat depths across NI and the bordering counties of the
RoI.
Tellus Border Soil Carbon Project
13
2. Background to the Tellus and Tellus Border projects 2.1 Tellus Survey (2004 – 2007) and Tellus Border project (2011 – 2013)
This research used geophysical data generated by two airborne surveys; the Tellus Project
(2004-2007) along with the more recently acquired data collected as part of the Tellus Border
project covering the six bordering counties of the Republic of Ireland, Donegal, Sligo,
Leitrim, Cavan, Monaghan and Louth (2011-2013). The Tellus Project was a unique scientific
venture and is the most comprehensive geological mapping study ever performed in Northern
Ireland (GSNI, 2011,). The Tellus Border project is a continuation of this survey. These
projects involved an airborne geophysical survey and a baseline geochemical survey.
2.2 Airborne geophysical surveys
The airborne surveys collected 143, 681 line-km of geophysical data combined. The airborne
surveys measured three geophysical parameters obtaining high resolution magnetic,
radiometric and electro-magnetic data. Flight lines had a line spacing of 200m and an average
flight altitude of 56m (240m over urban areas; Jones and Scheib, 2007). Terrestrial radiation
was sampled every second using a gamma-ray spectrometer (Explorium GR-820/3), a device
which resolves radiation emitted from the radioisotopes of potassium (K), uranium (eU) and
thorium (eTh) (IAEA, 2003). These radioisotopes, due to their abundance and half-lives, are
the main contributors of gamma radioactivity in rocks (Dypvik and Eriksen, 1983). Total
Count (TC) measurements measured in counts per second (cps) were collected across the
energy window from 0.41 to 2.81 MeV. TC data comprise a spectral summation, including
contributions from both natural and artificial radioactive sources and so provide a higher
signal/noise ratio than the individual radioisotope data. For this reason, TC data as opposed to
individual radioisotope levels, are used for the analysis shown since the signal/noise ratio is
important when analysing attenuation and low count behaviour in the radiometric data
(Beamish and Young, 2009; Beamish 2013).
2.3 Ground based geochemical surveys
The Tellus project included two geochemical surveys (Young and Smith, 2005). Soils were
sampled at 20 and 50cm depths on a regular grid, one site per 2 km2 and stream sediments and
waters sampled at an average of one site per 2km2 (GSNI, 2011). In total 22,000 samples were
collected between 2004 and 2006. Samples were analysed for approximately 60 elements and
inorganic compounds. Soils were analysed by XRF and ICP, with fire-assay for gold and
Tellus Border Soil Carbon Project
14
platinum group elements; stream sediments by XRF and fire-assay for gold and platinum
group elements and stream waters by ion chromatography and ICP (GSNI, 2011). The Tellus
Border geochemical field survey collected samples of soil, stream water and stream sediment
from approximately 7,000 locations across the border region in 2011 – 2012. Approximately
one sample was obtained per 3.5km2. The sampling methodologies were based on those
developed by the British Geological Survey G-BASE programme (Johnson, 2005a; Tellus
Border, 2013).
2.4 Summary
Airborne geophysical survey data (radiometric and EM) were used from the Tellus Project
(2004-2007) along with more recently acquired data from the Tellus Border project. These
projects included ground-based geochemical surveys generating baseline geochemical data
which, in addition to contemporaneous field measurements, were used to validate the airborne
data.
Tellus Border Soil Carbon Project
15
3. Historical and current information on soil carbon and peat depth Irish peatland is divided into blanket peatland (approximately 85%) and raised peat bogs
(approximately 15%; Tomlinson and Davidson, 2000). Raised bogs develop primarily in
lowland areas (<200m above Sea Level (SL); Wheeler and Shaw, 1995). Accumulating peat
in fens becomes isolated from the groundwater supply and this process of accumulation
gradually forms a dome of ombrogenous peat above the fen. Raised bogs display a distinct
topography, with the steep margins to the main bog expanse. Blanket bogs typically form on
gentle slopes within upland regions (>315m above SL; Hamilton, 1982). Their distribution is
associated with areas of high precipitation (rainfall exceeding 1200mm).
3.1 Review of historical and current databases (NI and RoI)
Previous research including Grant et al., (1997), Tomlinson et al., (1998) and Tomlinson,
(2004) investigated the nature and condition of peat bogs in NI and the RoI. The Peatland
Reports (Grant et al., 1997; Tomlinson et al., 1998) were commissioned by the Northern
Ireland Environment Agency (NIEA, formerly the Environment and Heritage Service (DoE
NI), the agency responsible for nature conservation in Northern Ireland. This followed
European Union legislation that required “member states to be responsible for the designation
and management of internationally important nature conservation sites within their
jurisdiction; that is, proposed Natura 2000 or European sites” (Grant et al. 1997, vol. 1: 3).
These reports provided baseline data against which future monitoring exercises can be
measured. The reports contain data of historical peat depths, basin morphology, site
boundaries, cutting, drainage, cross-sectional profiles, implications of findings and advice for
conservation and monitoring plans and estimates of peat mass and volume. Peat mass
calculations for the studies assume that peat density is equivalent to that of water (1g/cm3 or
1000 kg/m3).
Tellus Border Soil Carbon Project
16
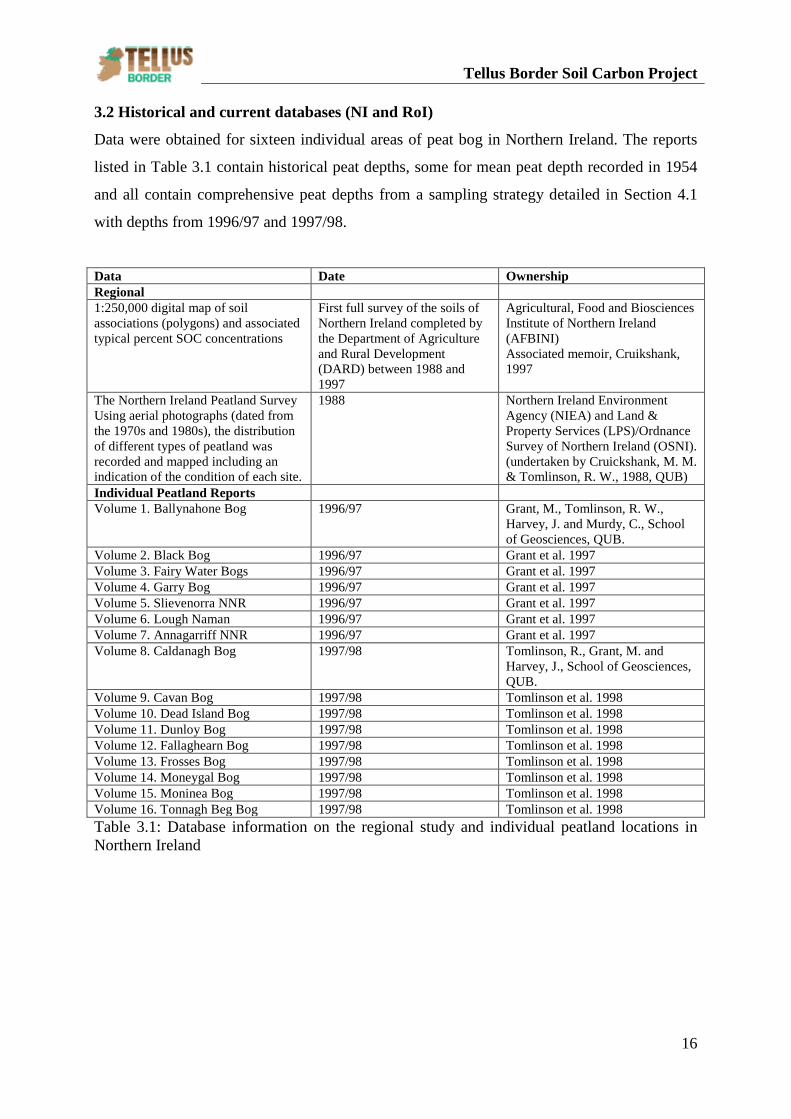
3.2 Historical and current databases (NI and RoI)
Data were obtained for sixteen individual areas of peat bog in Northern Ireland. The reports
listed in Table 3.1 contain historical peat depths, some for mean peat depth recorded in 1954
and all contain comprehensive peat depths from a sampling strategy detailed in Section 4.1
with depths from 1996/97 and 1997/98.
Data Date Ownership Regional 1:250,000 digital map of soil associations (polygons) and associated typical percent SOC concentrations
First full survey of the soils of Northern Ireland completed by the Department of Agriculture and Rural Development (DARD) between 1988 and 1997
Agricultural, Food and Biosciences Institute of Northern Ireland (AFBINI) Associated memoir, Cruikshank, 1997
The Northern Ireland Peatland Survey Using aerial photographs (dated from the 1970s and 1980s), the distribution of different types of peatland was recorded and mapped including an indication of the condition of each site.
1988 Northern Ireland Environment Agency (NIEA) and Land & Property Services (LPS)/Ordnance Survey of Northern Ireland (OSNI). (undertaken by Cruickshank, M. M. & Tomlinson, R. W., 1988, QUB)
Individual Peatland Reports Volume 1. Ballynahone Bog 1996/97 Grant, M., Tomlinson, R. W.,
Harvey, J. and Murdy, C., School of Geosciences, QUB.
Volume 2. Black Bog 1996/97 Grant et al. 1997 Volume 3. Fairy Water Bogs 1996/97 Grant et al. 1997 Volume 4. Garry Bog 1996/97 Grant et al. 1997 Volume 5. Slievenorra NNR 1996/97 Grant et al. 1997 Volume 6. Lough Naman 1996/97 Grant et al. 1997 Volume 7. Annagarriff NNR 1996/97 Grant et al. 1997 Volume 8. Caldanagh Bog 1997/98 Tomlinson, R., Grant, M. and
Harvey, J., School of Geosciences, QUB.
Volume 9. Cavan Bog 1997/98 Tomlinson et al. 1998 Volume 10. Dead Island Bog 1997/98 Tomlinson et al. 1998 Volume 11. Dunloy Bog 1997/98 Tomlinson et al. 1998 Volume 12. Fallaghearn Bog 1997/98 Tomlinson et al. 1998 Volume 13. Frosses Bog 1997/98 Tomlinson et al. 1998 Volume 14. Moneygal Bog 1997/98 Tomlinson et al. 1998 Volume 15. Moninea Bog 1997/98 Tomlinson et al. 1998 Volume 16. Tonnagh Beg Bog 1997/98 Tomlinson et al. 1998 Table 3.1: Database information on the regional study and individual peatland locations in Northern Ireland
Tellus Border Soil Carbon Project
17
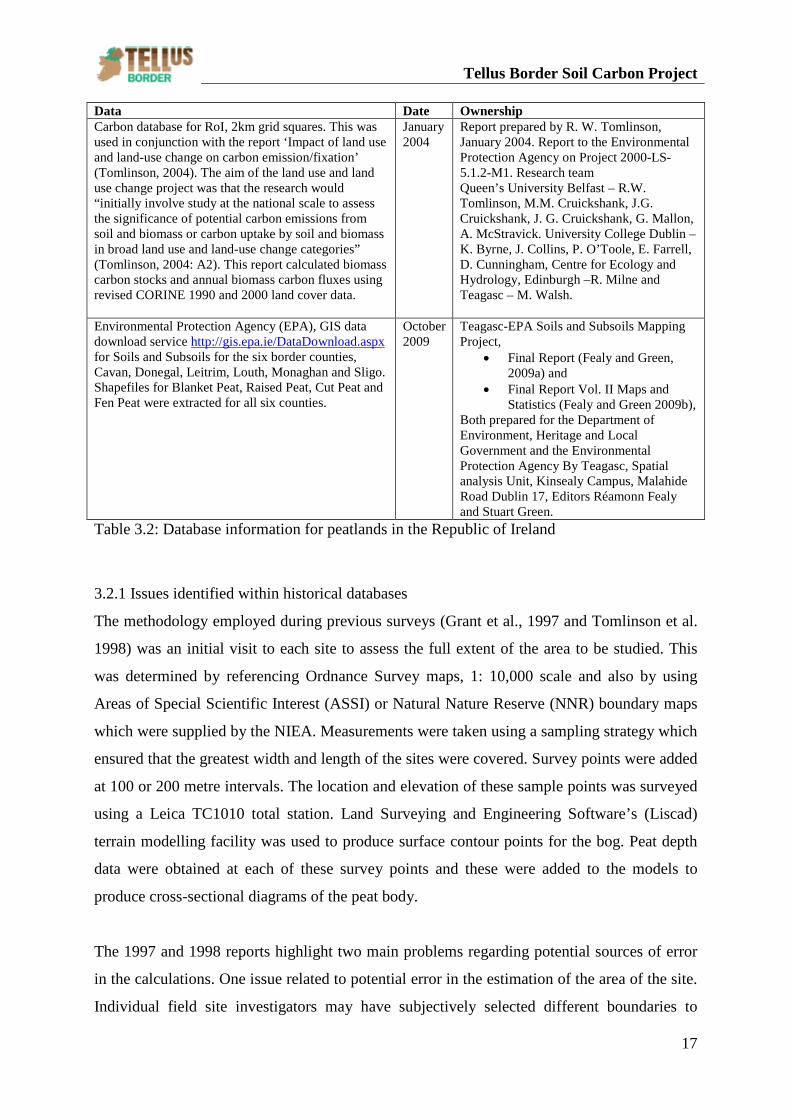
Data Date Ownership Carbon database for RoI, 2km grid squares. This was used in conjunction with the report ‘Impact of land use and land-use change on carbon emission/fixation’ (Tomlinson, 2004). The aim of the land use and land use change project was that the research would “initially involve study at the national scale to assess the significance of potential carbon emissions from soil and biomass or carbon uptake by soil and biomass in broad land use and land-use change categories” (Tomlinson, 2004: A2). This report calculated biomass carbon stocks and annual biomass carbon fluxes using revised CORINE 1990 and 2000 land cover data.
January 2004
Report prepared by R. W. Tomlinson, January 2004. Report to the Environmental Protection Agency on Project 2000-LS-5.1.2-M1. Research team Queen’s University Belfast – R.W. Tomlinson, M.M. Cruickshank, J.G. Cruickshank, J. G. Cruickshank, G. Mallon, A. McStravick. University College Dublin – K. Byrne, J. Collins, P. O’Toole, E. Farrell, D. Cunningham, Centre for Ecology and Hydrology, Edinburgh –R. Milne and Teagasc – M. Walsh.
Environmental Protection Agency (EPA), GIS data download service http://gis.epa.ie/DataDownload.aspx for Soils and Subsoils for the six border counties, Cavan, Donegal, Leitrim, Louth, Monaghan and Sligo. Shapefiles for Blanket Peat, Raised Peat, Cut Peat and Fen Peat were extracted for all six counties.
October 2009
Teagasc-EPA Soils and Subsoils Mapping Project,
• Final Report (Fealy and Green, 2009a) and
• Final Report Vol. II Maps and Statistics (Fealy and Green 2009b),
Both prepared for the Department of Environment, Heritage and Local Government and the Environmental Protection Agency By Teagasc, Spatial analysis Unit, Kinsealy Campus, Malahide Road Dublin 17, Editors Réamonn Fealy and Stuart Green.
Table 3.2: Database information for peatlands in the Republic of Ireland
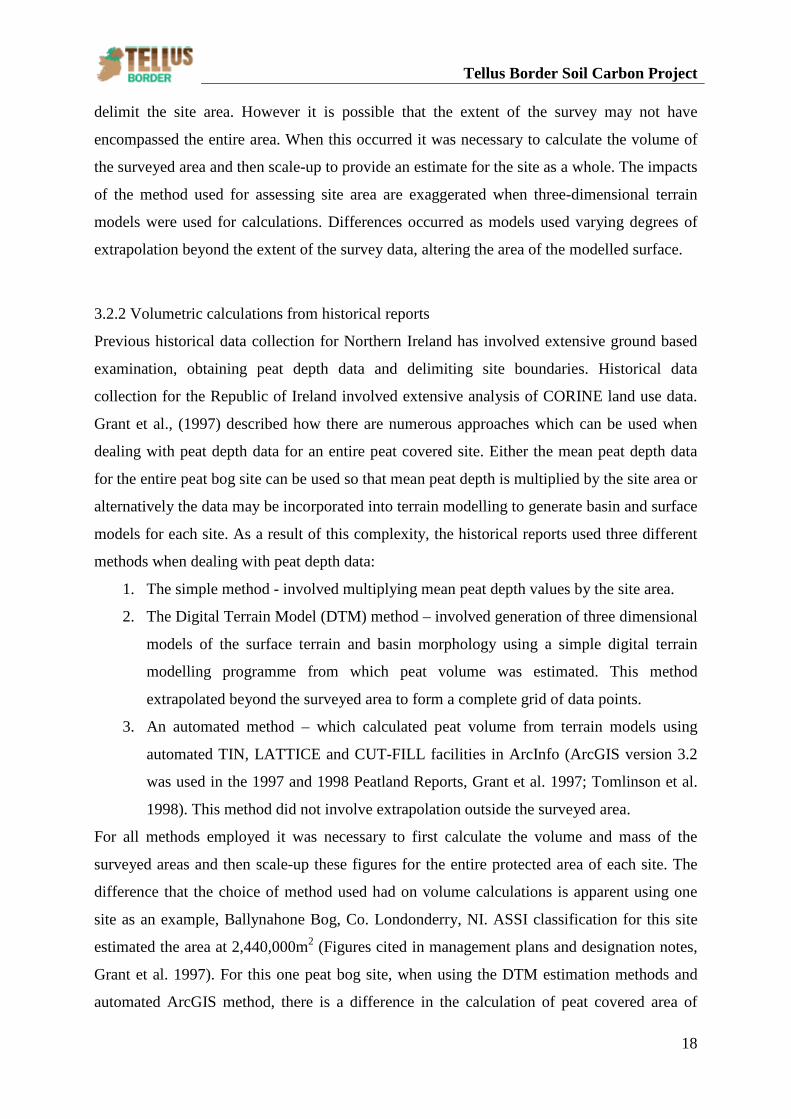
3.2.1 Issues identified within historical databases
The methodology employed during previous surveys (Grant et al., 1997 and Tomlinson et al.
1998) was an initial visit to each site to assess the full extent of the area to be studied. This
was determined by referencing Ordnance Survey maps, 1: 10,000 scale and also by using
Areas of Special Scientific Interest (ASSI) or Natural Nature Reserve (NNR) boundary maps
which were supplied by the NIEA. Measurements were taken using a sampling strategy which
ensured that the greatest width and length of the sites were covered. Survey points were added
at 100 or 200 metre intervals. The location and elevation of these sample points was surveyed
using a Leica TC1010 total station. Land Surveying and Engineering Software’s (Liscad)
terrain modelling facility was used to produce surface contour points for the bog. Peat depth
data were obtained at each of these survey points and these were added to the models to
produce cross-sectional diagrams of the peat body.
The 1997 and 1998 reports highlight two main problems regarding potential sources of error
in the calculations. One issue related to potential error in the estimation of the area of the site.
Individual field site investigators may have subjectively selected different boundaries to
Tellus Border Soil Carbon Project
18
delimit the site area. However it is possible that the extent of the survey may not have
encompassed the entire area. When this occurred it was necessary to calculate the volume of
the surveyed area and then scale-up to provide an estimate for the site as a whole. The impacts
of the method used for assessing site area are exaggerated when three-dimensional terrain
models were used for calculations. Differences occurred as models used varying degrees of
extrapolation beyond the extent of the survey data, altering the area of the modelled surface.
3.2.2 Volumetric calculations from historical reports
Previous historical data collection for Northern Ireland has involved extensive ground based
examination, obtaining peat depth data and delimiting site boundaries. Historical data
collection for the Republic of Ireland involved extensive analysis of CORINE land use data.
Grant et al., (1997) described how there are numerous approaches which can be used when
dealing with peat depth data for an entire peat covered site. Either the mean peat depth data
for the entire peat bog site can be used so that mean peat depth is multiplied by the site area or
alternatively the data may be incorporated into terrain modelling to generate basin and surface
models for each site. As a result of this complexity, the historical reports used three different
methods when dealing with peat depth data:
1. The simple method - involved multiplying mean peat depth values by the site area.
2. The Digital Terrain Model (DTM) method – involved generation of three dimensional
models of the surface terrain and basin morphology using a simple digital terrain
modelling programme from which peat volume was estimated. This method
extrapolated beyond the surveyed area to form a complete grid of data points.
3. An automated method – which calculated peat volume from terrain models using
automated TIN, LATTICE and CUT-FILL facilities in ArcInfo (ArcGIS version 3.2
was used in the 1997 and 1998 Peatland Reports, Grant et al. 1997; Tomlinson et al.
1998). This method did not involve extrapolation outside the surveyed area.
For all methods employed it was necessary to first calculate the volume and mass of the
surveyed areas and then scale-up these figures for the entire protected area of each site. The
difference that the choice of method used had on volume calculations is apparent using one
site as an example, Ballynahone Bog, Co. Londonderry, NI. ASSI classification for this site
estimated the area at 2,440,000m2 (Figures cited in management plans and designation notes,
Grant et al. 1997). For this one peat bog site, when using the DTM estimation methods and
automated ArcGIS method, there is a difference in the calculation of peat covered area of
Tellus Border Soil Carbon Project
19
730,669m2. The difference increases to 1,352,849m2 when using the simple method,
described above, and automated ArcGIS estimation method. Variations in calculations
multiply when volumes are estimated. The difference in volume calculations (just for this one
site) is 3, 226,721m3. It is important to consider the cumulative effect of mean volume
calculations in a wider context. For five selected field site areas a difference of 5,471,468m3,
is calculated between methods, this relates to variation in peat mass calculations of 5.47
million tonnes. This illustrates the necessity for a fresh investigation into the variability of
peat depth across areas of peat as these calculations are used for carbon stock calculations.
These peat mass calculations assume that peat density is equivalent to that of water so it is
1,000kg/m3. The necessity for accurate assessment of peat depths and survey areas becomes
apparent when analysing and comparing historical peat depths.
3.3 Summary
Previous historical data collection for NI involved extensive ground based examination, peat
depth data and delimiting site boundaries. Historical data collection for the RoI and NI
involved extensive analysis of land use data. Aerial photographs (dated from the 1970s and
1980s) were used in NI to map the distribution of different types of peatland. Historical
reports were accessed for sixteen individual peat bog locations in Northern Ireland. The
reports provided historical peat depths including limited information on mean peat depth
values for 1954 and comprehensive peat depth values from 1996/97 and 1997/98. These
historical data and reports provide baseline data for future monitoring. The reports detail the
different approaches which were used to calculate the area covered by peat and the
cumulative effect of mean volume calculations. This highlights the necessity for accurate
assessment of peat depth.
Tellus Border Soil Carbon Project
20
4. Methodology
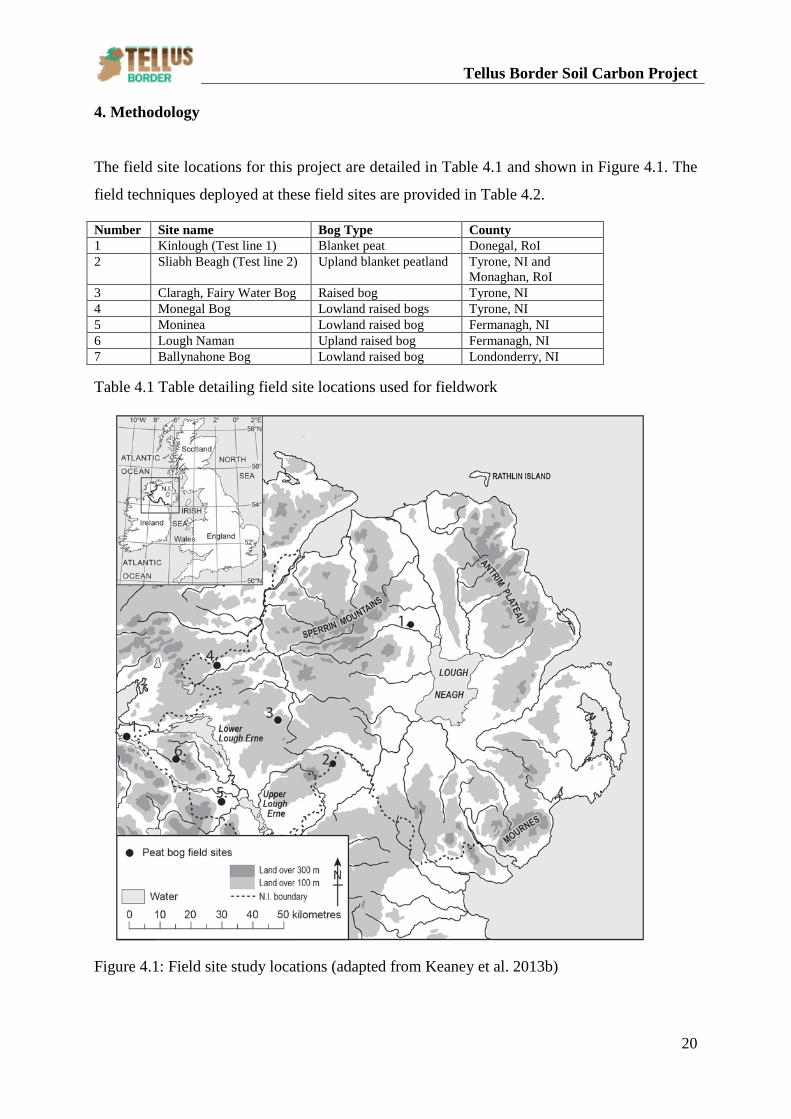
The field site locations for this project are detailed in Table 4.1 and shown in Figure 4.1. The
field techniques deployed at these field sites are provided in Table 4.2.
Table 4.1 Table detailing field site locations used for fieldwork
Figure 4.1: Field site study locations (adapted from Keaney et al. 2013b)
Number Site name Bog Type County 1 Kinlough (Test line 1) Blanket peat Donegal, RoI 2 Sliabh Beagh (Test line 2) Upland blanket peatland Tyrone, NI and
Monaghan, RoI 3 Claragh, Fairy Water Bog Raised bog Tyrone, NI 4 Monegal Bog Lowland raised bogs Tyrone, NI 5 Moninea Lowland raised bog Fermanagh, NI 6 Lough Naman Upland raised bog Fermanagh, NI 7 Ballynahone Bog Lowland raised bog Londonderry, NI
Tellus Border Soil Carbon Project
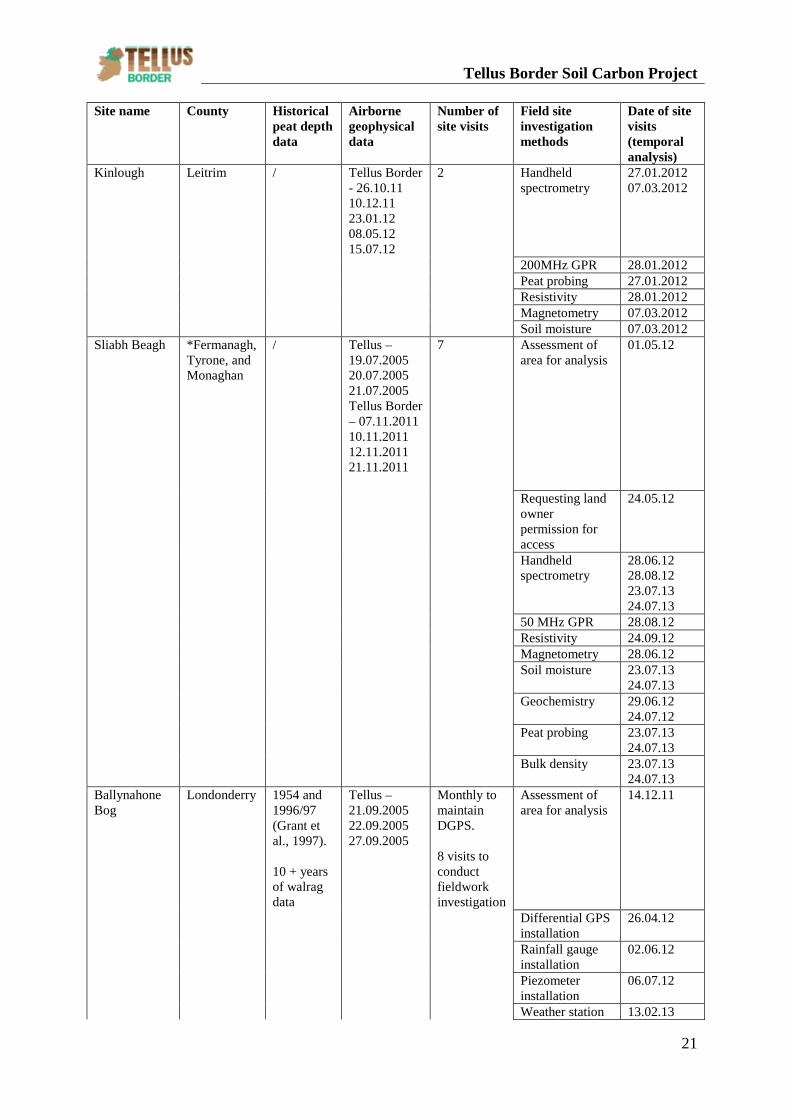
21
Site name County Historical peat depth data
Airborne geophysical data
Number of site visits
Field site investigation methods
Date of site visits (temporal analysis)
Kinlough Leitrim / Tellus Border - 26.10.11 10.12.11 23.01.12 08.05.12 15.07.12
2 Handheld spectrometry
27.01.2012 07.03.2012
200MHz GPR 28.01.2012 Peat probing 27.01.2012 Resistivity 28.01.2012 Magnetometry 07.03.2012 Soil moisture 07.03.2012 Sliabh Beagh *Fermanagh,
Tyrone, and Monaghan
/ Tellus – 19.07.2005 20.07.2005 21.07.2005 Tellus Border – 07.11.2011 10.11.2011 12.11.2011 21.11.2011
7 Assessment of area for analysis
01.05.12
Requesting land owner permission for access
24.05.12
Handheld spectrometry
28.06.12 28.08.12 23.07.13 24.07.13
50 MHz GPR 28.08.12 Resistivity 24.09.12 Magnetometry 28.06.12 Soil moisture 23.07.13
24.07.13 Geochemistry 29.06.12
24.07.12 Peat probing 23.07.13
24.07.13 Bulk density 23.07.13
24.07.13 Ballynahone Bog
Londonderry 1954 and 1996/97 (Grant et al., 1997). 10 + years of walrag data
Tellus – 21.09.2005 22.09.2005 27.09.2005
Monthly to maintain DGPS. 8 visits to conduct fieldwork investigation
Assessment of area for analysis
14.12.11
Differential GPS installation
26.04.12
Rainfall gauge installation
02.06.12
Piezometer installation
06.07.12
Weather station 13.02.13
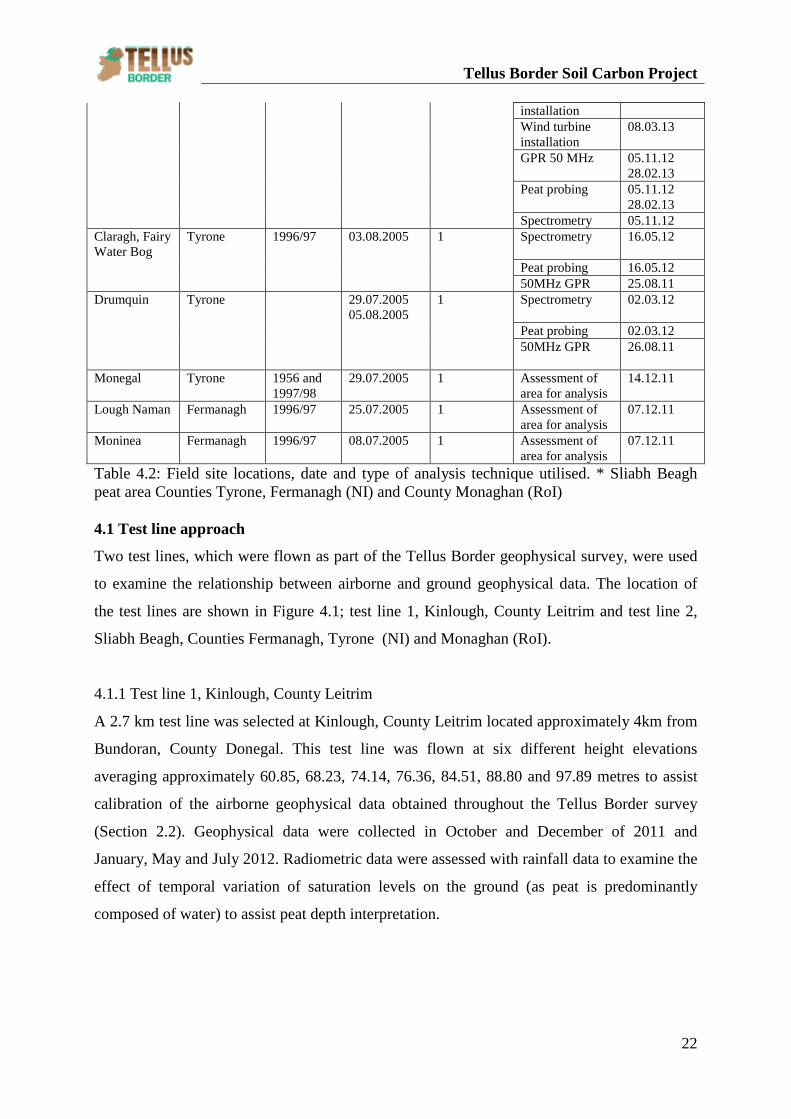
Tellus Border Soil Carbon Project
22
installation Wind turbine
installation 08.03.13
GPR 50 MHz 05.11.12 28.02.13
Peat probing 05.11.12 28.02.13
Spectrometry 05.11.12 Claragh, Fairy Water Bog
Tyrone 1996/97 03.08.2005 1 Spectrometry 16.05.12
Peat probing 16.05.12 50MHz GPR 25.08.11 Drumquin Tyrone 29.07.2005
05.08.2005 1 Spectrometry 02.03.12
Peat probing 02.03.12 50MHz GPR 26.08.11
Monegal Tyrone 1956 and
1997/98 29.07.2005 1 Assessment of
area for analysis 14.12.11
Lough Naman Fermanagh 1996/97 25.07.2005 1 Assessment of area for analysis
07.12.11
Moninea Fermanagh 1996/97 08.07.2005 1 Assessment of area for analysis
07.12.11
Table 4.2: Field site locations, date and type of analysis technique utilised. * Sliabh Beagh peat area Counties Tyrone, Fermanagh (NI) and County Monaghan (RoI) 4.1 Test line approach
Two test lines, which were flown as part of the Tellus Border geophysical survey, were used
to examine the relationship between airborne and ground geophysical data. The location of
the test lines are shown in Figure 4.1; test line 1, Kinlough, County Leitrim and test line 2,
Sliabh Beagh, Counties Fermanagh, Tyrone (NI) and Monaghan (RoI).
4.1.1 Test line 1, Kinlough, County Leitrim
A 2.7 km test line was selected at Kinlough, County Leitrim located approximately 4km from
Bundoran, County Donegal. This test line was flown at six different height elevations
averaging approximately 60.85, 68.23, 74.14, 76.36, 84.51, 88.80 and 97.89 metres to assist
calibration of the airborne geophysical data obtained throughout the Tellus Border survey
(Section 2.2). Geophysical data were collected in October and December of 2011 and
January, May and July 2012. Radiometric data were assessed with rainfall data to examine the
effect of temporal variation of saturation levels on the ground (as peat is predominantly
composed of water) to assist peat depth interpretation.
Tellus Border Soil Carbon Project
23
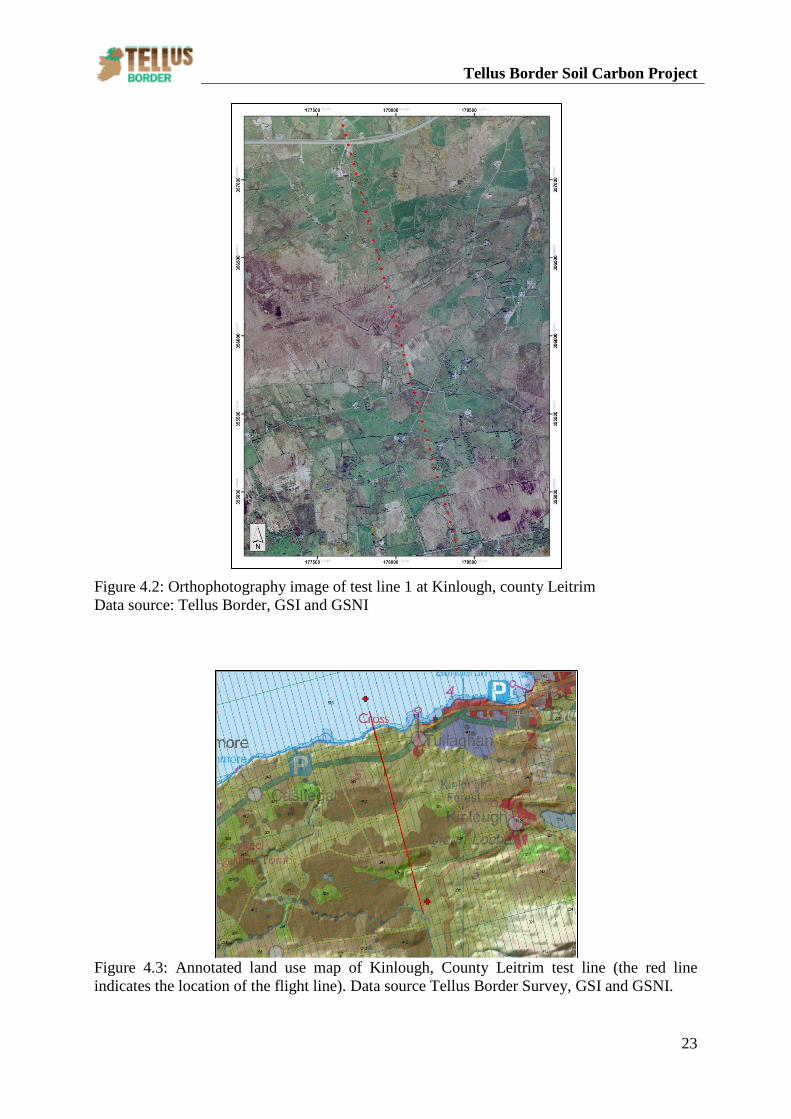
Figure 4.2: Orthophotography image of test line 1 at Kinlough, county Leitrim Data source: Tellus Border, GSI and GSNI
Figure 4.3: Annotated land use map of Kinlough, County Leitrim test line (the red line indicates the location of the flight line). Data source Tellus Border Survey, GSI and GSNI.
Tellus Border Soil Carbon Project
24
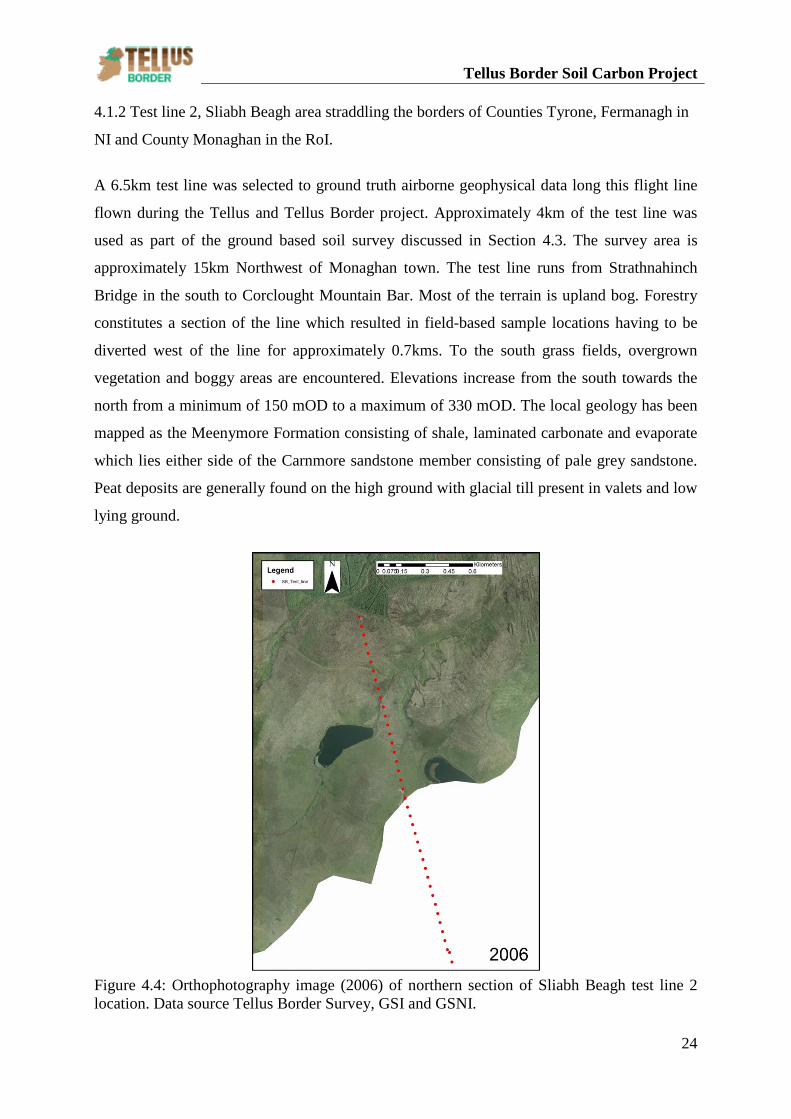
4.1.2 Test line 2, Sliabh Beagh area straddling the borders of Counties Tyrone, Fermanagh in
NI and County Monaghan in the RoI.
A 6.5km test line was selected to ground truth airborne geophysical data long this flight line
flown during the Tellus and Tellus Border project. Approximately 4km of the test line was
used as part of the ground based soil survey discussed in Section 4.3. The survey area is
approximately 15km Northwest of Monaghan town. The test line runs from Strathnahinch
Bridge in the south to Corclought Mountain Bar. Most of the terrain is upland bog. Forestry
constitutes a section of the line which resulted in field-based sample locations having to be
diverted west of the line for approximately 0.7kms. To the south grass fields, overgrown
vegetation and boggy areas are encountered. Elevations increase from the south towards the
north from a minimum of 150 mOD to a maximum of 330 mOD. The local geology has been
mapped as the Meenymore Formation consisting of shale, laminated carbonate and evaporate
which lies either side of the Carnmore sandstone member consisting of pale grey sandstone.
Peat deposits are generally found on the high ground with glacial till present in valets and low
lying ground.
Figure 4.4: Orthophotography image (2006) of northern section of Sliabh Beagh test line 2 location. Data source Tellus Border Survey, GSI and GSNI.
Tellus Border Soil Carbon Project
25
4.2 Case study approach
A case study approach was used to compare historical peat depth data as provided in Peatland
reports for Northern Ireland (Grant et al. 1997; Tomlinson et al. 1998) with mapped outputs of
airborne geophysical data (radiometric and EM data) from the Tellus Project, GSNI. The peat
areas used as case study field sites for this project are shown in Figure 4.1. The results from
this were augmented and validated by field work techniques. The field techniques deployed at
these field sites are explained below and the details for each field site detailed in Table 4.2.
4.3 Field Techniques
4.3.1 Handheld gamma-ray spectrometry (GRS)
Gamma radiation field measurements were taken to obtain terrestrial radiation measurements
to examine the relationship between the airborne radiometric data and ground based data.
These field measurements were recorded using a Scintrex GIS-5 spectrometer, a portable
instrument equipped with a 82cc Nal (TI) crystal, which distinguishes potassium (40 K),
uranium (214Bi) and thorium (208TI) radiation. The device allows the user to select the
energy threshold above which gamma rays are counted. There are four available threshold
settings:
TC - all energies above 0.05 MeV
K + U + Th - all energies above 1.38 MeV
U +Th - all energies above 1.66 MeV and
Th – all energies above 2.44 MeV (Keaney, 2013)
When comparing the spectrometry results with the airborne radiometric TC data the results
from the TC threshold were used. GRS data were collected using 10 second total count
readings. Tyler et al. (1996) and Tyler (2004) discuss several approaches which can be used
for GRS data acquisition. The Slatt et al. (1992) methodology was utilised for this research as
it allowed sufficient measurements to be taken over the distances covered during fieldwork
investigation. The GRS methodology involved taking five measurements at each sample
location, discarding the highest and the lowest spectrometry values to account for anomalous
contributions from non-geogenic radioactive sources and averaging the three remaining
values.
Tellus Border Soil Carbon Project
26
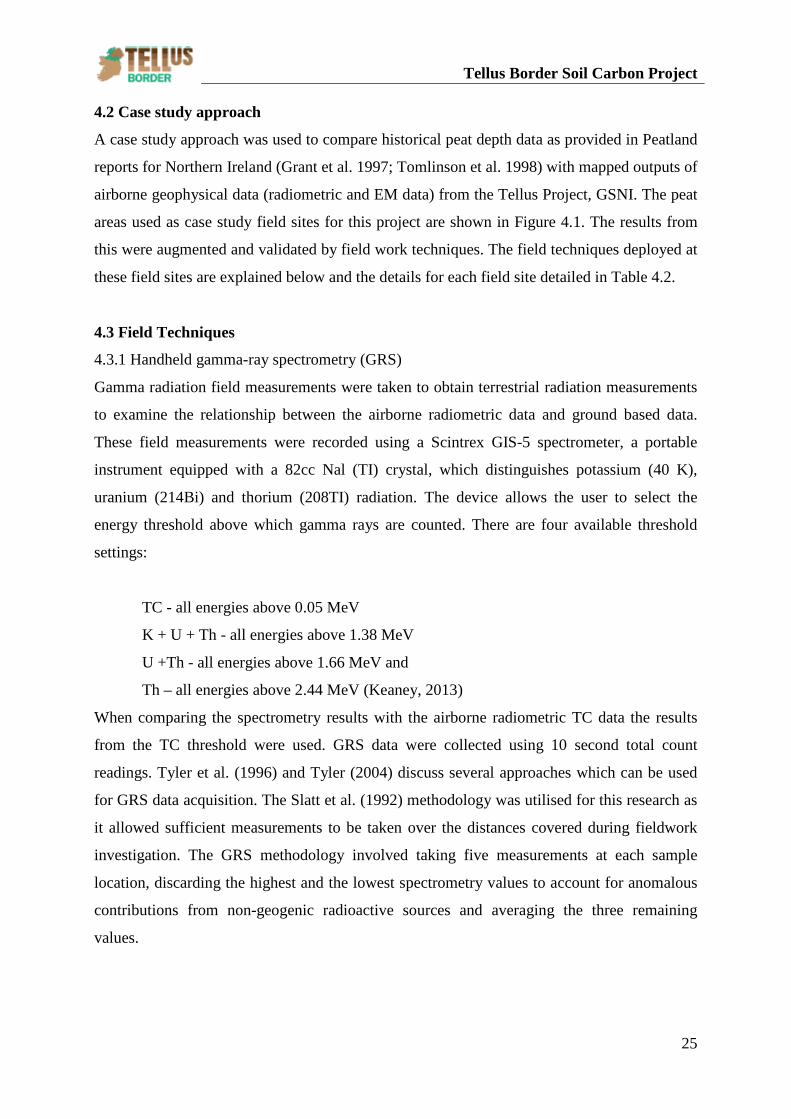
4.3.2 Ground penetrating radar (GPR)
Ground penetrating radar was used over defined surface profiles to determine peat depth and
the subsurface topography of the bog. GPR is a non-invasive remote sensing radio survey
technique utilising a radio antenna carried across the bog. A rugged, high-performance single
channel GPR data acquisition system GSSI-SIR 3000 with a 200 MHz antenna was used in
Kinlough, County Leitrim on the 28th January 2012. This system setup requires two users, one
to pull the GPR equipment and another to carry the display to log the GPR traces. The system
has dimensions 31.5 x 22 x 10.5cm and weights 4.1kgs. Other field site locations (see Table
4.2) were analysed using a MALÅ Geoscience system with a 50 MHz, 5 metre long cable
type antennae for maximum depth penetration. The 50MHz comprised of a single operator
walking across the specified area with a 5m long cable type antenna trailed behind the user.
This antenna cable is 30cm wide and thus has a narrow footprint in relation to damage of the
bog surface. GPR uses the transmission and reflection of radio waves (typically 25-1000
MHz) in soil, rock, water and sediment, including peat. The transmitter-receiver array is
moved along a survey profile and radar traces are collected at pre-set time or distance
intervals to produce a time-distance cross-section or radargram (Figure 6.6).
(a)
(b)
(c)
(d)
Figure 4.5: GPR analysis using (a, b) a rugged, high-performance single channel GPR data acquisition system GSSI-SIR 3000 with a 200 MHz antenna, Kinlough, County Leitrim 28th January 2012 and (c, d) a MALÅ Geoscience system with a 50 MHz, 5 metre long cable, Ballynahone Bog, County Londonderry 5th November 2012 .
Tellus Border Soil Carbon Project
27
4.3.3 Resistivity
An electrical tomography resistivity (ERT) profile was carried out along a section of the test
line at Kinlough, County Leitrim and Sliabh Beagh, Counties Fermanagh, Tyrone (NI) and
Monaghan (RoI). Data were collected using a Tigre resistivity system with multi-core cables.
All contact resistivities were checked prior to the collection of survey measurements, any high
contact resistivities (> 2000 ohm-m) were treated with the application of a saline solution to
the base of the electrode and rechecked. Data were collected to 20 levels resulting in a
maximum depth of penetration in the centre of the profile of approximately 50m bgl.
Measured data were inverted using the Res2Dinv processing software with apparent
resistivities displayed with depth against distance. The profiles used 64-electrodes with a 5 m
spacing set-up, employing a Wenner array.
4.3.4 Magnetometry
An ENVI MAG system was used which is a portable total field magnetometer operated in
traditional stop-and-go mode. Table 4.3 Details the specifications of the system. Sensor proton precision Total field range 20,000 to 100,000 nT Total field absolute accuracy ±1nT Sensitivity 0.1nT at 2second reading time Tuning fully solid state, manual or automatic; keyboard selectable Reading period 0.5, 1 and 2 seconds selectable Display 8 lines by 40 characters, 64x240dots LCD Super-twist display
Keyboard:17keys, note entry, 32characters
Clock Real time clock with date and time, 1second resolution and ±1second stability over 12hours.
Table 4.3: Specifications of the ENVI MAG system
4.3.4.1 Field procedure
A base station was selected at relatively stable magnetic reading after checking for 5 reading
at a place which could be reoccupied at the end of the survey. Magnetic readings were
performed at predefined observation points (based on airborne radiometric data locations).
The base station was reoccupied halfway through the line and at the end of the survey. Based
on the base station reading, magnetic readings were corrected for diurnal variation.
International Geomagnetic Reference Field (IGRF) was calculated for the survey date based
on the 2010 model. The difference between the corrected reading and IGRF gives residual
magnetic field within the rock along the survey line. This residual magnetic anomaly was
plotted as profile and gridded to observe magnetic variations.
Tellus Border Soil Carbon Project
28
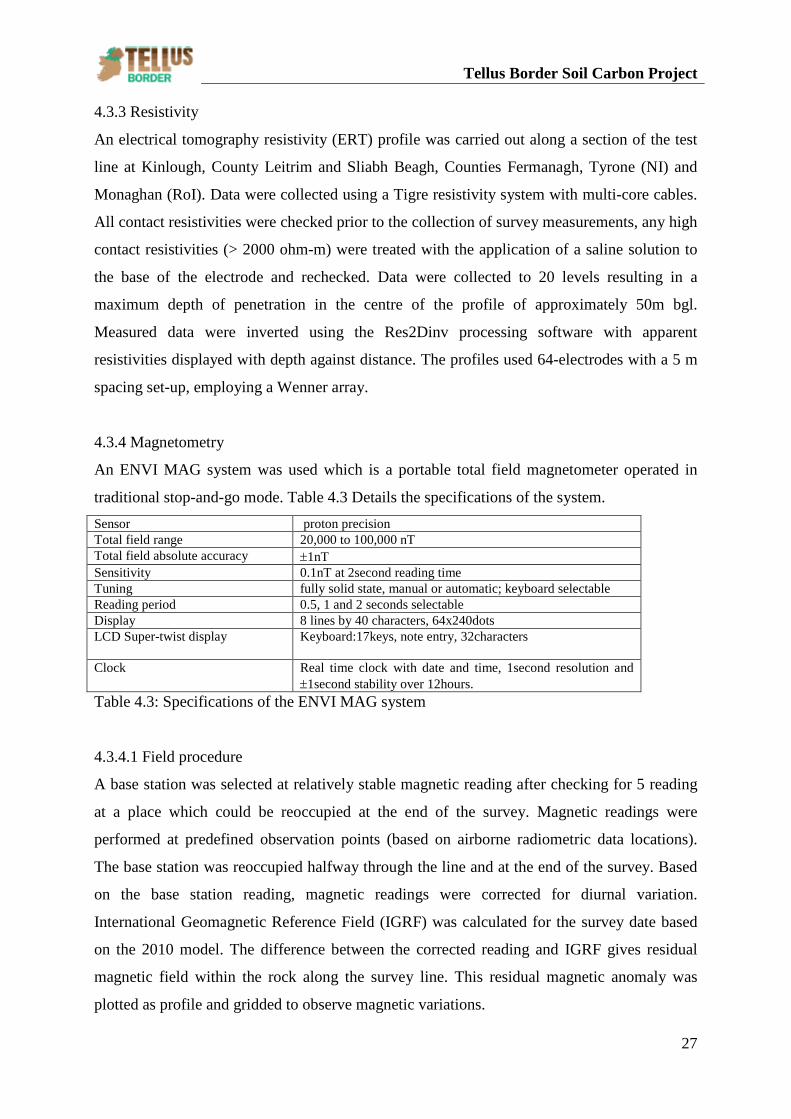
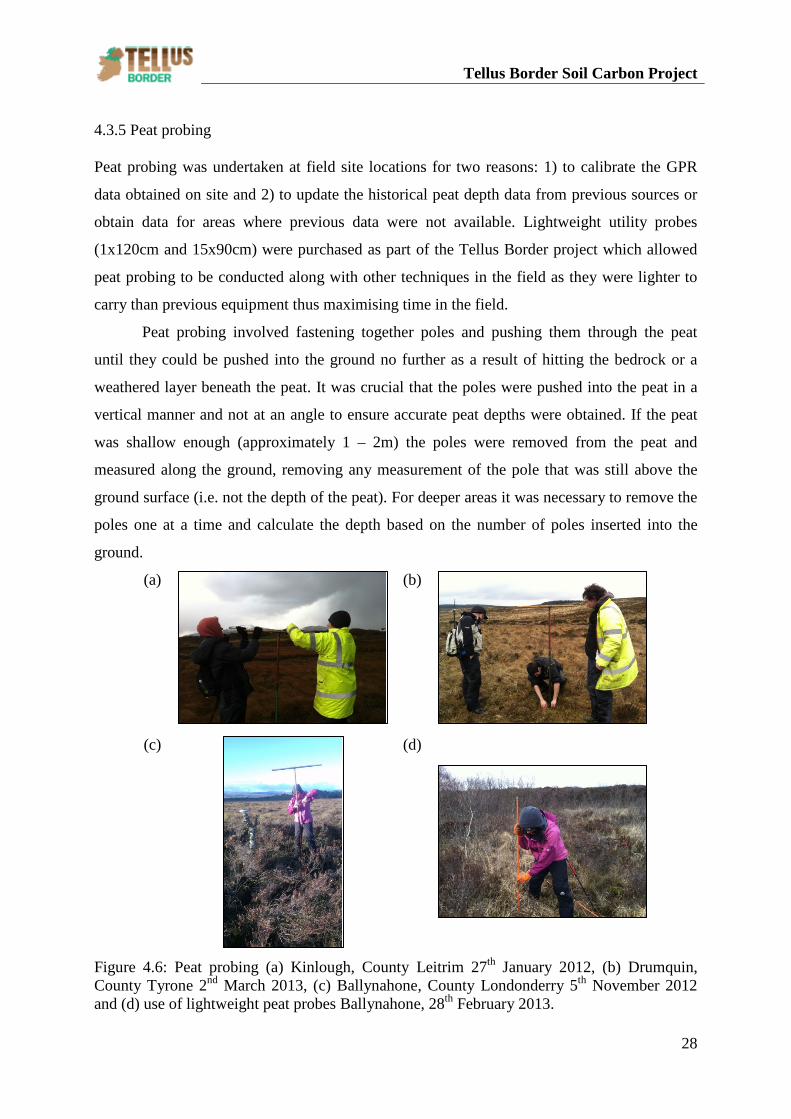
4.3.5 Peat probing Peat probing was undertaken at field site locations for two reasons: 1) to calibrate the GPR
data obtained on site and 2) to update the historical peat depth data from previous sources or
obtain data for areas where previous data were not available. Lightweight utility probes
(1x120cm and 15x90cm) were purchased as part of the Tellus Border project which allowed
peat probing to be conducted along with other techniques in the field as they were lighter to
carry than previous equipment thus maximising time in the field.
Peat probing involved fastening together poles and pushing them through the peat
until they could be pushed into the ground no further as a result of hitting the bedrock or a
weathered layer beneath the peat. It was crucial that the poles were pushed into the peat in a
vertical manner and not at an angle to ensure accurate peat depths were obtained. If the peat
was shallow enough (approximately 1 – 2m) the poles were removed from the peat and
measured along the ground, removing any measurement of the pole that was still above the
ground surface (i.e. not the depth of the peat). For deeper areas it was necessary to remove the
poles one at a time and calculate the depth based on the number of poles inserted into the
ground.
(a)
(b)
(c)
(d)
Figure 4.6: Peat probing (a) Kinlough, County Leitrim 27th January 2012, (b) Drumquin, County Tyrone 2nd March 2013, (c) Ballynahone, County Londonderry 5th November 2012 and (d) use of lightweight peat probes Ballynahone, 28th February 2013.
Tellus Border Soil Carbon Project
29
4.4 Soil measurements
4.4.1 Soil geochemistry
Soil samples were obtained for geochemical analysis from test line 2 location, Sliabh Beagh,
Counties Fermanagh, Tyrone (NI) and Monaghan (RoI). Eighteen samples were taken along
the test line and analysed using the same sampling procedures and analytical techniques used
for the Tellus Border project. The sampling methodologies were based on those developed by
the British Geological Survey G-BASE programme (Johnson, 2005a: 12-4; Tellus Border,
2013). Each sample location along the flight line was selected based on observed changes in
the mapped airborne geophysical data. Each sample comprised material from auger samples
taken from five holes distributed within an area of 20m x 20m (Figure 4.4). The centre of the
square was taken as the ground sample location of the airborne data along the flight line. The
four additional holes were the taken at 10m diagonals from this central location. An initial
sample was taken at each sample location to clean the auger prior to obtaining a sample.
Samples were obtained from two depths at each location. Sample A was collected to a depth
of 20cm, after removal of surface vegetation and surface litter and root zone (Johnson, 2005b:
12-1). Sample S was obtained from a depth of 50 cm.
4.4.2 Soil moisture
Soil moisture samples were obtained at the two test line location sites. Five samples were
obtained at Kinlough, County Leitrim. Forty samples were obtained at the Sliabh Beagh,
Counties Fermanagh, Tyrone (NI) and Monaghan (RoI). The methodology for the two
sampling regimes differed as the Russian Auger obtained for soil moisture and bulk density
analysis had not been purchased at the time of the Kinlough field visit.
Location Number of samples Date Method Kinlough, County Leitrim (RoI)
5 7th March 2012 Corer ring
Sliabh Beagh, Counties Fermanagh, Tyrone (NI) and Monaghan (RoI)
40 Russian Auger obtained for soil moisture and bulk density analysis
Table 4.4: Details of sampling techniques along the two test lines
4.4.2.1 Sampling using corer ring
Samples obtained at test line 1, Kinlough, County Leitrim were obtained using 2 inch
diameter ring. Five individual samples were taken with the corer ring. The ring was driven
Tellus Border Soil Carbon Project
30
into the top surface layer of the ground to a depth of 0.05m. The ring was hammered into the
ground until it was completely flush with the land surface. It was dug out of the ground using
a trowel and the top and bottom of the ring flattened off with a knife. The sample was labelled
accordingly and placed into a sample bag. These samples were placed in an oven at 105 ºC for
24 hours and weighed until a constant weight was reached to ensure that all the moisture had
been removed from the sample.
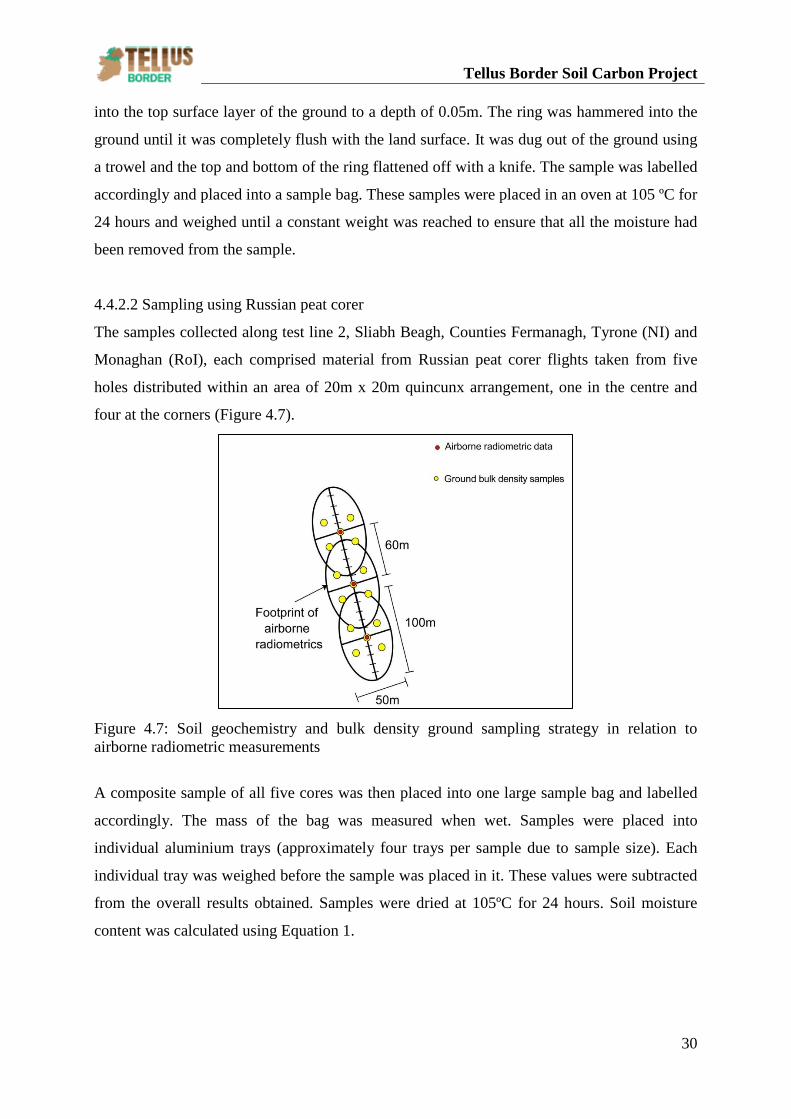
4.4.2.2 Sampling using Russian peat corer
The samples collected along test line 2, Sliabh Beagh, Counties Fermanagh, Tyrone (NI) and
Monaghan (RoI), each comprised material from Russian peat corer flights taken from five
holes distributed within an area of 20m x 20m quincunx arrangement, one in the centre and
four at the corners (Figure 4.7).
Figure 4.7: Soil geochemistry and bulk density ground sampling strategy in relation to airborne radiometric measurements
A composite sample of all five cores was then placed into one large sample bag and labelled
accordingly. The mass of the bag was measured when wet. Samples were placed into
individual aluminium trays (approximately four trays per sample due to sample size). Each
individual tray was weighed before the sample was placed in it. These values were subtracted
from the overall results obtained. Samples were dried at 105ºC for 24 hours. Soil moisture
content was calculated using Equation 1.
Tellus Border Soil Carbon Project
31
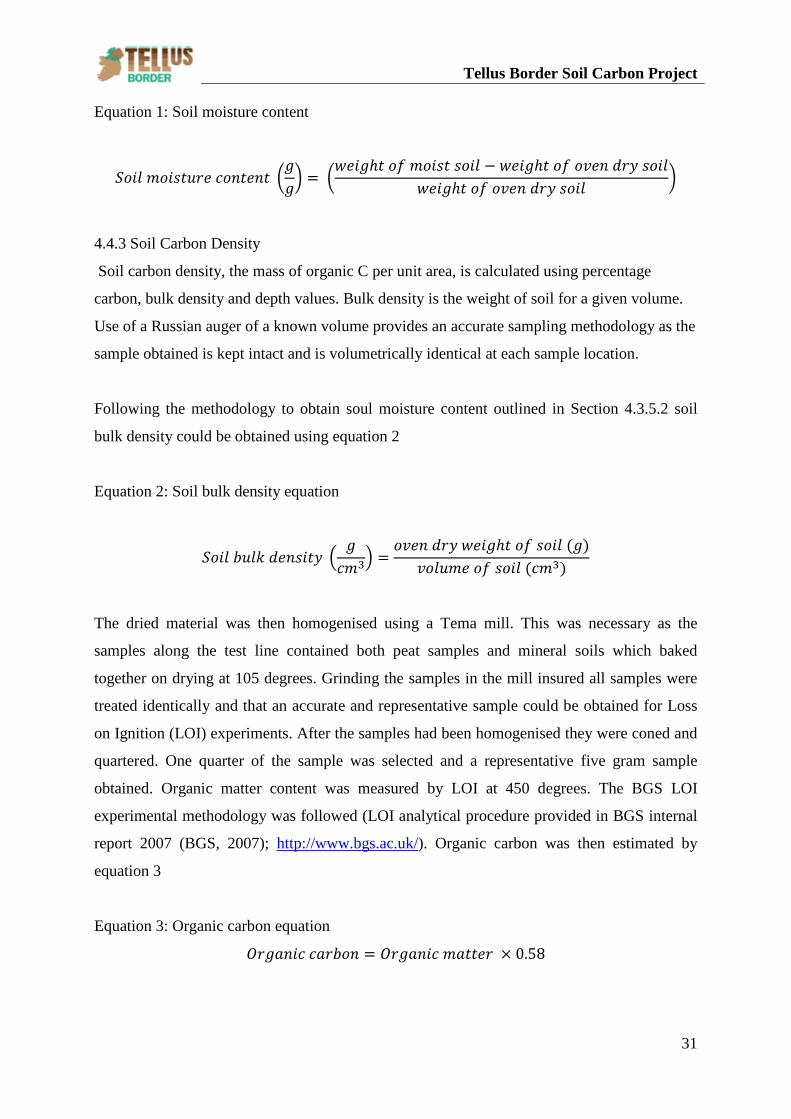
Equation 1: Soil moisture content
𝑆𝑜𝑖𝑙 𝑚𝑜𝑖𝑠𝑡𝑢𝑟𝑒 𝑐𝑜𝑛𝑡𝑒𝑛𝑡 �𝑔𝑔� = �
𝑤𝑒𝑖𝑔ℎ𝑡 𝑜𝑓 𝑚𝑜𝑖𝑠𝑡 𝑠𝑜𝑖𝑙 − 𝑤𝑒𝑖𝑔ℎ𝑡 𝑜𝑓 𝑜𝑣𝑒𝑛 𝑑𝑟𝑦 𝑠𝑜𝑖𝑙𝑤𝑒𝑖𝑔ℎ𝑡 𝑜𝑓 𝑜𝑣𝑒𝑛 𝑑𝑟𝑦 𝑠𝑜𝑖𝑙
�
4.4.3 Soil Carbon Density
Soil carbon density, the mass of organic C per unit area, is calculated using percentage
carbon, bulk density and depth values. Bulk density is the weight of soil for a given volume.
Use of a Russian auger of a known volume provides an accurate sampling methodology as the
sample obtained is kept intact and is volumetrically identical at each sample location.
Following the methodology to obtain soul moisture content outlined in Section 4.3.5.2 soil
bulk density could be obtained using equation 2
Equation 2: Soil bulk density equation
𝑆𝑜𝑖𝑙 𝑏𝑢𝑙𝑘 𝑑𝑒𝑛𝑠𝑖𝑡𝑦 �𝑔𝑐𝑚3� =
𝑜𝑣𝑒𝑛 𝑑𝑟𝑦 𝑤𝑒𝑖𝑔ℎ𝑡 𝑜𝑓 𝑠𝑜𝑖𝑙 (𝑔)𝑣𝑜𝑙𝑢𝑚𝑒 𝑜𝑓 𝑠𝑜𝑖𝑙 (𝑐𝑚3)
The dried material was then homogenised using a Tema mill. This was necessary as the
samples along the test line contained both peat samples and mineral soils which baked
together on drying at 105 degrees. Grinding the samples in the mill insured all samples were
treated identically and that an accurate and representative sample could be obtained for Loss
on Ignition (LOI) experiments. After the samples had been homogenised they were coned and
quartered. One quarter of the sample was selected and a representative five gram sample
obtained. Organic matter content was measured by LOI at 450 degrees. The BGS LOI
experimental methodology was followed (LOI analytical procedure provided in BGS internal
report 2007 (BGS, 2007); http://www.bgs.ac.uk/). Organic carbon was then estimated by
equation 3
Equation 3: Organic carbon equation
𝑂𝑟𝑔𝑎𝑛𝑖𝑐 𝑐𝑎𝑟𝑏𝑜𝑛 = 𝑂𝑟𝑔𝑎𝑛𝑖𝑐 𝑚𝑎𝑡𝑡𝑒𝑟 × 0.58
Tellus Border Soil Carbon Project
32
4.5 Carbon stock calculations
4.5.1 Volumetric carbon content measurement
Soil samples (Table 4.4; 40 samples) obtained along a 3.7 km transect of the test line at Sliabh
Beagh, County Monaghan, were used for volumetric carbon content assessment. The aim of
this sample collection was the development of a statistical model for volumetric carbon
content (VCC) to 0.5 metres based on radiometric data obtained from the airborne
geophysical survey. The fieldwork sampling methodology measured bulk density and soil
organic carbon to determine volumetric carbon content according to Equation 4.
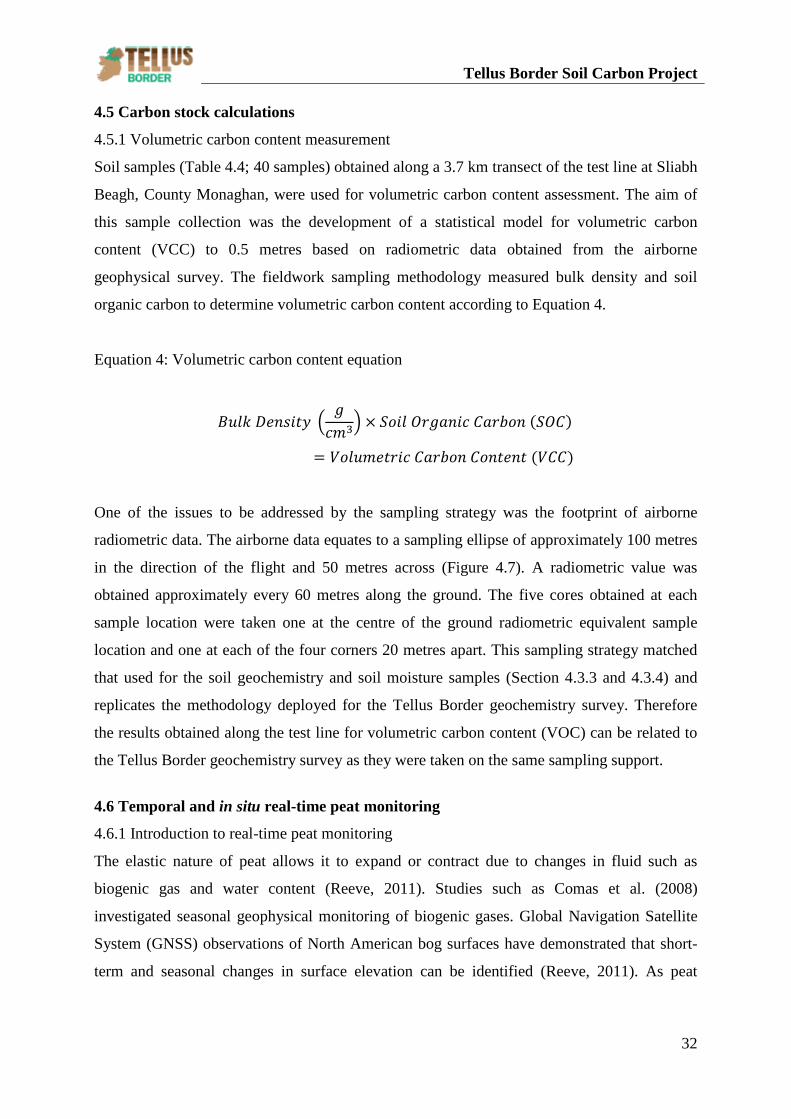
Equation 4: Volumetric carbon content equation
𝐵𝑢𝑙𝑘 𝐷𝑒𝑛𝑠𝑖𝑡𝑦 �𝑔𝑐𝑚3� × 𝑆𝑜𝑖𝑙 𝑂𝑟𝑔𝑎𝑛𝑖𝑐 𝐶𝑎𝑟𝑏𝑜𝑛 (𝑆𝑂𝐶)
= 𝑉𝑜𝑙𝑢𝑚𝑒𝑡𝑟𝑖𝑐 𝐶𝑎𝑟𝑏𝑜𝑛 𝐶𝑜𝑛𝑡𝑒𝑛𝑡 (𝑉𝐶𝐶)
One of the issues to be addressed by the sampling strategy was the footprint of airborne
radiometric data. The airborne data equates to a sampling ellipse of approximately 100 metres
in the direction of the flight and 50 metres across (Figure 4.7). A radiometric value was
obtained approximately every 60 metres along the ground. The five cores obtained at each
sample location were taken one at the centre of the ground radiometric equivalent sample
location and one at each of the four corners 20 metres apart. This sampling strategy matched
that used for the soil geochemistry and soil moisture samples (Section 4.3.3 and 4.3.4) and
replicates the methodology deployed for the Tellus Border geochemistry survey. Therefore
the results obtained along the test line for volumetric carbon content (VOC) can be related to
the Tellus Border geochemistry survey as they were taken on the same sampling support.
4.6 Temporal and in situ real-time peat monitoring
4.6.1 Introduction to real-time peat monitoring
The elastic nature of peat allows it to expand or contract due to changes in fluid such as
biogenic gas and water content (Reeve, 2011). Studies such as Comas et al. (2008)
investigated seasonal geophysical monitoring of biogenic gases. Global Navigation Satellite
System (GNSS) observations of North American bog surfaces have demonstrated that short-
term and seasonal changes in surface elevation can be identified (Reeve, 2011). As peat
Tellus Border Soil Carbon Project
33
deformation is continuous, if it is modelled, peat depth and carbon stocks can be measured
with greater accuracy.
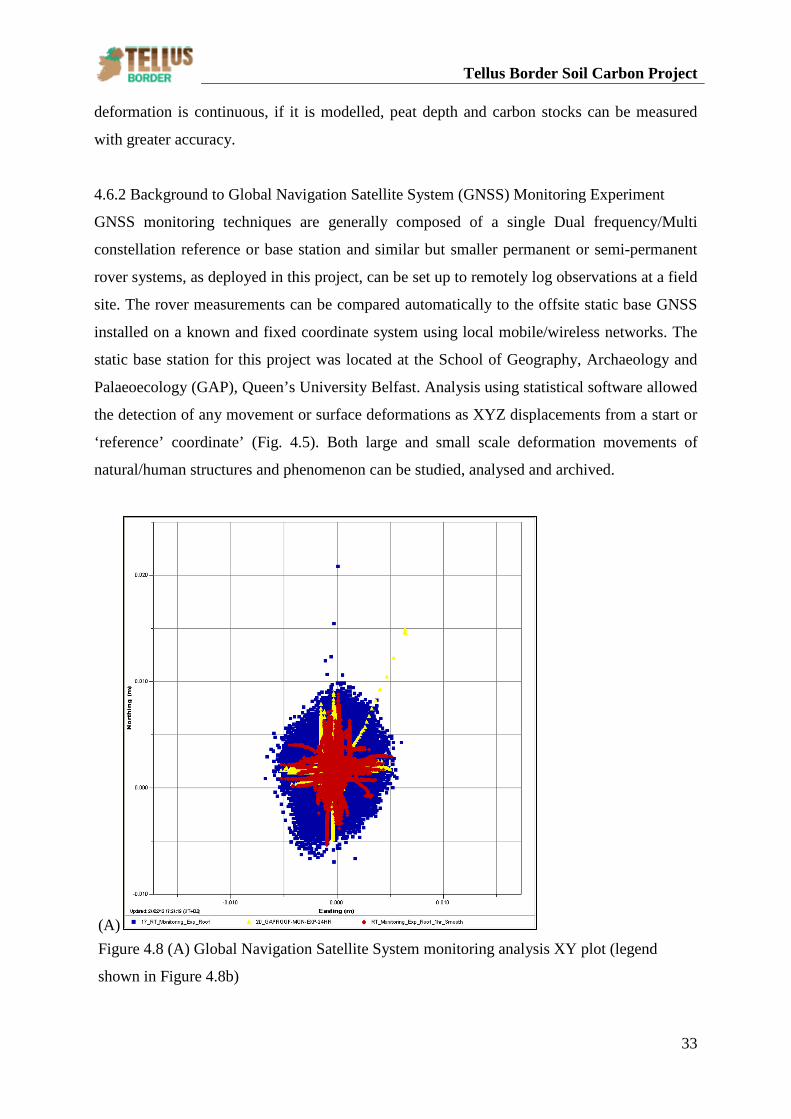
4.6.2 Background to Global Navigation Satellite System (GNSS) Monitoring Experiment
GNSS monitoring techniques are generally composed of a single Dual frequency/Multi
constellation reference or base station and similar but smaller permanent or semi-permanent
rover systems, as deployed in this project, can be set up to remotely log observations at a field
site. The rover measurements can be compared automatically to the offsite static base GNSS
installed on a known and fixed coordinate system using local mobile/wireless networks. The
static base station for this project was located at the School of Geography, Archaeology and
Palaeoecology (GAP), Queen’s University Belfast. Analysis using statistical software allowed
the detection of any movement or surface deformations as XYZ displacements from a start or
‘reference’ coordinate’ (Fig. 4.5). Both large and small scale deformation movements of
natural/human structures and phenomenon can be studied, analysed and archived.
(A) Figure 4.8 (A) Global Navigation Satellite System monitoring analysis XY plot (legend
shown in Figure 4.8b)
Tellus Border Soil Carbon Project
34
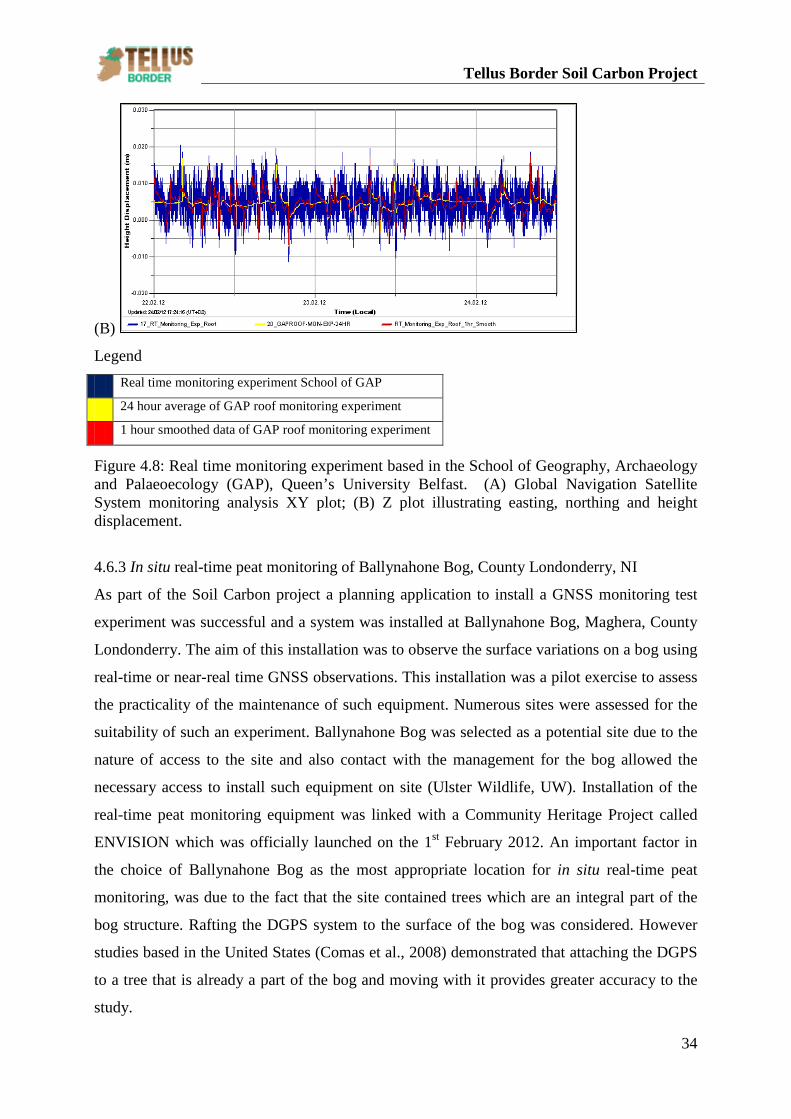
(B)
Legend
Figure 4.8: Real time monitoring experiment based in the School of Geography, Archaeology and Palaeoecology (GAP), Queen’s University Belfast. (A) Global Navigation Satellite System monitoring analysis XY plot; (B) Z plot illustrating easting, northing and height displacement.
4.6.3 In situ real-time peat monitoring of Ballynahone Bog, County Londonderry, NI
As part of the Soil Carbon project a planning application to install a GNSS monitoring test
experiment was successful and a system was installed at Ballynahone Bog, Maghera, County
Londonderry. The aim of this installation was to observe the surface variations on a bog using
real-time or near-real time GNSS observations. This installation was a pilot exercise to assess
the practicality of the maintenance of such equipment. Numerous sites were assessed for the
suitability of such an experiment. Ballynahone Bog was selected as a potential site due to the
nature of access to the site and also contact with the management for the bog allowed the
necessary access to install such equipment on site (Ulster Wildlife, UW). Installation of the
real-time peat monitoring equipment was linked with a Community Heritage Project called
ENVISION which was officially launched on the 1st February 2012. An important factor in
the choice of Ballynahone Bog as the most appropriate location for in situ real-time peat
monitoring, was due to the fact that the site contained trees which are an integral part of the
bog structure. Rafting the DGPS system to the surface of the bog was considered. However
studies based in the United States (Comas et al., 2008) demonstrated that attaching the DGPS
to a tree that is already a part of the bog and moving with it provides greater accuracy to the
study.
Real time monitoring experiment School of GAP
24 hour average of GAP roof monitoring experiment
1 hour smoothed data of GAP roof monitoring experiment
Tellus Border Soil Carbon Project
35
4.6.4 Partnership with Ballynahone Management Committee
Discussion with Ballynahone Management Committee highlighted a number of difficulties
associated with monitoring conditions on the peat bog. Bog environments are delicate systems
where single footprints can remain for years after the person has left the bog (Tomlinson, R
pers. comm., 21st March 2013). Ballynahone Bog has experienced numerous previous
monitoring experiments including the use of walrags (WAter Level Range GaugeS)
installation and vegetation monitoring. Walrags were used to monitor water levels within the
peat in order to assess the degree of hydrological recovery of the peat (LIFE – Nature and
Coilite 2007) and required an analyst to visit the site and manually collect data. This provided
one reading which can be used as a proxy for the condition of the bog at the time it was
collected. As part of the Tellus Border Soil Carbon project digital piezometers were installed
on site. These piezometers record subsurface water level data every 5 minutes and can store
data for approximately twelve months before requiring download. In addition, event-led
rainfall gauges were installed on site, obtaining time stamped data after a 0.2mm rainfall
event, allowing accurate and continuous data to be obtained on site to assist in the
interpretation of the real-time DGPS.
The real-time peat monitoring installation observed surface deformation at the site
potentially linked to changes in hydrology and weather responses. Working with Ballynahone
Management Committee highlighted issues related to drainage on the bog. The in situ real-
time peat monitoring equipment was installed in conjunction with necessary remedial drain
works on Ballynahone Bog from the 27th February 2012 to the 9th March 2012. This meant
that data obtained from the DGPS provided a base line for the condition of the bog and
subsequent water retention capacity via rainfall gauges, piezometers and the DGPS data.
Working with Ballynahone Management Committee, monitoring the deformation of the bog
over the period of the project enabled real time feedback on the effect of on-going
management practices. This enabled the effect of the remedial drain work to be identified.
4.6.5 Real-time Monitoring equipment
The equipment comprised a battery, communications unit, GPS antenna, GPS receiver and
solar and wind renewable energy sources. This allowed monitoring the day-to-day movement
and fluctuations on the bog. Data collected were sent back in real-time to Queen’s University
Belfast, School of Geography, Archaeology and Palaeoecology using mobile/General Packet
Radio Service (GPRS). GPRS is a mobile data service on 2G and 3G networks. This meant
Tellus Border Soil Carbon Project
36
that it was not necessary to visit the site to collect data from a data logger. When selecting an
appropriate field site for DGPS analysis it was necessary to consider the SmartNet station
coverage. SmartNet is “enabled by the network of Ordnance Survey base stations to create a
high density, high redundancy network which is able to deliver corrections at the centimetre
level in RTK mode or sub-metre DGPS and with raw data for post processing” (Leica, 2013).
Coverage from at least two network stations is preferable in case one station loses signal.
A small GNSS antenna was mounted on a tree within the bog. This experiment was
designed to be non-invasive and did not require coring or cutting of the bog surface. As the
root structure is supported by the matrix of the bog this serves as a direct proxy for bog
movement. The location of the tree was also ideal for the placement of the DGPS as it is
situated within the bog dome, one of the most intact areas of the bog at Ballynahone. The
experiment was designed to be autonomous for up to a month before the battery system
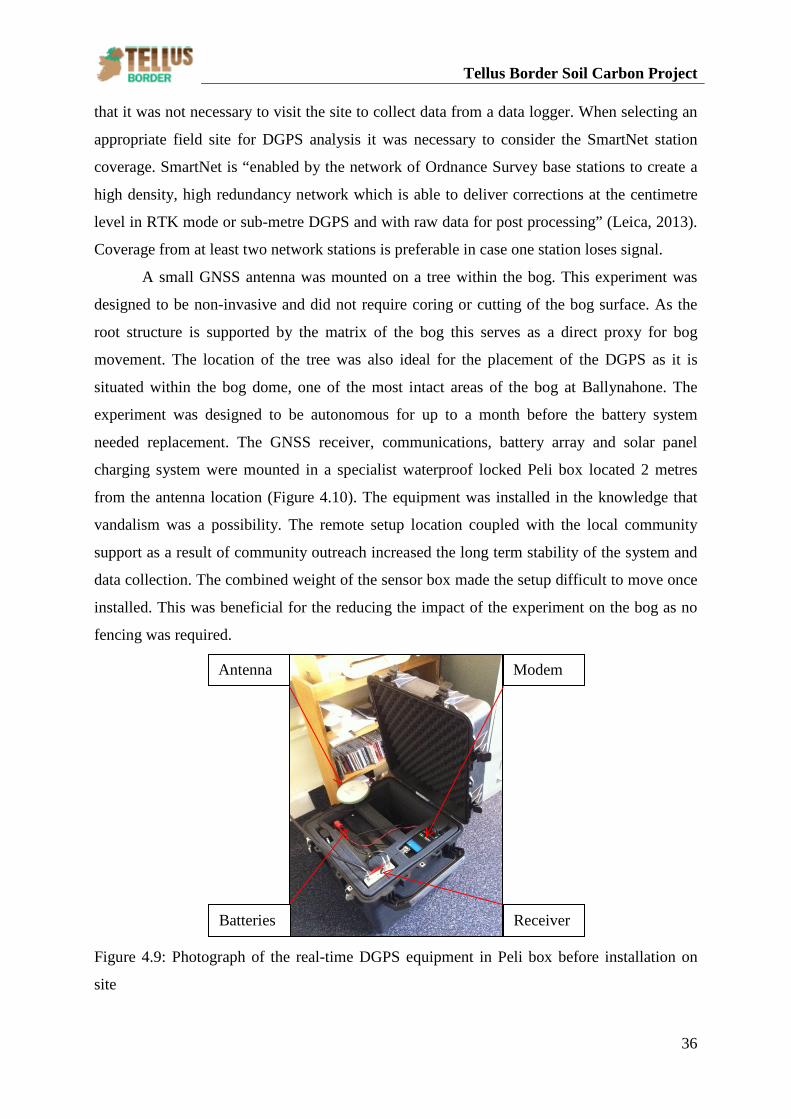
needed replacement. The GNSS receiver, communications, battery array and solar panel
charging system were mounted in a specialist waterproof locked Peli box located 2 metres
from the antenna location (Figure 4.10). The equipment was installed in the knowledge that
vandalism was a possibility. The remote setup location coupled with the local community
support as a result of community outreach increased the long term stability of the system and
data collection. The combined weight of the sensor box made the setup difficult to move once
installed. This was beneficial for the reducing the impact of the experiment on the bog as no
fencing was required.
Figure 4.9: Photograph of the real-time DGPS equipment in Peli box before installation on
site
Antenna
Batteries
Modem
Receiver
Tellus Border Soil Carbon Project
37
(a)
(b)
(c)
(d)
(e)
(f)
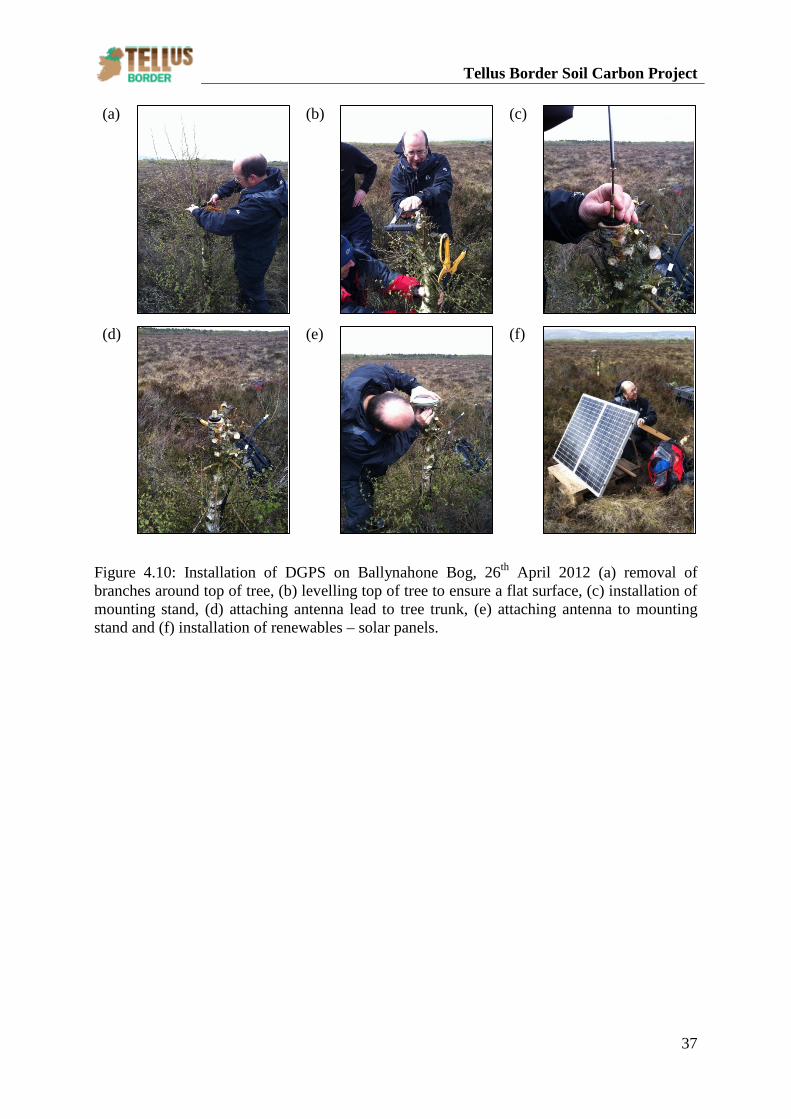
Figure 4.10: Installation of DGPS on Ballynahone Bog, 26th April 2012 (a) removal of branches around top of tree, (b) levelling top of tree to ensure a flat surface, (c) installation of mounting stand, (d) attaching antenna lead to tree trunk, (e) attaching antenna to mounting stand and (f) installation of renewables – solar panels.
Tellus Border Soil Carbon Project
38
(a)
(b)
(c)
(d)
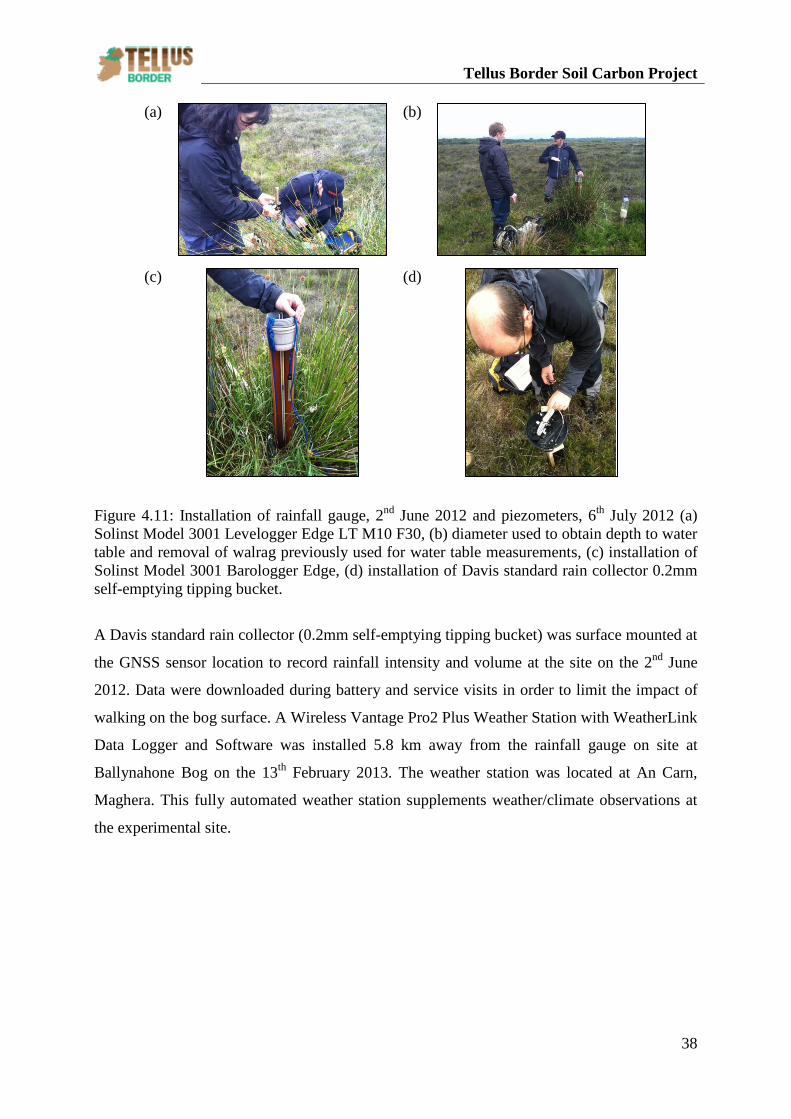
Figure 4.11: Installation of rainfall gauge, 2nd June 2012 and piezometers, 6th July 2012 (a) Solinst Model 3001 Levelogger Edge LT M10 F30, (b) diameter used to obtain depth to water table and removal of walrag previously used for water table measurements, (c) installation of Solinst Model 3001 Barologger Edge, (d) installation of Davis standard rain collector 0.2mm self-emptying tipping bucket.
A Davis standard rain collector (0.2mm self-emptying tipping bucket) was surface mounted at
the GNSS sensor location to record rainfall intensity and volume at the site on the 2nd June
2012. Data were downloaded during battery and service visits in order to limit the impact of
walking on the bog surface. A Wireless Vantage Pro2 Plus Weather Station with WeatherLink
Data Logger and Software was installed 5.8 km away from the rainfall gauge on site at
Ballynahone Bog on the 13th February 2013. The weather station was located at An Carn,
Maghera. This fully automated weather station supplements weather/climate observations at
the experimental site.
Tellus Border Soil Carbon Project
39
(a)
(b)
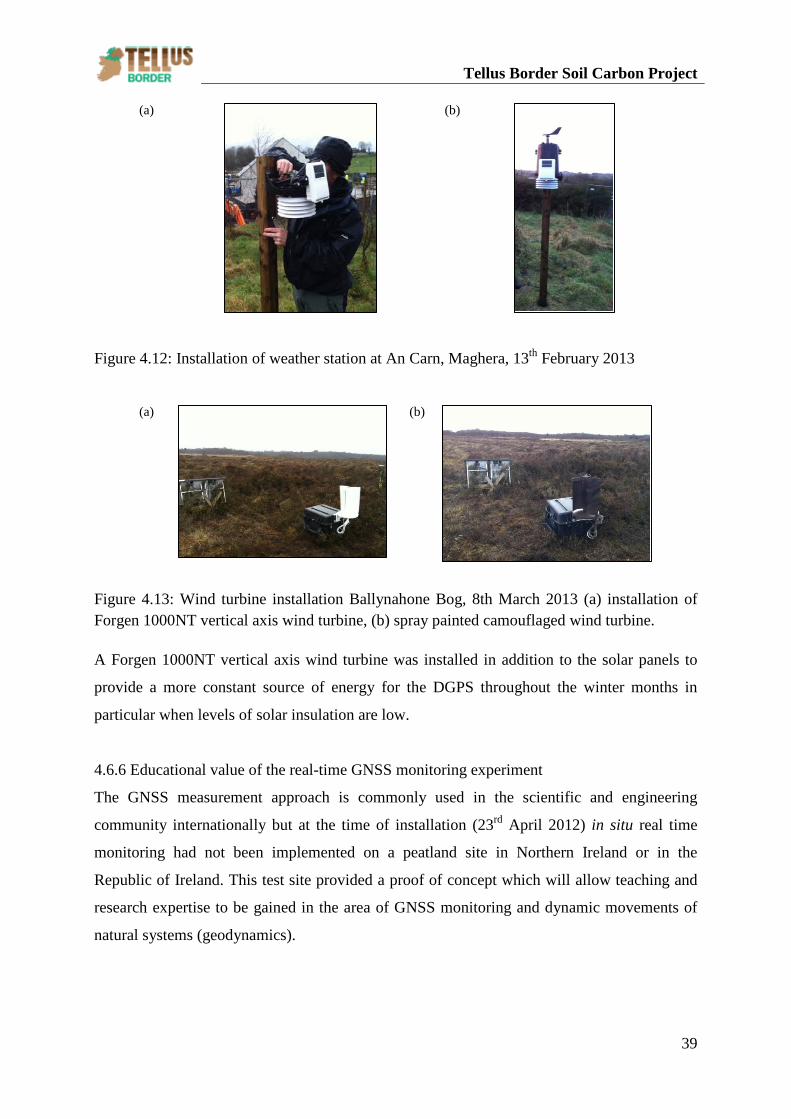
Figure 4.12: Installation of weather station at An Carn, Maghera, 13th February 2013
(a)
(b)
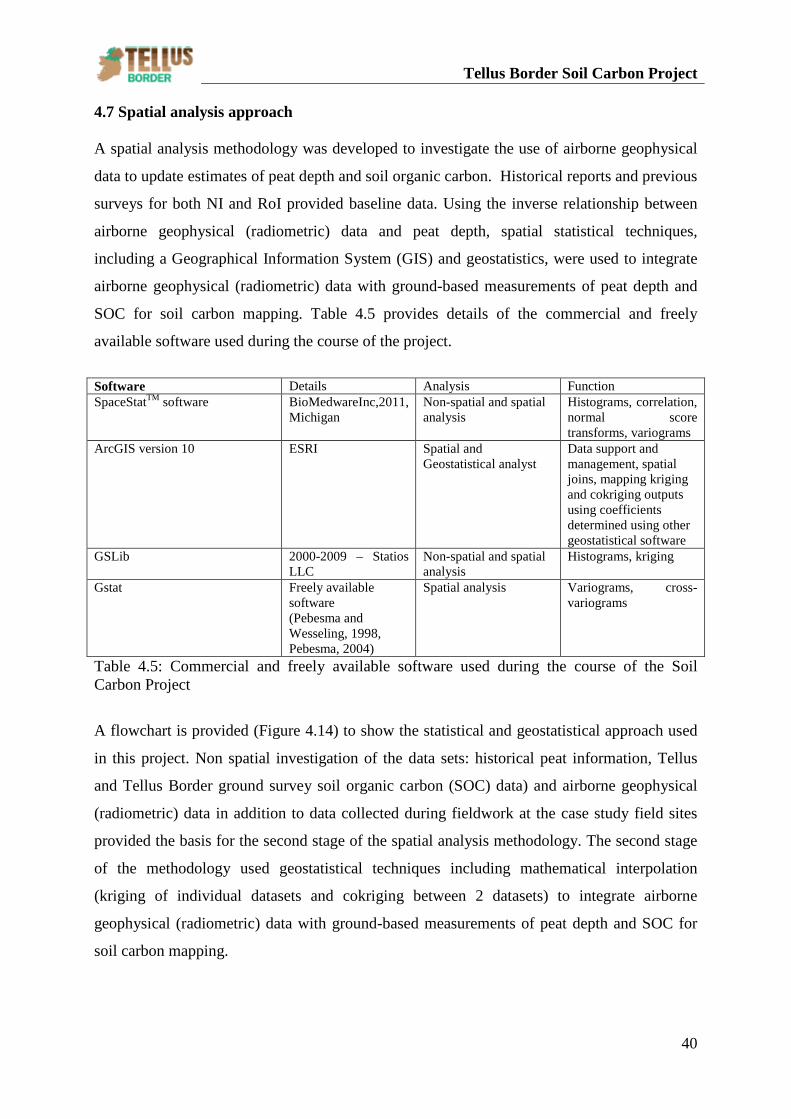
Figure 4.13: Wind turbine installation Ballynahone Bog, 8th March 2013 (a) installation of Forgen 1000NT vertical axis wind turbine, (b) spray painted camouflaged wind turbine. A Forgen 1000NT vertical axis wind turbine was installed in addition to the solar panels to
provide a more constant source of energy for the DGPS throughout the winter months in
particular when levels of solar insulation are low.
4.6.6 Educational value of the real-time GNSS monitoring experiment
The GNSS measurement approach is commonly used in the scientific and engineering
community internationally but at the time of installation (23rd April 2012) in situ real time
monitoring had not been implemented on a peatland site in Northern Ireland or in the
Republic of Ireland. This test site provided a proof of concept which will allow teaching and
research expertise to be gained in the area of GNSS monitoring and dynamic movements of
natural systems (geodynamics).
Tellus Border Soil Carbon Project
40
4.7 Spatial analysis approach
A spatial analysis methodology was developed to investigate the use of airborne geophysical
data to update estimates of peat depth and soil organic carbon. Historical reports and previous
surveys for both NI and RoI provided baseline data. Using the inverse relationship between
airborne geophysical (radiometric) data and peat depth, spatial statistical techniques,
including a Geographical Information System (GIS) and geostatistics, were used to integrate
airborne geophysical (radiometric) data with ground-based measurements of peat depth and
SOC for soil carbon mapping. Table 4.5 provides details of the commercial and freely
available software used during the course of the project.
Software Details Analysis Function SpaceStatTM software
BioMedwareInc,2011, Michigan
Non-spatial and spatial analysis
Histograms, correlation, normal score transforms, variograms
ArcGIS version 10 ESRI Spatial and Geostatistical analyst
Data support and management, spatial joins, mapping kriging and cokriging outputs using coefficients determined using other geostatistical software
GSLib 2000-2009 – Statios LLC
Non-spatial and spatial analysis
Histograms, kriging
Gstat Freely available software (Pebesma and Wesseling, 1998, Pebesma, 2004)
Spatial analysis Variograms, cross-variograms
Table 4.5: Commercial and freely available software used during the course of the Soil Carbon Project
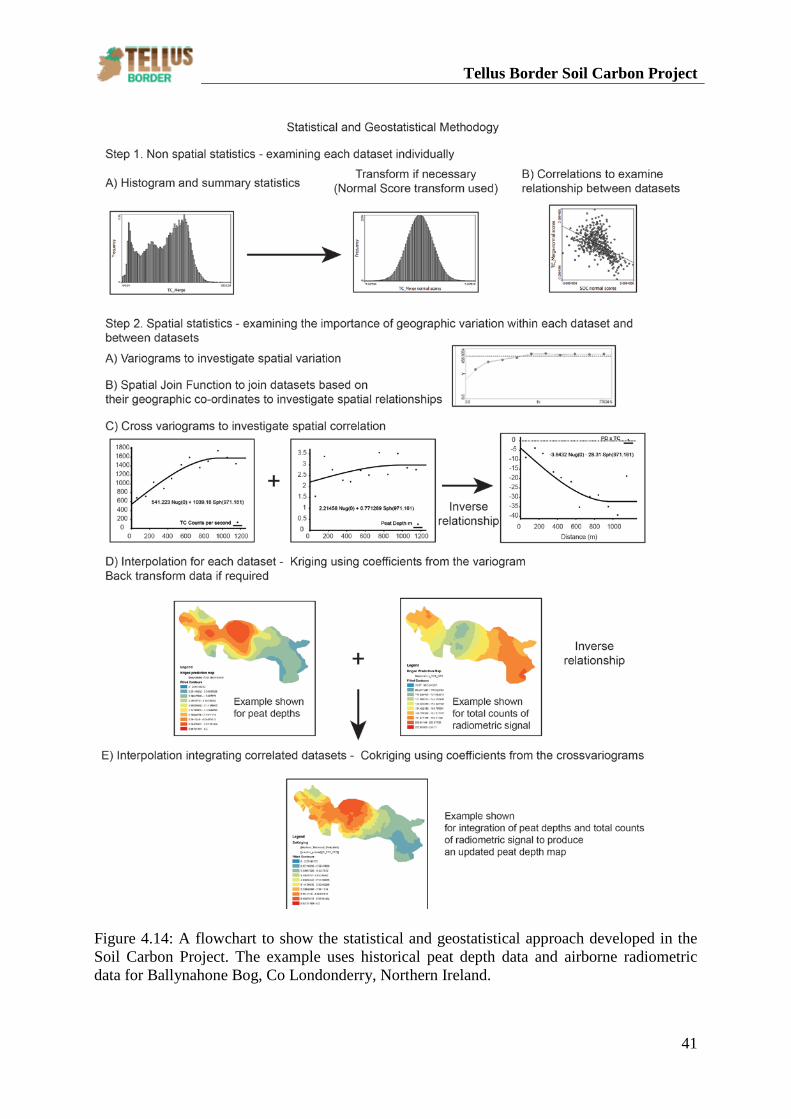
A flowchart is provided (Figure 4.14) to show the statistical and geostatistical approach used
in this project. Non spatial investigation of the data sets: historical peat information, Tellus
and Tellus Border ground survey soil organic carbon (SOC) data) and airborne geophysical
(radiometric) data in addition to data collected during fieldwork at the case study field sites
provided the basis for the second stage of the spatial analysis methodology. The second stage
of the methodology used geostatistical techniques including mathematical interpolation
(kriging of individual datasets and cokriging between 2 datasets) to integrate airborne
geophysical (radiometric) data with ground-based measurements of peat depth and SOC for
soil carbon mapping.
Tellus Border Soil Carbon Project
41
Figure 4.14: A flowchart to show the statistical and geostatistical approach developed in the Soil Carbon Project. The example uses historical peat depth data and airborne radiometric data for Ballynahone Bog, Co Londonderry, Northern Ireland.
Tellus Border Soil Carbon Project
42
5. Results from Test-line Approach
5.1 Test line Approach
Two test lines were selected to examine the relationship between airborne and ground
measured radiometric data. This involved visiting the two test line sites and monitoring
changes over different time periods. The test lines included areas which had varying
geological bedrock and land use including, forestry, arable and peat covered areas. As the
flight test lines crossed on and off peat covered areas the difference in radiometric signal from
the underlying land cover, soil and geology could be assessed.
5.1.1 Test line 1 Kinlough, County Leitrim
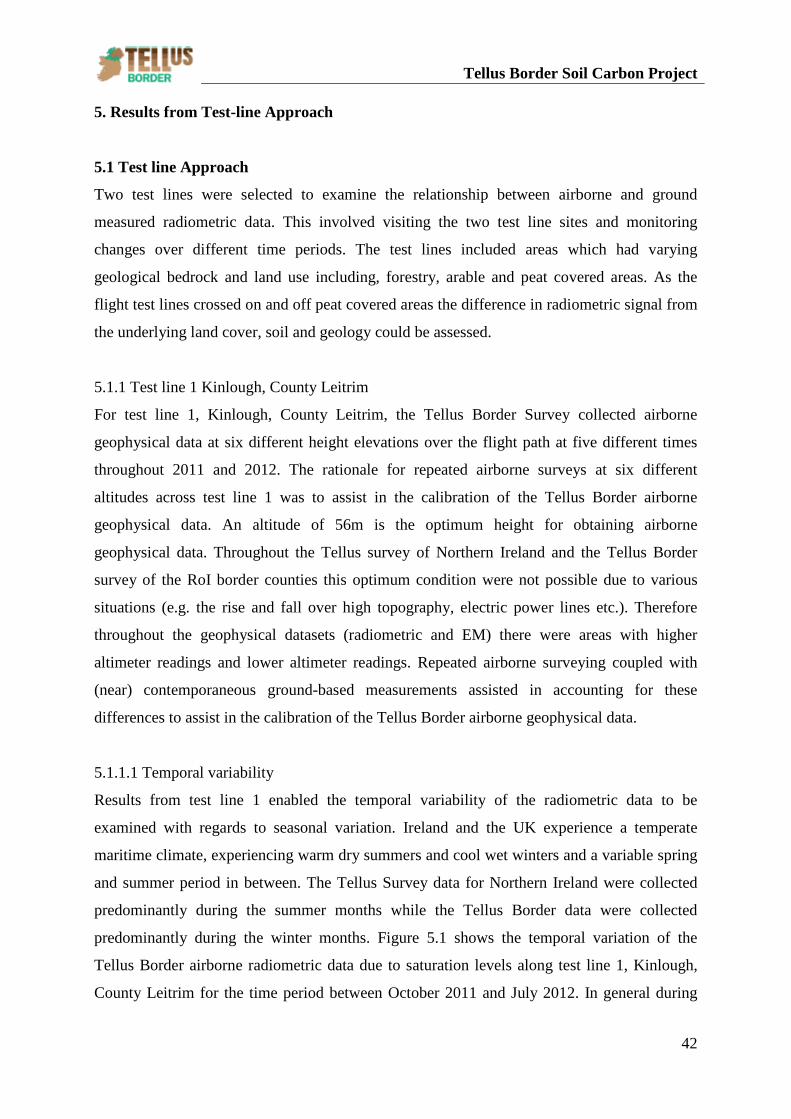
For test line 1, Kinlough, County Leitrim, the Tellus Border Survey collected airborne
geophysical data at six different height elevations over the flight path at five different times
throughout 2011 and 2012. The rationale for repeated airborne surveys at six different
altitudes across test line 1 was to assist in the calibration of the Tellus Border airborne
geophysical data. An altitude of 56m is the optimum height for obtaining airborne
geophysical data. Throughout the Tellus survey of Northern Ireland and the Tellus Border
survey of the RoI border counties this optimum condition were not possible due to various
situations (e.g. the rise and fall over high topography, electric power lines etc.). Therefore
throughout the geophysical datasets (radiometric and EM) there were areas with higher
altimeter readings and lower altimeter readings. Repeated airborne surveying coupled with
(near) contemporaneous ground-based measurements assisted in accounting for these
differences to assist in the calibration of the Tellus Border airborne geophysical data.
5.1.1.1 Temporal variability
Results from test line 1 enabled the temporal variability of the radiometric data to be
examined with regards to seasonal variation. Ireland and the UK experience a temperate
maritime climate, experiencing warm dry summers and cool wet winters and a variable spring
and summer period in between. The Tellus Survey data for Northern Ireland were collected
predominantly during the summer months while the Tellus Border data were collected
predominantly during the winter months. Figure 5.1 shows the temporal variation of the
Tellus Border airborne radiometric data due to saturation levels along test line 1, Kinlough,
County Leitrim for the time period between October 2011 and July 2012. In general during
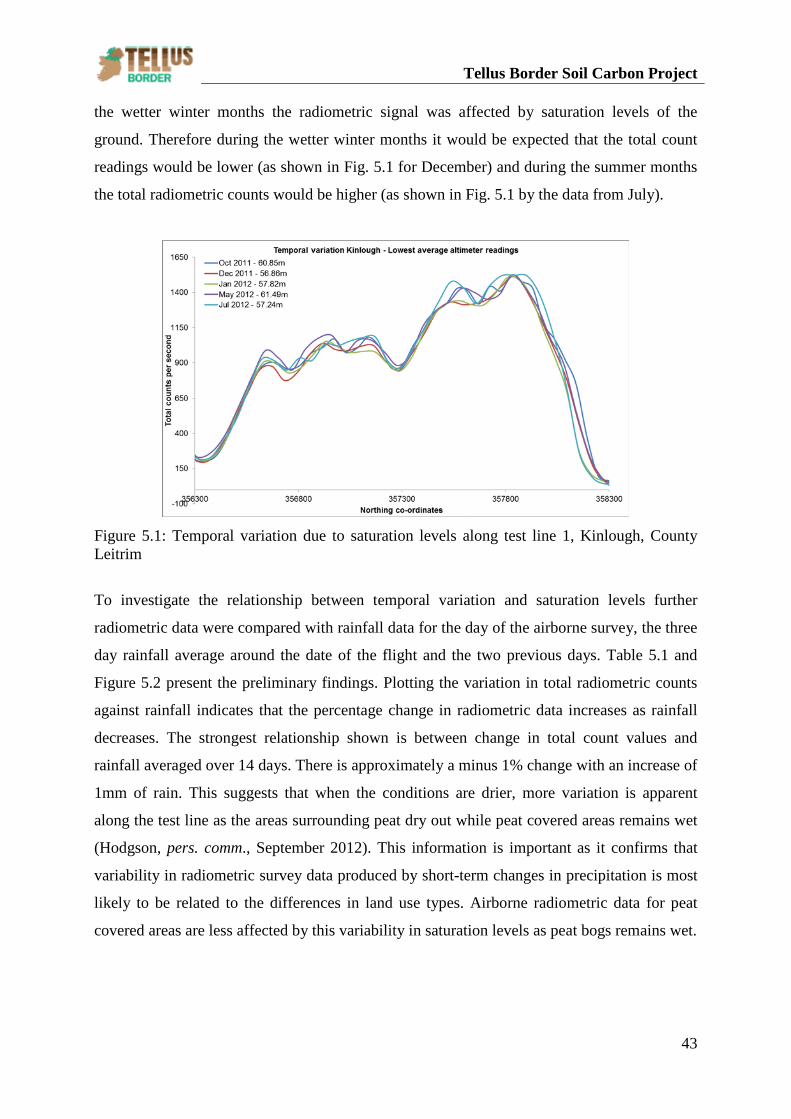
Tellus Border Soil Carbon Project
43
the wetter winter months the radiometric signal was affected by saturation levels of the
ground. Therefore during the wetter winter months it would be expected that the total count
readings would be lower (as shown in Fig. 5.1 for December) and during the summer months
the total radiometric counts would be higher (as shown in Fig. 5.1 by the data from July).
Figure 5.1: Temporal variation due to saturation levels along test line 1, Kinlough, County Leitrim
To investigate the relationship between temporal variation and saturation levels further
radiometric data were compared with rainfall data for the day of the airborne survey, the three
day rainfall average around the date of the flight and the two previous days. Table 5.1 and
Figure 5.2 present the preliminary findings. Plotting the variation in total radiometric counts
against rainfall indicates that the percentage change in radiometric data increases as rainfall
decreases. The strongest relationship shown is between change in total count values and
rainfall averaged over 14 days. There is approximately a minus 1% change with an increase of
1mm of rain. This suggests that when the conditions are drier, more variation is apparent
along the test line as the areas surrounding peat dry out while peat covered areas remains wet
(Hodgson, pers. comm., September 2012). This information is important as it confirms that
variability in radiometric survey data produced by short-term changes in precipitation is most
likely to be related to the differences in land use types. Airborne radiometric data for peat
covered areas are less affected by this variability in saturation levels as peat bogs remains wet.
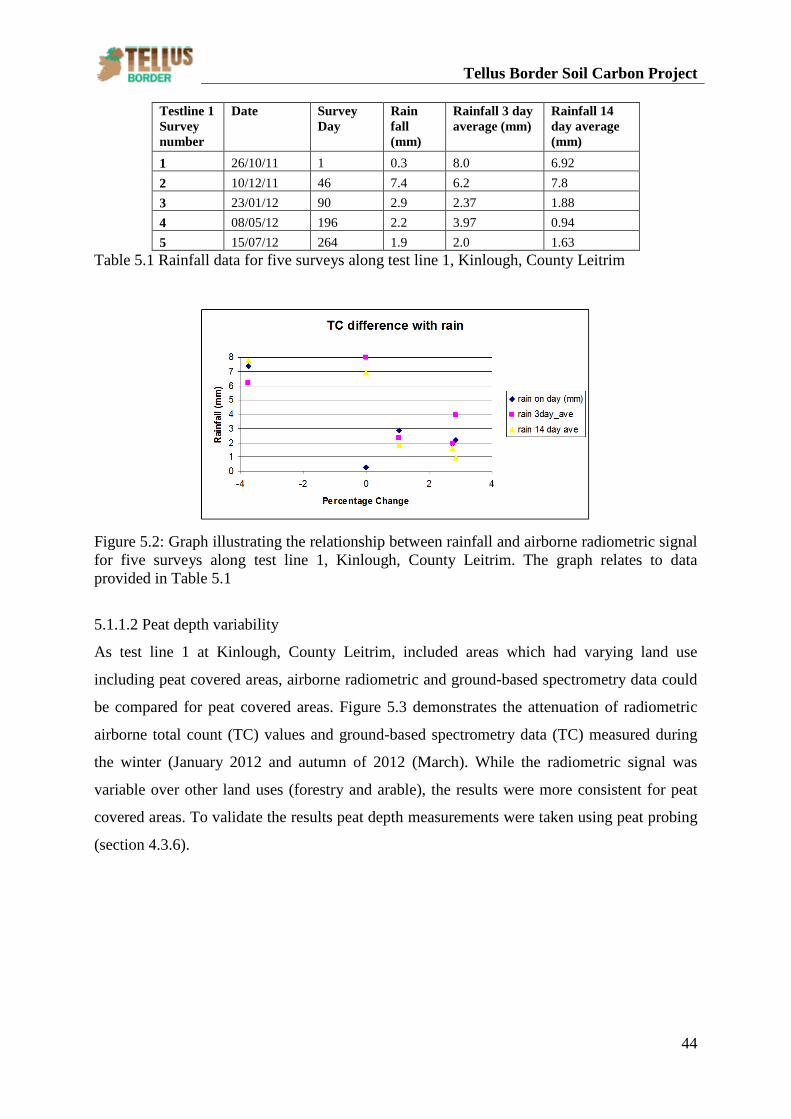
Tellus Border Soil Carbon Project
44
Testline 1 Survey number
Date Survey Day
Rain fall (mm)
Rainfall 3 day average (mm)
Rainfall 14 day average (mm)
1 26/10/11 1 0.3 8.0 6.92 2 10/12/11 46 7.4 6.2 7.8 3 23/01/12 90 2.9 2.37 1.88 4 08/05/12 196 2.2 3.97 0.94 5 15/07/12 264 1.9 2.0 1.63
Table 5.1 Rainfall data for five surveys along test line 1, Kinlough, County Leitrim
Figure 5.2: Graph illustrating the relationship between rainfall and airborne radiometric signal for five surveys along test line 1, Kinlough, County Leitrim. The graph relates to data provided in Table 5.1
5.1.1.2 Peat depth variability
As test line 1 at Kinlough, County Leitrim, included areas which had varying land use
including peat covered areas, airborne radiometric and ground-based spectrometry data could
be compared for peat covered areas. Figure 5.3 demonstrates the attenuation of radiometric
airborne total count (TC) values and ground-based spectrometry data (TC) measured during
the winter (January 2012 and autumn of 2012 (March). While the radiometric signal was
variable over other land uses (forestry and arable), the results were more consistent for peat
covered areas. To validate the results peat depth measurements were taken using peat probing
(section 4.3.6).
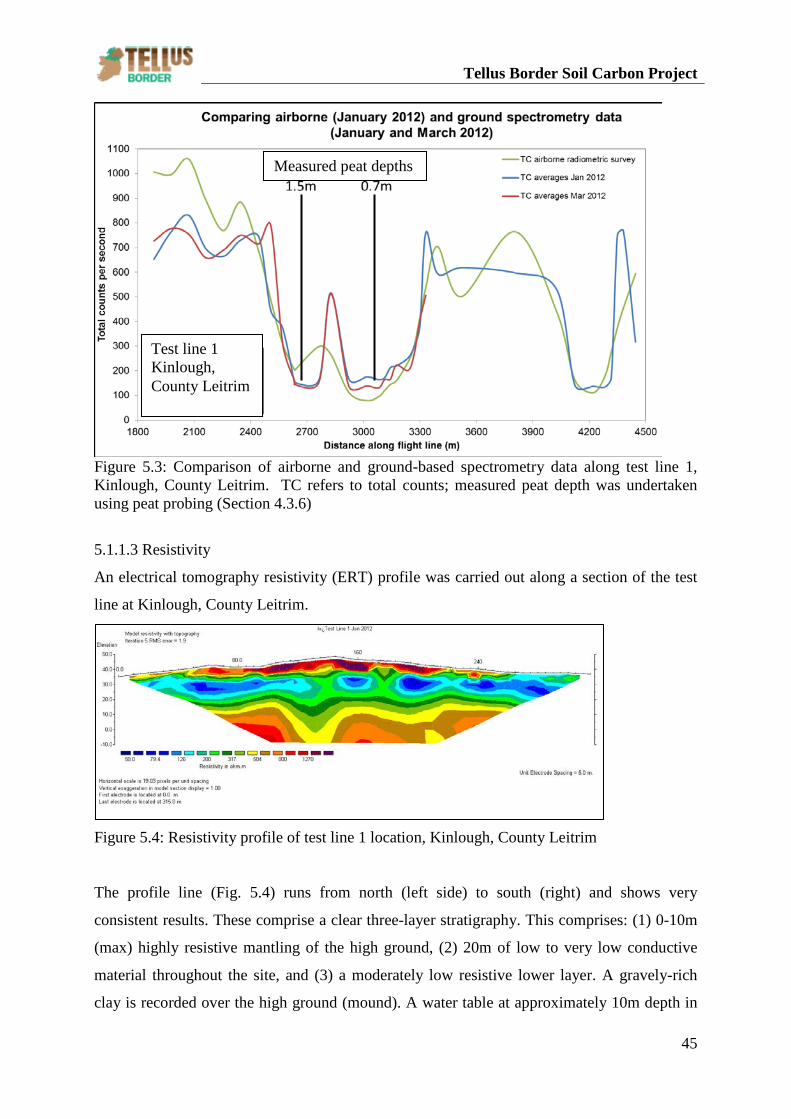
Tellus Border Soil Carbon Project
45
Figure 5.3: Comparison of airborne and ground-based spectrometry data along test line 1, Kinlough, County Leitrim. TC refers to total counts; measured peat depth was undertaken using peat probing (Section 4.3.6)
5.1.1.3 Resistivity
An electrical tomography resistivity (ERT) profile was carried out along a section of the test
line at Kinlough, County Leitrim.
Figure 5.4: Resistivity profile of test line 1 location, Kinlough, County Leitrim
The profile line (Fig. 5.4) runs from north (left side) to south (right) and shows very
consistent results. These comprise a clear three-layer stratigraphy. This comprises: (1) 0-10m
(max) highly resistive mantling of the high ground, (2) 20m of low to very low conductive
material throughout the site, and (3) a moderately low resistive lower layer. A gravely-rich
clay is recorded over the high ground (mound). A water table at approximately 10m depth in
Test line 1 Kinlough, County Leitrim
Measured peat depths
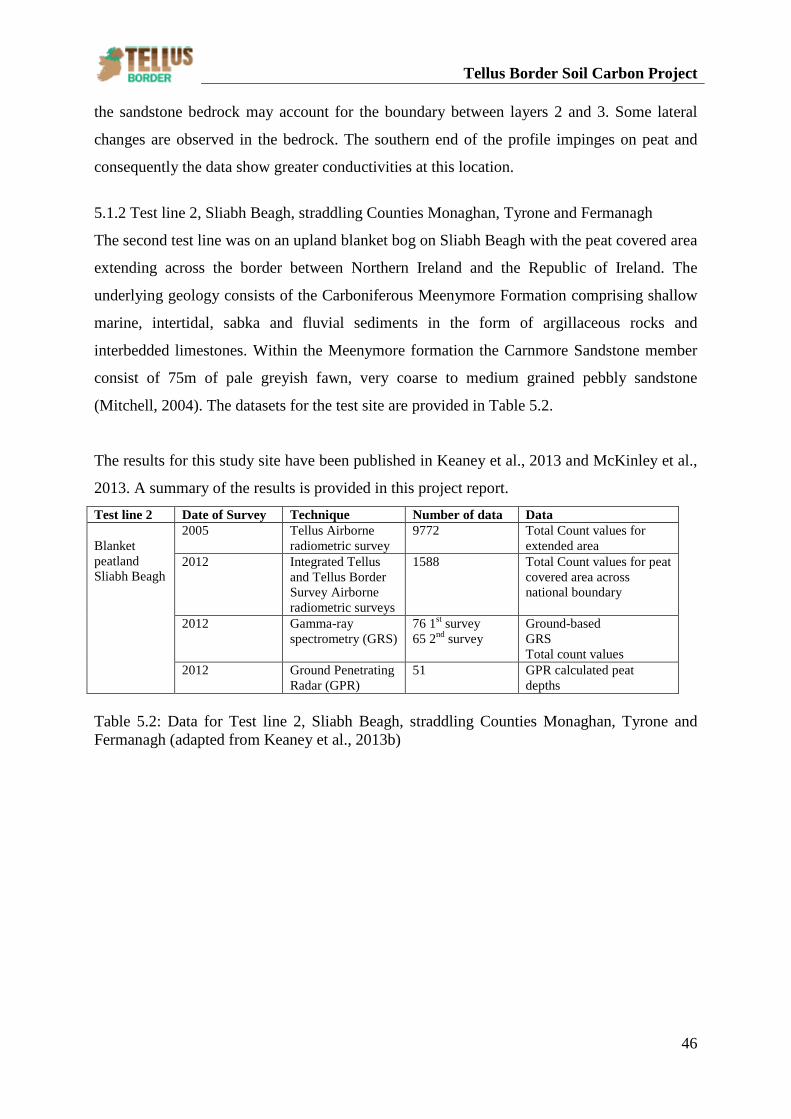
Tellus Border Soil Carbon Project
46
the sandstone bedrock may account for the boundary between layers 2 and 3. Some lateral
changes are observed in the bedrock. The southern end of the profile impinges on peat and
consequently the data show greater conductivities at this location.
5.1.2 Test line 2, Sliabh Beagh, straddling Counties Monaghan, Tyrone and Fermanagh
The second test line was on an upland blanket bog on Sliabh Beagh with the peat covered area
extending across the border between Northern Ireland and the Republic of Ireland. The
underlying geology consists of the Carboniferous Meenymore Formation comprising shallow
marine, intertidal, sabka and fluvial sediments in the form of argillaceous rocks and
interbedded limestones. Within the Meenymore formation the Carnmore Sandstone member
consist of 75m of pale greyish fawn, very coarse to medium grained pebbly sandstone
(Mitchell, 2004). The datasets for the test site are provided in Table 5.2.
The results for this study site have been published in Keaney et al., 2013 and McKinley et al.,
2013. A summary of the results is provided in this project report. Test line 2 Date of Survey Technique Number of data Data Blanket peatland Sliabh Beagh
2005 Tellus Airborne radiometric survey
9772 Total Count values for extended area
2012 Integrated Tellus and Tellus Border Survey Airborne radiometric surveys
1588
Total Count values for peat covered area across national boundary
2012 Gamma-ray spectrometry (GRS)
76 1st survey 65 2nd survey
Ground-based GRS Total count values
2012 Ground Penetrating Radar (GPR)
51 GPR calculated peat depths
Table 5.2: Data for Test line 2, Sliabh Beagh, straddling Counties Monaghan, Tyrone and Fermanagh (adapted from Keaney et al., 2013b)
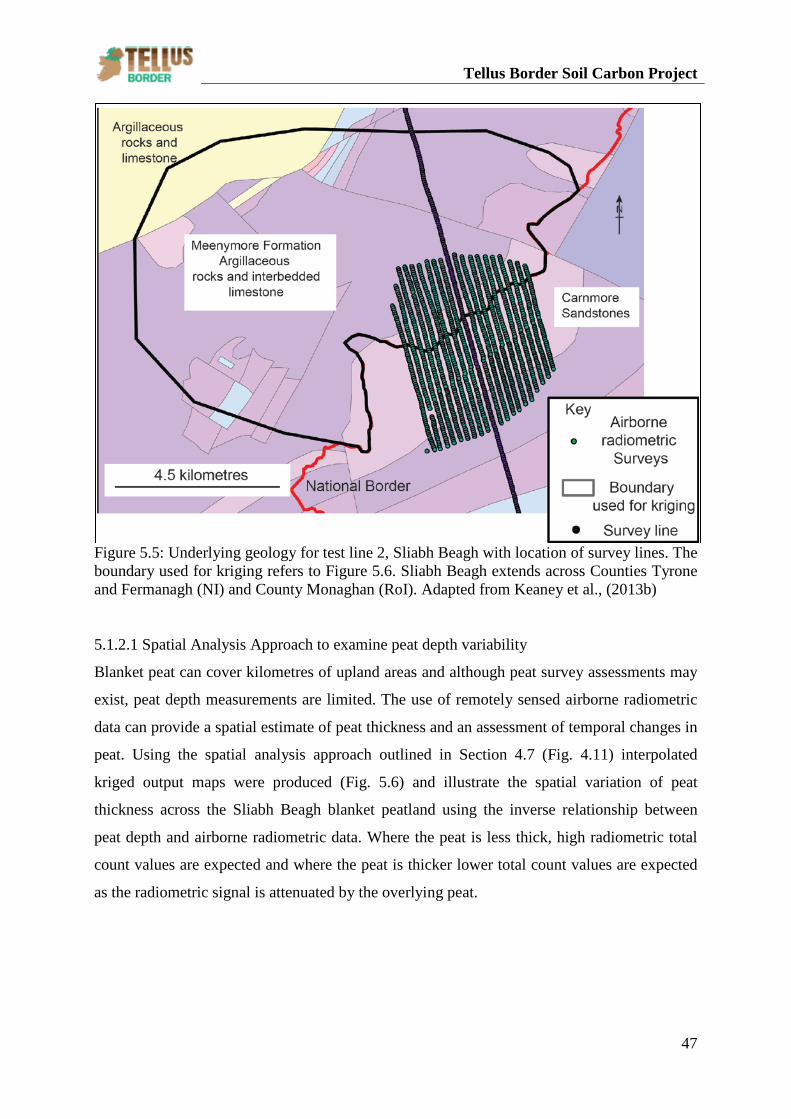
Tellus Border Soil Carbon Project
47
Figure 5.5: Underlying geology for test line 2, Sliabh Beagh with location of survey lines. The boundary used for kriging refers to Figure 5.6. Sliabh Beagh extends across Counties Tyrone and Fermanagh (NI) and County Monaghan (RoI). Adapted from Keaney et al., (2013b) 5.1.2.1 Spatial Analysis Approach to examine peat depth variability
Blanket peat can cover kilometres of upland areas and although peat survey assessments may
exist, peat depth measurements are limited. The use of remotely sensed airborne radiometric
data can provide a spatial estimate of peat thickness and an assessment of temporal changes in
peat. Using the spatial analysis approach outlined in Section 4.7 (Fig. 4.11) interpolated
kriged output maps were produced (Fig. 5.6) and illustrate the spatial variation of peat
thickness across the Sliabh Beagh blanket peatland using the inverse relationship between
peat depth and airborne radiometric data. Where the peat is less thick, high radiometric total
count values are expected and where the peat is thicker lower total count values are expected
as the radiometric signal is attenuated by the overlying peat.
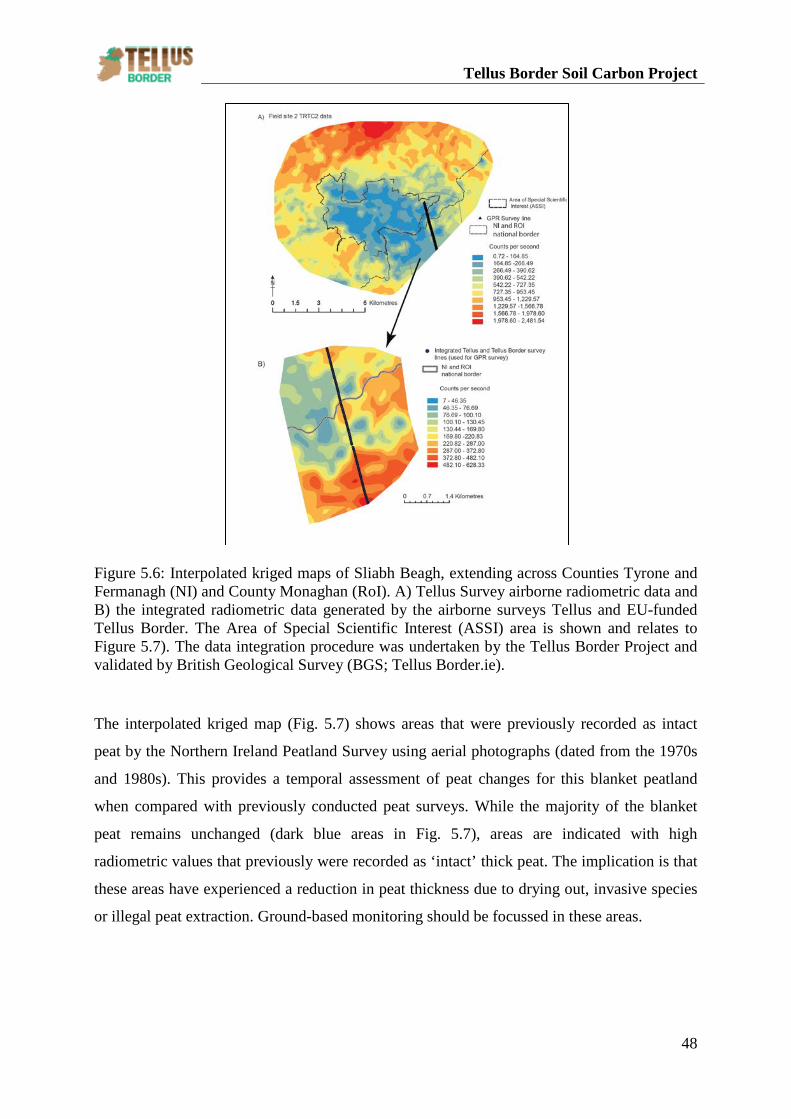
Tellus Border Soil Carbon Project
48
Figure 5.6: Interpolated kriged maps of Sliabh Beagh, extending across Counties Tyrone and Fermanagh (NI) and County Monaghan (RoI). A) Tellus Survey airborne radiometric data and B) the integrated radiometric data generated by the airborne surveys Tellus and EU-funded Tellus Border. The Area of Special Scientific Interest (ASSI) area is shown and relates to Figure 5.7). The data integration procedure was undertaken by the Tellus Border Project and validated by British Geological Survey (BGS; Tellus Border.ie).
The interpolated kriged map (Fig. 5.7) shows areas that were previously recorded as intact
peat by the Northern Ireland Peatland Survey using aerial photographs (dated from the 1970s
and 1980s). This provides a temporal assessment of peat changes for this blanket peatland
when compared with previously conducted peat surveys. While the majority of the blanket
peat remains unchanged (dark blue areas in Fig. 5.7), areas are indicated with high
radiometric values that previously were recorded as ‘intact’ thick peat. The implication is that
these areas have experienced a reduction in peat thickness due to drying out, invasive species
or illegal peat extraction. Ground-based monitoring should be focussed in these areas.
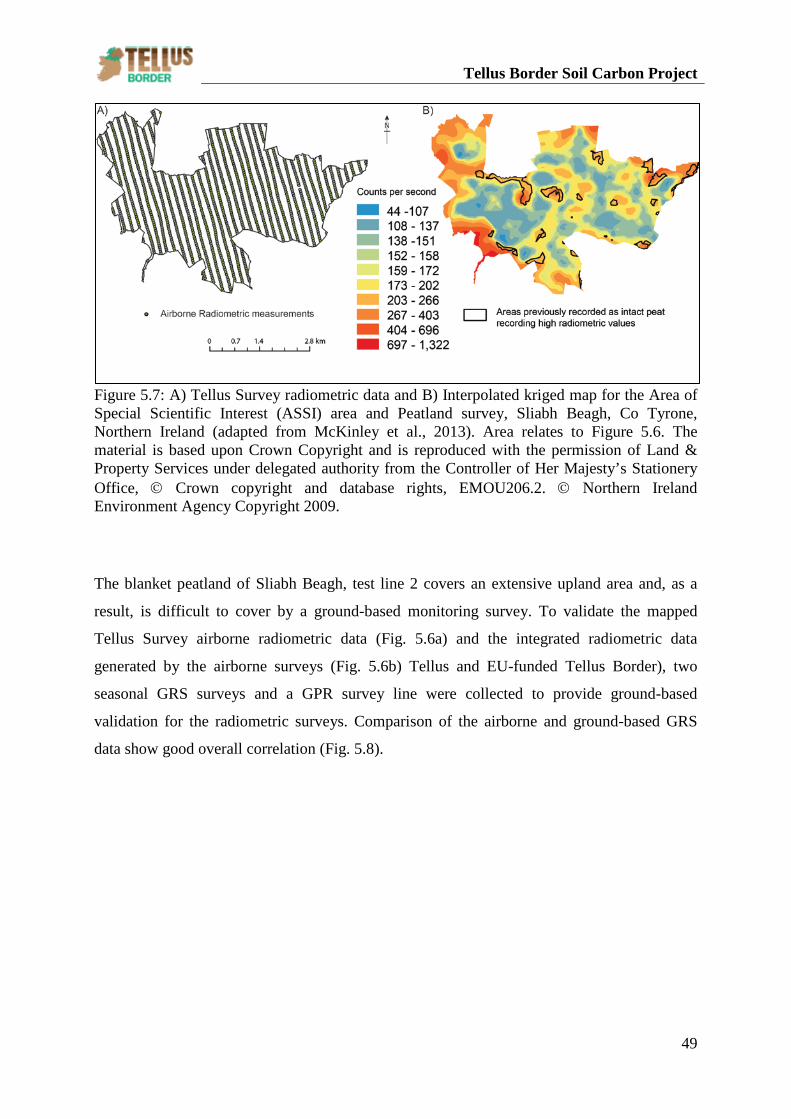
Tellus Border Soil Carbon Project
49
Figure 5.7: A) Tellus Survey radiometric data and B) Interpolated kriged map for the Area of Special Scientific Interest (ASSI) area and Peatland survey, Sliabh Beagh, Co Tyrone, Northern Ireland (adapted from McKinley et al., 2013). Area relates to Figure 5.6. The material is based upon Crown Copyright and is reproduced with the permission of Land & Property Services under delegated authority from the Controller of Her Majesty’s Stationery Office, Crown copyright and database rights, EMOU206.2. Northern Ireland Environment Agency Copyright 2009.
The blanket peatland of Sliabh Beagh, test line 2 covers an extensive upland area and, as a
result, is difficult to cover by a ground-based monitoring survey. To validate the mapped
Tellus Survey airborne radiometric data (Fig. 5.6a) and the integrated radiometric data
generated by the airborne surveys (Fig. 5.6b) Tellus and EU-funded Tellus Border), two
seasonal GRS surveys and a GPR survey line were collected to provide ground-based
validation for the radiometric surveys. Comparison of the airborne and ground-based GRS
data show good overall correlation (Fig. 5.8).
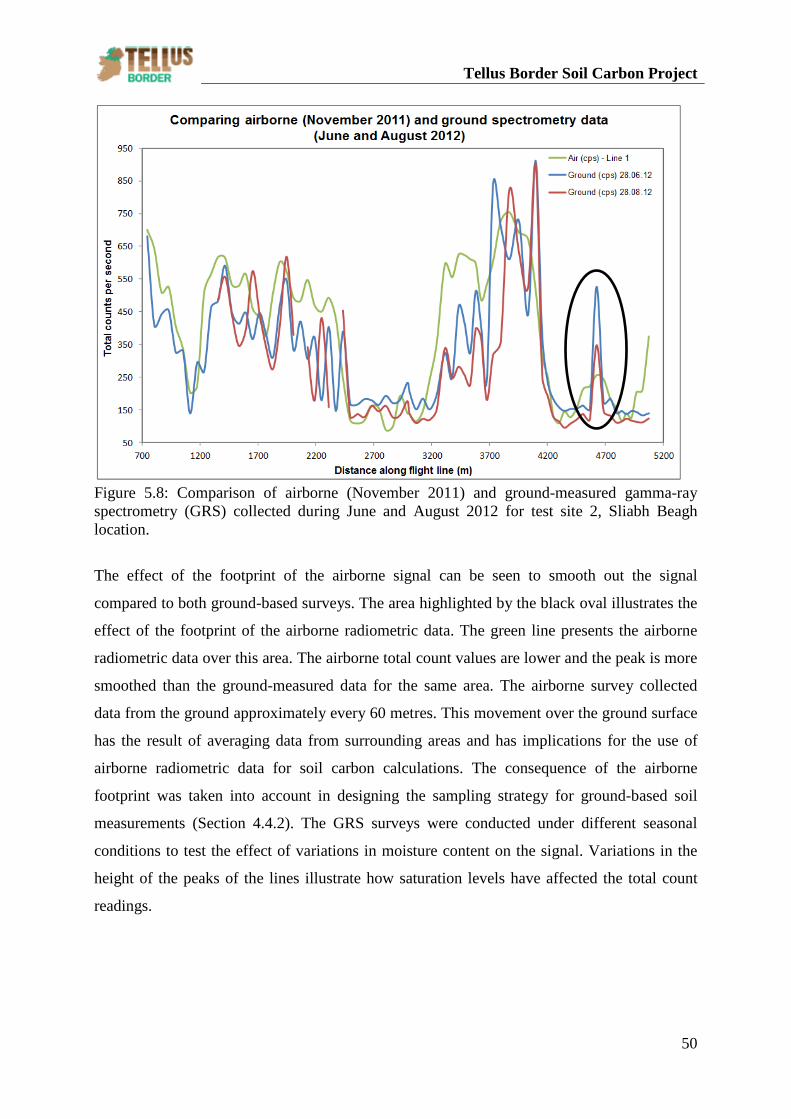
Tellus Border Soil Carbon Project
50
Figure 5.8: Comparison of airborne (November 2011) and ground-measured gamma-ray spectrometry (GRS) collected during June and August 2012 for test site 2, Sliabh Beagh location.
The effect of the footprint of the airborne signal can be seen to smooth out the signal
compared to both ground-based surveys. The area highlighted by the black oval illustrates the
effect of the footprint of the airborne radiometric data. The green line presents the airborne
radiometric data over this area. The airborne total count values are lower and the peak is more
smoothed than the ground-measured data for the same area. The airborne survey collected
data from the ground approximately every 60 metres. This movement over the ground surface
has the result of averaging data from surrounding areas and has implications for the use of
airborne radiometric data for soil carbon calculations. The consequence of the airborne
footprint was taken into account in designing the sampling strategy for ground-based soil
measurements (Section 4.4.2). The GRS surveys were conducted under different seasonal
conditions to test the effect of variations in moisture content on the signal. Variations in the
height of the peaks of the lines illustrate how saturation levels have affected the total count
readings.
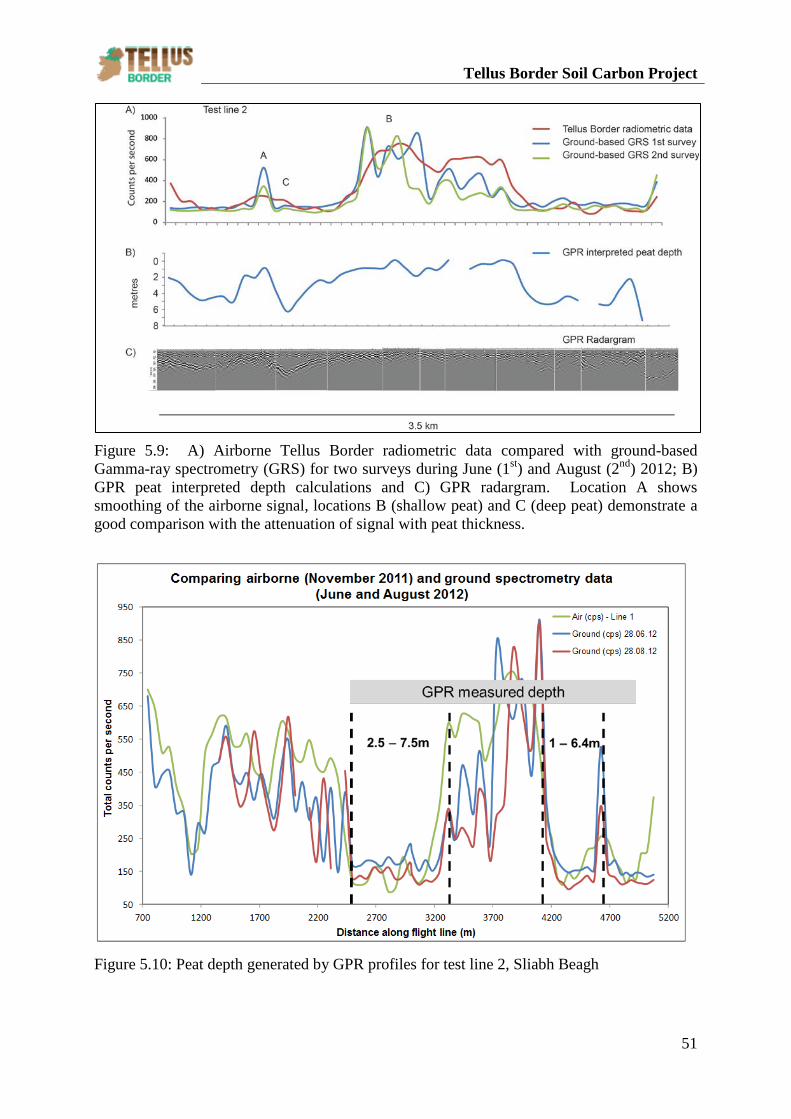
Tellus Border Soil Carbon Project
51
Figure 5.9: A) Airborne Tellus Border radiometric data compared with ground-based Gamma-ray spectrometry (GRS) for two surveys during June (1st) and August (2nd) 2012; B) GPR peat interpreted depth calculations and C) GPR radargram. Location A shows smoothing of the airborne signal, locations B (shallow peat) and C (deep peat) demonstrate a good comparison with the attenuation of signal with peat thickness.
Figure 5.10: Peat depth generated by GPR profiles for test line 2, Sliabh Beagh
Tellus Border Soil Carbon Project
52
GPR profiles were obtained along the test line at Sliabh Beagh (Fig. 5.9c and Fig. 5.10).
Analysing the results (Fig. 5.10) a reduction in radiometric total count values is highlighted
between 2400 – 3200m and 4100 – 4600m along the test line. These areas indicate peat
covered locations where the radiometric signal has been attenuated by peat. An increase in
radiometric total count data (at approximately 3300 and 4650m) is identified as the airborne
survey moves off the section covered by the peat bog and the radiometric signal is no longer
attenuated. Peat depths generated by GPR profiles are shown for the two locations of the test
line (Fig. 5.10) and indicated the presence of peat ranging from 2.5 – 7.5m in depth. Ground
based peat probing investigation identified a maximum peat depth of 2.82 metres and a
minimum peat depth of 0.24m (average peat depth 1.51m). The results suggest that the GPR
profile identified an impermeable layer for the radar that is deeper than the base of the peat
and may be related to the depth to bedrock.
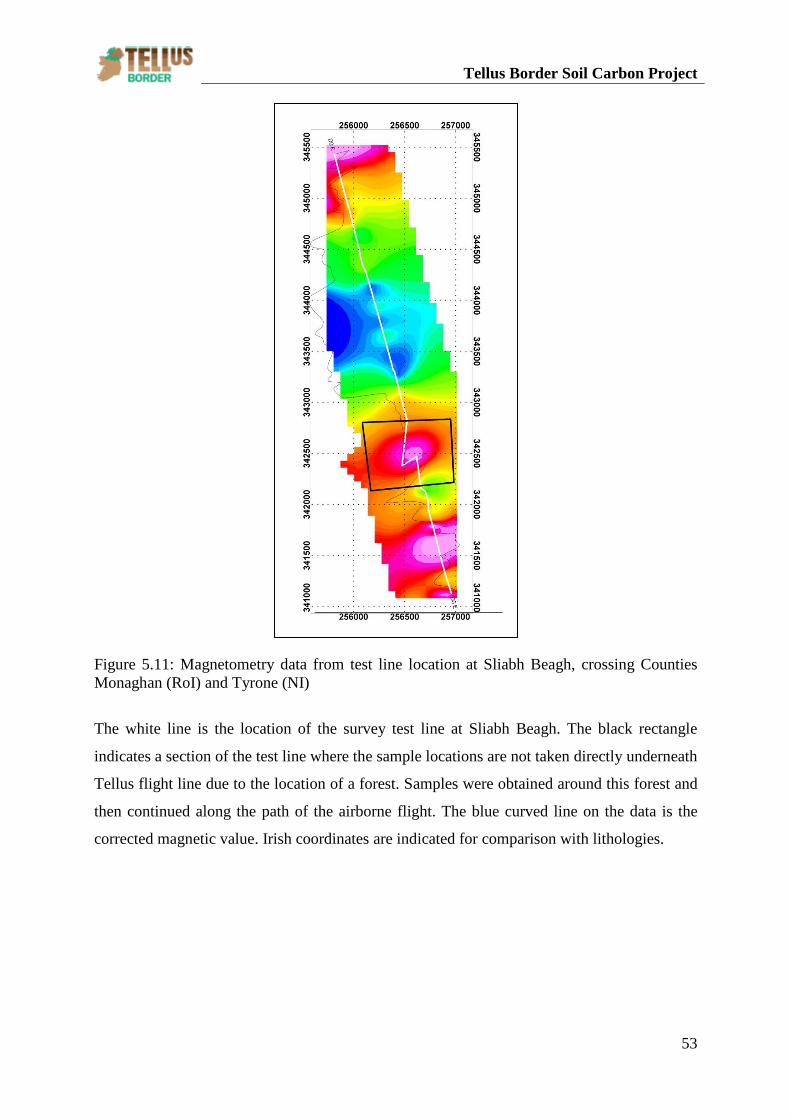
Tellus Border Soil Carbon Project
53
Figure 5.11: Magnetometry data from test line location at Sliabh Beagh, crossing Counties Monaghan (RoI) and Tyrone (NI)
The white line is the location of the survey test line at Sliabh Beagh. The black rectangle
indicates a section of the test line where the sample locations are not taken directly underneath
Tellus flight line due to the location of a forest. Samples were obtained around this forest and
then continued along the path of the airborne flight. The blue curved line on the data is the
corrected magnetic value. Irish coordinates are indicated for comparison with lithologies.
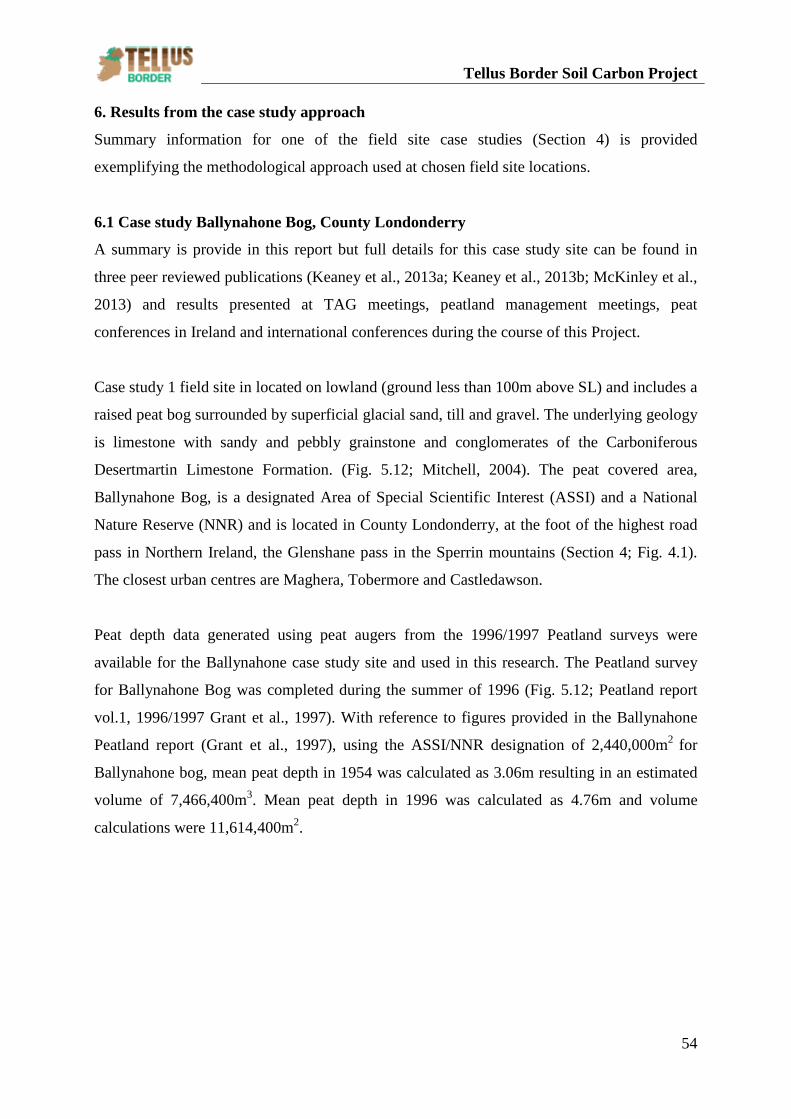
Tellus Border Soil Carbon Project
54
6. Results from the case study approach
Summary information for one of the field site case studies (Section 4) is provided
exemplifying the methodological approach used at chosen field site locations.
6.1 Case study Ballynahone Bog, County Londonderry
A summary is provide in this report but full details for this case study site can be found in
three peer reviewed publications (Keaney et al., 2013a; Keaney et al., 2013b; McKinley et al.,
2013) and results presented at TAG meetings, peatland management meetings, peat
conferences in Ireland and international conferences during the course of this Project.
Case study 1 field site in located on lowland (ground less than 100m above SL) and includes a
raised peat bog surrounded by superficial glacial sand, till and gravel. The underlying geology
is limestone with sandy and pebbly grainstone and conglomerates of the Carboniferous
Desertmartin Limestone Formation. (Fig. 5.12; Mitchell, 2004). The peat covered area,
Ballynahone Bog, is a designated Area of Special Scientific Interest (ASSI) and a National
Nature Reserve (NNR) and is located in County Londonderry, at the foot of the highest road
pass in Northern Ireland, the Glenshane pass in the Sperrin mountains (Section 4; Fig. 4.1).
The closest urban centres are Maghera, Tobermore and Castledawson.
Peat depth data generated using peat augers from the 1996/1997 Peatland surveys were
available for the Ballynahone case study site and used in this research. The Peatland survey
for Ballynahone Bog was completed during the summer of 1996 (Fig. 5.12; Peatland report
vol.1, 1996/1997 Grant et al., 1997). With reference to figures provided in the Ballynahone
Peatland report (Grant et al., 1997), using the ASSI/NNR designation of 2,440,000m2 for
Ballynahone bog, mean peat depth in 1954 was calculated as 3.06m resulting in an estimated
volume of 7,466,400m3. Mean peat depth in 1996 was calculated as 4.76m and volume
calculations were 11,614,400m2.
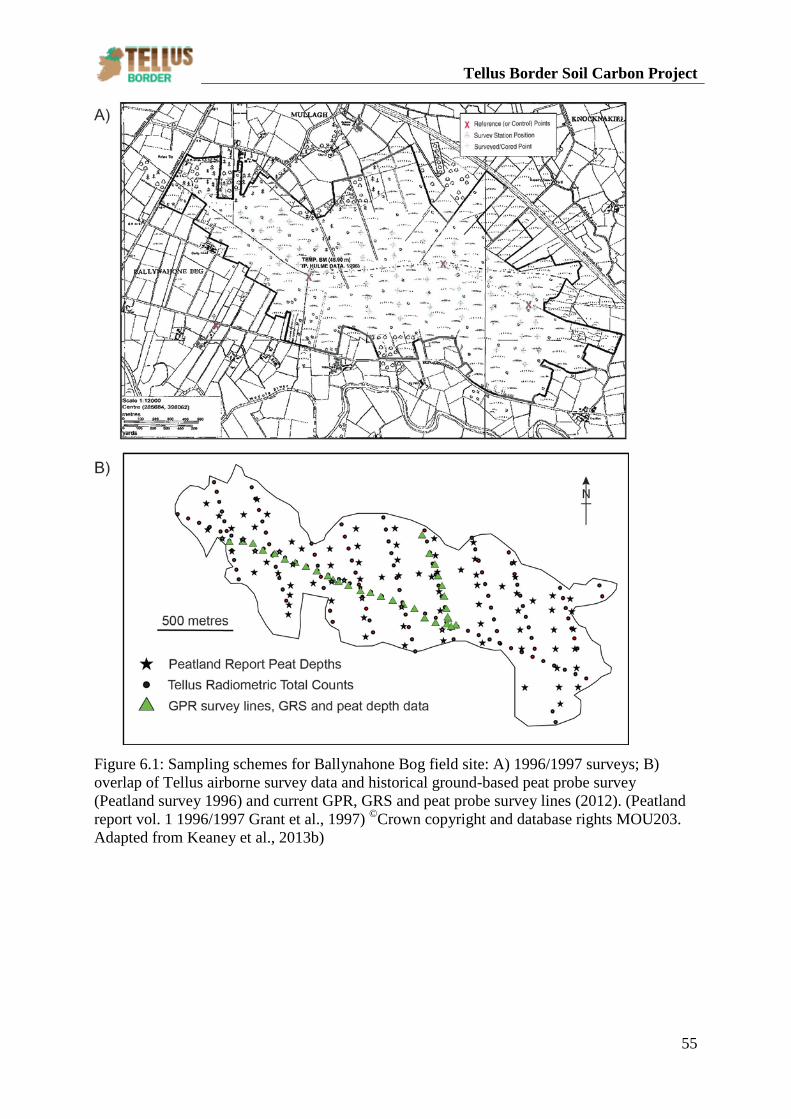
Tellus Border Soil Carbon Project
55
Figure 6.1: Sampling schemes for Ballynahone Bog field site: A) 1996/1997 surveys; B) overlap of Tellus airborne survey data and historical ground-based peat probe survey (Peatland survey 1996) and current GPR, GRS and peat probe survey lines (2012). (Peatland report vol. 1 1996/1997 Grant et al., 1997) ©Crown copyright and database rights MOU203. Adapted from Keaney et al., 2013b)
Tellus Border Soil Carbon Project
56
Field site Date of Survey Technique Number of data Data Raised peat bog Ballynahone
1996 Peat depth probe survey
165 Peatland Report vol. 1 Peat Depth data (Grant et al. 1997)
2005 Tellus Airborne radiometric survey
1476 Total Count values for extended area
2005 Tellus Airborne radiometric survey
106 Total Counts for raised peat bog area
2012 Hand held Gamma-ray spectrometry (GRS)
36 Ground-based GRS Total count values
2012 Ground Penetrating Radar (GPR)
26 GPR calculated peat depth measurements
2012 Peat auger 6 Peat auger depth measurements
Updated peat depths
165+26+6= 197
Used for cokriging
Table 6.1: Data obtained and collected for case study site, Ballynahone Bog, Co Londonderry
Figure 6.2: Figure illustrating a simplified geology map for Ballynahone Bog, County Londonderry (adapted from Keaney et al., 2013b)
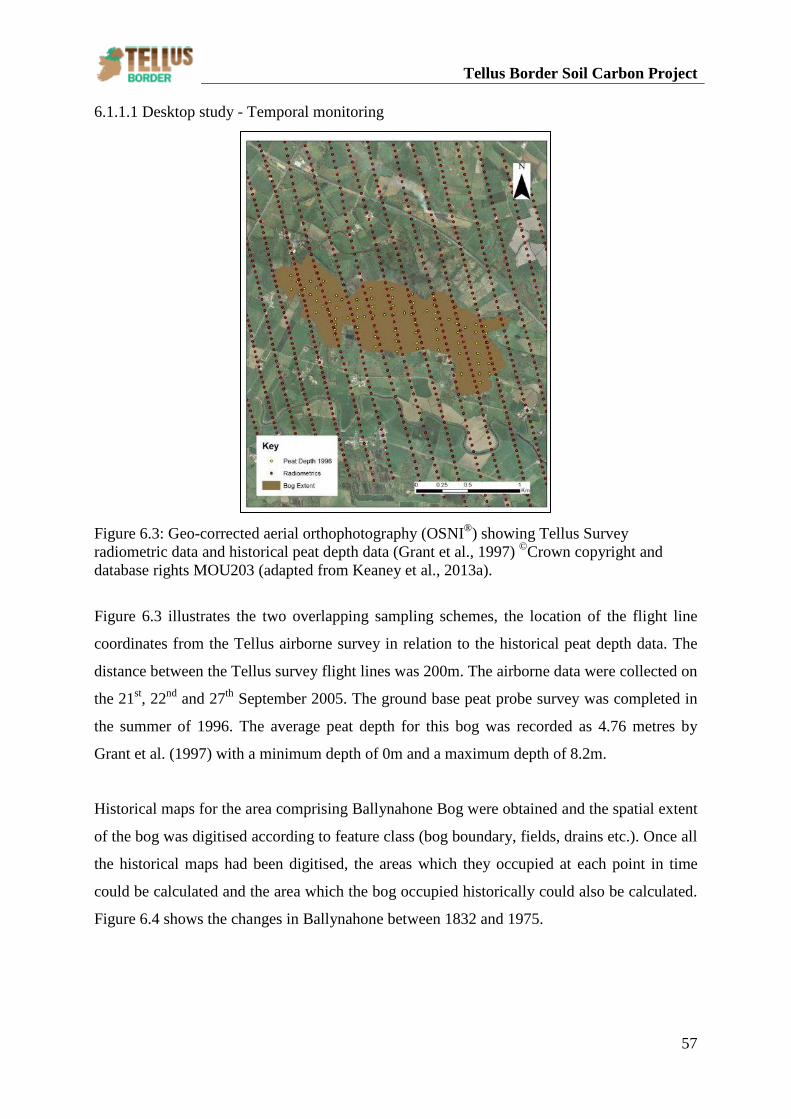
Tellus Border Soil Carbon Project
57
6.1.1.1 Desktop study - Temporal monitoring
Figure 6.3: Geo-corrected aerial orthophotography (OSNI®) showing Tellus Survey radiometric data and historical peat depth data (Grant et al., 1997) ©Crown copyright and database rights MOU203 (adapted from Keaney et al., 2013a).
Figure 6.3 illustrates the two overlapping sampling schemes, the location of the flight line
coordinates from the Tellus airborne survey in relation to the historical peat depth data. The
distance between the Tellus survey flight lines was 200m. The airborne data were collected on
the 21st, 22nd and 27th September 2005. The ground base peat probe survey was completed in
the summer of 1996. The average peat depth for this bog was recorded as 4.76 metres by
Grant et al. (1997) with a minimum depth of 0m and a maximum depth of 8.2m.
Historical maps for the area comprising Ballynahone Bog were obtained and the spatial extent
of the bog was digitised according to feature class (bog boundary, fields, drains etc.). Once all
the historical maps had been digitised, the areas which they occupied at each point in time
could be calculated and the area which the bog occupied historically could also be calculated.
Figure 6.4 shows the changes in Ballynahone between 1832 and 1975.
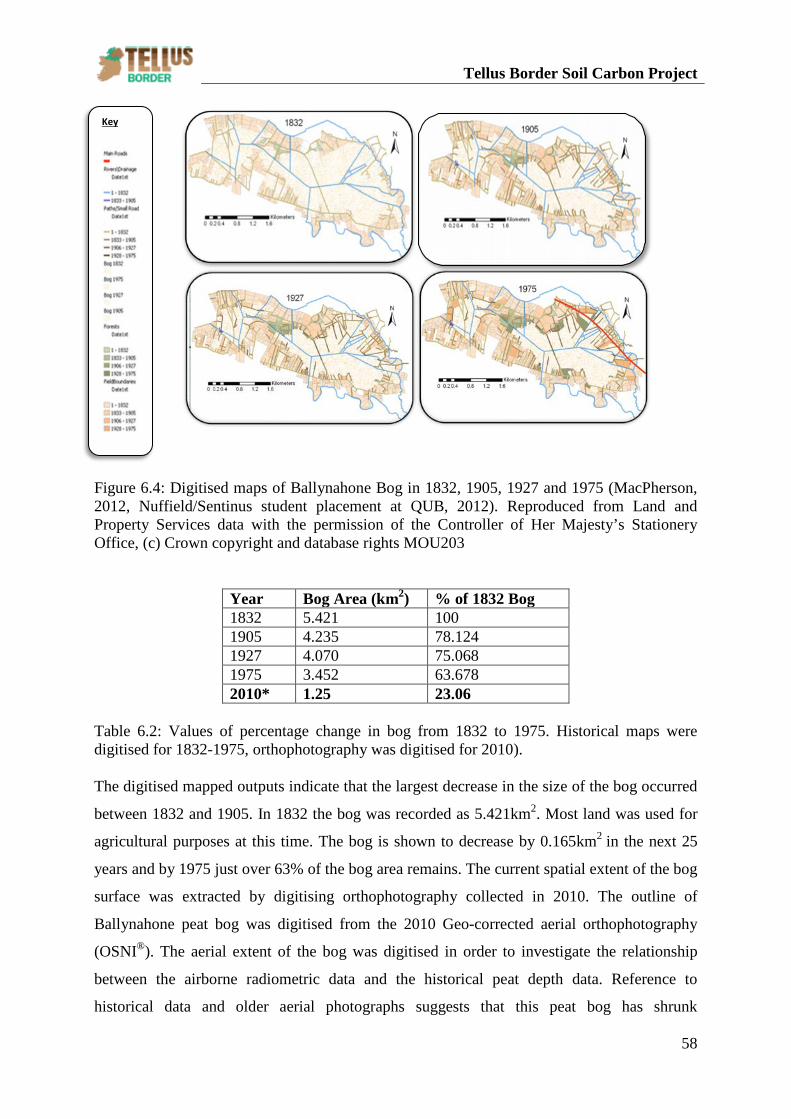
Tellus Border Soil Carbon Project
58
Key
Figure 6.4: Digitised maps of Ballynahone Bog in 1832, 1905, 1927 and 1975 (MacPherson, 2012, Nuffield/Sentinus student placement at QUB, 2012). Reproduced from Land and Property Services data with the permission of the Controller of Her Majesty’s Stationery Office, (c) Crown copyright and database rights MOU203
Year Bog Area (km2) % of 1832 Bog 1832 5.421 100 1905 4.235 78.124 1927 4.070 75.068 1975 3.452 63.678 2010* 1.25 23.06
Table 6.2: Values of percentage change in bog from 1832 to 1975. Historical maps were digitised for 1832-1975, orthophotography was digitised for 2010). The digitised mapped outputs indicate that the largest decrease in the size of the bog occurred
between 1832 and 1905. In 1832 the bog was recorded as 5.421km2. Most land was used for
agricultural purposes at this time. The bog is shown to decrease by 0.165km2 in the next 25
years and by 1975 just over 63% of the bog area remains. The current spatial extent of the bog
surface was extracted by digitising orthophotography collected in 2010. The outline of
Ballynahone peat bog was digitised from the 2010 Geo-corrected aerial orthophotography
(OSNI®). The aerial extent of the bog was digitised in order to investigate the relationship
between the airborne radiometric data and the historical peat depth data. Reference to
historical data and older aerial photographs suggests that this peat bog has shrunk
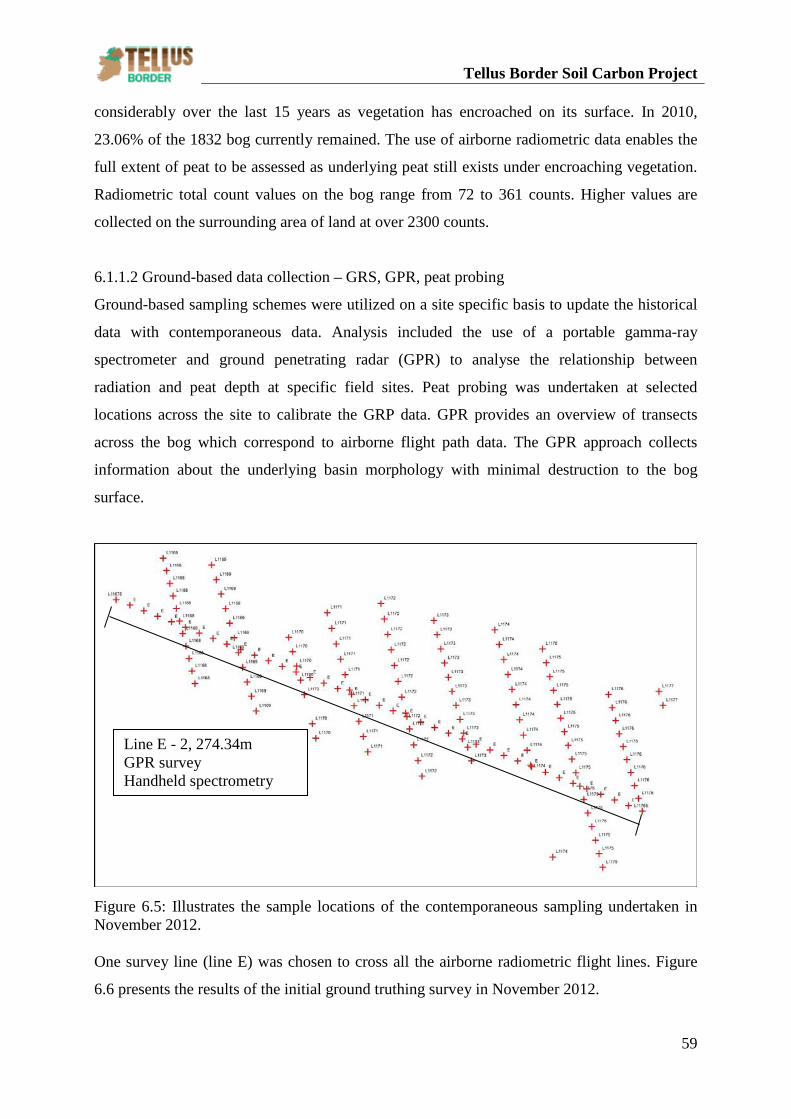
Tellus Border Soil Carbon Project
59
considerably over the last 15 years as vegetation has encroached on its surface. In 2010,
23.06% of the 1832 bog currently remained. The use of airborne radiometric data enables the
full extent of peat to be assessed as underlying peat still exists under encroaching vegetation.
Radiometric total count values on the bog range from 72 to 361 counts. Higher values are
collected on the surrounding area of land at over 2300 counts.
6.1.1.2 Ground-based data collection – GRS, GPR, peat probing
Ground-based sampling schemes were utilized on a site specific basis to update the historical
data with contemporaneous data. Analysis included the use of a portable gamma-ray
spectrometer and ground penetrating radar (GPR) to analyse the relationship between
radiation and peat depth at specific field sites. Peat probing was undertaken at selected
locations across the site to calibrate the GRP data. GPR provides an overview of transects
across the bog which correspond to airborne flight path data. The GPR approach collects
information about the underlying basin morphology with minimal destruction to the bog
surface.
Figure 6.5: Illustrates the sample locations of the contemporaneous sampling undertaken in November 2012. One survey line (line E) was chosen to cross all the airborne radiometric flight lines. Figure
6.6 presents the results of the initial ground truthing survey in November 2012.
Line E - 2, 274.34m GPR survey Handheld spectrometry
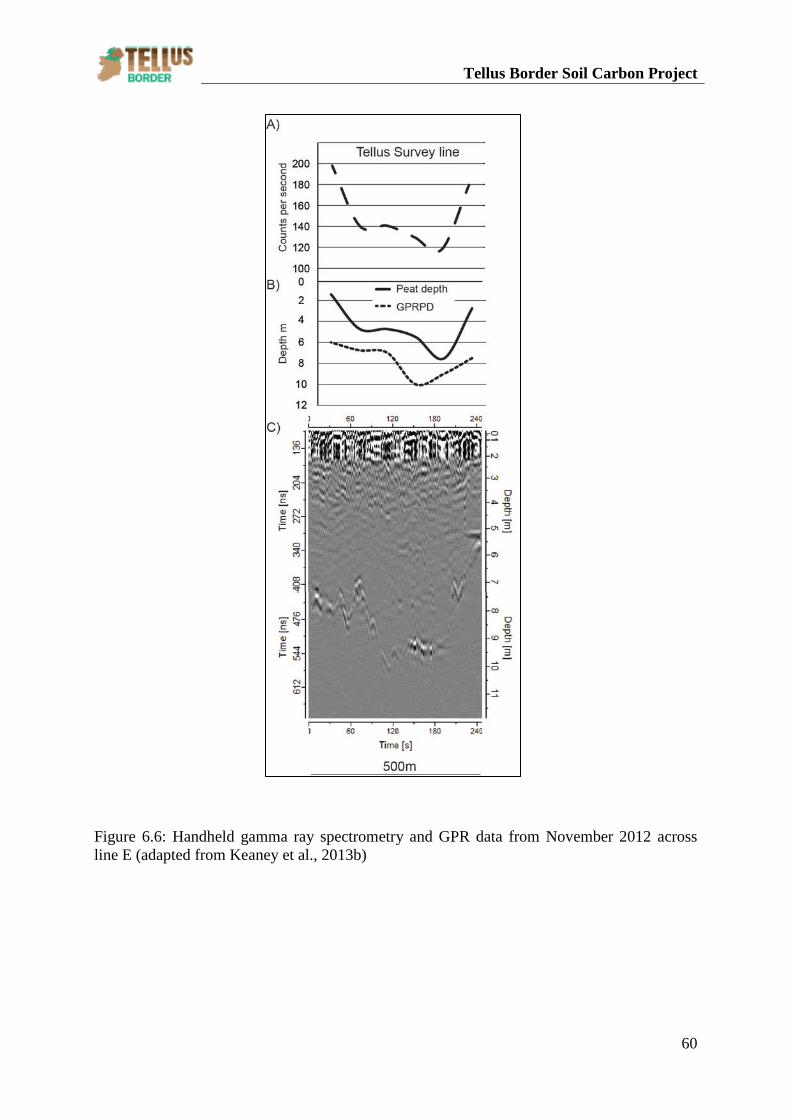
Tellus Border Soil Carbon Project
60
Figure 6.6: Handheld gamma ray spectrometry and GPR data from November 2012 across line E (adapted from Keaney et al., 2013b)
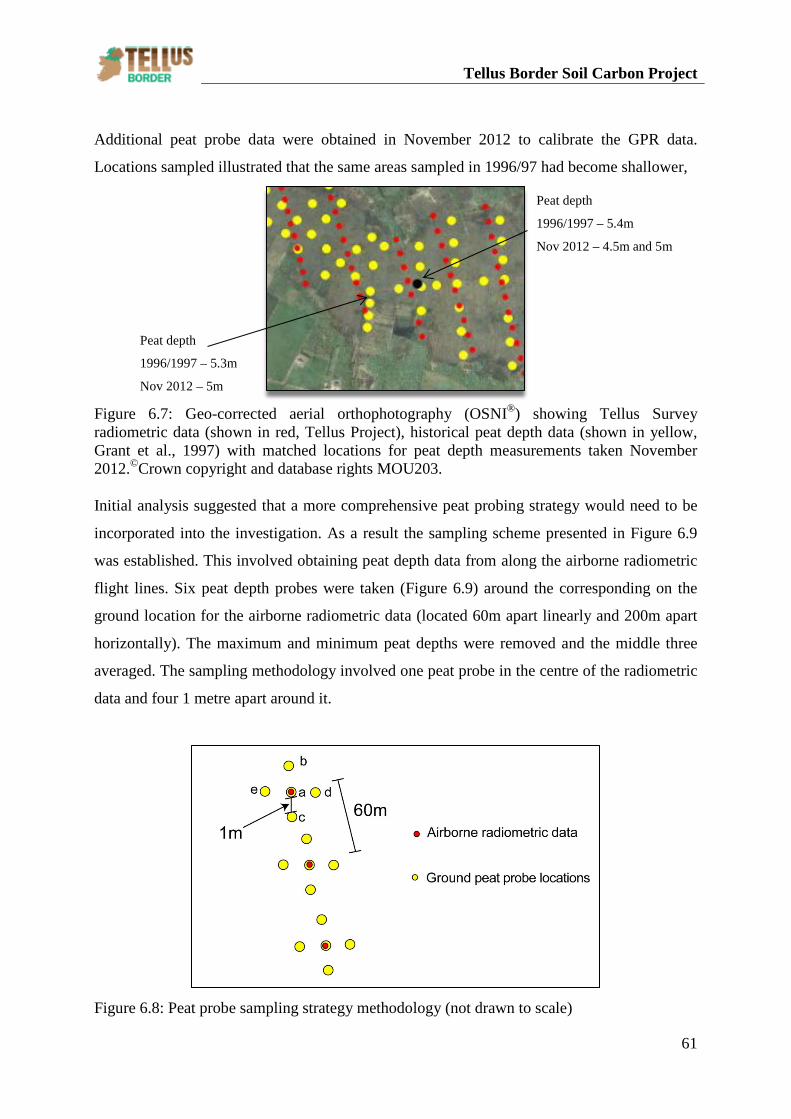
Tellus Border Soil Carbon Project
61
Additional peat probe data were obtained in November 2012 to calibrate the GPR data.
Locations sampled illustrated that the same areas sampled in 1996/97 had become shallower,
Figure 6.7: Geo-corrected aerial orthophotography (OSNI®) showing Tellus Survey radiometric data (shown in red, Tellus Project), historical peat depth data (shown in yellow, Grant et al., 1997) with matched locations for peat depth measurements taken November 2012.©Crown copyright and database rights MOU203. Initial analysis suggested that a more comprehensive peat probing strategy would need to be
incorporated into the investigation. As a result the sampling scheme presented in Figure 6.9
was established. This involved obtaining peat depth data from along the airborne radiometric
flight lines. Six peat depth probes were taken (Figure 6.9) around the corresponding on the
ground location for the airborne radiometric data (located 60m apart linearly and 200m apart
horizontally). The maximum and minimum peat depths were removed and the middle three
averaged. The sampling methodology involved one peat probe in the centre of the radiometric
data and four 1 metre apart around it.
Figure 6.8: Peat probe sampling strategy methodology (not drawn to scale)
Peat depth
1996/1997 – 5.4m
Nov 2012 – 4.5m and 5m
Peat depth
1996/1997 – 5.3m
Nov 2012 – 5m
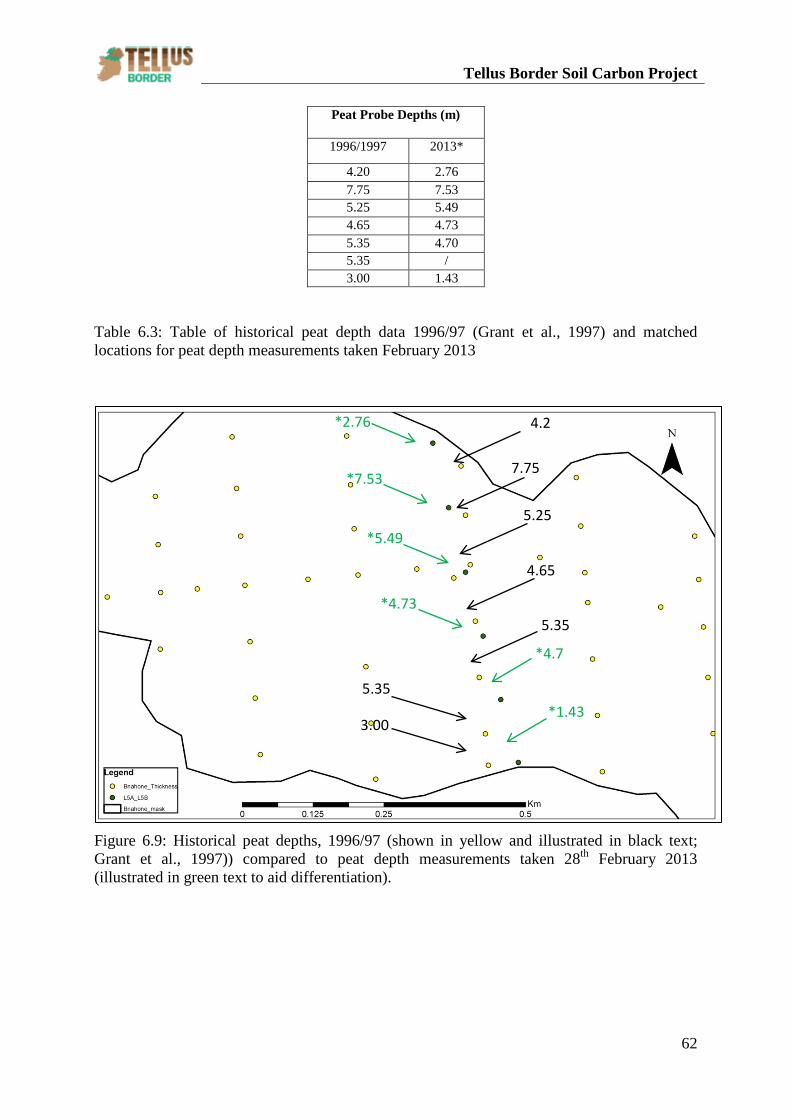
Tellus Border Soil Carbon Project
62
Table 6.3: Table of historical peat depth data 1996/97 (Grant et al., 1997) and matched locations for peat depth measurements taken February 2013
Figure 6.9: Historical peat depths, 1996/97 (shown in yellow and illustrated in black text; Grant et al., 1997)) compared to peat depth measurements taken 28th February 2013 (illustrated in green text to aid differentiation).
Peat Probe Depths (m)
1996/1997 2013*
4.20 2.76 7.75 7.53 5.25 5.49 4.65 4.73 5.35 4.70 5.35 / 3.00 1.43
*2.76
*7.53
*5.49
*4.73
*4.7
*1.43
4.2
7.75
3.00
5.25
4.65
5.35
5.35
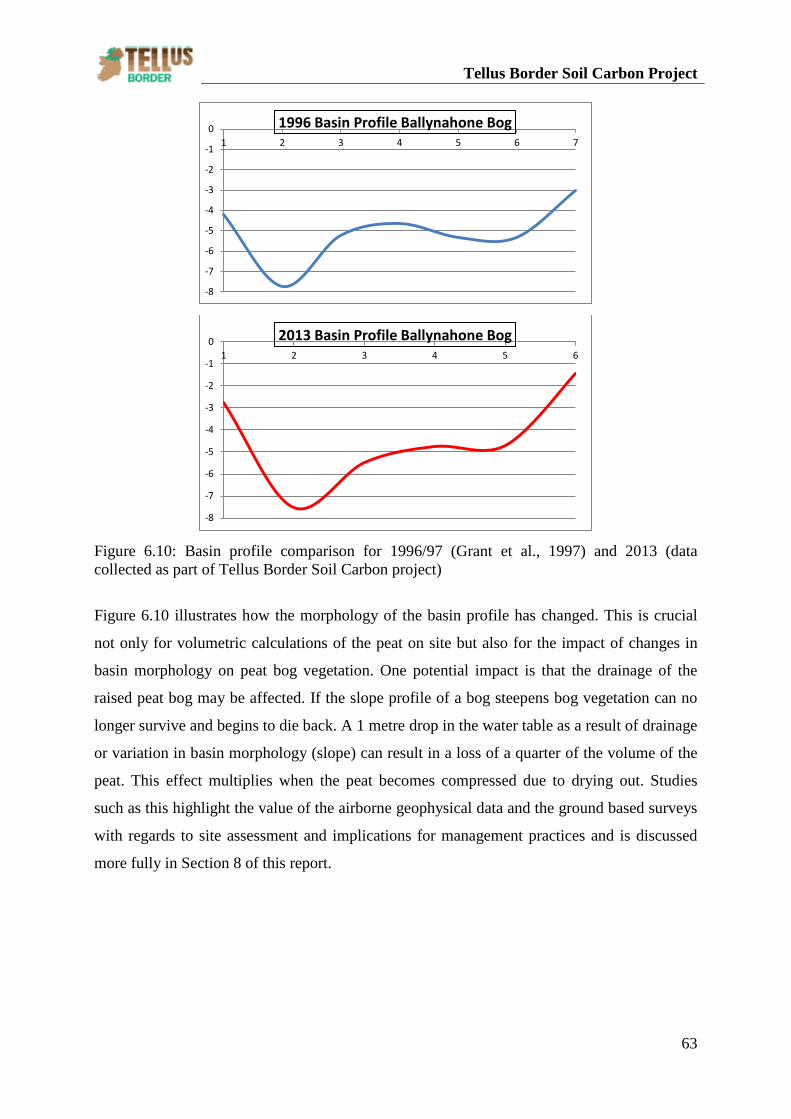
Tellus Border Soil Carbon Project
63
Figure 6.10: Basin profile comparison for 1996/97 (Grant et al., 1997) and 2013 (data collected as part of Tellus Border Soil Carbon project)
Figure 6.10 illustrates how the morphology of the basin profile has changed. This is crucial
not only for volumetric calculations of the peat on site but also for the impact of changes in
basin morphology on peat bog vegetation. One potential impact is that the drainage of the
raised peat bog may be affected. If the slope profile of a bog steepens bog vegetation can no
longer survive and begins to die back. A 1 metre drop in the water table as a result of drainage
or variation in basin morphology (slope) can result in a loss of a quarter of the volume of the
peat. This effect multiplies when the peat becomes compressed due to drying out. Studies
such as this highlight the value of the airborne geophysical data and the ground based surveys
with regards to site assessment and implications for management practices and is discussed
more fully in Section 8 of this report.
-8
-7
-6
-5
-4
-3
-2
-1
01 2 3 4 5 6 7
1996 Basin Profile Ballynahone Bog
-8
-7
-6
-5
-4
-3
-2
-1
01 2 3 4 5 6
2013 Basin Profile Ballynahone Bog
Tellus Border Soil Carbon Project
64
6.1.1.3 Spatial analysis approach
The spatial methodology for this study site has been published in Keaney et al. 2013b and
McKinley et al. 2013. A summary of the results is provided in this project report.
6.1.1.3.1 Kriged interpolated maps
The kriged interpolated map for peat depth measurements (Figure 6.11c) indicates the
variation in peat thickness across the raised peat bog, Ballynahone Bog, County Londonderry
(NI). In comparison, the kriged map for airborne radiometric data (Fig. 6.11b) shows
variability in the attenuation of the radiometric signal across the peat bog (section 4.7; Keaney
et al. 2013b contains full detail regarding the geostatistical technique). As expected where
thick peat is recorded from the 1996 survey (as indicated at location A on Fig. 6.11b and
6.11c), radiometric levels are low demonstrating the attenuation of the radiometric signal. The
geological bedrock does not vary significantly across extent of the peat bog (section 6.1, Fig.
6.2). Equally areas of known thin peat (location C on Fig. 6.11b and 6.11c) demonstrate an
inverse relationship in that the thinner peat cover is less effective in attenuating the
radiometric signal. However anomalous areas are shown where this relationship does not
occur (Fig. 6.11b and 6.11c; locations C and D). These findings suggest that changes have
occurred in the peat bog between the 1996 peatland survey and the Tellus airborne survey in
2005. Regression analysis was undertaken to quantify the relationship between peat depth and
attenuation of the radiometric signal. Radiometric total count values across the raised peatbog
in field site 1 range from 105 to 250 cps. Peat thickness varies from 2.6m to 8.2m in the
deepest parts of the raised bog with a mean peat depth of 5m. There is a moderate inverse
relationship (correlation coefficient r = -0.49) between peat thickness and the airborne
radiometric data. The analysis indicates that while a significant proportion of the regression
relationship confirms that the attenuation of radiometric signal from bedrock is related to the
depth of peat cover, there are sufficient data above and below the regression line to challenge
the hypothesis that deeper peat is directly related to a reduced radiometric signal. A non-
spatial approach cannot address the question of where areas exist across the peat bog that
support and disagree with the hypothesis. Consequently, spatial data analysis (using
geostatistics) was used to investigate the relationship further.
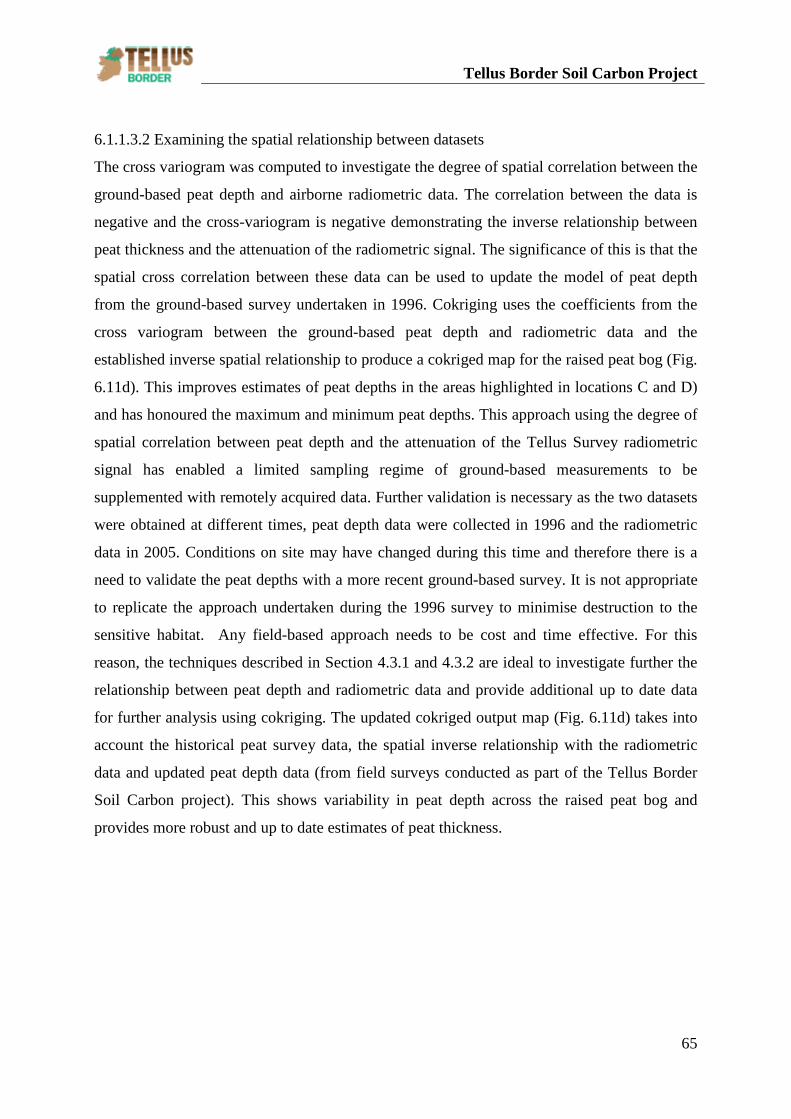
Tellus Border Soil Carbon Project
65
6.1.1.3.2 Examining the spatial relationship between datasets
The cross variogram was computed to investigate the degree of spatial correlation between the
ground-based peat depth and airborne radiometric data. The correlation between the data is
negative and the cross-variogram is negative demonstrating the inverse relationship between
peat thickness and the attenuation of the radiometric signal. The significance of this is that the
spatial cross correlation between these data can be used to update the model of peat depth
from the ground-based survey undertaken in 1996. Cokriging uses the coefficients from the
cross variogram between the ground-based peat depth and radiometric data and the
established inverse spatial relationship to produce a cokriged map for the raised peat bog (Fig.
6.11d). This improves estimates of peat depths in the areas highlighted in locations C and D)
and has honoured the maximum and minimum peat depths. This approach using the degree of
spatial correlation between peat depth and the attenuation of the Tellus Survey radiometric
signal has enabled a limited sampling regime of ground-based measurements to be
supplemented with remotely acquired data. Further validation is necessary as the two datasets
were obtained at different times, peat depth data were collected in 1996 and the radiometric
data in 2005. Conditions on site may have changed during this time and therefore there is a
need to validate the peat depths with a more recent ground-based survey. It is not appropriate
to replicate the approach undertaken during the 1996 survey to minimise destruction to the
sensitive habitat. Any field-based approach needs to be cost and time effective. For this
reason, the techniques described in Section 4.3.1 and 4.3.2 are ideal to investigate further the
relationship between peat depth and radiometric data and provide additional up to date data
for further analysis using cokriging. The updated cokriged output map (Fig. 6.11d) takes into
account the historical peat survey data, the spatial inverse relationship with the radiometric
data and updated peat depth data (from field surveys conducted as part of the Tellus Border
Soil Carbon project). This shows variability in peat depth across the raised peat bog and
provides more robust and up to date estimates of peat thickness.
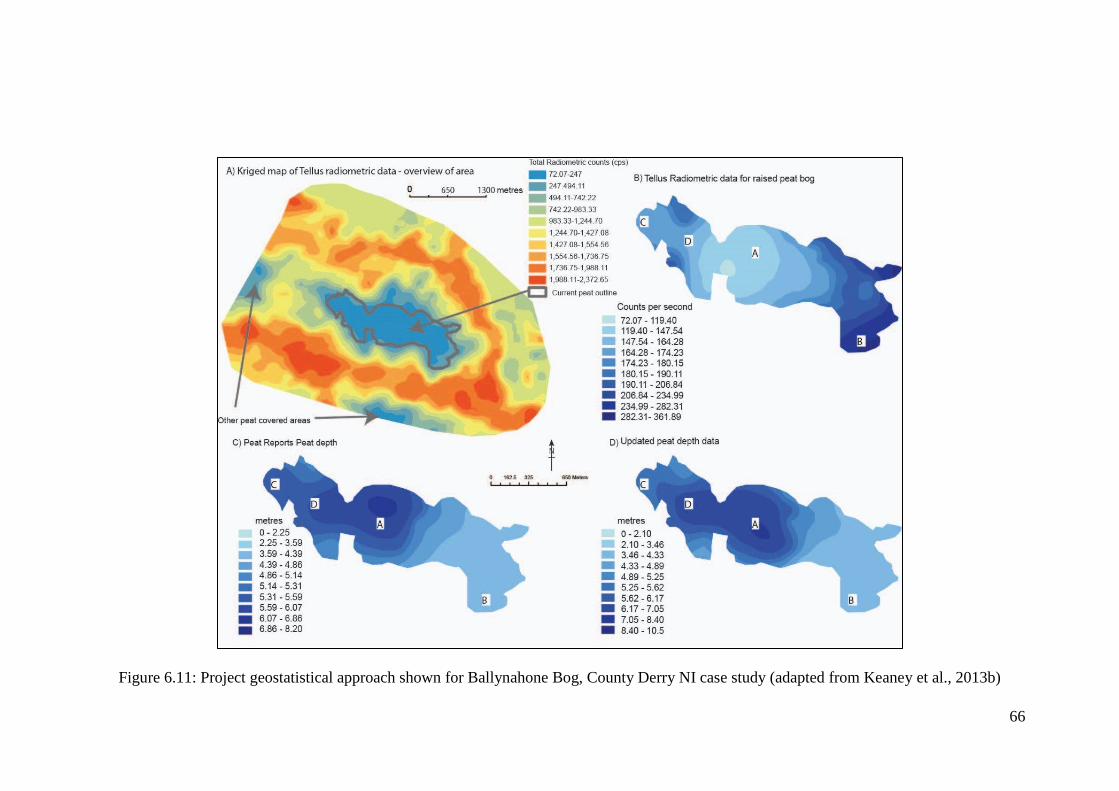
66
Figure 6.11: Project geostatistical approach shown for Ballynahone Bog, County Derry NI case study (adapted from Keaney et al., 2013b)
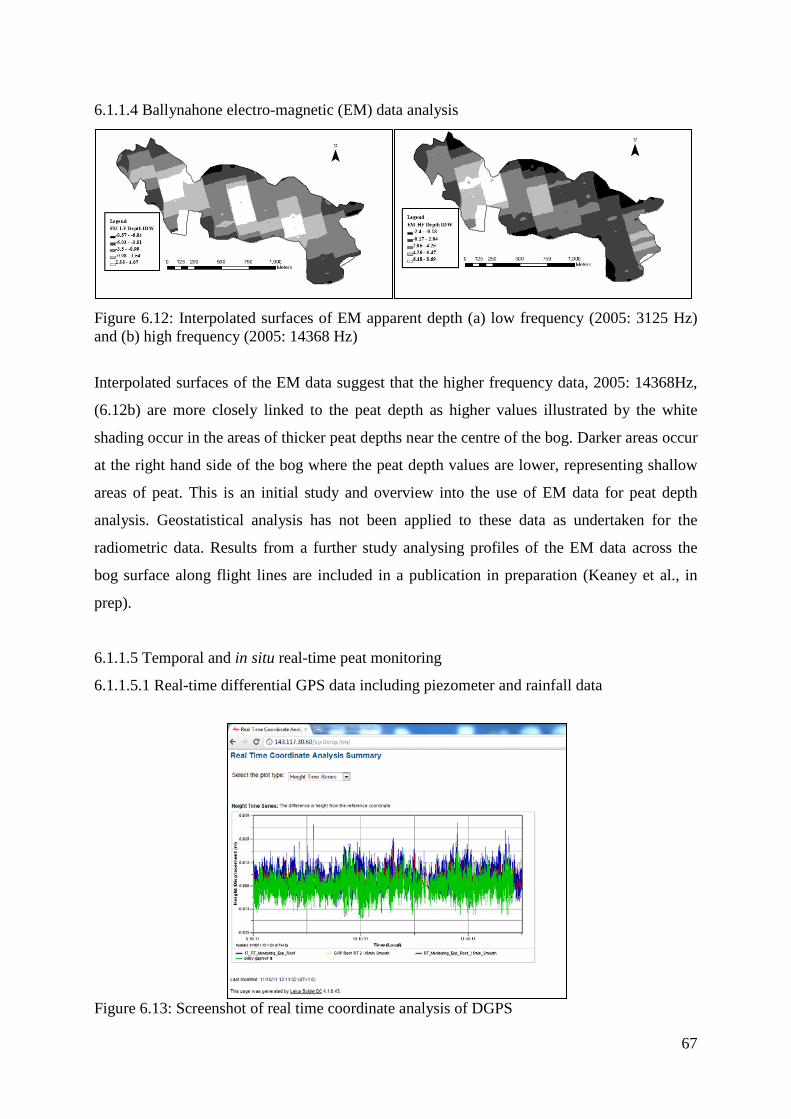
67
6.1.1.4 Ballynahone electro-magnetic (EM) data analysis
Figure 6.12: Interpolated surfaces of EM apparent depth (a) low frequency (2005: 3125 Hz) and (b) high frequency (2005: 14368 Hz)
Interpolated surfaces of the EM data suggest that the higher frequency data, 2005: 14368Hz,
(6.12b) are more closely linked to the peat depth as higher values illustrated by the white
shading occur in the areas of thicker peat depths near the centre of the bog. Darker areas occur
at the right hand side of the bog where the peat depth values are lower, representing shallow
areas of peat. This is an initial study and overview into the use of EM data for peat depth
analysis. Geostatistical analysis has not been applied to these data as undertaken for the
radiometric data. Results from a further study analysing profiles of the EM data across the
bog surface along flight lines are included in a publication in preparation (Keaney et al., in
prep).
6.1.1.5 Temporal and in situ real-time peat monitoring
6.1.1.5.1 Real-time differential GPS data including piezometer and rainfall data
Figure 6.13: Screenshot of real time coordinate analysis of DGPS
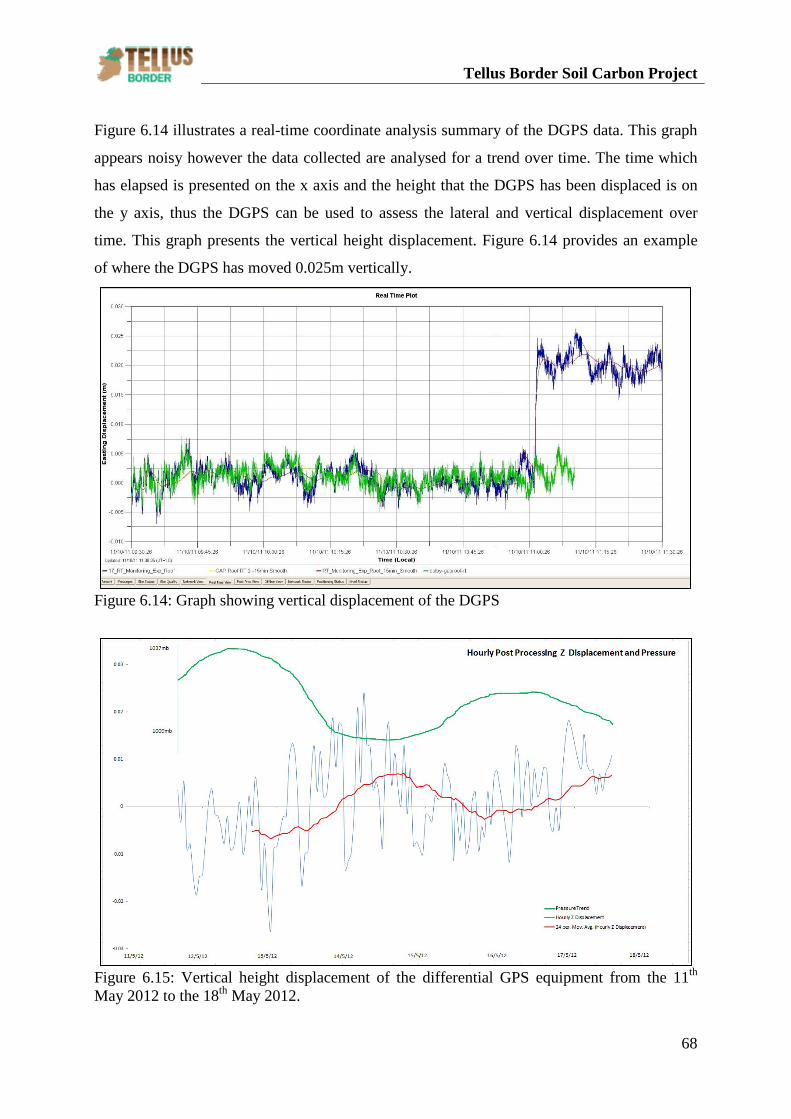
Tellus Border Soil Carbon Project
68
Figure 6.14 illustrates a real-time coordinate analysis summary of the DGPS data. This graph
appears noisy however the data collected are analysed for a trend over time. The time which
has elapsed is presented on the x axis and the height that the DGPS has been displaced is on
the y axis, thus the DGPS can be used to assess the lateral and vertical displacement over
time. This graph presents the vertical height displacement. Figure 6.14 provides an example
of where the DGPS has moved 0.025m vertically.
Figure 6.14: Graph showing vertical displacement of the DGPS
Figure 6.15: Vertical height displacement of the differential GPS equipment from the 11th May 2012 to the 18th May 2012.
Tellus Border Soil Carbon Project
69
Figure 6.15 illustrates a real time co-ordinate analysis summary of the DGPS data from
Ballynahone peat bog between 11th May 2012 and 18th May 2012. This illustrates how this
equipment can be used to monitor how the bog is moving both laterally and vertically over
time. Figure 6.15 provides an example of how weather systems affect the movement on a bog,
for example moving from a high pressure to a low pressure system, this progression can be
identified on the bog surface. It was initially surmised that the passing of a high pressure
systems would result in deformation of the bog surface but that the bog would return to
normal raised conditions during a low pressure system. Analysis of the DGPS data suggests
that the bog is depressed during both high and low pressure systems. A possible explanation
for this is that during low pressure systems gases such as carbon and methane are released
from the bog resulting in further deformation. These data are beneficial for the soil carbon
project both as a teaching tool (see Section 13.4) and also for the temporal assessment of peat
covered areas. This is crucial not only for accurate peat depth calculations and changes but
also as a management tool to assess remediation works and bog restoration (see Section 9).
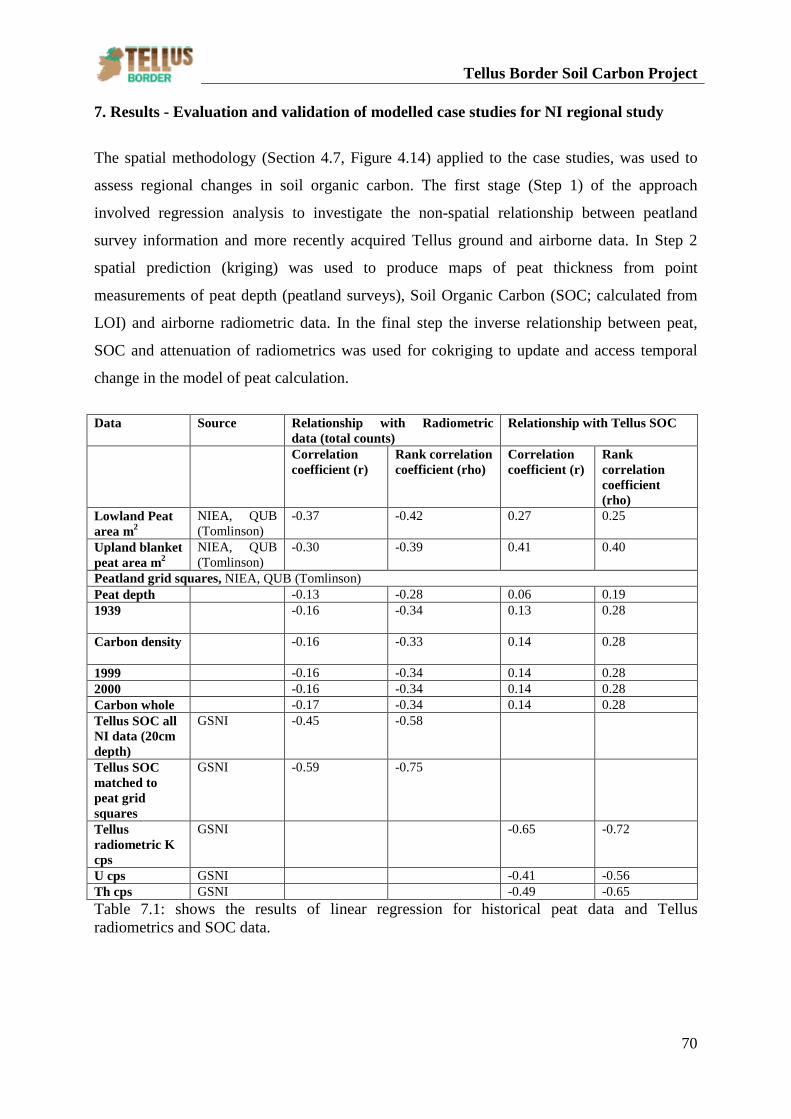
Tellus Border Soil Carbon Project
70
7. Results - Evaluation and validation of modelled case studies for NI regional study
The spatial methodology (Section 4.7, Figure 4.14) applied to the case studies, was used to
assess regional changes in soil organic carbon. The first stage (Step 1) of the approach
involved regression analysis to investigate the non-spatial relationship between peatland
survey information and more recently acquired Tellus ground and airborne data. In Step 2
spatial prediction (kriging) was used to produce maps of peat thickness from point
measurements of peat depth (peatland surveys), Soil Organic Carbon (SOC; calculated from
LOI) and airborne radiometric data. In the final step the inverse relationship between peat,
SOC and attenuation of radiometrics was used for cokriging to update and access temporal
change in the model of peat calculation.
Data
Source Relationship with Radiometric data (total counts)
Relationship with Tellus SOC
Correlation coefficient (r)
Rank correlation coefficient (rho)
Correlation coefficient (r)
Rank correlation coefficient (rho)
Lowland Peat area m2
NIEA, QUB (Tomlinson)
-0.37 -0.42 0.27 0.25
Upland blanket peat area m2
NIEA, QUB (Tomlinson)
-0.30 -0.39 0.41 0.40
Peatland grid squares, NIEA, QUB (Tomlinson) Peat depth -0.13 -0.28 0.06 0.19 1939
-0.16 -0.34 0.13 0.28
Carbon density
-0.16 -0.33 0.14 0.28
1999 -0.16 -0.34 0.14 0.28 2000 -0.16 -0.34 0.14 0.28 Carbon whole -0.17 -0.34 0.14 0.28 Tellus SOC all NI data (20cm depth)
GSNI -0.45 -0.58
Tellus SOC matched to peat grid squares
GSNI -0.59 -0.75
Tellus radiometric K cps
GSNI -0.65 -0.72
U cps GSNI -0.41 -0.56 Th cps GSNI -0.49 -0.65 Table 7.1: shows the results of linear regression for historical peat data and Tellus radiometrics and SOC data.
Tellus Border Soil Carbon Project
71
The largest inverse correlation value (rho = -0.75) exist between Tellus radiometrics and
Tellus SOC data matched to peat grid squares generated by the Northern Ireland Peatland
Survey using aerial photographs (dated from the 1970s and 1980s). Within the Tellus
radiometric data, spectral counts of potassium (K cps) show the largest inverse correlation
with Tellus SOC data. Upland Blanket peat area m2 shows a higher correlation with Tellus
SOC data and inverse correlation with Tellus Radiometric data than shown for Lowland Peat
area m2. Carbon density shows a low correlation with both the Tellus radiometric data and
SOC data. This underlines the importance of the calculation of volumetric carbon content
(VCC) as described in Section (4.5.1) and undertaken for Test line 2, Sliabh Beagh field site
(Section 4.5).
The ‘Tellus SOC all NI data’ (Table 7.1) describes all geochemical points spatially joined to
the Tellus radiometric data. This includes all land use types and is of particular value in an
evaluation of the usefulness of the Tellus radiometric data in the interpretation for all land
cover types. Although outside the scope of this project, this has the potential to be
investigated further.
The regional assessment of peat covered areas (Peatland grid squares, NIEA, Tomlinson) is
used as baseline data to assess change in soil carbon estimates. The results of kriging were
used to map SOC and airborne radiometric data to assess temporal change in regional soil
carbon for upland and lowland peat covered areas (Fig. 7.1).
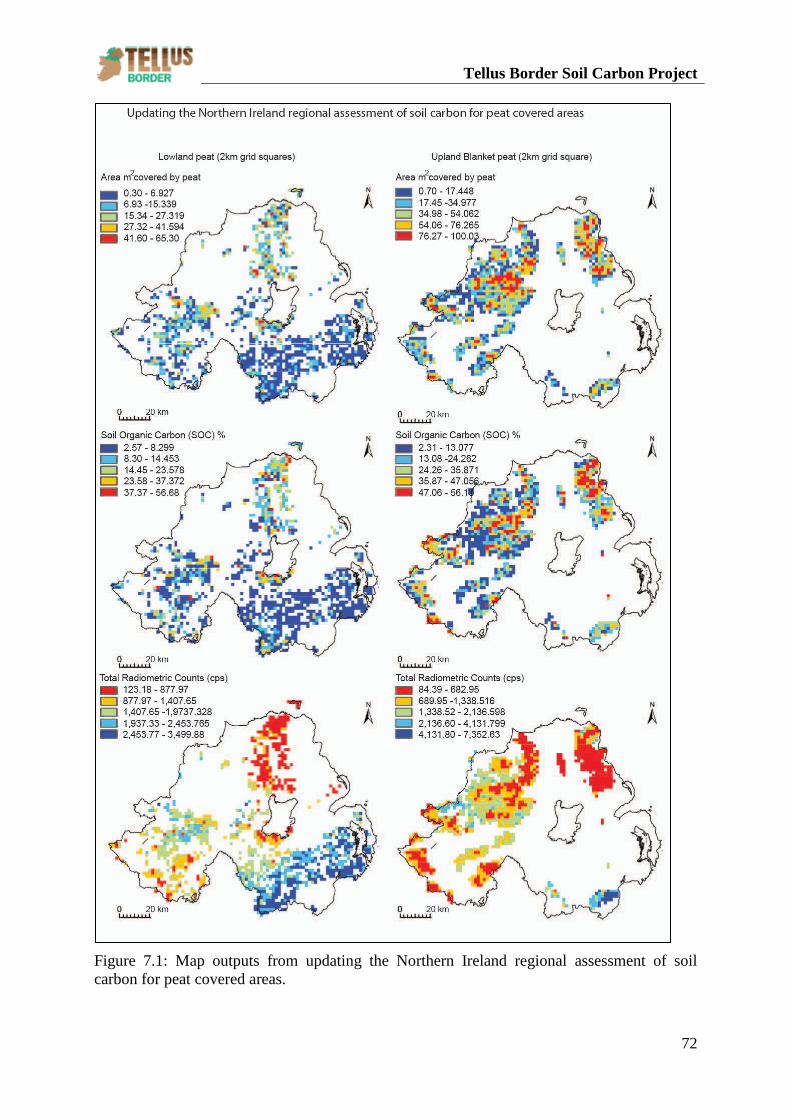
Tellus Border Soil Carbon Project
72
Figure 7.1: Map outputs from updating the Northern Ireland regional assessment of soil carbon for peat covered areas.
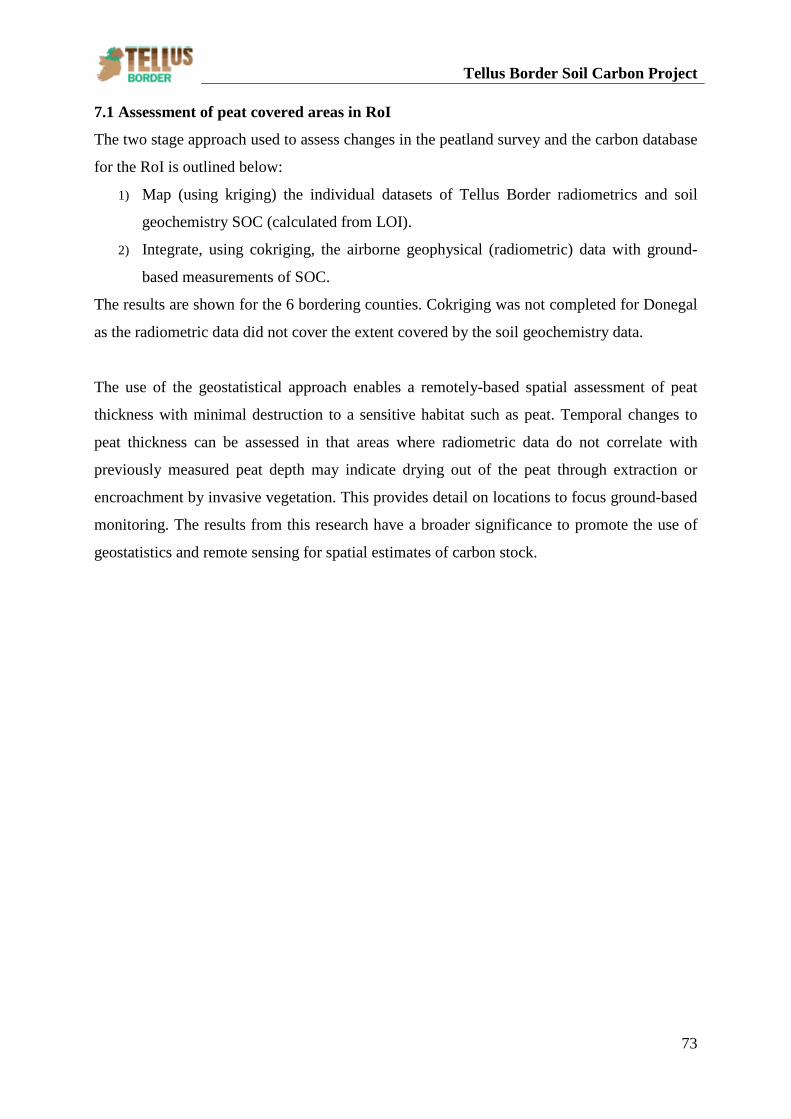
Tellus Border Soil Carbon Project
73
7.1 Assessment of peat covered areas in RoI
The two stage approach used to assess changes in the peatland survey and the carbon database
for the RoI is outlined below:
1) Map (using kriging) the individual datasets of Tellus Border radiometrics and soil
geochemistry SOC (calculated from LOI).
2) Integrate, using cokriging, the airborne geophysical (radiometric) data with ground-
based measurements of SOC.
The results are shown for the 6 bordering counties. Cokriging was not completed for Donegal
as the radiometric data did not cover the extent covered by the soil geochemistry data.
The use of the geostatistical approach enables a remotely-based spatial assessment of peat
thickness with minimal destruction to a sensitive habitat such as peat. Temporal changes to
peat thickness can be assessed in that areas where radiometric data do not correlate with
previously measured peat depth may indicate drying out of the peat through extraction or
encroachment by invasive vegetation. This provides detail on locations to focus ground-based
monitoring. The results from this research have a broader significance to promote the use of
geostatistics and remote sensing for spatial estimates of carbon stock.
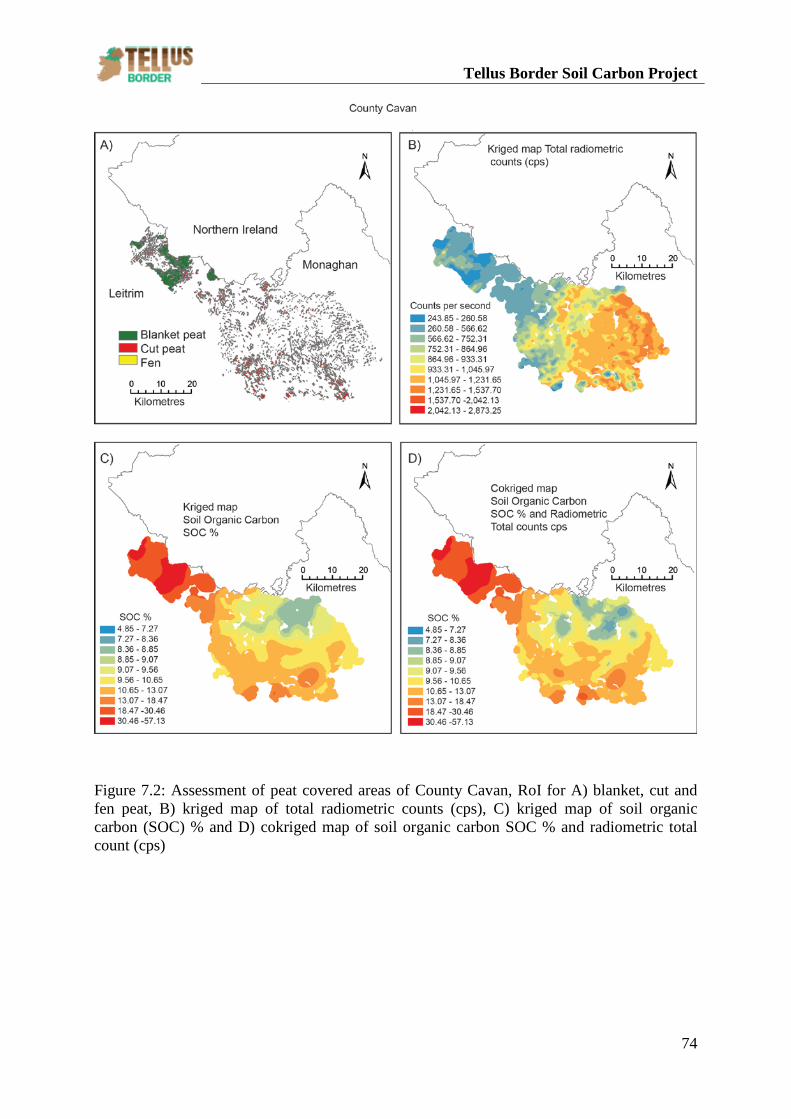
Tellus Border Soil Carbon Project
74
Figure 7.2: Assessment of peat covered areas of County Cavan, RoI for A) blanket, cut and fen peat, B) kriged map of total radiometric counts (cps), C) kriged map of soil organic carbon (SOC) % and D) cokriged map of soil organic carbon SOC % and radiometric total count (cps)
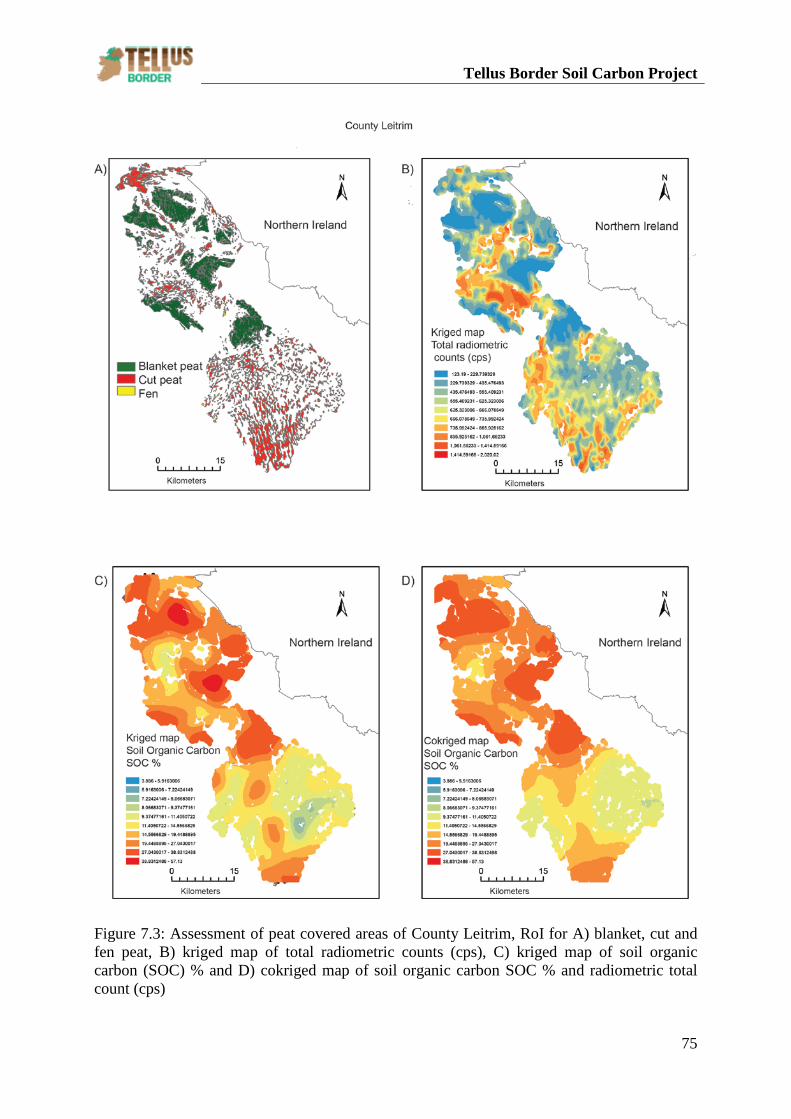
Tellus Border Soil Carbon Project
75
Figure 7.3: Assessment of peat covered areas of County Leitrim, RoI for A) blanket, cut and fen peat, B) kriged map of total radiometric counts (cps), C) kriged map of soil organic carbon (SOC) % and D) cokriged map of soil organic carbon SOC % and radiometric total count (cps)
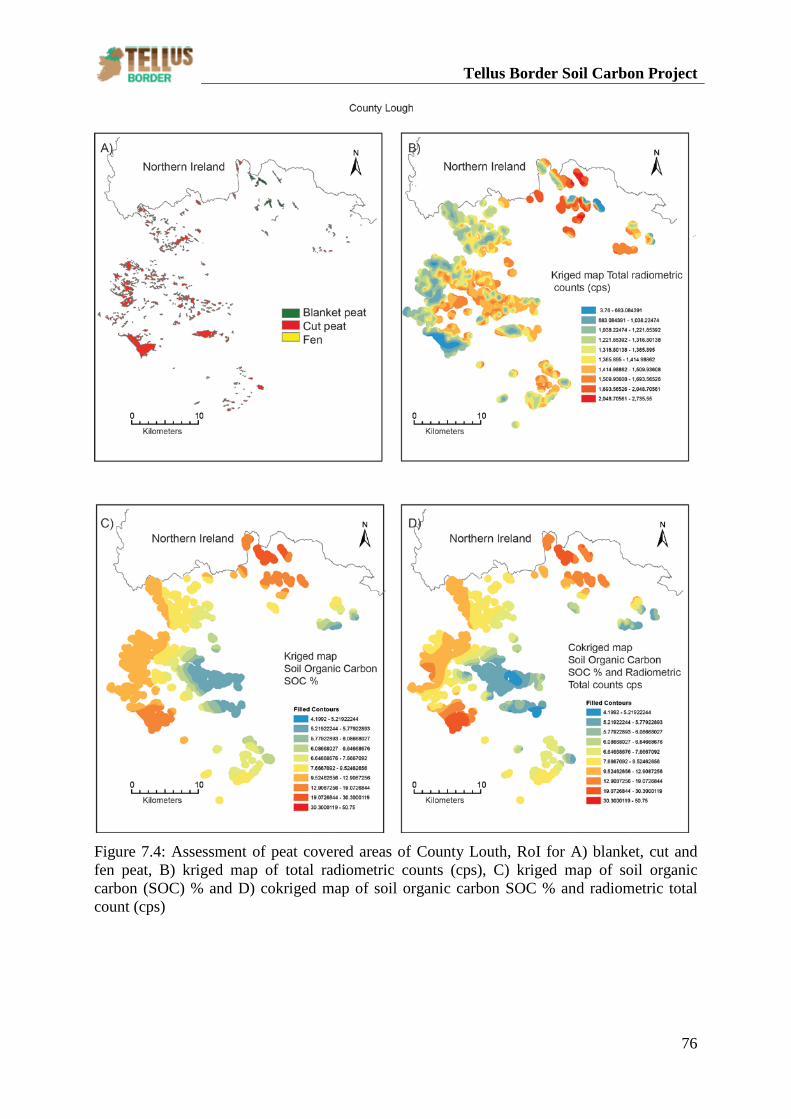
Tellus Border Soil Carbon Project
76
Figure 7.4: Assessment of peat covered areas of County Louth, RoI for A) blanket, cut and fen peat, B) kriged map of total radiometric counts (cps), C) kriged map of soil organic carbon (SOC) % and D) cokriged map of soil organic carbon SOC % and radiometric total count (cps)
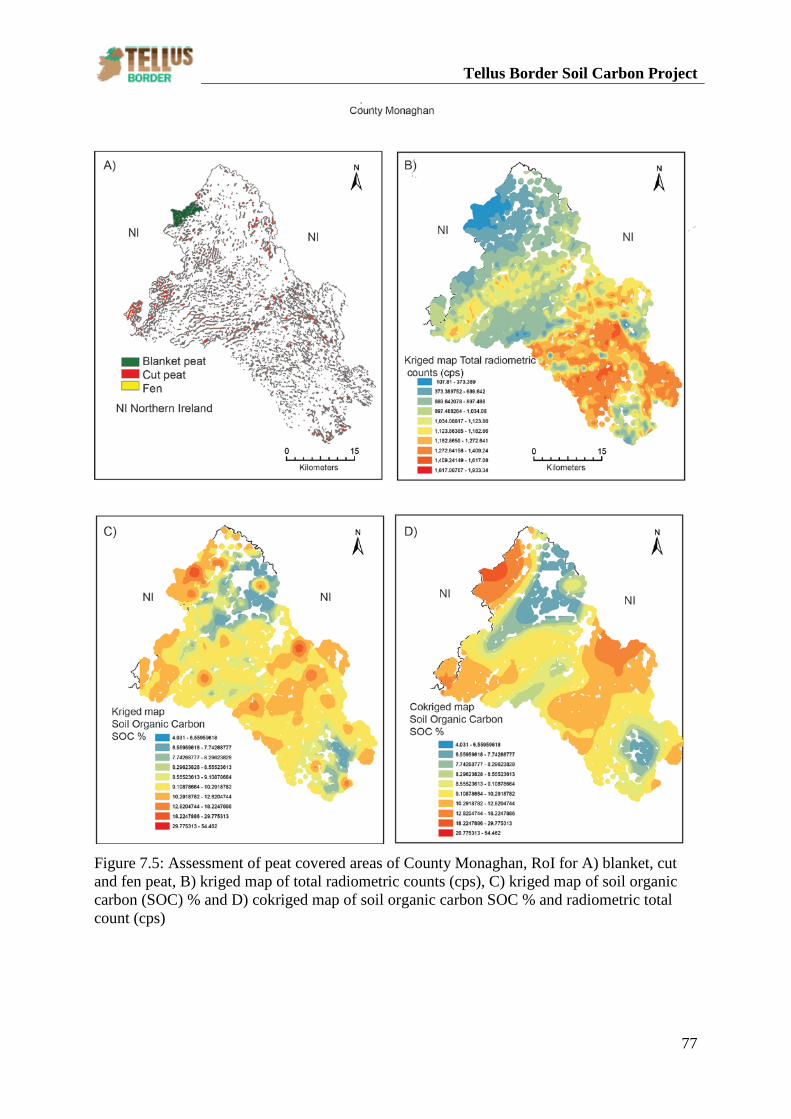
Tellus Border Soil Carbon Project
77
Figure 7.5: Assessment of peat covered areas of County Monaghan, RoI for A) blanket, cut and fen peat, B) kriged map of total radiometric counts (cps), C) kriged map of soil organic carbon (SOC) % and D) cokriged map of soil organic carbon SOC % and radiometric total count (cps)
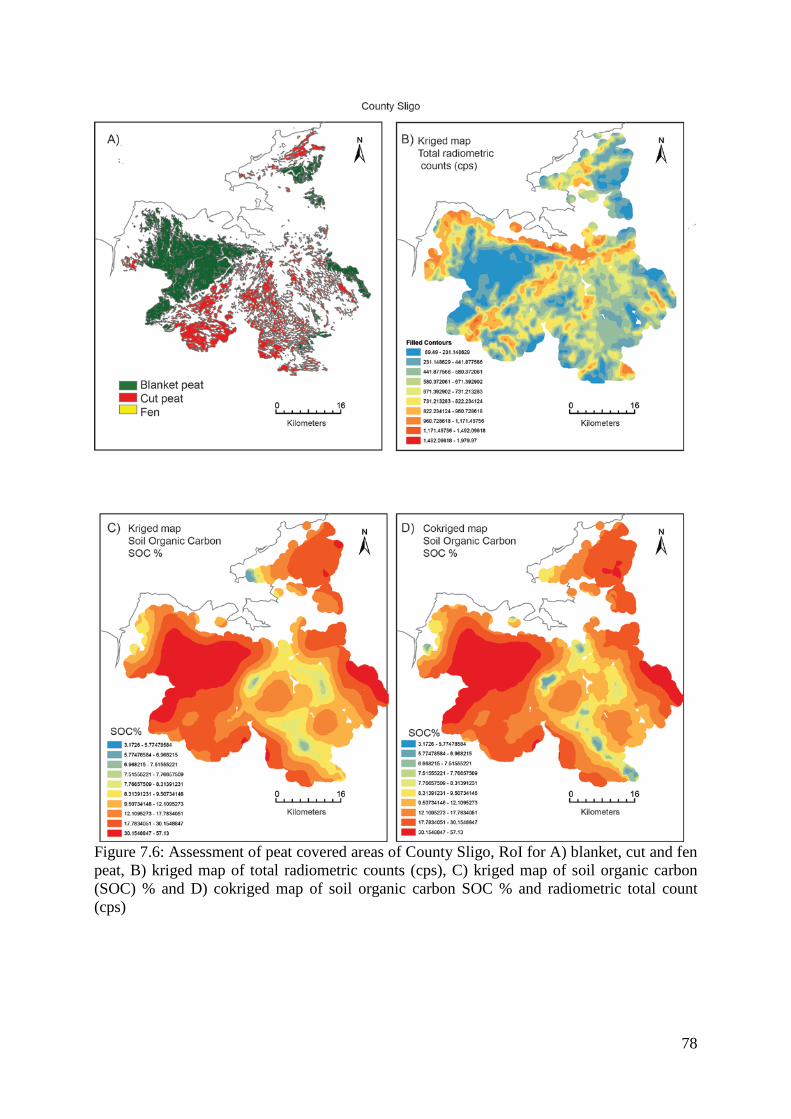
78
Figure 7.6: Assessment of peat covered areas of County Sligo, RoI for A) blanket, cut and fen peat, B) kriged map of total radiometric counts (cps), C) kriged map of soil organic carbon (SOC) % and D) cokriged map of soil organic carbon SOC % and radiometric total count (cps)
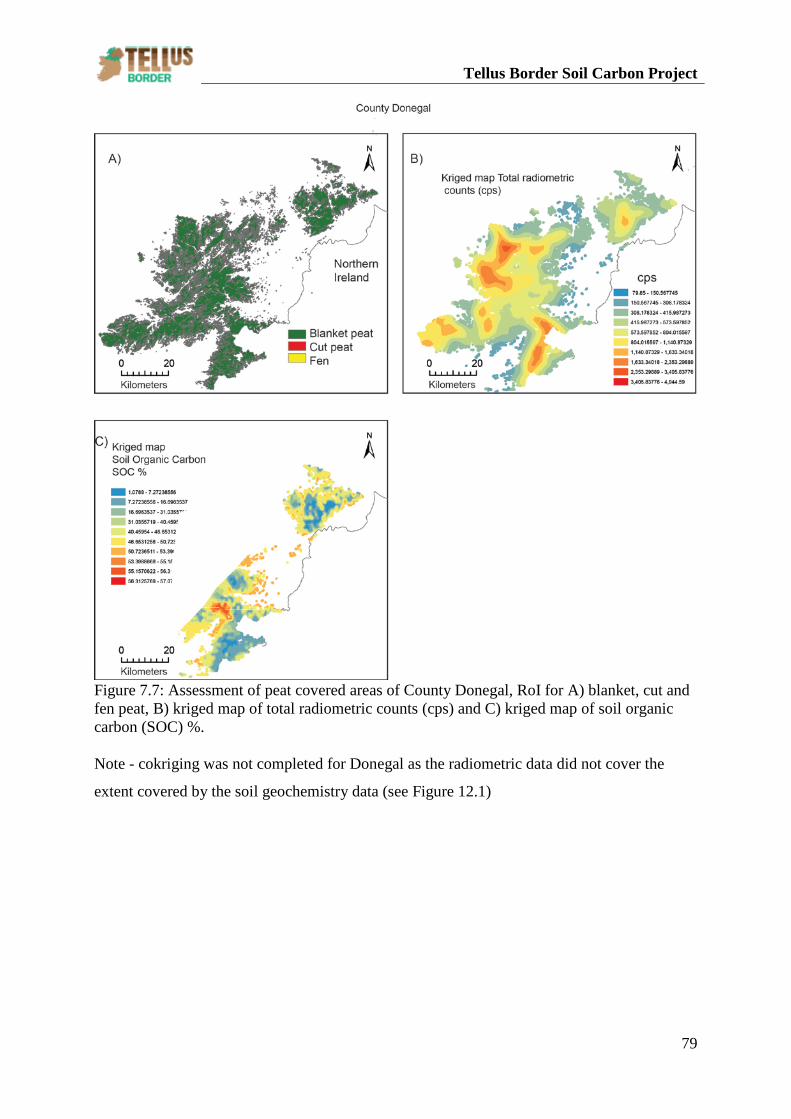
Tellus Border Soil Carbon Project
79
Figure 7.7: Assessment of peat covered areas of County Donegal, RoI for A) blanket, cut and fen peat, B) kriged map of total radiometric counts (cps) and C) kriged map of soil organic carbon (SOC) %. Note - cokriging was not completed for Donegal as the radiometric data did not cover the
extent covered by the soil geochemistry data (see Figure 12.1)
Tellus Border Soil Carbon Project
80
8. Carbon stock calculations
8.1 Volumetric Carbon Content calculations from Sliabh Beagh, pseudo transfer
function for selected field site locations
This part of the project was conducted to develop a statistical model for volumetric carbon
content (VCC) to 0.5 metres based on the radiometrics from an airborne survey. The study
was conducted over a 3.7 km section of test line 2, Sliabh Beagh, straddling counties
Monaghan, Tyrone and Fermanagh (section 5.1.2). This corresponded with other analytical
methods conducted over this test line throughout the two year project. The methodology
(outlined in sections 4.4 and 4.5) followed the sampling strategy employed for the entire
region of NI through the Tellus survey and the six border counties of the RoI through the
Tellus Border survey. Within these surveys, LOI data were obtained for 10,337 sample
locations in total, 6862 samples for NI from the Tellus project and 3475 for the RoI from the
Tellus Border project. Therefore the results obtained along the test line for volumetric carbon
content (VOC) can be related to the Tellus Border geochemistry survey as they were taken on
the same sampling support. This study has shown how data from the radiometric airborne
survey can be utilised to establish volumetric carbon content across the region.
8.2 Evaluation and validation of modelled case studies for NI regional study and
assessment of peatland in RoI
The results from the VCC study can be used to improve scientific knowledge regarding the
effective capacity of soil carbon sources and sinks. In order to accurately assess volumetric
carbon content the value for bulk density of the material being analysis is of paramount
importance (section 4.4.3; equation 2). Much debate exists as to an appropriate value for bulk
density for peat (pers. comm., TAG 3 meeting 12th June 2012). The fieldwork investigation
undertaken as part of the Soil Carbon Project has provided accurate data with regards to a
representative sampling strategy for a bulk density value for peat in the Sliabh Beagh study
area. The geostatistical methodology used throughout this project can then be utilised to
provide a value for blanket peatland in NI and the border regions of the ROI. The
investigation into the geochemistry on site undertaken in the same sampling strategy as the
Tellus Border project allows further inferences to be made regarding carbon stock
calculations and the importance of this study for updating current databases. This report has
presented the SOC data for the whole region of NI and the ROI however to date, a dataset of
bulk density data does not exist to calculate volumetric carbon content. The field site
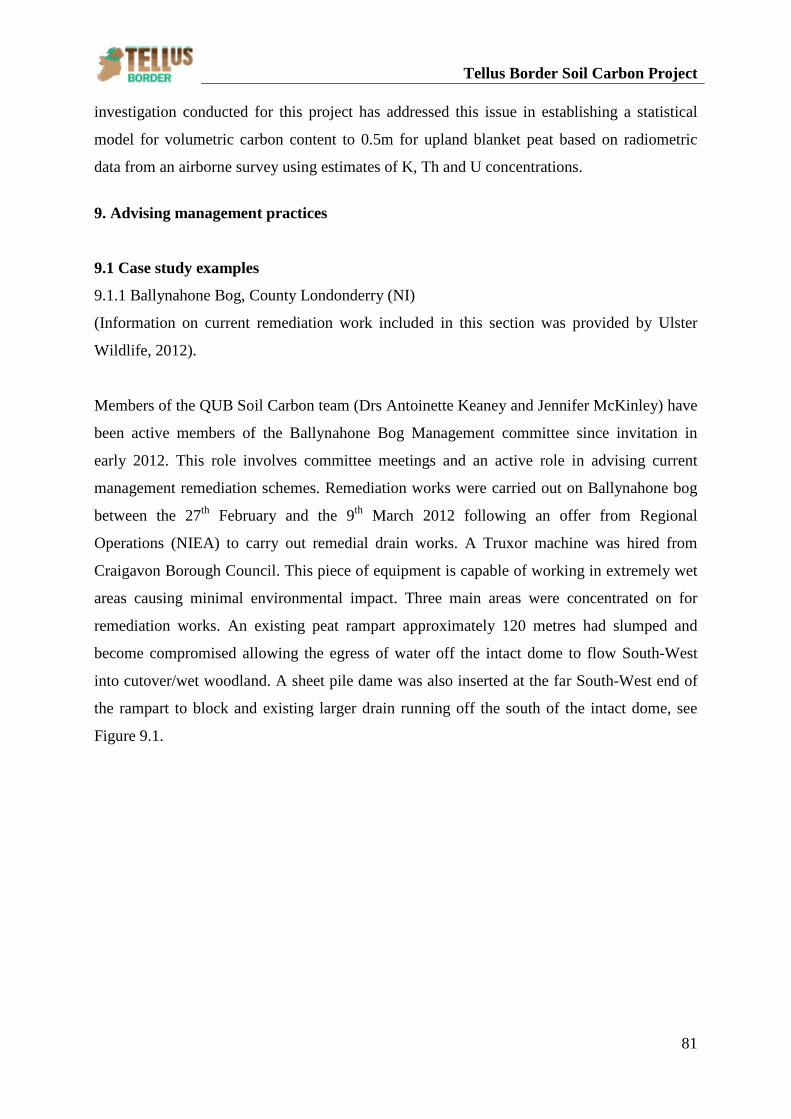
Tellus Border Soil Carbon Project
81
investigation conducted for this project has addressed this issue in establishing a statistical
model for volumetric carbon content to 0.5m for upland blanket peat based on radiometric
data from an airborne survey using estimates of K, Th and U concentrations.
9. Advising management practices
9.1 Case study examples
9.1.1 Ballynahone Bog, County Londonderry (NI)
(Information on current remediation work included in this section was provided by Ulster
Wildlife, 2012).
Members of the QUB Soil Carbon team (Drs Antoinette Keaney and Jennifer McKinley) have
been active members of the Ballynahone Bog Management committee since invitation in
early 2012. This role involves committee meetings and an active role in advising current
management remediation schemes. Remediation works were carried out on Ballynahone bog
between the 27th February and the 9th March 2012 following an offer from Regional
Operations (NIEA) to carry out remedial drain works. A Truxor machine was hired from
Craigavon Borough Council. This piece of equipment is capable of working in extremely wet
areas causing minimal environmental impact. Three main areas were concentrated on for
remediation works. An existing peat rampart approximately 120 metres had slumped and
become compromised allowing the egress of water off the intact dome to flow South-West
into cutover/wet woodland. A sheet pile dame was also inserted at the far South-West end of
the rampart to block and existing larger drain running off the south of the intact dome, see
Figure 9.1.
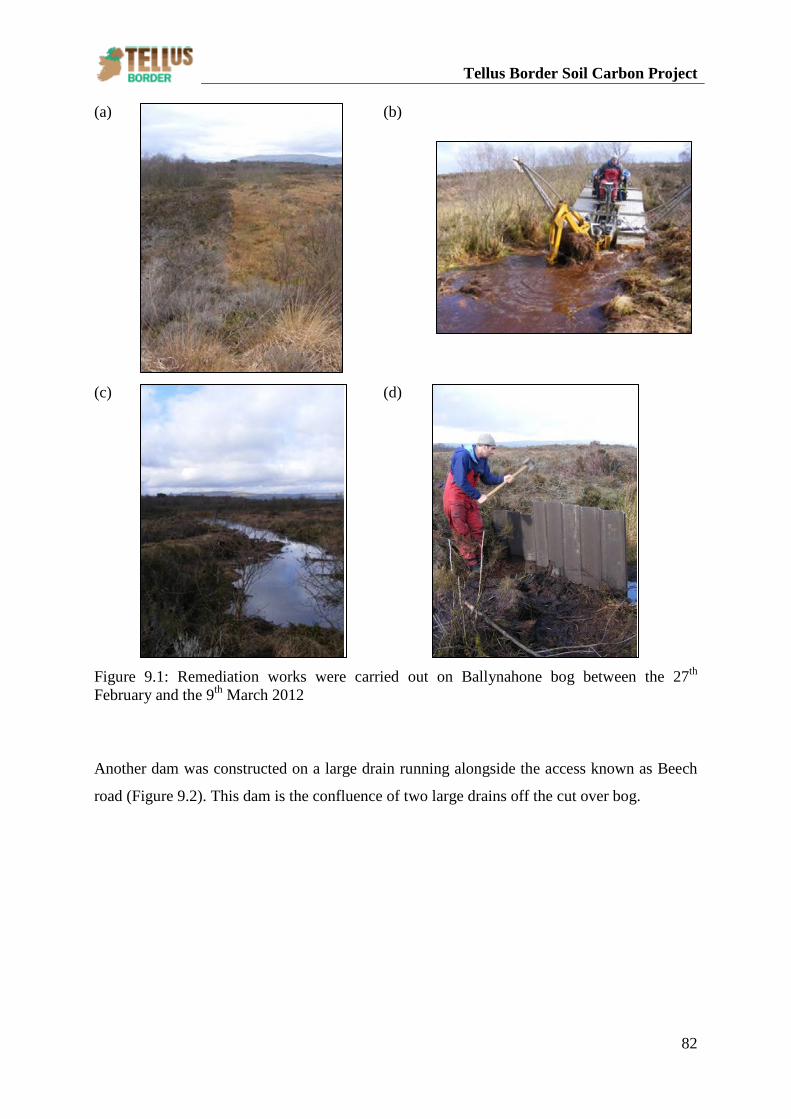
Tellus Border Soil Carbon Project
82
(a)
(b)
(c)
(d)
Figure 9.1: Remediation works were carried out on Ballynahone bog between the 27th February and the 9th March 2012
Another dam was constructed on a large drain running alongside the access known as Beech
road (Figure 9.2). This dam is the confluence of two large drains off the cut over bog.
Tellus Border Soil Carbon Project
83
(a)
(b)
Figure 9.2: Construction of a dam during remediation works at Ballynahone Bog, County Londonderry (images provided by Ulster Wildlife 2012). These are two examples of the current remediation work on Ballynahone Bog. The use of
GNSS as part of the Tellus Border Soil Carbon project (Section 4.6) was welcomed by the
management committee as an opportunity to establish the efficiency of the damming work
and it has helped to inform future remediation work.
Further to this management work and following on from the involvement of the Tellus Border
soil carbon project a hydrological survey was conducted in association with Trinity College
Dublin. This included mapping the location of drains within the raised bog. In conjunction
with the Tellus Border Soil Carbon project geophysical data, this will provide information to
advise the Ballynahone Bog Management committee on the most suitable locations for
piezometer and rainfall gauge installation to monitor and assistant management practices.
9.1.2 Sliagh Beagh, counties Tyrone and Fermanagh (NI) and county Monaghan (RoI)
The Tellus Border soil carbon team have also been involved with the Northern Ireland
Environment Agency (NIEA) and the Royal Society for the Protection of Birds (RSPB) in
relation to the conservation management plan for Sliagh Beagh upland peat covered area.
RSPB are involved in restoring this site to the original condition before peat extraction
occurred in the area. The integration of the Tellus and Tellus Border data provided a unique
opportunity to investigate the condition of the extensive upland peat area as this site straddles
the border of NI and the ROI. As the Tellus data were obtained for this site on the 19th, 20th
and 21st July 2005 and Tellus Border data on the 7th, 10th, 12th and 21st November 2011 it
provided the unique opportunity to conduct ground surveys along the test line to provide
ground-truthing data for assessment of the condition of the peat in the area over this time
Tellus Border Soil Carbon Project
84
period. The condition of the upland peat area in 2005 can be compared with results from the
survey conducted in 2011. Fieldwork undertaken at different time periods throughout the soil
carbon project (fieldwork was completed in July 2013) provided supplementary information
on the conditional assessment of the peat. Discussion with NIEA highlighted the requirement
to provide auxiliary information for the designation of areas of blanket bog and wet heathland.
The depths crucial for this assessment are between 0.5 – 1m. NIEA have undertaken a
conditional assessment of vegetation, including Sphagnum cover, on their designated remit
areas every six years using 2m quadrats (SBCMP; NIEA, per. Comms.). This project has
developed a methodology integrating ground and airborne data that provides a temporal
assessment of peat changes when compared with previously conducted peat surveys (Fig. 5.7)
that could be used to aid designation of blanket bog and wet heathland and integrated with
vegetation assessment surveys.
Data from the two airborne surveys and field site investigations provide information (SOC,
derived from LOI and airborne radiometric data) integrated with field-based measurements
that provide information on the conditional assessment of peat for both lowland raised bog
and upland peat areas which can be used as the basis for future restoration projects. Contact
with the management committees and organisations at these sites have indicated areas for
further collaborative research.
9.2 Benefit of temporal monitoring for restoration
Recent centuries have seen the exploitation of peatlands for many reasons including domestic
peat cutting for fuel (turbary rights), industrial peat extraction, afforestation, and reclamation
of land for agriculture. As a result the significance of management and maintenance of these
irreplaceable and important sites have become of paramount importance to governmental
organisations. The Peatland reports (Grant et al., 1997; Tomlinson et al., 1998) were
commissioned following European Union legislation that required “member states to be
responsible for the designation and management of internationally important nature
conservation sites within their jurisdiction; that is, proposed Natura 2000 or European sites”
(Grant et al. 1997, Vol. 1: 3). The Tellus and Tellus Border survey data and the methodology
developed through this Soil Carbon project provide an assessment of the condition of
peatlands in 2005/2006 and 2011/2012. In addition, fieldwork undertaken throughout the
project can be used as a conditional assessment and provide ground truthing for the test lines
and study sites over the 2011 – 2013 period (see Table 4.2). Previous studies (see Section 3)
Tellus Border Soil Carbon Project
85
have involved investigation on a site by site basis. Section 9.1 discussed how the
collaboration of research institutions with government agencies and non-governmental
organisations allows the assessment of current management practices. The incorporation of
findings from this research project and on-the-ground remediation studies provides the basis
for future management plans and maximize the best use of budgets.
9.3 Management practices – 1990 update to present day (2013)
Discussion with the Technical Advisory Group established as part of the Soil Carbon project
highlighted the importance of land use changes in relation to monitoring and reporting on
changes in soil carbon. Results using the test lines selected as part of project are particularly
beneficial with regards to this assessment (Section 4.1). These test lines at Kinlough, county
Leitrim and Sliabh Beagh, counties Fermanagh, Tyrone (NI) and county Monaghan (RoI),
were selected as they covered areas of varying land use including, for this project, peat
covered areas. The geophysical data collected as part of the Tellus and Tellus Border projects
covered the entire region of NI and RoI respectively. Analysis of the radiometric data for
peatlands (Section 7.1) illustrates the regional variation for cut, intact and fen peat. Data
obtained from the two test line location sites can be incorporated into other land use
management zones. Key information includes the impact of agricultural activity on peatlands
as a result of agriculture, grazing and crop land. Altering drainage systems on peat bogs to
lower the water table and allow crops to be planted results in a release of carbon due to the
bog drying out. Crucially, as discussed in Section 6.1.1.2, drying out of a peat bog may be an
irreversible process due to the compression and compaction which occurs as the peat dries
out. Use of land use information and accurate field boundaries, incorporated with airborne
geophysical data (as provided by the Tellus and Tellus Border projects) could provide an
assessment of land use changes and enable the impacts of changes to peat covered areas to be
examined in relation to carbon stock assessment.
Links with the EPA Climate Change Research Programme have also been established.
Findings from the Soil Carbon Project can be seen to augment Themes 1 and 2 of this
programme. Theme 1 is Greenhouse Gas Emissions, Sinks and Management Systems. The
objective of this programme is to “advance bottom-up analysis of GHG emissions and sinks,
and to improve methodologies used in the National GHG Inventory reported to the EU and
UN, and couple this to independent top-down verification systems” (EPA, 2013; O’Reilly et
al., 2012)). Theme 2 is Ireland and Future Climate, Impacts and Adaptation. “This theme
Tellus Border Soil Carbon Project
86
provides analysis of climate change conditions and temporal and spatial scales that are useful
for decision making and adaptation in Ireland. Research is focused on identification of
vulnerabilities and optimising adaptation responses including responses to extreme events”
(EPA, 2013). The Soil Carbon Project falls under this remit as the research proposed under
this theme by the EPA involves development and monitoring observation systems. The results
and research presented throughout this report have highlighted how the developed
geostatistical methodology can be used as a tool to aid management and monitoring of
delicate peat bogs and in turn soil carbon stocks. The EPA also discusses the need to make
information available for policy, planning and environmental decision making. The TAG for
this project encompassed experts from a broad range of organisations (see Section 15). This
provided a resource of information and offered the opportunity to present findings which
could be used to manage peatlands at risk allowing the results to directly impact ‘on the
ground’ operations.
10. Discussion Improved peat thickness estimation produced through the integration and calibration of the
Tellus and newly acquired Tellus Border data against previously recorded peat depth data and
peat surveys is beneficial for updating carbon stock estimations.
10.1 Global significance of peatland monitoring
The importance of peatlands, particularly in relation to conservation and restoration, is not a
new realisation and work has been ongoing for many years. The historical reports from the
peatland surveys (1996/97 and 1997/1998) were undertaken to establish baseline data on the
physical extent and condition of internationally important peatland sites in Northern Ireland
(Grant et al., 1997: 3). The vision behind these reports was that management plans could be
assessed against these baseline data and that longer term monitoring of sites would enable the
efficiency of conservation practices to be examined. The importance of peatlands globally
was highlighted at the IUCN World Conservation Congress, 6-12 September 2012 in Jeju,
South Korea. Projects such as the IUCN One programme 2013 – 2016 include the UK’s
peatland conservation and restoration projects along with other countries such as China,
Russia, Germany and Australia. Two of the recommendations which came out of the IUCN
congress included a) working with businesses and private sector to secure funding that reflects
the benefits of peatlands for biodiversity, water and carbon and b) international sharing of
Tellus Border Soil Carbon Project
87
science to quantify the carbon and other benefits of peatland conservation and restoration
(IUCN 2011).
10.2 Advantages of remotely sensed data
Issues relating to accurate volumetric calculations have been discussed throughout this project
report. Section 6.1 detailed how volume calculations can vary for one site thus highlighting
the necessity for more accurate interpretations of peat depth for volumetric calculations.
Previous work (Grant et al., 1997; Tomlinson et al., 1998; Tomlinson and Davidson 2000)
highlighted issues related to sampling strategies across peat areas, delimitation of site area;
calculations from peat depth data and the need for standardised measurement of peat bulk
density. Grant et al., (1997) discussed how reference to historical 1954 mean peat depths for
Ballynahone bog recorded different mean peat depths for individual raised bogs (3.06m mean
peat depth recorded in 1954 compared to 4.76 mean peat depth in 1996/97). One of the
reasons proposed by Grant et al, (1997) was the different sampling methodologies employed
by the studies. The more recent surveys had a greater density of sample points across the sites
which were located more centrally (on the raised bog) than those of the survey conducted in
1954. The advantage of using remotely sensed data is that a greater density and spatial
coverage of measurements can be generated. Ground truthing at selected sample locations
using peat probes is invaluable for obtaining accurate, reliable data on the ground against
which remotely sensed data can be corroborated. This would result in a reduction in time, cost
and resources required to survey individual peat bogs and conduct peat surveys. Sensitive
habitats such as peat, are at risk from ground based sampling strategies, with damage to
delicate vegetation. This report has demonstrated the value of remotely sensed data such as
the airborne geophysical data when used in conjunction with targeted sampling including
complimentary techniques such as GPS and GPR to calibrate and corroborate the airborne
data. In this way, large areas of peat covered areas can be assessed non-destructively allowing
the condition and health of the peat bog to be monitored and in response to management
practices.
10.3 Benefit of remotely sensed data for peat management strategies
The aim of this research was to develop a methodology to improve estimates of carbon in soil
and peat depths across Northern Ireland and the bordering counties of the Republic of Ireland
and in addition to contribute to peat management in the study area. Ballynahone Bog, County
Tellus Border Soil Carbon Project
88
Londonderry (NI) was chosen as a case study as it provided an example of the complex,
variable nature of peatland habitats which in turn must be reflected in targeted management
and restoration practices on a site specific basis. The bordering margins of Ballynahone Bog
have been ‘cut-over’ in the past with little remaining as ‘intact’, the margins are more
accurately described as ‘less disturbed’. The western extent of the bog is bordered by drains
and cutting but its surface has had little disturbance. The eastern end of the bog had numerous
parallel drains 5-10m apart cut in preparation for commercial peat cutting for which
permission was then revoked. These drains have since been dammed. Grant et al., (1997)
suggest that the hydrology of Ballynahone bog can be considered in three management
compartments which are interconnected. It was recommended that monitoring of this site
should reflect this compartmentalisation (Grant et al., 1997: 29). The geostatistical
methodology developed in this project highlighted the compartmentalisation of the bog. A
discrepancy on the western extent of the bog was indicated where radiometric data did not
correlate with the historical peat depth data. Discussion with site managers for Ballynahone
Bog, the Ulster Wildlife Trust (UWT) and the Northern Ireland Environment Agency (NIEA),
highlighted the western section of the bog as having ‘a rhododendron infestation’. This
information impacts management strategies as rhododendron occur in areas where peat is
drying out and thus can be used as a proxy for the water content of the bog. This stresses the
necessity for ground truthing remotely sensed data and the importance of knowledge of prior
and current peat management practices. The eastern section of Ballynahone bog was where
historical drainage work and cutting had occurred. Lower radiometric values were observed
for this region. Analysis of the remotely sensed data allows areas to be targeted on the ground
which has time and cost benefits for management practices. The northern and eastern section
of this bog is the largest management unit on site and includes drained and un-drained
sections, undisturbed bog and cut-over areas on the margin. Management issues include
assessing whether the bog has sufficient water holding capacity to maintain wet surface
conditions in this area (Grant et al., 1997). This case study demonstrates the importance of
continued monitoring of peatlands and the value of integrating remotely sensed data with
ground based techniques and a monitoring strategy.
11. European Regulatory Frameworks
The findings from this Soil Carbon project contribute to inform national policy that are driven
by the following EU regulatory frameworks.
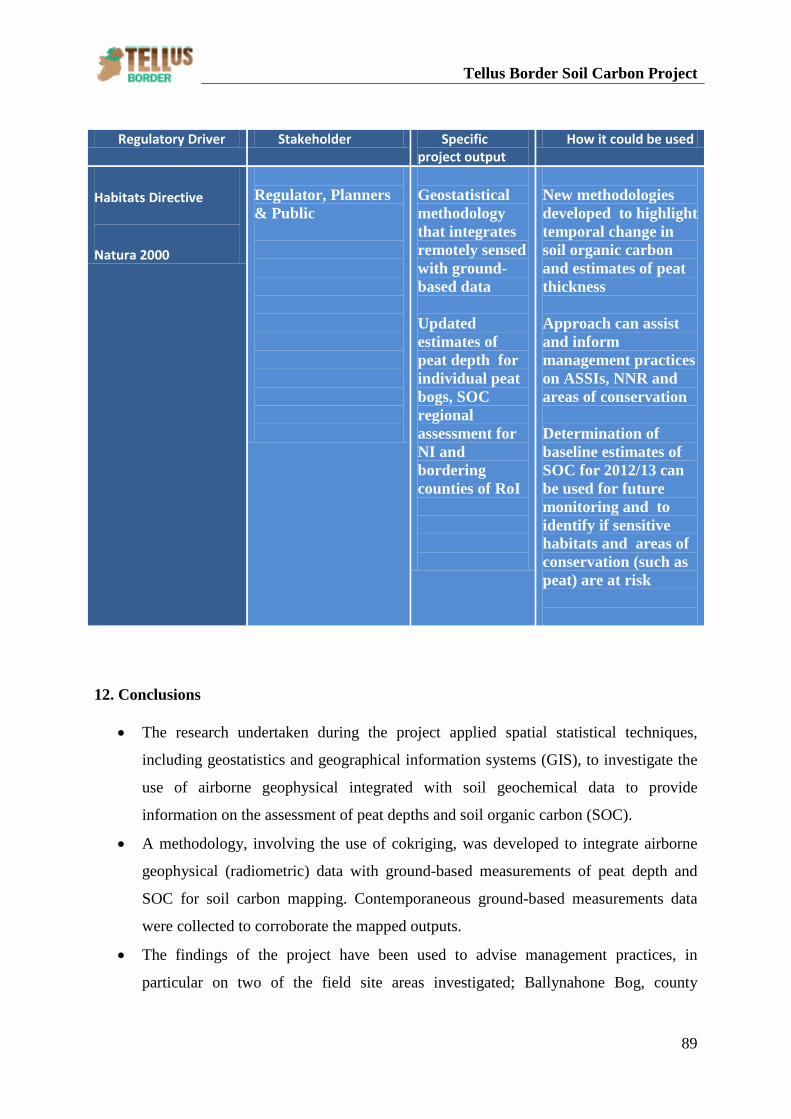
Tellus Border Soil Carbon Project
89
Regulatory Driver Stakeholder Specific project output
How it could be used
Habitats Directive
Natura 2000
Regulator, Planners & Public
Geostatistical methodology that integrates remotely sensed with ground-based data Updated estimates of peat depth for individual peat bogs, SOC regional assessment for NI and bordering counties of RoI
New methodologies developed to highlight temporal change in soil organic carbon and estimates of peat thickness Approach can assist and inform management practices on ASSIs, NNR and areas of conservation Determination of baseline estimates of SOC for 2012/13 can be used for future monitoring and to identify if sensitive habitats and areas of conservation (such as peat) are at risk
12. Conclusions
• The research undertaken during the project applied spatial statistical techniques,
including geostatistics and geographical information systems (GIS), to investigate the
use of airborne geophysical integrated with soil geochemical data to provide
information on the assessment of peat depths and soil organic carbon (SOC).
• A methodology, involving the use of cokriging, was developed to integrate airborne
geophysical (radiometric) data with ground-based measurements of peat depth and
SOC for soil carbon mapping. Contemporaneous ground-based measurements data
were collected to corroborate the mapped outputs.
• The findings of the project have been used to advise management practices, in
particular on two of the field site areas investigated; Ballynahone Bog, county
Tellus Border Soil Carbon Project
90
Londonderry (NI) and Sliabh Beagh, counties Tyrone and Fermanagh (NI) and county
Monaghan (RoI).
• Data from the two airborne surveys and field site investigations provided information
(SOC, derived from LOI and airborne radiometric data) integrated with field-based
measurements that have produced information on the conditional assessment of peat
for both lowland raised bog and upland peat areas which can be used as the basis for
updating estimates of soil organic carbon across NI and the border regions of the RoI
with minimal impact destruction to sensitive habitats such as peat.
• The results from this project will support the requirements of the UN Framework
Convention in providing information and knowledge of effective capacity of soil
carbon sources and sinks.
• The project represents an investigation and integration of data on soil carbon and peat
thickness and has complemented and augmented research currently on-going in the
Republic of Ireland and Northern Ireland
• The use of airborne geophysical data has been investigated to refine the relationship
between reduced radioactivity signal and peat depth in peat covered areas. This was
accomplished through the examination of previous survey data, data from the Tellus
(NI) and Tellus Border (RoI) projects integrated with field-based measurements.
• The findings have assisted in determining the accuracy and limitations of modelling
soil carbon changes in peat stocks by investigating the attenuation of gamma radiation
from underlying rocks.
• The results have a broader significance to promote the use of geostatistics and remote
sensing for spatial estimates of carbon stock.
13. Future work
• The monitoring equipment (DGPS, rainfall gauges, piezometer and weather station) at
Ballynahone Bog, County Londonderry (Section 4.6) was installed to collect data and
monitor changes over time. It would be beneficial for this experiment installation
setup to remain in situ after the Soil Carbon project has been completed for further use
for management practices and for future teaching materials (Section 13.4). Installation
for a longer time period would provide data for a comprehensive and detailed temporal
analysis regarding weather systems and scientific assessment of peatlands and their
response to management practices.
Tellus Border Soil Carbon Project
91
• Extending the airborne survey over the county of Donegal would be beneficial to
enable the geostatistical methodology within this Soil Carbon project to be applied due
to the extensive cover of peat in this county.
14. Dissemination of Research - Conference presentations and Training 14.1 Training
• European LiDAR Mapping Forum (ELMF), 29-30th November 2011, Salzburg Congress, Austria
• Successful completion of STEM Ambassador training as part of STEMNET – Science, Technology, Engineering and Mathematics Network), 25th January 2012.
• Peatland Passport for Ireland Educators Workshop, 26th June 2013, Bog of Allen Nature Centre, Lullymore, Rathangan, Co. Kildare.
14.2 Oral presentations and conference proceedings
• Robinson, M., Keaney, A., McKinley, J. and Ruffell, A. (15th February 2012), Peat Depth Assessment of Carbon Stocks Using Ground Penetrating Radar and Tellus Airborne Geophysical Data, Geophysical Association of Ireland (GAI), one day seminar on Environmental Geophysics, Engineers Ireland, 22 Clyde Road, Ballsbridge, Dublin 4 .
• Keaney, A., McKinley, J. and Ruffell, A. (18th February 2012), Soil Carbon and peat depth assessment using airborne geophysical data, 55th Irish Geological Research Meeting and Lithosphere workshop, 17-19th Feb 2012, University College Cork.
• Keaney, A., McKinley, J., Ruffell, A. and Graham, C. (19th April 2012) Peat
Thickness Modelling, Tellus Border annual technical seminar at Geoscience 2012, From Research to Jobs, Dublin Castle, 19-20th Apr 2012
• Keaney, A., McKinley, J., Ruffell, A., Robinson, M., Graham, C., Hodgson, J. and Desissa, M. (4th September 2012), Ground-truthing Airborne Geophysical Data for Carbon Stock Monitoring, European Association of Geoscientists and Engineers (EAGE), Remote Sensing Workshop, RS12, 3rd – 5th Sept 2012, Paris, France.
• Keaney, A., Robinson, M., McKinley, J. and Ruffell, A. (19th September 2012),
Application of spatial statistical techniques to correlate peat depths with airborne radiometric data, geoENV, IX Conference on Geostatistics for Environmental Applications, Valencia, 19th – 21st Sept 2012.
• Keaney, A., McKinley, J., Ruffell, A., Robinson, M., Graham, C., Hodgson, J. and Desissa, M. (18th October 2012), Correlation of peat depths with airborne radiometric data for carbon stock monitoring, International Peat Society (IPS)/IMTG MTO, Irish Peat Society Annual Meeting, Study Tour and Seminar, Westport, County Mayo, 15th – 18th October, 2012.
Tellus Border Soil Carbon Project
92
• Keaney, A., McKinley, J., Ruffell, A., Robinson, M., Graham, C., Hodgson, J. and Desissa, M. (2nd March 2013), Soil Carbon and Peat Depth Assessment - Ground-truthing Airborne Geophysical Data, 56th Irish Geological Research Meeting (IGRM), University of Ulster, Magee Campus, Derry, 1st – 3rd March 2013.
• Keaney, A., McKinley, J., Ruffell, A., Robinson, M., Graham, C., Hodgson, J. and
Desissa, M. (10th April 2013) Peat Depth Assessment Using Airborne Geophysical Data for Carbon Stock Modelling, European Geosciences Union, General Assembly, Vienna, Austria, 7th – 12th April 2013.
• Keaney, A., McKinley, J., Ruffell, A., Robinson, M., Graham, C., Hodgson, J. and
Desissa, M. (23rd April 2013) Tellus Border Soil Carbon and Peat Depth Assessment - The application of spatial statistical techniques to correlate peat depths with airborne radiometric data for carbon stock modelling, ERASMUS lecture, Institute of Geography, Faculty of Science, Pavol Jozef Šafárik University in Košice, 22nd – 26th April 2013.
• McKinley, J., Keaney, A. and Ruffell, A. (4th September 2013) A spatiotemporal
remote sensed assessment of peat covered areas using airborne radiometrics, 15th International Association for Mathematical Geosciences (IAMG) Conference, Madrid, 2nd – 6th September 2013.
14.3 Peer reviewed paper publications
Keaney, A., McKinley, J, Ruffell, A., Robinson, M., Graham, C., Hodgson, J. and Desissa, M. (2013a) Tellus Border – Soil Carbon and Peat Depth Assessment using Airborne Geophysical Data, Peatlands International 1/2013: 36-39. Keaney, A., McKinley, J., Graham, C., Robinson, M. and Ruffell, A. (2013b) Spatial statistics to estimate peat thickness using airborne radiometric data, Spatial Statistics vol. 5: 3-24. http://dx.doi.org/10.1016/j.spasta.2013.05.003. McKinley, J., Keaney, A. and Ruffell, A. (2013) A spatiotemporal remotely-sensed assessment of peat covered areas using airborne radiometrics. Lectures Notes in Earth System Sciences. Proceedings of the 15th Annual Conference of the International Association of Mathematical Geosciences. Eds. E. Pardo Igúzquiza, C. Guardiola Albert, J. Heredia Díaz, L.Moreno Merino and J.J. Durán Valsero. 225-229. ISBN: 978-3-642-32407-9, DOI 10.1007/978-3-642-32408-6. 14.4 Development of teaching materials
14.4.1 Nuffield/Sentinus Bursary scheme
Ryan MacPherson completed a placement in the School of Geography, Archaeology and
Palaeoecology as part of the Nuffield/ Sentinus bursary scheme. This scheme provides Lower
six students (Key Stage 5, undergoing the two final years of secondary education, aged 17-18
years of age) with an opportunity to undertake research placements and work alongside
professional scientists, technologists, engineers and mathematicians. These placements take
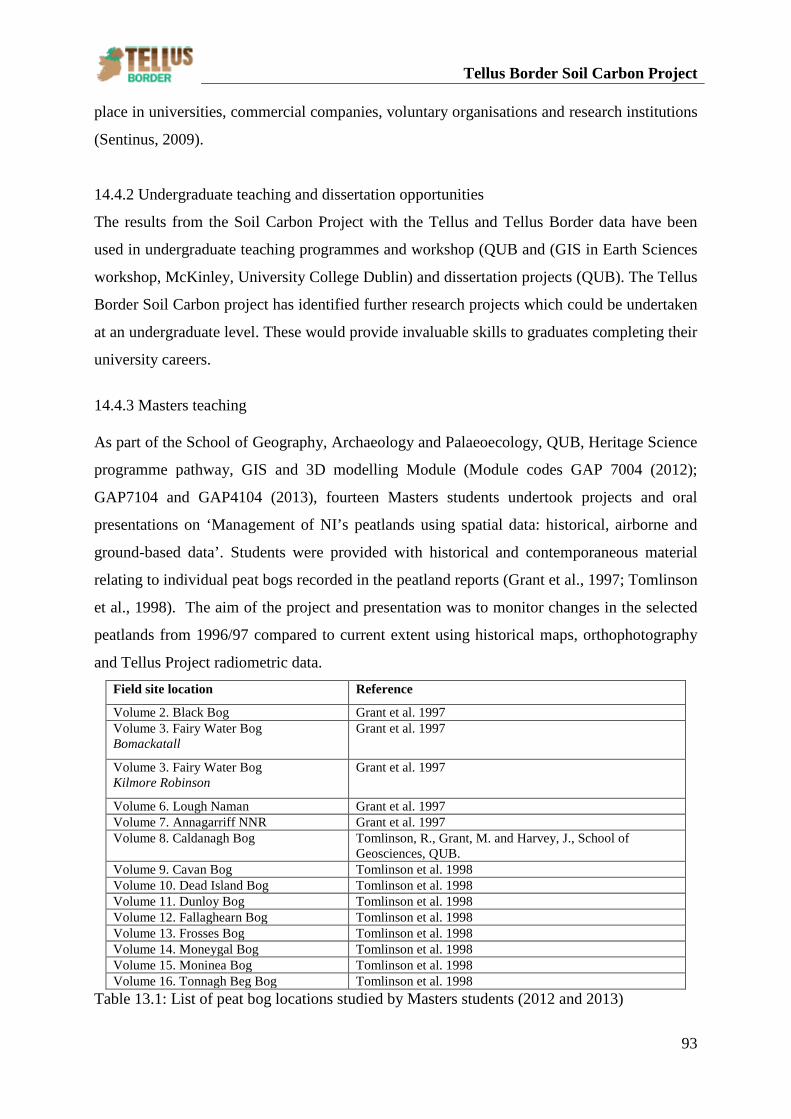
Tellus Border Soil Carbon Project
93
place in universities, commercial companies, voluntary organisations and research institutions
(Sentinus, 2009).
14.4.2 Undergraduate teaching and dissertation opportunities
The results from the Soil Carbon Project with the Tellus and Tellus Border data have been
used in undergraduate teaching programmes and workshop (QUB and (GIS in Earth Sciences
workshop, McKinley, University College Dublin) and dissertation projects (QUB). The Tellus
Border Soil Carbon project has identified further research projects which could be undertaken
at an undergraduate level. These would provide invaluable skills to graduates completing their
university careers.
14.4.3 Masters teaching As part of the School of Geography, Archaeology and Palaeoecology, QUB, Heritage Science
programme pathway, GIS and 3D modelling Module (Module codes GAP 7004 (2012);
GAP7104 and GAP4104 (2013), fourteen Masters students undertook projects and oral
presentations on ‘Management of NI’s peatlands using spatial data: historical, airborne and
ground-based data’. Students were provided with historical and contemporaneous material
relating to individual peat bogs recorded in the peatland reports (Grant et al., 1997; Tomlinson
et al., 1998). The aim of the project and presentation was to monitor changes in the selected
peatlands from 1996/97 compared to current extent using historical maps, orthophotography
and Tellus Project radiometric data. Field site location Reference
Volume 2. Black Bog Grant et al. 1997 Volume 3. Fairy Water Bog Bomackatall
Grant et al. 1997
Volume 3. Fairy Water Bog Kilmore Robinson
Grant et al. 1997
Volume 6. Lough Naman Grant et al. 1997 Volume 7. Annagarriff NNR Grant et al. 1997 Volume 8. Caldanagh Bog Tomlinson, R., Grant, M. and Harvey, J., School of
Geosciences, QUB. Volume 9. Cavan Bog Tomlinson et al. 1998 Volume 10. Dead Island Bog Tomlinson et al. 1998 Volume 11. Dunloy Bog Tomlinson et al. 1998 Volume 12. Fallaghearn Bog Tomlinson et al. 1998 Volume 13. Frosses Bog Tomlinson et al. 1998 Volume 14. Moneygal Bog Tomlinson et al. 1998 Volume 15. Moninea Bog Tomlinson et al. 1998 Volume 16. Tonnagh Beg Bog Tomlinson et al. 1998
Table 13.1: List of peat bog locations studied by Masters students (2012 and 2013)
Tellus Border Soil Carbon Project
94
14.4.4. Science and Schools at Stormont event
The Science and Schools at Stormont event was organised by The Stormont Executive,
School of Geography, Archaeology and Palaeoecology, Queen’s University and the
Geological Survey of Northern Ireland. This event took place on Tuesday 22nd January 2012
in the Long Gallery, Parliament Buildings, Stormont. The purpose of this event was to look at
the role that science plays in informing and making policy and to facilitate the opportunity for
pupils to engage directly with MLAs and geoscientists with an engaging, interactive role-play
event. The event was organised for Year 11 pupils aged 15 years who were studying STEM
subjects and/or politics from schools in the South Belfast Learning Community. The day was
divided into two parts. The first involved invited MLAs taking part in a ‘speed dating’ event.
The Soil Carbon’s team primary role was to be an informed mentors - a geoscientist ‘buddy’ -
for eight groups of school pupils. This role was to assist students in asking questions related
to careers and creating constructive questions to make an informed decision about a fictitious
planned goldmine. The second part of the day involved assisting in a decision-making role
play exercise. A fictitious planning application for a gold-mine in NI using the Tellus project
data was explored through the use of science behind this proposed development. This activity
provided the opportunity to meet with upcoming scientists and provided a forum to discuss
the numerous directions which can be taken when considering a job in a scientific field.
15. Added value for the project 15.1 Tellus Border project collaboration
Collaboration between the Soil Carbon project, QUB) and the Wetlands project, Dundalk
Institute of Technology, (DkIT) involved assistance with techniques used throughout the Soil
Carbon project (GPR and electrical resistivity). These techniques were utilised at
Rockmarshall in Jenkinstown, County Louth, approximately 7km north-east of Dundalk to
assess the wet lands in the area. Analysis of the results illustrated that both wetland and peat
bog habitats could be investigated using the application of ground penetrating radar (GPR).
Field work investigation at the Sliabh Beagh test line location site highlighted the potential for
depth to bedrock to be assessed using the application of ground penetrating radar (GPR). The
results suggest that GPR data could be incorporated with EM data to assess the depth to
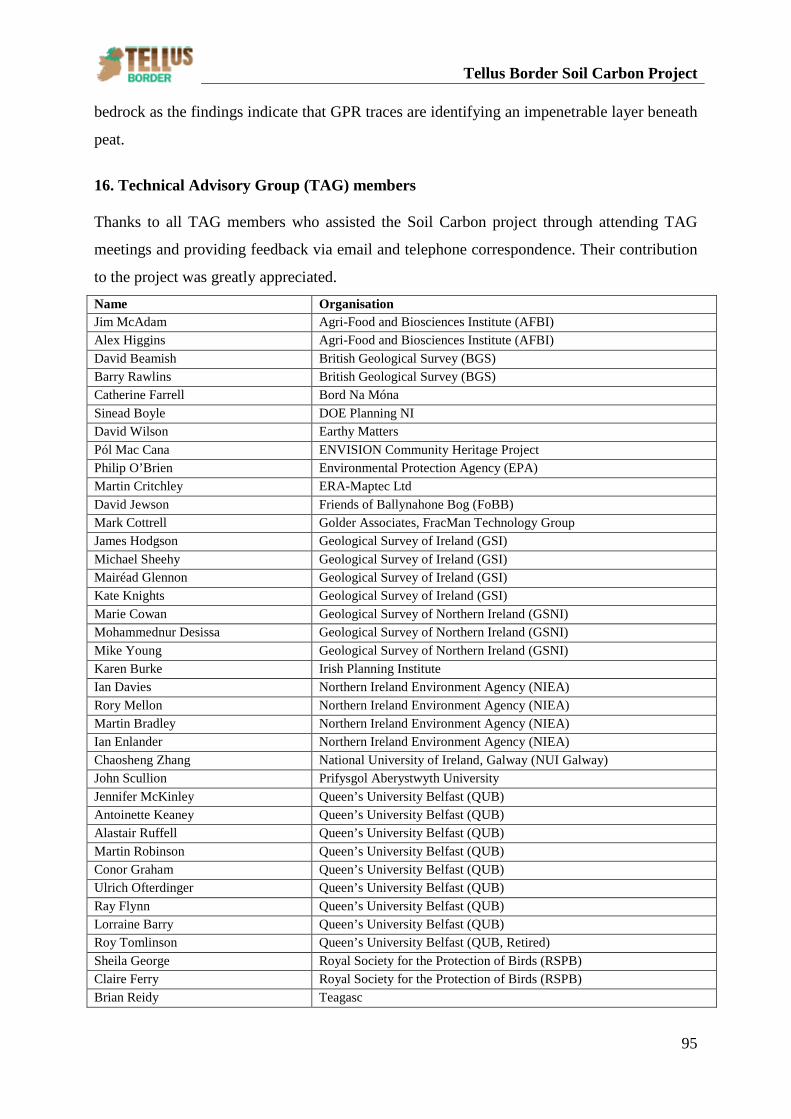
Tellus Border Soil Carbon Project
95
bedrock as the findings indicate that GPR traces are identifying an impenetrable layer beneath
peat.
16. Technical Advisory Group (TAG) members Thanks to all TAG members who assisted the Soil Carbon project through attending TAG
meetings and providing feedback via email and telephone correspondence. Their contribution
to the project was greatly appreciated. Name Organisation Jim McAdam Agri-Food and Biosciences Institute (AFBI) Alex Higgins Agri-Food and Biosciences Institute (AFBI) David Beamish British Geological Survey (BGS) Barry Rawlins British Geological Survey (BGS) Catherine Farrell Bord Na Móna Sinead Boyle DOE Planning NI David Wilson Earthy Matters Pól Mac Cana ENVISION Community Heritage Project Philip O’Brien Environmental Protection Agency (EPA) Martin Critchley ERA-Maptec Ltd David Jewson Friends of Ballynahone Bog (FoBB) Mark Cottrell Golder Associates, FracMan Technology Group James Hodgson Geological Survey of Ireland (GSI) Michael Sheehy Geological Survey of Ireland (GSI) Mairéad Glennon Geological Survey of Ireland (GSI) Kate Knights Geological Survey of Ireland (GSI) Marie Cowan Geological Survey of Northern Ireland (GSNI) Mohammednur Desissa Geological Survey of Northern Ireland (GSNI) Mike Young Geological Survey of Northern Ireland (GSNI) Karen Burke Irish Planning Institute Ian Davies Northern Ireland Environment Agency (NIEA) Rory Mellon Northern Ireland Environment Agency (NIEA) Martin Bradley Northern Ireland Environment Agency (NIEA) Ian Enlander Northern Ireland Environment Agency (NIEA) Chaosheng Zhang National University of Ireland, Galway (NUI Galway) John Scullion Prifysgol Aberystwyth University Jennifer McKinley Queen’s University Belfast (QUB) Antoinette Keaney Queen’s University Belfast (QUB) Alastair Ruffell Queen’s University Belfast (QUB) Martin Robinson Queen’s University Belfast (QUB) Conor Graham Queen’s University Belfast (QUB) Ulrich Ofterdinger Queen’s University Belfast (QUB) Ray Flynn Queen’s University Belfast (QUB) Lorraine Barry Queen’s University Belfast (QUB) Roy Tomlinson Queen’s University Belfast (QUB, Retired) Sheila George Royal Society for the Protection of Birds (RSPB) Claire Ferry Royal Society for the Protection of Birds (RSPB) Brian Reidy Teagasc
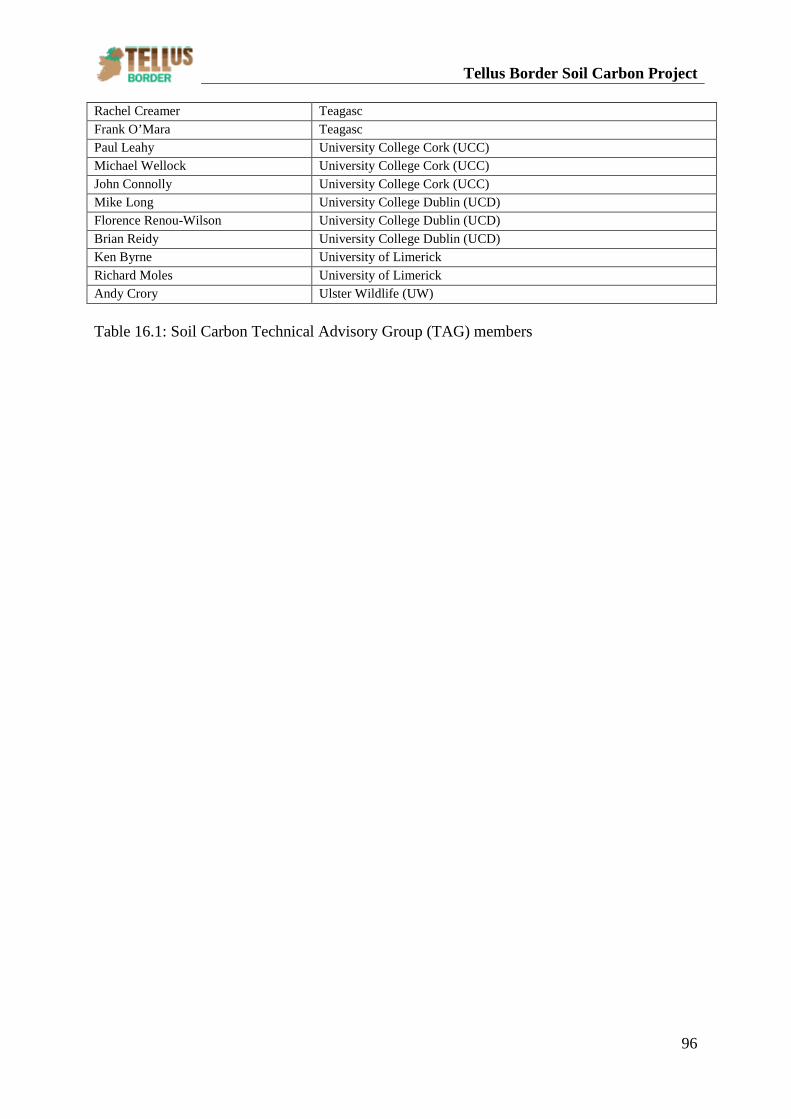
Tellus Border Soil Carbon Project
96
Rachel Creamer Teagasc Frank O’Mara Teagasc Paul Leahy University College Cork (UCC) Michael Wellock University College Cork (UCC) John Connolly University College Cork (UCC) Mike Long University College Dublin (UCD) Florence Renou-Wilson University College Dublin (UCD) Brian Reidy University College Dublin (UCD) Ken Byrne University of Limerick Richard Moles University of Limerick Andy Crory Ulster Wildlife (UW) Table 16.1: Soil Carbon Technical Advisory Group (TAG) members
Tellus Border Soil Carbon Project
97
17. References
British Geological Survey (BGS) (19th September 2007) Analytical Geochemistry Technical
Procedure – Determination of loss of ignition (LOI) at 450ºC, AGN 2.5.5, Issue 1.0. Comas, X., Slater, L. and Reeve, A. (2008) Seasonal geophysical monitoring of biogenic
gases in a northern peatland: Implications for temporal and spatial variability in free phase gas production rates, Journal of geophysical research, Volume 113 [on-line] http://digitalcommons.library.umaine.edu/cgi/viewcontent.cgi?article=1079&context=ers_facpub Accessed date February 2011.
Cruickshank, M.M., Tomlinson, R.W., Devine, P.M., Milne, R., (1998). Carbon in the vegetation and soils of Northern Ireland. Biology and Environment: Proceedings of the Royal Irish Academy 98B (1), 9–21.
Beamish, D. and Young, M. (2009). Geophysics of Northern Ireland - the Tellus effect. First Break. Issue 8, Volume 27.
Beamish, D. (2013 )Gamma ray attenuation in the soils of Northern Ireland, with special reference to peat Journal of Environmental Radioactivity, 115 (2013) 13-27. 10.1016/j.jenvrad.2012.05.031.
Dypvik, H., Eriksen, D.Ø, (1983). Natural radioactivity of clastic sediments and the contributions of U, Th and K. Journal of Petroleum Geology 5 (4), 409–416.
Environmental Protection Agency (2013) GIS data download service http://gis.epa.ie/DataDownload.aspx accessed online.
European Commission (2012) Soil organic matter management across the EU – best practices, constraints and trade-offs [on-line] http://ec.europa.eu/environment/soil/som_en.htm Accessed date 26th September 2013.
Fealy, R. and Green, S. (Eds) (2009a) Teagasc-EPA Soils and Subsoils Mapping Project Final Report, Prepared for the Department of Environment, Heritage and Local Government and the Environmental Protection Agency By Teagasc, Spatial Analysis Unit, RERC, Kinsealy Campus, Malahide Road, Dublin 17, Environmental Protection Agency [on-line] www.epa.ie Accessed date 24th May 2013.
Fealy, R and Green, S. (Eds) (2009b) Teagasc-EPA Soils and Subsoils Mapping Project Final Report Vol. II Maps and Statistics, Prepared for the Department of Environment, Heritage and Local Government and the Environmental Protection Agency By Teagasc, Spatial Analysis Unit, RERC, Kinsealy Campus, Malahide Road, Dublin 17, Environmental Protection Agency [on-line] www.epa.ie Accessed date 24th May 2013.
Grant, M., Tomlinson, R.W. Harvey, J. and Murdy, C. (1997) The Peatland Survey and Profiling Project, vols. 1-9, Report to Environment Heritage Service, Department of the Environment for Northern Ireland. Belfast.
GSNI, (2011) Geochemical surveys [on-line] http://www.bgs.ac.uk/gsni/tellus/geochemical_survey/index.html Accessed date 9th September 2013.
Hamilton, A.C., 1982. Peatland. In: Cruickshank, J.G., Wilcock, D.N. (Eds.), Northern Ireland Environment and Natural Resources.QUB, Belfast, pp. 185–206.
Hyvönen, E., Turunen, P., Vanhanen, E., Arkimaa, H. and Sutinen, R. (2005) Airborne gamma-ray surveys in Finland, Geological Survey of Finland, Special Paper 39: 119-134.
IAEA, 2003. Guidelines for radioelement mapping using gamma ray spectrometry data. IAEA-TECDOC-1363.
IUCN One Programme Charter (2011) http://cmsdata.iucn.org/downloads/iucn_one_programme_charter.pdf
Tellus Border Soil Carbon Project
98
Johnson, C. C. (2005a) G-BASE field procedures manual, 65pp (IR/05/097), British Geological Survey.
Johnson, C. C., (2005b) G_BASE Field Procedures Manual, Chemical and Biological Hazards Programme Internal Report IR/05/097, British Geological Survey.
Keaney, A., McKinley, J, Ruffell, A., Robinson, M., Graham, C., Hodgson, J. and Desissa, M. (2013a) Tellus Border – Soil Carbon and Peat Depth Assessment using Airborne Geophysical Data, Peatlands International 1/2013: 36-39.
Keaney, A., McKinley, J., Graham, C., Robinson, M. and Ruffell, A. (2013b) Spatial statistics to estimate peat thickness using airborne radiometric data, Spatial Statistics (5):3-24 http://www.sciencedirect.com/science/article/pii/S2211675313000353#.
Leica, (2013) Leica SmartNet, Britain and Ireland’s first commercial RTK network [on-line] http://www.leica-geosystems.co.uk/en/Leica-SmartNet_61873.htm Accessed date 25th September 2013.
LIFE – Nature and Coilite (2007) Brining the bogs back to LIFE A major blanket bog restoration project in western Ireland funded by LIFE – Nature and Coilite, July 2002 to December 2007 [on-line] http://ec.europa.eu/environment/life/project/Projects/index.cfm?fuseaction=home.showFile&rep=file&fil=LIFE02_NAT_IRL_008490_LAYMAN.pdf Accessed 24th January 2013.
McKinley, J., Keaney, A. and Ruffell, A. (2013) A spatiotemporal remotely-sensed assessment of peat covered areas using airborne radiometrics. Lectures Notes in Earth System Sciences. Proceedings of the 15th Annual Conference of the International Association of Mathematical Geosciences. Eds. E. Pardo Igúzquiza, C. Guardiola Albert, J. Heredia Díaz, L.Moreno Merino and J.J. Durán Valsero. 225-229. ISBN: 978-3-642-32407-9, DOI 10.1007/978-3-642-32408-6.
Mitchell, W., (2004). The Geology of Northern Ireland: Our Natural Foundation. Geological Survey of Northern Ireland, Belfast.
O’Reilly, G., O’Brien P. and McGovern F. (2012) Addressing Climate Change Challenges in Ireland, CCRP Report Prepared for the Environmental Protection Agency by Environment Research Centre (07-CCRP-3.1) 41pp.
Reeve, A. S. (2011) Seasonal changes in peatland surface elevation recorded with GPS stations in the red lake peatlands, Northern Minnesota, USA, Northeastern (46th Annual) and North-Central (45th Annual) Joint Meeting 20 – 22nd March 2011, Geological Society of America Abstracts with Programs, Vol. 43, No. 1: 161.
Robinson, M., McKinley, J., Ruffell, M. and Young, M. (2010) The improvement of peat depth models for Northern Ireland through the Investigation of Tellus data, Paper presented at GeoEnv 2010, Geostatistics for Environmental Applications, Pages 26- 38, Gent, Belgium, 1stSeptember 2010.
Sentinus (2009) Nuffield STEM Research Placements [on-line] http://www.sentinus.co.uk/product.php?id=15 Accessed date 20th November 2012.
Sliabh Beagh Conservation Management Plan (SBCMP). http://www.rspb.org.uk/Images/Sliabh_Beagh_Plan_small_tcm9-293167.pdf
Tellus Border (2013) Geochemical survey, Sampling methodologies [on-line] http://www.tellusborder.eu/Geochemical+Survey/ Accessed date 18th July 2013.
Tomlinson, R., Grant, M. and Harvey, J. (1998) The Peatland Survey and Profiling Project, vols. 10-18, Report to Environment Heritage Service, Department of the Environment for Northern Ireland, Belfast.
Tomlinson, R. W. and Davidson, L. (2000) Estimates of carbon stores in four Northern Irish lowland raised bogs. Suo Finnish Peatland Society 51(3): 169-179. Tomlinson, R. W. (2004) Impact of land use and land-use change on carbon
Tellus Border Soil Carbon Project
99
emission/fixation, Report to the Environmental Protection Agency on Project 2000- LS-5.1.2-M1, January 2004, Report prepared by R. W. Tomlinson for the Research Team.
Ulster Wildlife (2012) Report on works carried out on Ballynahone Bog 27/2/12-9/3/12, compiled 14th March 2012.
Wheeler, B.D., Shaw, S.C., (1995). Restoration of Damaged Peatlands. HMSO, London. Young, M. and Smyth, D. (2005) New geoscience surveys in Northern Ireland Journal of the
European Federation of Geologists June 2005, No. 19: 24-26.