third annual report on the coordination of collective ... etuc collective bargaining committee, 22...
TRANSCRIPT

1
ETUC Collective Bargaining Committee, 22 October 2002 Executive Committee , 19 November 2002
Third Annual Report on the Coordination of
Collective Bargaining in Europe
2002
Paper prepared by Emmanuel Mermet of the European Trade Union Institute, and Penny Clarke of the European Trade Union Confederation October 2002

2
Summary
Introduction: Three years of coordination....................................................................... 3
Main conclusions after three years of coordination...................................................... 4 Answers to questionnaire.............................................................................................. 6
I. Analysis of results over three years............................................................................... 7 1.1. A European perspective on wage developments ................................................... 7 1.2. A national perspective on wage developments...................................................... 9 1.3. Collective bargaining rounds ............................................................................... 13
II. Factors determining the Guideline ............................................................................. 14 2.1. Inflation................................................................................................................ 15 2.2. Productivity.......................................................................................................... 16 2.3. Other factors?....................................................................................................... 17 2.4. Basic guideline..................................................................................................... 18
III. Quantitative aspects: wages 19 3.1. Nominal wages .................................................................................................... 20 3.2. Negotiated wages ................................................................................................. 21 3.3. Public and private sector wages........................................................................... 22 3.4. The minimum wage ............................................................................................. 23
IV. Quality aspects 24 4.1. Equality between women and men...................................................................... 25 4.2. Low pay ............................................................................................................... 27 4.3. Vocational training .............................................................................................. 28 4.4. Reduction in working time .................................................................................. 30
V. Other initiatives for coordination............................................................................... 32 5.1. Doorn Group ........................................................................................................ 32 5.2. Federations........................................................................................................... 32 5.3. Interregional Trade Union Councils (ITUCs)...................................................... 32

3
Introduction: Three years of coordination In December 2000 the European Trade Union Confederation (ETUC) adopted the first resolution on the coordination of collective bargaining. The result of several years work by the Collective Bargaining Coordination Committee and the European Trade Union Institute (ETUI), this move aimed to launch a process for the exchange of information and coordination through the ETUC, building on the coordination initiatives taken by European Industry Federations and in other trade union circles (Doorn, ITUCS etc.). The intention was not to replace these initiatives but to provide an overview of strategies and a common framework to boost coordination in the future. Thanks to this initiative, there is new basis for the debate on wages in other forums (the macroeconomic dialogue, Broad Economic Policy Guidelines, dialogue with the European Central Bank etc.) Seeking not least to revise the notion of wage restraint to promote an increase in wages which generally fail to reflect real productivity, the Resolution aimed at stepping up the proportion of labour productivity gains allocated to wage rises. To implement this ambitious strategy Europe-wide, and to counter any forms of wage dumping against the background of the single currency, the ETUC developed a system for exchanging information as the first stage in a strategy to coordinate collective bargaining. The introduction of the euro, the full effects of which are yet to be assessed, may well increase pressures on collective bargaining, and coordination is one of the ways of avoiding negative consequences. To this end, this Annual Report presents the results of a questionnaire on the coordination of collective bargaining sent out at the beginning of summer 2002. It was agreed, when the Executive Committee adopted the Resolutions on the coordination of collective bargaining in December 2000 and 2001, that the ETUC would collect information annually, with the help of the European Trade Union Institute, on wage movements and other qualitative aspects of national negotiations. This data would subsequently be compared with the guidelines. This makes it possible for trade unions to share information about national negotiation rounds, and for the ETUC to speak with more authority in the Macroeconomic Dialogue and other European discussions. As in previous years, the report provides a comparison of replies regarding the determining factors with respect to the guideline, wage developments and quality aspects. Now that the coordination strategy has been in place for three years, we also thought it would be helpful to provide graphics for each country showing how wages were moving in the context of the guidelines. Both the questionnaire and the Report refer primarily to the macroeconomic level, in terms of national and European averages. Sector-by-sector information is assembled by the Federations themselves (one section of the Report presents a summary of their activities). Before introducing the graphics showing wage developments, the Report presents the initial conclusions which may be drawn on these three years of coordination.
4
Main conclusions after three years of coordination 1) All trade unions in the European Union provided answers to the questionnaire within the deadline. However, improved national coordination is necessary in some countries to avoid multiple divergent responses. Quantitative aspects were well documented, but the replies regarding qualitative aspects were insufficiently detailed and sometimes entirely lacking. This may have been due to a preference for coordination focusing mainly on wages, and less on qualitative aspects. Or were the respondents adequately informed regarding strategies linked to the quality of jobs? 2) We already have a number of sources of general information on quality aspects of the situation (EIRO, CEDEFOP, ETUI, Eurostat etc.) but we would like to know is what trade union strategies have been favoured during these three years, and what initiatives have been taken in the area of quality, in order to better develop a European strategy. 3)The guideline adopted in the 2000 Resolution, inflation plus productivity, is defined as a long-term objective for the balanced distribution of the wealth created by workers and businesses. However, it should not be regarded as a ceiling, since there may be annual variations in the guideline. If in the long term the guideline were to be exceeded in a sustainable fashion, this would lead to a rise in real unit wage costs and in the share of wages in the GDP: it would be interesting to ask if this strategy can be achieved without endangering economic growth and creating inflationary tensions, and whilst maintaining an improvement in the quality of work. 4) Some consider that the ECB inflation target of 2%, rather than national rates, should be adopted; others believe that forecast inflation rates, rather than the previous year's rates should be taken into account. what would you think of further defining inflation in the guideline? 5) For productivity, the figure used is overall average national productivity. This contributes to maintaining solidarity between sectors in negotiations (normally identical to the national strategy), and to avoiding differentials between sectors (which would put upwards pressure on all wages to catch up with those in the sector where productivity was highest, and could lead to an inflationary spiral). It should be noted that the European Metalworkers' Federation opted for average productivity, even though there have been marked increases in productivity in the sector. 6) The year 2001 was an exception in most countries: a sharper than anticipated fall in productivity increases, combined with a rise in inflation, greatly restricted the margin for negotiation. As a result, nominal wages rose more than the guideline (inflation plus productivity). However, 2002 should mark a return to the 2000 situation: wage rises below the sum of inflation plus productivity, at around one percent. No country will continue to remain above the guideline, according to Commission and trade union forecasts. The increase that was observed in wages should return below the guideline (if growth forecasts prove accurate), leaving margins for manoeuvre which should be used to promote qualitative aspects. Do you agree with our analysis, which is that the quality aspects do not appear to compensate adequately for the fact that wages are below the guideline?

5
7) At the European level, the analysis confirms the general position observed nationally, with wages close to the guideline (in the euro zone) or above the guideline (EU15) in 2001. Wages are likely fall below the guideline in 2002 and 2003, however. Nevertheless there has been a sharper rise in wages than previously, between 3 and 4% as against 2-3% at the end of the 1990s. Is this a sign of a permanent shift after the years of wage restraint, with the aim of returning to pay increases stabilising wages as a proportion of GDP? Does this also correspond to some extent to fiscal changes (taxes and social security contributions etc.)? 8) Although the differences between observed and negotiated wages are slight, it is nevertheless interesting to continue to analyse these data, which reveal the difference between what is negotiated by trade unions and wages developments which may be influenced by changes in non-negotiated aspects (performance payments, bonuses etc.), by wage drift (possible partly negotiated within the enterprise) and by changes in social security contributions. In the countries for which the figures are available, negotiated wages are generally a percentage point behind observed wages, except in Germany and Belgium. Could further investigation throw more light on this position? 9) Replies regarding qualitative aspects were uneven. Only the Nordic countries put a figure on the cost of these, at between 0.3% and 0.8% in 2001. It would be interesting to know the methods by which quality aspects are quantified, and why other countries fail to do so. 10) Responses suggested that training was an important factor for all respondents. 11) Equal pay for women and men and low pay appeared to provoke little interest: no country had applied the 2001 guideline calling for the adoption of programmes with quantified targets in this area. It would appear that some countries (Italy and Germany) failed to grasp the ETUC strategy on wage equality. The rather low number of low-paid workers may also explain the low number of responses (Nordic countries). After the major changes during the 1990s in Europe and in the year 2000 in France, developments in working time reduction were limited 12) The national collective bargaining round, from a European perspective, generally took place in spring, and, to a lesser extent, autumn. 13) No conclusions are drawn for the applicant countries, although an initial seminar held in Gdansk in April 2002 revealed the need to step up research into the wages position in these countries. This situation is very different and distinct: it would be useful to provide a country-by-country analysis. Two countries have returned the questionnaire so far, and we would like the applicant countries to play a full part in future years. Enlargement poses long-term challenges to our strategy for coordinating collective bargaining. In particular, the continued weakness of industrial relations structures in these countries must be overcome in order that the applicant countries play a full part in the coordination strategy, especially in the event of early entry into the euro zone.

6
Answers to questionnaire All trade unions in the European Union replied to the questionnaire within the deadline. This is the first time in three years on which the questionnaires were returned at the same time and thus provided comparable data.
Table: Questionnaire replies received EU Countries Contact person Organisation Joint
answer Answer on qualitative aspects
AUSTRIA Franz Friehs Peter Korecky
ÖGB GÖD/FSG (public service)
No Yes
BELGIUM Rafael Lamas Ronald Janssen
FGTB CSC
Yes Yes
DENMARK Christian Soe LO-DK -- No GERMANY Reinhard Dombre
Thorsten Schulten DGB HBS
Yes Yes
GREECE Georges Dassis GSEE -- No FRANCE Laurence Laigo
Marie France Boutroue
CFDT CGT
No Yes
FINLAND Saraa Lautala STTK SAK AKAVA
Yes Yes
IRELAND Tom Wall ICFTU -- No ITALY Walter Cerfeda
Franco Lotito CGIL UIL
No Yes
LUXEMBOURG
Nico Clement CGT-L -- No
NETHERLANDS
Erik Pentenga FNV -- Yes
PORTUGAL Fernando Marques Ana Paula Bernardo
CGTP-IN UGT-P
No Yes
SPAIN Olatz Alberdi P. San Cristobal, E. Gutierrez Fernando Puig Samper
ELA UGT CC.OO.
No Yes
SWEDEN Mats Morin LO-S -- No UNITED KINGDOM
Iain Murray TUC TUC Brussels Office
-- Yes
Countries outside EU
Contact person Organisation
No E. Horneland LO-NO Candidate countries
Contact person Organisation
Cy Ch Karides SEK Cz Jana Valesá Health Trade Union

7
I. Analysis of results over three years 1.1. A European perspective on wage developments The different indices available at the European level present a picture of distinct developments. In 2002 there was a disparity of more than one percentage point between the maximum and minimum. It should be noted that labour cost indices are expressed per hour, whilst wages are expressed per worker. However, leaving aside quarterly developments, the annual averages indicate an underlying trend: a general rise in wages since the lowest point at the end of the 1990s. Wage increases appear to have returned to a level of 3-4% after the 1990s when they rose at around 2-3%.
Evolution of wages, different indices
11,5
22,5
33,5
4
1997 1998 1999 2000 2001 2002
LCI EUR-12 LCI EU-15
Comp EUR-12 Comp EU-15
LCI: labour costs index (rise in total wage costs per hour), Eurostat. Comp: Remuneration (rise in total wage costs per worker), European Commission. The presence of data from three years of observation means that we are already in a position to compare wage movements (total nominal wage rise) and those of negotiated wages with inflation and the basic guideline of inflation plus productivity. However, the period concerned includes the year 2000, a year of strong economic growth, with a strong rise in productivity per head (because of a greater rise in GDP than in employment) and a corresponding contraction in the gains of productivity. This led to a strong downturn in the guideline adopted in the 2000 Resolution, defined as inflation plus productivity (the fine curve in dashes) At the same time, inflation represents the lower limit for the guideline, the 2000 Resolution having stated that wages should rise faster than inflation. This lower limit (inflation) caused it to rise in 2001 under the impact of oil prices and the fall in the value of the euro. The curves representing the lower limit (inflation) and the guideline (inflation plus productivity) are therefore closer together for most countries. The European example shows this development clearly. For 2002, it is anticipated that per capita productivity will rise again, due to renewed growth in GDP and contracting employment. By contrast, the inflation rate is falling towards the 2% target set by the European Central Bank. This widens the gap between the graph lines representing the lower limit (inflation) and the guideline (inflation plus productivity) and provides a greater margin for wage bargaining. However, wage bargaining is likely to focus on the employment situation.

8
Wage Evolution in the Euro-zone
0
1
2
3
4
1999 2000 2001 2002 2003
Line Wage inflation
Wage Evolution in the EU-15
0
1
2
3
4
1999 2000 2001 2002 2003
Line Wage inflation
Source: European Commission, own calculations Data: Inflation: Harmonised Index Of Consumer Prices (HICP) Productivity: GDP per worker Wages: remuneration (total wage costs per worker) In the euro zone, the European Commission's data indicate that remuneration (the heavy curve) has increased and will increase below the guideline (inflation plus productivity). Wages are thus not having any inflationary impact, and remain more than moderate (a proportion of productivity is not used, particularly in 2002 and 2003). In the EU as a whole, wages are above the guideline only in 2001, because of a fall in productivity. It is interesting to note that the medium term trend is towards a stable rise in wages of between 2-3% in the euro zone and in EU15. This contrasts with variations in other indicators, such as inflation and productivity, a fact which will emerge once more in the case-by-case studies of national results.
Wage Evolution in the EU-15Trade Union Data
0
1
2
3
4
5
6
2000 2001 2002 2003
Line Wage Negotiated wage Inflation
The trade union figures bear out the European Commission's observations (graphics above). Wages rose above the guideline figure (inflation plus productivity) in 2001, catching up the ground lost in 2000, and appear to return to the guideline level in 2002. There is a downturn in the line for 2001 under the combined effect of higher inflation and lower productivity. The trend for 2002 and 2003 marks a new extension of the guideline. It is interesting to note that negotiated wages are consistently a percentage point lower than observed wages.
9
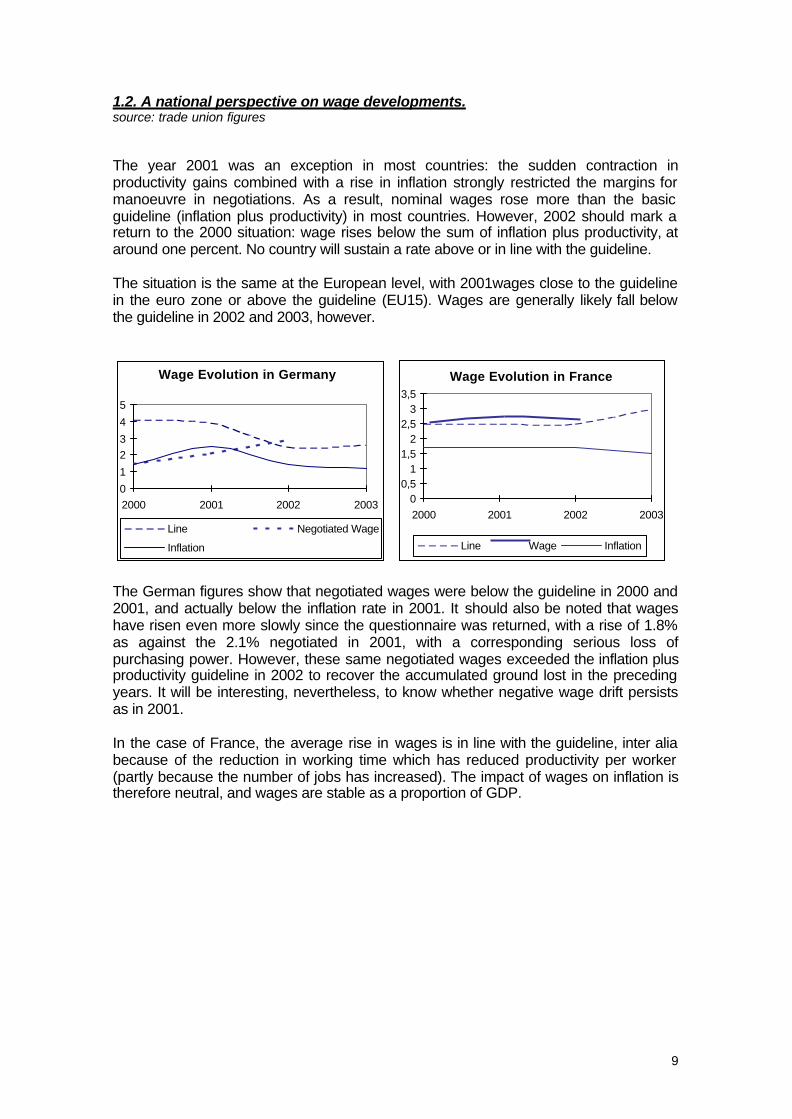
1.2. A national perspective on wage developments. source: trade union figures The year 2001 was an exception in most countries: the sudden contraction in productivity gains combined with a rise in inflation strongly restricted the margins for manoeuvre in negotiations. As a result, nominal wages rose more than the basic guideline (inflation plus productivity) in most countries. However, 2002 should mark a return to the 2000 situation: wage rises below the sum of inflation plus productivity, at around one percent. No country will sustain a rate above or in line with the guideline. The situation is the same at the European level, with 2001wages close to the guideline in the euro zone or above the guideline (EU15). Wages are generally likely fall below the guideline in 2002 and 2003, however.
Wage Evolution in Germany
0
1
23
4
5
2000 2001 2002 2003
Line Negotiated Wage
Inflation
Wage Evolution in France
00,5
11,5
22,5
33,5
2000 2001 2002 2003
Line Wage Inflation
The German figures show that negotiated wages were below the guideline in 2000 and 2001, and actually below the inflation rate in 2001. It should also be noted that wages have risen even more slowly since the questionnaire was returned, with a rise of 1.8% as against the 2.1% negotiated in 2001, with a corresponding serious loss of purchasing power. However, these same negotiated wages exceeded the inflation plus productivity guideline in 2002 to recover the accumulated ground lost in the preceding years. It will be interesting, nevertheless, to know whether negative wage drift persists as in 2001. In the case of France, the average rise in wages is in line with the guideline, inter alia because of the reduction in working time which has reduced productivity per worker (partly because the number of jobs has increased). The impact of wages on inflation is therefore neutral, and wages are stable as a proportion of GDP.

10
Wage Evolution in Spain
0123456
2000 2001 2002 2003
Line Wage
Inflation Negotiated Wage
Wage Evolution in Italy
0
1
2
3
4
5
2000 2001 2002 2003
Line Wage
Inflation Negotiated Wage
The case of Spain shows that observed wages are rising faster than negotiated wages, and were above the guideline in 2001 but below it in 2002. The slowdown in productivity may explain this position. In Italy, it appears that both observed and negotiated wages rose above the guideline level in 2001, and will rise above it again in 2002 and 2003. This may represent catching up for previous years. It may be that the position recorded in 2000 (with observed wages below the guideline and negotiated wages below the inflation rate) reflects the situation at the end of the 1990s (since the introduction of the dual level system of collective bargaining in 1993)
Wage Evolution in Ireland
0
2
4
6
8
10
12
2000 2001 2002 2003Line Wage
Inflation Negotiated Wage
Wage Evolution in Portugal
0123456
2000 2001 2002 2003
Line Negotiated Wage
Inflation
In Ireland negotiated wages rose to a level between the inflation rate and the guideline, whilst observed wages rose above the guideline figure, reflecting a catching up of wages, and an increase in wages as a proportion of GDP. Only 2002 shows a marked slowdown, with wages below inflation, though not all the figures are available. It should be noted that the gains of productivity fell consistently between 2000 and 2002, conforming to the European average of 2% in 2002. This may mark the beginning of the end of the cycle of economic catching-up seen in Ireland over the last ten years. In Portugal, the increase in negotiated wages remained below the level of inflation in 2001 and was at the same level in 2002. Under these conditions, the purchasing power of wages has not been maintained and wages as a proportion of GDP are likely to fall in the long term if this trend continues. However, data for observed wages in 2001 show a rise of 5.7% as against 4% for negotiated wages. This trend would place wage increases above the guideline figure.

11
Wage Evolution in Danemark
0
1
2
3
4
5
6
2000 2001 2002 2003
Line Wage Inflation
Wage Evolution in Austria
0123456
2000 2001 2002 2003
Line Wage
Inflation Negotiated Wage
In Austria, observed wages are rising at around the inflation rate, just maintaining purchasing power. However, additional margins of manoeuvre existed in 2000 and 2001. It should also be noted that negotiated wages remained below the inflation rate, and fail to meet the ETUC guideline. In Denmark, the rise in observed wages remained above the inflation plus productivity line in 2001 and 2001, and should remain in line with it during 2003.
Wage Evolution in Belgium
0
1
2
3
4
5
6
2000 2001 2002 2003
Line Wage
Inflation Negotiated Wage
Wage Evolution in Luxembourg
0
2
4
6
8
2000 2001 2002 2003
Line Wage Inflation
In Belgium, rises in observed wages, below the inflation plus productivity level in 200[?] and 2003 (forecast) were above this line in 2001 and 2002, partly because of a fall in productivity in 2001. The average trend for observed wages is actually between 3% and 4%, and is sometimes below the rate for negotiated wages, particularly in 2001. This trend appears stable over four years of observation, unlike the other very variable factors - inflation (reducing) and productivity (erratic). In Luxembourg the trend is higher, with nominal wage increases of 5-6%, in line with inflation plus productivity.

12
Wage Evolution in Sweden
01
23
45
2000 2001 2002 2003
Line Wage
Negotiated Wage Inflation
Wage Evolution in Finland
0123456
2000 2001 2002 2003
Line Wage
Negotiated Wage Inflation
Movements in observed wages rose above the guideline in Finland in 2001, reflecting a catching-up after 2000 when purchasing power appears to have diminished (wage increases below the rate of inflation). In 2002 increases are likely to be below the inflation plus productivity line, but above the inflation rate alone. It should be noted that negotiated wages in 2001 and 2002 were below observed wages (positive wage drift) and are generally around 1% above inflation. In Sweden observed wages rose above the guideline figure throughout the period, though they remained close to it except in 2001. Negotiated wages remain generally below the guideline, indicating the presence of positive wage drift. Here again, wage increases seem more stable than inflation and productivity (with observed wages rising by 4-4.4%)
Wage Evolution in the United-Kingdom
0
2
4
6
2001 2002 2003
Line Wage Inflation
Wage Evolution in the Netherlands
0123456
2000 2001 2002 2003
Line Wage
Negotiated Wage Inflation
In the Netherlands, observed wage movements are in the order of inflation plus 0.5%. Negotiated wages are just below the inflation rate. It should be noticed that the fall in productivity seen in 2001 caused a marked reduction in the guideline figure, whereas in other years observed wages are in line with the guideline (2000 and 2001) except in 2003. In the United Kingdom, finally, wages rose to a level above the guideline in 2002, under the influence of a sharp fall in productivity gains, which are generally weaker than in the rest of the Union.

13
1.3. Collective bargaining rounds The major rounds of collective bargaining and signature of collective agreements take place in spring in seven countries, and in autumn in three states; these are usually centralised negotiations. Elsewhere, negotiations are dispersed and reviewed at the enterprise level, which creates the impression of a continuous round of negotiations from an overall point of view.
Table: Dates and durations of collective agreements Country 2000-2001 Data: 2001-2002 Data:
AUSTRIA One year agreements April 2000 – December 2002
BELGIUM 1999-2000 Agreement (signed Dec '98) 2001-2001 Agreement (signed Dec 2000)
2001-2002 (private sector) New negotiations in autumn 2002 for 2003-2004 (private sector)
GERMANY Mainly the first half of 2000 (21.8 months) and 2001 (mostly 12 months)
12 to 24 months
DENMARK February 1999 - March 2002 (public sector)
March 2000 (last private sector agreement).
GREECE 2 year agreements
Signed 23 May 2000, effective from 1 January 2000
New 2 year agreement on 15 April 2002
SPAIN Agreements for 3 years on average
5000 negotiations annually
2-3 year sectoral agreements
Cross sectoral agreement on the December 2001 collective bargaining covers 2002 (wage guidelines with minimum inflation guarantee).
FINLAND Incomes Policy Agreement 2001-2002 Signed in December 2000
Incomes Policy Agreement 2001-2002
FRANCE One year agreements -- IRELAND Partnership April 2000 - 2003 9 months of 2002 in the Tripartite
Partnership ITALY Aspects linked to inflation fixed for two
years
Aspects linked to productivity set at enterprise level.
Inter-confederal agreement until November 2004 (wage guidelines)
Sector and enterprise agreements of variable length.
LUXEMBOURG
No fixed dates --
NETHERLANDS
Different dates and durations. 18 months (average length)
PORTUGAL One year, renewable on 1 January One year, usually renewed on 1 January
SWEDEN April 2001-April 2004 End of Agreement on 31 March 2004
UNITED KINGDOM
Different dates and durations. Only national agreement: Local Authority National Agreement, April 2001-March 2002 (under negotiation in August 2002)
NORWAY May 2000 April 2002-2004 private sector May 2002-2004 public sector

14
II. Factors determining the Guideline The remainder of this paper provides the statistical data from the questionnaire and follows the order of the questions. Each table provides the national figures, and a European average, with commentary. Factors determining the guideline include inflation, productivity and other factors in accordance with the 2000 Resolution stating that wages should rise at least faster than inflation and try to absorb inflation plus productivity. All the figures are from trade union sources. For the last three years, European sources have been close to the figures provided by trade unions. However the value of the trade union figures is that they come out before the Commission's forecasts, which are generally published in the November after the publication of this report. It is always helpful to have the forecasts for the current year, but as will be seen by comparing the figures for 2001 ex-ante and ex-post in each table, this can sometimes be a perilous exercise. The 2003 data are thus indicative only, for both the European and the national figures provided by trade unions should be treated with caution. The economic situation is particularly unstable at the moment, and these figures - including those for 2002 - will be revised. We believe that it is thus useful to continue to collect trade union data in order to have a national picture which is more up-to-date than at European level.

15
2.1. Inflation The inflation figures clearly demonstrate that inflation in 2001 reached an unexpected peak. The figures suggested ex-ante were lower than those calculated ex-post. Ultimately, it appears that the European average (EU15) was 2.8% in 2001 (with a forecast of 2.66%) as against 2.73% for 2000 and a forecast of 2.31% for 2002. This naturally had an impact on the base level of the guideline, which rose in 2001 contrary to expectations. This must have had a not insignificant effect on collective bargaining.
Table: Inflation 2000-2003, trade union figures Country 2000 2001
data 2001 2001
data 2002 2002
(forecast source)
2003 (forecast source)
AU 2,3 2,6 2,7 1,7 1,4
BE 2,49 1,92 2,5 1,5 1,4 DE 1,4 2,5 2,5 1,4 1,2 DK 2,8 2,5 2,4 2,2 1,9
EL 3,1 2,9 3,4 3,5 3,2 ES 4,0 3,9 2,7
2,0 (gov forecast) 3,3 (july)
2,0 (gov) --
FIN 3,4-2,6 ex post-ex
ante
2,4 2,6 1,8 (gov) 1,8 (gov)
FR 1,7 1,8 1,7 1,7 - 2,0 1,5
IRL 5,6 5,4 4,9 4,5 --
IT 2,5 2,3-2,7 Estimation for inflation
2,7 1,7 1,4
LU 3,2 2,3 2,7 2,0 1,9
NL 2,3 production
prices
2,6 production
prices
3,6 consumer
prices
3,25 2,25
PT 2,9 2,9-3,5 4,4 3,7 (CGTP) 3,3 – 3,6 (gov)
2,4 (CCE) 2,5 – 2,8 (gov)
SE 1,3 1,9 2,6 1,9 2,1
RU 2,9 2,1 (august 2001)
1,2 (HICP) 1,5 (1st
quarter) --
NO 3,1 3,0 3,0 1,0 (forecast) 2,0 (LO-NO)
UE 15 2,73 2,66 2,80 2,31 1,77

16
2.2. Productivity Average productivity gains in the European Union (EU15) for the year 2000 rose to 2.43%. The previsions for 2001 suggested an average of 1.41% in anticipation of the slowdown in the economy (a lower increase in GDP) whereas the rise observed was only 0.96%, due to the worsening of the downturn in the second half of 2001. This downwards movement in productivity contributed towards lowering the basic guideline (inflation plus productivity), whilst inflation raised the lower level, squeezing the margins for manoeuvre in collective bargaining. 2002 should see a slight recovery in productivity gains to 1.18% under the influence of a slight recovery in the economy (this prevision is being born out). However, recent changes in levels of activity during September 2002 could yet reduce this figure.
Table: Productivity 2000-2003, trade union figures.
Country 2000 2001 Report 2001
2001 2002 2003
AU 2,5 1,1 1,0 / 0.5 1,4 / 0.7 -- / 1.6
BE 2,2 – 2,4 per hour
1,9 – 2,0 per hour
-0,2 - +0,1 1,4 – 1,7 1,9 – 2,2
DE 2,7 0,9 1,4 1,1 1,4
DK 2,1 – 2,1 per hour
2,1 – 2,6 per hour
1,5 1,9 2,0
EL 4,3 3,3 4,2 3,0 2,7
ES 0,8 0,6 0,3 1,1 1,2
FIN 3,8 - 2,3
ex post-ex ante
2,0 1,0 2,3 3,6
FR 0,5 – 2,5 per hour
-0,5 – 0,5
per hour
0,8 0,8 – 1,0 1,5
IRL 5,0 -- 3,1 1,9 --
IT 1,4 0,3 0,3 0,4
LU 2,2 0,3 2,6 0,9 2,1
NL 3,5 – 1,8 per hour
2,0 - -0,25 per hour
-0,6 0,0 2,25
PT 1,6 2,3 0,3 – 0,7 1,3 – 1,0 1,9 – 2,0
SE 1,7 per hour
1,5 per hour 0,6 2,0 1,9
RU 2,2 0,9 two first quarters 2001
1,4 – 0,3 0,4 – 0,5 --
NO 1,3 per hour
1,9 per hour 0.7 1.1 1.0
UE 15 2,43 1,41 0,96 1,18 1,83
Italics: hourly productivity
17
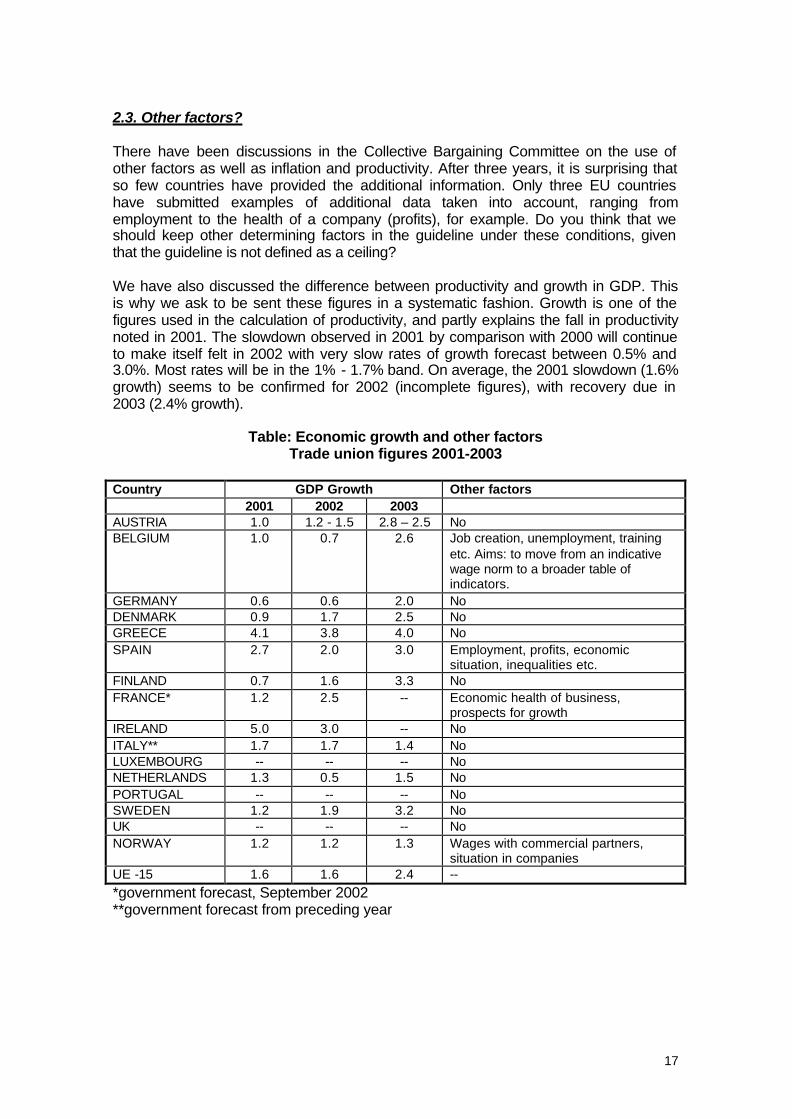
2.3. Other factors? There have been discussions in the Collective Bargaining Committee on the use of other factors as well as inflation and productivity. After three years, it is surprising that so few countries have provided the additional information. Only three EU countries have submitted examples of additional data taken into account, ranging from employment to the health of a company (profits), for example. Do you think that we should keep other determining factors in the guideline under these conditions, given that the guideline is not defined as a ceiling? We have also discussed the difference between productivity and growth in GDP. This is why we ask to be sent these figures in a systematic fashion. Growth is one of the figures used in the calculation of productivity, and partly explains the fall in productivity noted in 2001. The slowdown observed in 2001 by comparison with 2000 will continue to make itself felt in 2002 with very slow rates of growth forecast between 0.5% and 3.0%. Most rates will be in the 1% - 1.7% band. On average, the 2001 slowdown (1.6% growth) seems to be confirmed for 2002 (incomplete figures), with recovery due in 2003 (2.4% growth).
Table: Economic growth and other factors Trade union figures 2001-2003
Country GDP Growth Other factors 2001 2002 2003 AUSTRIA 1.0 1.2 - 1.5 2.8 – 2.5 No BELGIUM 1.0 0.7 2.6 Job creation, unemployment, training
etc. Aims: to move from an indicative wage norm to a broader table of indicators.
GERMANY 0.6 0.6 2.0 No DENMARK 0.9 1.7 2.5 No GREECE 4.1 3.8 4.0 No SPAIN 2.7 2.0 3.0 Employment, profits, economic
situation, inequalities etc. FINLAND 0.7 1.6 3.3 No FRANCE* 1.2 2.5 -- Economic health of business,
prospects for growth IRELAND 5.0 3.0 -- No ITALY** 1.7 1.7 1.4 No LUXEMBOURG -- -- -- No NETHERLANDS 1.3 0.5 1.5 No PORTUGAL -- -- -- No SWEDEN 1.2 1.9 3.2 No UK -- -- -- No NORWAY 1.2 1.2 1.3 Wages with commercial partners,
situation in companies UE -15 1.6 1.6 2.4 -- *government forecast, September 2002 **government forecast from preceding year

18
2.4. Basic guideline The guideline was defined in the 2000 Resolution, and confirmed in the 2001 Resolution, as the sum of inflation plus productivity. This is the medium term target for wage rises. By adding the national inflation rate to average national productivity, we obtain the basic guideline, which may be increased by other determining factors. This is not a ceiling, but a medium term target. It should be noted that the guideline fell sharply in 2001 due to the downturn in activity and the slowdown in economic growth and thus in productivity gains. The guideline thus fell from 4.9% in 2000 to 3.9% in 2001. The slowdown in inflation and the still weak recovery in productivity mean that the figure could fall again in 2002 and 2003 as a European average. However, some trade union figures are still unavailable, making it impossible to produce a reliable forecast.
Basic guideline: Inflation plus productivity 2000-2003, trade union figures
Country Inflation + Productivity
2000 2001 2002 2003
AU 4,9 3,7 ? 2,1 ? --
BE 4,9 2,3 2,9 3,3
DE* 4,1 3,9 2,5 2,6 DK 4,9 3,9 3,1 3,9
EL 7,4 7,6 6,5 5,9 ES 3,0 3,0 3,3 3,2
FIN 4,5 3,6 4,1 5,4
FR 2,5 2,5 2,5 3,0
IRL 10,6 8,0 6,4 --
IT 3,9 3,0 2,0 1,8
LU 5,4 5,3 2,9 4,0
NL** 4,1 3,4 4,0 5,0
PT 4,5 5,1 5,0 4,3
SE* 3,7 3,2 3,9 4,0
RU 5,1 1,5 2,0 --
NO 4,0 3,7 2,1 3,0
UE-15 4,9 3,9 3,4 3,7
• * Hourly productivity • ** Producer price

19
III. Quantitative aspects: wages After identifying the movements in the guideline between 2000 and 2002, we turn to an analysis of the changes in quantitative aspects, in other words wage movements in each country. Before returning to changes in observed and negotiated wages, a comparison of public and private sector wages and an analysis of changes in the minimum wage, we shall examine the concept of the "total value" of an agreement. This total value is regarded as the increase in labour costs caused by both wage rises and the cost of qualitative improvements. It is interesting to note that 9 EU countries set a figure on this. However, some have provided a figure corresponding to the rise in negotiated wages, whist others have submitted figures lower that the rise in observed wages. In the case of Spain, the Labour Costs Index was submitted, and this may be a close approximation of the total agreement value.
Table: Estimate of total agreement value
Country 2001 2002 2003 DE* 2,1 2,9 DK** 3,71 3,0 3,32 ES*** 4,1 4,0 FIN** 3,1 2,3 IRL 9,5 5,0 NL 4,6 4,4 4,0 SE* 3,2 3,0 2,9 NO**** 5,7 5,0
* Figures for the rise in negotiated wages ** Figures lower than the rise in observed wages *** Labour Costs Index **** Labourers

20
3.1. Nominal wages The European average (EU15) for observed wages shows a rise of 3.7% in 2000, against 4.3% in 2001 and a forecast (some countries are not included) of 3.4% in 2002. These figures clearly show an upward trend in 2001 associated with catching up ground lost to inflation, which rose more sharply than expected in 2001. However, the Community average rise in the area of 3-4% annually. This trend continues in the forecasts for 2002 (3.4%). It should also be noted that differentials may be observed, depending on the country. For example, in 2001 the rise recorded (trade union figures) varies between 1.8% in Germany and 9.2 % in Ireland, whilst the great majority of countries registered a rise of between 2% and 4%. These differences ought to reduce in 2002, according to trade union figures, with figures ranging from 2.2% to 5%.
Wages 2000-2003, Trade union figures
Country Total wage rise (nominal) 2000 2001 2002 2003
AU 2,6 / 3.1 2,7 / 2.5 2,2 / 2.5 -- BE 3,2 2,9 3,7 2,7
DE 1,5 1,8 2,9 -- DK 3,5 4,4 3,8 3,6
EL 2,8 3,3 5,34 (inflation + 1%) ES 2,3 4,1 3,7
FIN 2,1 4,5 3,3
FR 2,4 2,6 2,5 IRL 11,0 9,2 4,0*
IT 3,1 3,1 3,3 3,4
LU 5,0 5,9 -- -- NL 3,7 4,3 4,1 3,5
PT -- 5,7 - 4,0 3,8 --
SE 3,8 4,4 4,0 4,4 RU 4,5 3,7 (for lower
wages) -- --
NO 4,5 4,8 5,0 --
EU - 15 3,7 4,3 3,4 * for 9 months Italics: negotiated rise

21
3.2. Negotiated wages The rise in negotiated wages is generally lower than the observed rise. For example, as a European average, the negotiated rise was 3.09% in 2000, as against an overall rise of 3.7% (and for 2002 and 2002 respectively: 3.38% as against 4.3%, and 2.96% as against 3.4%). This demonstrates positive wage drift, or that the impact of social security contributions is increasing, but also that those countries for which we do not have the negotiated figures have a higher wage rise. On the other hand, some countries record an observed rise which is lower than the negotiated increase. This is the case in Germany where the negotiated rise reached 2.4% in 2000 and 2.1% in 2001, but where the observed rise was of 1.5 and 1.8% respectively. In most other countries the effect is the reverse, with positive wage drift.
Negotiated wages, 2000-2003, trade union figures Country Rise in negotiated wages (nominal)
2000 2001 2002 2003 AU 2,2 1,7 / 2.7 1,0 --
BE 2,8 3,5 3,8 -- DE 2,4 2,1 2,9 -- DK 3,2 -- --
EL 1,1 -0,09 (mini) 1,77 (mini) 1,55 (mini) ES 3,0 3,5 3,0 FIN 3,3 2,3 FR
IRL 7,5 6,5 4,0 IT 1,9 2,3 2,5 2,6 LU --
NL 3,3 3,7 3,3 3,0 PT 3,5 4,0 3,8 SE 3,2 3,0 2,9
RU NO 1,7 2,7 3,2 EU - 15 3,09 3,38 2,96
(min): minimum rise exceeded in sector or enterprise negotiations

22
3.3. Public and private sector wages The movement of wages in the public and private sectors shows that, averaged across Europe, the two sectors have remained in step. The two curves on the graph below track each other quite closely over the three years of observation. However, there was a catching up in the public sector in 2001 after a rise which was much lower than in the private sector in the year 2000. This situation may be different in individual countries. The figures submitted often show different rates of increase between the two sectors. In some cases, public sector rises are consistently higher than in the private sector (Belgium, Italy, the Netherlands, Sweden) whilst in other countries (Spain for example) the reverse is true. This information is of interest to the European Federation of Public Service Unions (EPSU), and it may be that the Federation should collect the data itself, in order to have more exact figures.
Wage Evolution in public and private sectors
0
1
2
3
4
2000 2001 2002
public private
Table: Salary movements in public and private sectors Pays 2000 2001 2002 2003 public private public private public private public private AT -- -- 2,3 / 0.8 2,8 / 3.9 1,1 BE 3,5 2,7 3,2 2,9 4,1 3,7 3,2 2,7 DE 2,2 1,8 2,1 3,0 2,9 DK 2,8 4,0 -- EL 2,8 2,8 2,5 négo ES 2,0 3,0 2,0 3,7 2,0 3,0 FI FR 2,1 2,8 1,9 / 4,0 3,4 2,1 / 2,4 2,5 IRL 3,0 IT 5,8 3,0 5,8 3,1 5,8 3,2 LU NL 3,3 3,3 4,4 3,9 4,4 3,9 3,0 3,5 PT 2,5 3,5 3,8 / 5,8 4,0 / 5,7 2,8 3,8 SE 3,7 3,9 4,6 4,3 4,4 3,7 4,9 4,0 RU 3,8 4,8 3,5 - 4 2 - 3 NO 4,6 4,5 4,5 6,0 EU-15 2,8 3,4 3,5 3,2 3,3 3,3

23
3.4. The minimum wage Legal minimum wages are found in nine European States. They vary from € 406 in Portugal to €1290 in Luxembourg (Eurostat). The most recent countries to have adopted a minimum wage are Ireland and the United Kingdom. Is there a link between the existence of a legal minimum wage and weak pay bargaining? The legal minimum wage exists in Greece, Spain, France, Luxembourg, Portugal and the United Kingdom. In countries where collective bargaining covers the majority of workers, there is not necessarily a legal minimum wage (except in Belgium, the Netherlands and Ireland). The minimum wage is usually determined by governmental decree, except in Belgium and Greece. In many countries, therefore, increases are not influenced by trade unions. In Spain, France, Luxembourg, the Netherlands and Portugal the views of the social partners are not necessarily taken into account.
Table: Minimum wage in Europe
Country Level in euro 2001 / 2002
% of average or median
wage**
Initiatives 2000/2001 Initiatives 2001/2002
BELGIUM 1163.00* 1209.33 gross
935.28 net
-- Rise of 4-5% through 2001 tax reliefs.
2% indexation June 2001 2% indexation April 2002
GREECE 473* 41% * 36.4 – 33.9
Rise of 3.3 (2001), 5.34 (2002) and 3.9 (2003)
SPAIN 516* 433.45 /
442.20 gross 405.92 /
414.,12 net
35.8% 38.9%**
2.0 % in 2000 & 2001 (without taking account of inflation)
2% in 2002
FRANCE 1126* 39h: 1154.57 35h: 1035.90
69% 85%**
62% (35h) 76.5%**(35 h)
+2.2% annual average
IRELAND 1009* 49% Introduction April 2000 2001: +6.8% 2002: +6.4%
LUXEMBOURG
1290* 42% * 01/07/2000: +2.5% 01/01/2000: +3.3%
01/04/2001: +2.5%
NETHERLANDS
1207* 44% * 2000: +3.3 2001: +4.2
Around 4% in 2001 and 2002 Around 3% in 2003
PORTUGAL 406* 334.19 / 348.00
57% * 52% (2000)
2000: +4.1%
2001: +5% 2002: +4.1%
UNITED KINGDOM
1124* £4.10/h /
£4.2/h (€ 6.62) Youth level £3.50/h / £3.60/h
45% 56%**
01/10/2001: £4.10 (10.8% increase) Youth rate £3.50 (9.4% increase)
2001: 10.8% rise 2000: 2.4% rise TUC demand for €7.97 - € 8.45
• Source: Eurostat (2001 % of income and 2002 in EUR) ; ** By comparison with the median

24
IV. Quality aspects Quality aspects may cover any area, but the ETUC has always requested information regarding four series of initiatives relating to:
• Equal pay • Low pay • Training and lifelong learning • Reduction in working time
This is a part of the trade union strategy for improvement, and not simply the improvement of jobs. It is not necessarily linked to the guideline, though we have had the idea of quantifying these initiatives. This issue falls at a crossroads between the work of the Collective Bargaining Committee and the European Employment Strategy. These quality aspects have been added to the basic guideline to overcome the inflexibility of a coordination formula based on wage data. This was at the express request of national trade unions and we are therefore very surprised that this year, once again, few trade unions have actually taken the time to explain of what these quality aspects consist. Although all answered the questions on quantity aspects (determining factors and wages) only nine countries gave a complete response regarding the four quality aspects (seven last year). Even where quantified data are required (the reference to quantifiable quality aspects in the Resolution added by the ETUC Executive Committee), we were also asking for practical examples of programmes with quantified objectives and innovative policies, and we hope to receive more answers in this regard in future questionnaires. Article 6 of the 2001 Resolution calls for a specific revision of programmes to reduce gender inequalities in 2002 (at the request of the Resolution), along with the adoption of a quantifiable objective for a reduction in the number of low-paid workers. Article 7 also reiterated the importance of developing continuing training. This is why these areas were covered in the questionnaire which was sent out to member organisations to help achieve these ambitious aims. Only four countries were able to offer figures to quantify the quality aspects. The table below summarises the countries which have submitted figures.
Table : Quantified value of the qualitative aspects
Pays 2001 2002 2003
FIN -- 0,4 -- NL 0,3 0,3 0,5 NO 0,8 -- -- SE 0,5 0,5 0,5

25
4.1. Equality between women and men At least nine countries provided a response giving valuable information regarding wage equality. Many of the answers demonstrated that a revision of wage classifications is much needed. Other initiatives also indicate the problem of the different distribution of female labour in the various sectors, particularly in sectors where wages are below the national average or where trade union representation is less good. Four countries gave no examples of special initiatives in this field. Finally, one country acknowledged that there were no major initiatives in this regard. It seems that some countries have failed to understand what the equal pay strategy could be. We did not ask for an account of the reasons for the existence of discrimination, but rather what initiatives were being taken to change the situation, which may include a revision of wage classifications but may very well consist of other initiatives such as affirmative action. It is interesting to note that in the course of the European social partner's working programme, UNICE stated that this problem was one for national negotiations. So it would be interesting to know something about these national negotiations! Examples of good practice Spain: The UGT, along with the FNV (the Netherlands), the DGB (Germany), UIL (Italy) and KETHI (Greece) has developed a programme on "Equal pay in collective bargaining", the main aim of which is a reduction in wage discrimination. This includes an initial stage of research on collective agreements from a gender perspective in the countries involved. The second stage will lead to the production of a Guide to Good Practices at both national and international level.

26
Table: Initiatives relating to wages equality for women and men
Country Initiatives relating to wages equality for women and men
AUSTRIA Last discriminations removed from collective agreements. Remaining sources of discrimination: lack of child care; lack of flexibility among employers (part time)
BELGIUM Cross sectoral agreement 2001/2001 promoting use of analytical systems to equivalents to classify jobs
GERMANY No major initiatives in this regard DENMARK No reply
GREECE SPAIN Legal amendment to the Status of Workers (Article 28) on equal pay
between the sexes, covering all aspects of wages and benefits. In the 2000 collective bargaining agreement: establishment of a joint working group to produce a package of recommendations (obstacles to women's employment and wage equality) Equal pay programme in collective bargaining for the EGT-E in partnership with other European trade unions (see Good practices).
FINLAND Central group to evaluate jobs and the impact on equal pay. Initiatives in 2002 (new bargaining round in the autumn): - Special allowance to improve equal pay - Wage scales based on job evaluations - Monitoring of gender wage differences/ statistics
FRANCE A matter for the law, but little applied.
IRELAND No reply
ITALY All contractual minima and occupational classifications in sectoral agreements use the same wage classification. Inequalities derive more from differences in hours worked and position in the hierarchy.
LUXEMBOURG No reply
NETHERLANDS Initiatives to check collective agreements on wage equality. Wage inequalities are mainly caused by differences between sectors with high rates of female employment and other sectors.
PORTUGAL Objective of the National Plan for Employment, measures to review the occupational categories. CGT-P study as part of the NOW project to collect information for use in collective bargaining.
SWEDEN No reply
UNITED KINGDOM
Government grant to the TUC to provide training on equal pay for 500 trade union delegates in spring 2002. Government initiative to encourage employers to establish equal pay audits (a voluntary approach, whereas the TUC would like this to be compulsory).
NORWAY Trade union priority Problems in sectors with high concentration of female workers in the private sector which is poorly covered by negotiation.

27
4.2. Low pay Few responses were received regarding low pay. Replies frequently mentioned the rise in the minimum wage as one of the means of improving the situation for workers in this category. On the other hand trade unions also tried to overcome the absence of up-rating of legal minimum rates through collective bargaining. Initiatives relating to tax credits were seldom mentioned, though they may also play a part in improving the position of these workers. It is obvious that there are more low paid workers in some countries that in others. For example, Denmark has relatively few low paid workers, according to Eurostat, while other countries such as Sweden are more egalitarian. The minimum wage also plays a major part in protecting these workers. We were, however, surprised that there were not many examples of strategies to reduce wage differentials in general. Has this objective become a less important part of the trade union agenda?
Table: Low pay initiatives
Country Low pay initiatives
AUSTRIA Minimum wage levels in agreements increased more than others. Goal of €1000 for the minimum wage (close).
BELGIUM Issue considered via the minimum wage, and the reduction of employers' social security contributions on low pay.
GERMANY No reply DENMARK No reply
GREECE SPAIN Trade unions are trying in negotiations to exceed the cross-sectoral
minimum wage, which is only rising in line with the inflation level forecast by the government.
FINLAND Regulation of minimum wage in collective agreements, tax solutions for low pay in the incomes policy agreement, trade union support for foreign workers.
FRANCE Problem with the minimum wage (SMIC) in relation to the number of hours worked (35 to 39 hours) and the way in which the reduction in working time (RTT) is handled.
IRELAND No reply (Rise in minimum wage)
ITALY Trade unions are trying to develop joint agreements between principals and sub-contractors to avoid low pay. Problem with illegal labour.
LUXEMBOURG No reply
NETHERLANDS No reply
PORTUGAL More and more collective agreements are setting both minima and wage rises in euros, rather than as a percentage rise. Government recognition of the fact that the minimum wage should rise faster than average wages, which is not being respected.
SWEDEN No reply
UNITED KINGDOM
Fixed rate increase for low wages, aimed at increasing them more than others, e.g. the Local Authority Agreement of August 2002, plus active policies on the minimum wage.
NORWAY No reply

28
4.3. Vocational training There were more replies received regarding vocational training than for the other aspects. However, only six responses provided more or less detailed explanations of the measures taken to promote training. It should also be noted that the relevant negotiations have not been completed in France. At the same time, the most detailed examples provide indications as to the best practices for developing training. Only Belgium and Italy indicated targets in terms of a percentage of the total wages bill. In several other countries, answers were restricted to a note of the measures to promote training which had been taken, inter alia in collective agreements. More details could be provided on this subject in the future. Examples of good practices Belgium: Two cross-sectoral agreements set out a specific quantified target for training. The aim is to catch up with the average in the three main trading partners (Germany, France and the Netherlands) as this appears in the Eurostat surveys. The 2001-2002 agreement aims to increase the total expenditure on training in Belgium from 1.2% to 1.4% of the total wages bill. However, the average among the three trading partners has continued to rise and has now reached 2%. An additional investment of 0.1% is also indicated for groups "at risk". Other Belgian initiatives: The Global training credit for workers (at least one day's training guaranteed per year) (metal working industry, garages, employees) Increase in the allowance for following additional training in some sectors (oil, wood etc.) A percentage of hours worked reserved for training (food industry, paper and cardboard etc.) Italy: All agreements must now include the following provisions: 0.30% of the total Italian wage bill available for training, co-financed by employers and workers. Rise in the number of hours available for training (more than 150 hours). Portugal: The tripartite agreement of February 2001 established the right to 20 hours' training annually as from 2003 (for workers moving onto the 35 hour week?) and the right to 40% training time for workers aged under 18. United Kingdom: New statutory rights for "Union learning representatives" as of July 2002 including a right to leave for trade union representatives for training with a view to becoming a specialist union training representative able to inform workers of their rights, carry out surveys of training needs and organise training.

29
Table: Vocational training initiatives
Country Initiatives
AUSTRIA No great progress despite government undertaking
BELGIUM Target of reaching the average in the three neighbouring countries (France, Germany, the Netherlands) of 1.4% of the total wages bill. (see Examples of good practices) Additional investment of 0.1% for groups in difficulties.
GERMANY Employment alliance (2001): recommendation for new collective agreements to strengthen training at enterprise level. Metal working sector agreement (Baden Württemberg) authorising employees to determine their training needs in consultation with the employers.
DENMARK No reply
GREECE SPAIN Collective bargaining councils to include training rights (not only for the
most trained). FINLAND Incomes policy agreement 20001/2002: includes the promotion and
development of continuing training. Possible negotiation in 2002 (next income policy agreement) on a programme to support employment through training, plus a number of incentive measures for staff and employers.
FRANCE Failure of collective bargaining on this subject
IRELAND No reply
ITALY Agreement on 0.30% of the total wages bill in Italy to be spent on training (more in some sectors) (see Good practices).
LUXEMBOURG No reply
NETHERLANDS All collective agreements contain training provisions.
PORTUGAL Social consultation agreement includes training measures, to be applied. Tripartite agreement in February 2002 (see Good practices).
SWEDEN No reply
UNITED KINGDOM
New statutory rights for "Union learning representatives" as of July 2002 (see Good practices).
NORWAY No reply

30
4.4. Reduction in working time It appears from the answers to the questionnaire that there have been few significant developments in most European countries. Despite the introduction of the 35-hour week in France in 2000, the new government has decided to increase the amount of overtime to maintain a 39-hour week, particularly in small and medium enterprises. Only in Belgium does the reduction in working time continue to move towards 38 hours, whilst the situation is stable in Germany. It should be noted that the replies also indicate a continuing trend towards increased individualisation. In addition there now exist certain structures for this individualisation or "a la carte" working time (particularly in Belgium and the Netherlands). We are looking here at the working time of full time workers. However the number of part time workers varies from country to country. Many workers in this position would like to increase their hours. The overtime position, both for full and part time works, deserved more attention. Examples of good practice Germany: Flexible working negotiated at a Volkswagen subcontractor: Based on a 35 hour week - three shift system - maximum of 30 Saturday evenings worked annually, or ten per worker. - maximum 42 hour week - a time savings account in which 200 hours may be saved each year and taken in extra free time. This made it possible to avoid the uncoupling of wages and working time which management had wanted. Belgium: The reduction in working time negotiated collectively in the 2001/2002 cross-sectoral agreement, introduces the right to time credits with the following options: - career break 1/5th over 5 years - half time working or 4/5ths for the over 50s. - A years' time credit, full or part time, with a minimum length of 3 months per worker (one year's seniority, maximum 5% of company staff) Sectors may add to and extend the duration of the time credit from 1 to 5 years over the whole career. Spain: Popular legislative initiative launched by the UGT-E for a law on the 35-hour week, particularly in high risk sectors as a first step. Some regional pacts already include a 35-hour week for regional employees.

31
Table: working time reduction initiatives
Country Initiatives
AUSTRIA More than 40% work less than a 40-hour week.
BELGIUM Cross- sectoral agreement 2001/2002: reduction in working time to 38 hours a week (see best practices)
GERMANY Working time reduction has not been a major issue in recent years. Average 37.7 hours a week.
DENMARK No reply
GREECE SPAIN Average of 39.3 hours a week. 37% of workers covered by collective
bargaining benefited from a working time reduction in 2001. Popular legislative initiative for a 35 hour week (UGT)
FINLAND Incomes policy agreement 2001/2002: Ascension day = extra day's leave
FRANCE Working time reduction with set-back in SMEs (increased flexibility with new right government increase in overtime)
IRELAND No reply
ITALY Average below 40 hours a week, (37.2 to 39 hours depending on sector). Increase in leave days Use of temporary labour during peaks of production
LUXEMBOURG No reply
NETHERLANDS No new agreements However, opportunities for workers to have more influence on their hours (a la carte collective agreement: shorter hours, or more leave, or earlier retirement)
PORTUGAL No working time reductions, but more holidays in some agreements.
SWEDEN No reply
UNITED KINGDOM Few changes, the 48 hour opt-out clause (European Directive) is widely applied (4 million workers) TUC campaign to abolish the opt-out (under revision by the European Commission) and reduce excessive working hours. 41% of workers on a 37-hour week, which is the most often negotiated (37% of collective agreements), otherwise an average of 43 hours.
NORWAY No reply

32
V. Other initiatives for coordination 5.1. Doorn Group (to add) 5.2. Federations (to add) 5.3. Interregional Trade Union Councils (ITUCs) As part of the ITUC action programme for the year 2000, the ETUC coordinated a project for eight ITUCs with the main aim of establishing joint guidelines to avoid social and wage dumping, tying in with the ETUC's work on the coordination of collective bargaining. The project enabled three ITUCs to produce a study comparing collective agreements in certain sectors. The "Trois frontières" ITUC (Belgium, France and Luxembourg) produced a study in July 2001 comparing gross and net monthly wages in the borders regions of the three countries. This study, interestingly, shows that in terms of agreed minimum rates, a statutory postman (5 years' seniority) earns a monthly wage of €1450 gross in Belgium, €1250 in France and €2200 in Luxembourg. A team leader in the chemical industry with ten years' experience earns €1550 (B), €1350 (F) and €2600 (L) gross per month. By contrast, in other businesses, a supermarket warehouseman (ten years experience) earns a monthly gross wage of €1250 (B), €1100 (F) and €1250 (L) . This ITUC has also submitted a project to establish a data bank on the collective agreements applying in the three border regions (Wallonia, Lorraine and Luxembourg).