modelling for obstacle avoidance sonar...
TRANSCRIPT
Modelling for Obstacle Avoidance Sonar Design
Yan Pailhas, Chris Capus, Judith BellOcean Systems LaboratoryHeriot-Watt UniversityEdinburgh, U.K.
Introduction
Research context working with SEA,
prime contractor for MOD BAUUV programmeObstacle avoidance for autonomous
underwater vehicles Acoustic modelling
sonar equation obstacle models Noise/reverberation models
Maximise detection distances difficult obstacles
seaweed nets a particular problem
Overview
Obstacle avoidance scenarios Sonar equation What can we model? A simple target model
Validation Ambient noise and reverberation
More empirical data required for very high frequencies Maximum detection distances
Frequency dependencies Determines range of evasive manoeuvres available
More complex target models Conclusions
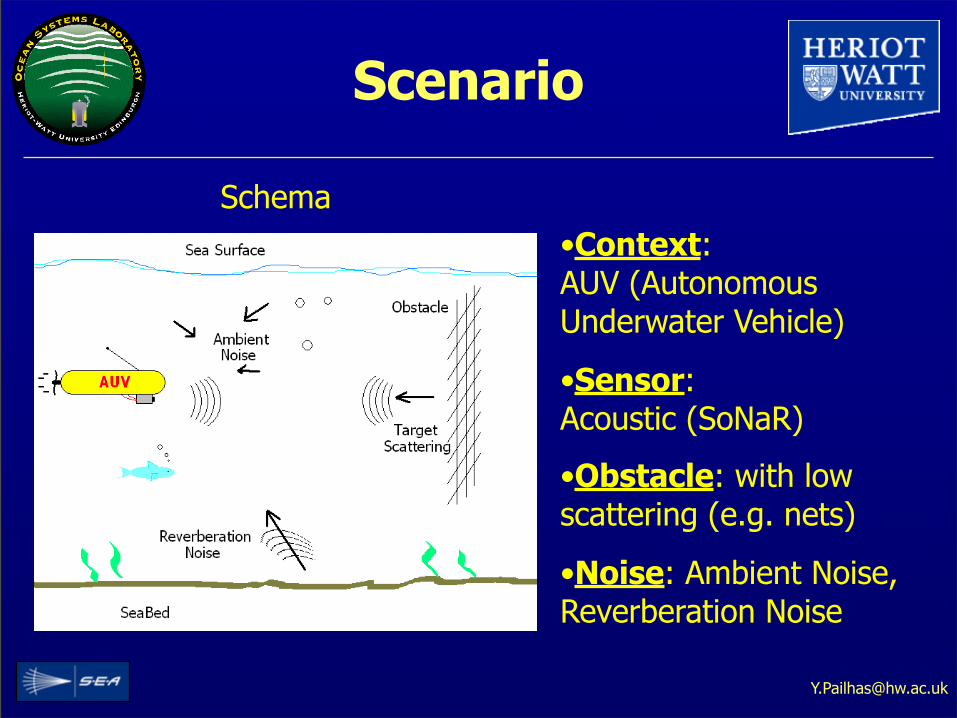
Scenario
Schema•Context: AUV (Autonomous Underwater Vehicle)
•Sensor: Acoustic (SoNaR)
•Obstacle: with low scattering (e.g. nets)
•Noise: Ambient Noise, Reverberation Noise
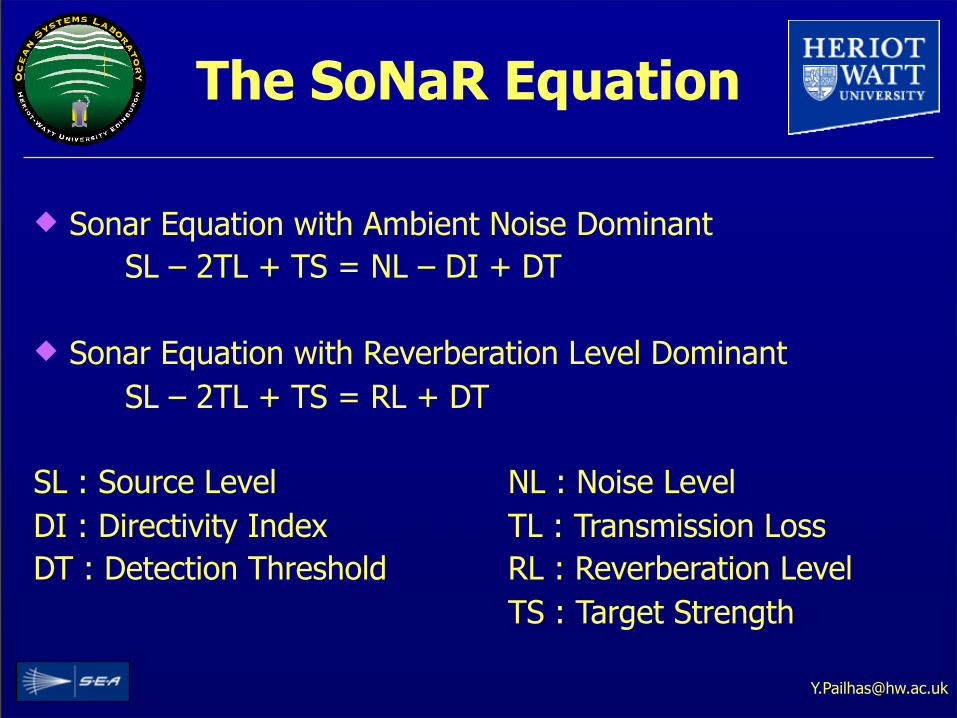
The SoNaR Equation
Sonar Equation with Ambient Noise Dominant SL – 2TL + TS = NL – DI + DT
Sonar Equation with Reverberation Level Dominant SL – 2TL + TS = RL + DT
SL : Source Level NL : Noise Level DI : Directivity Index TL : Transmission LossDT : Detection Threshold RL : Reverberation Level TS : Target Strength
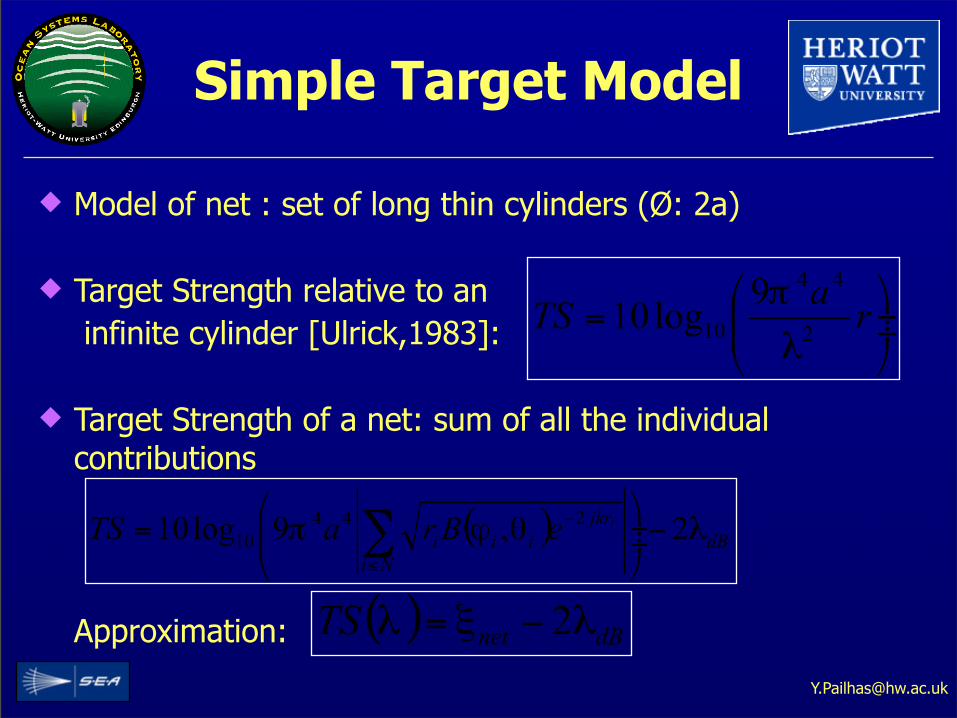
Simple Target Model
Model of net : set of long thin cylinders (Ø: 2a)
Target Strength relative to an infinite cylinder [Ulrick,1983]:
Target Strength of a net: sum of all the individual contributions
Approximation:
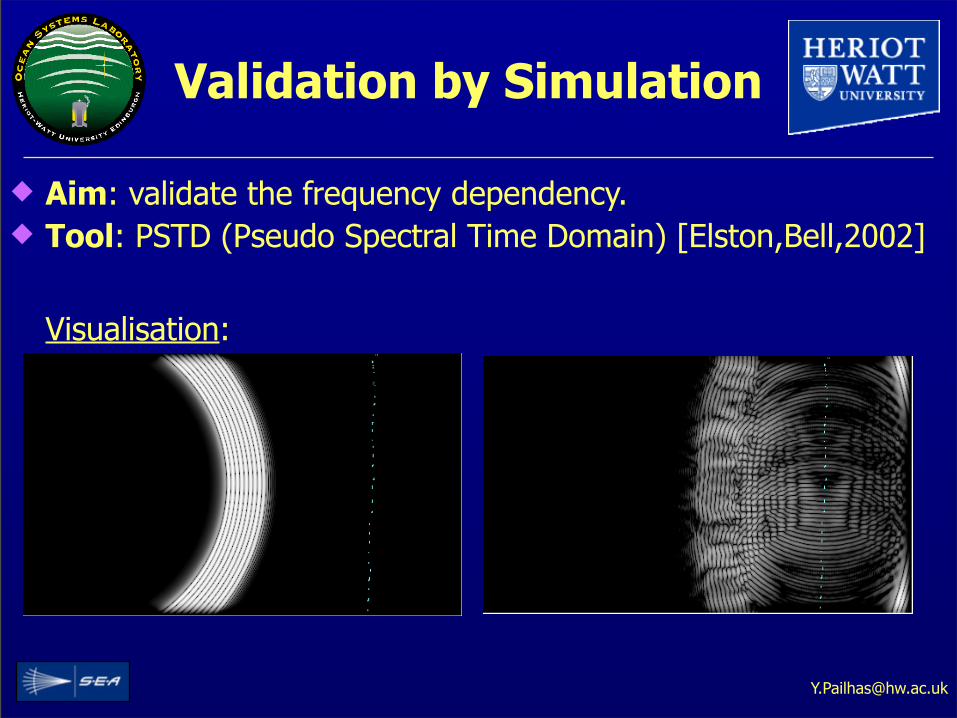
Validation by Simulation
Aim: validate the frequency dependency. Tool: PSTD (Pseudo Spectral Time Domain) [Elston,Bell,2002]
Visualisation:
Validation by Simulation
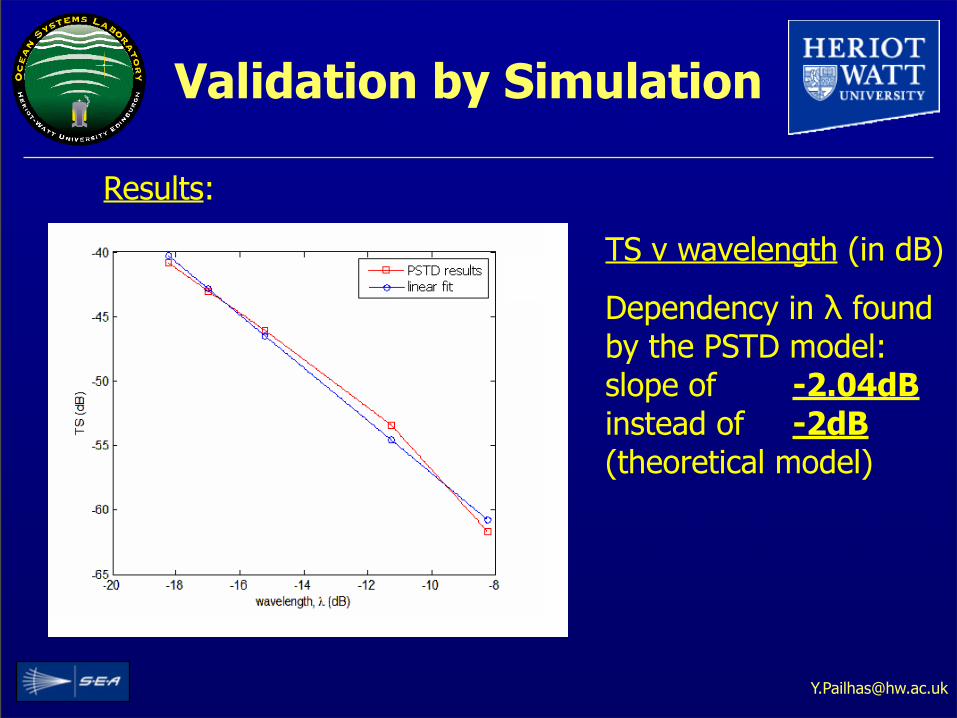
Results:
TS v wavelength (in dB)
Dependency in λ found by the PSTD model: slope of -2.04dB instead of -2dB (theoretical model)
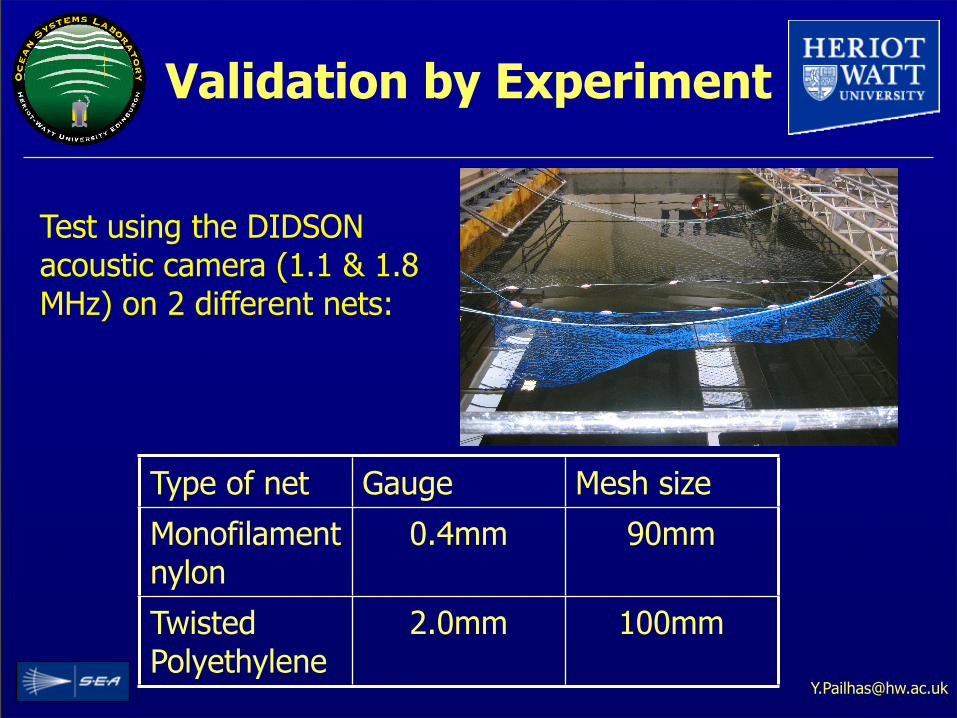
Validation by Experiment
Test using the DIDSON acoustic camera (1.1 & 1.8 MHz) on 2 different nets:
Type of net Gauge Mesh size
Monofilament nylon
0.4mm 90mm
Twisted Polyethylene
2.0mm 100mm
Validation by Experiment
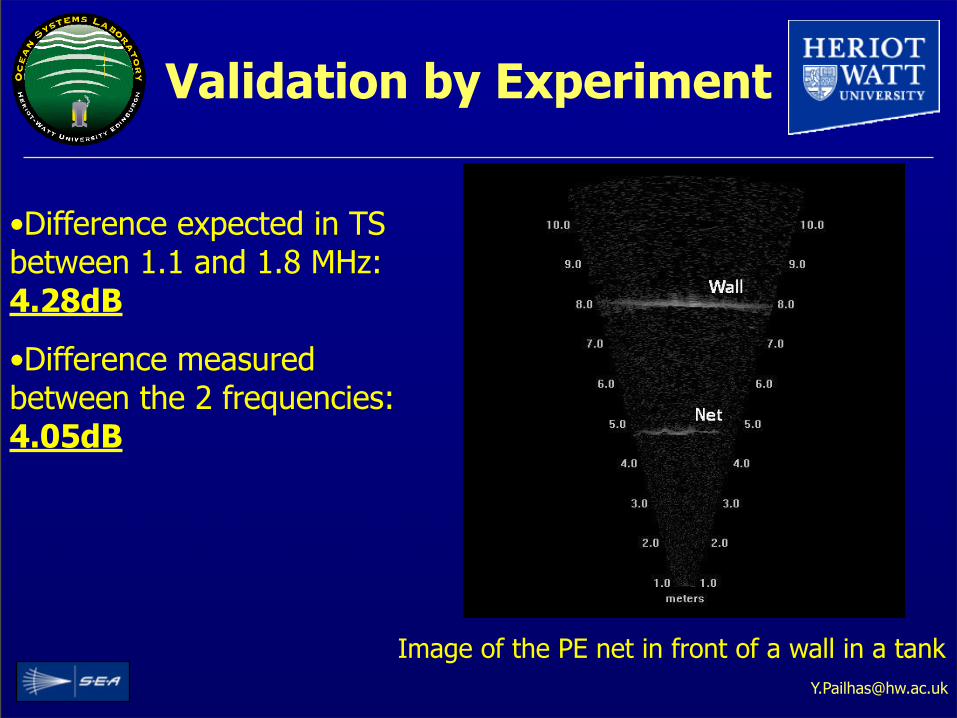
•Difference expected in TS between 1.1 and 1.8 MHz: 4.28dB
•Difference measured between the 2 frequencies: 4.05dB
Image of the PE net in front of a wall in a tank
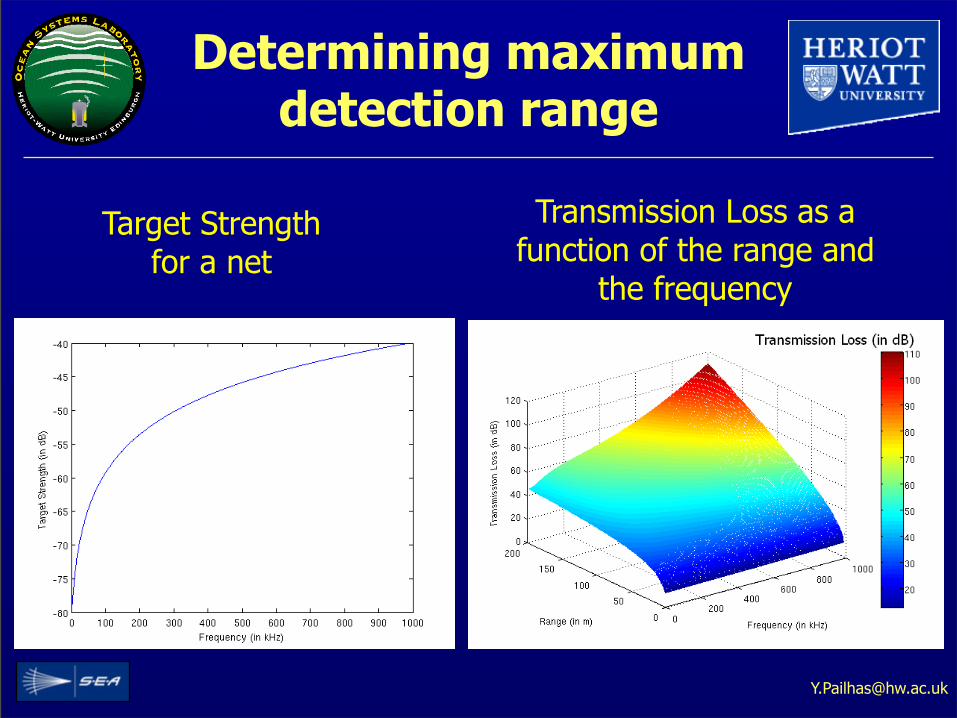
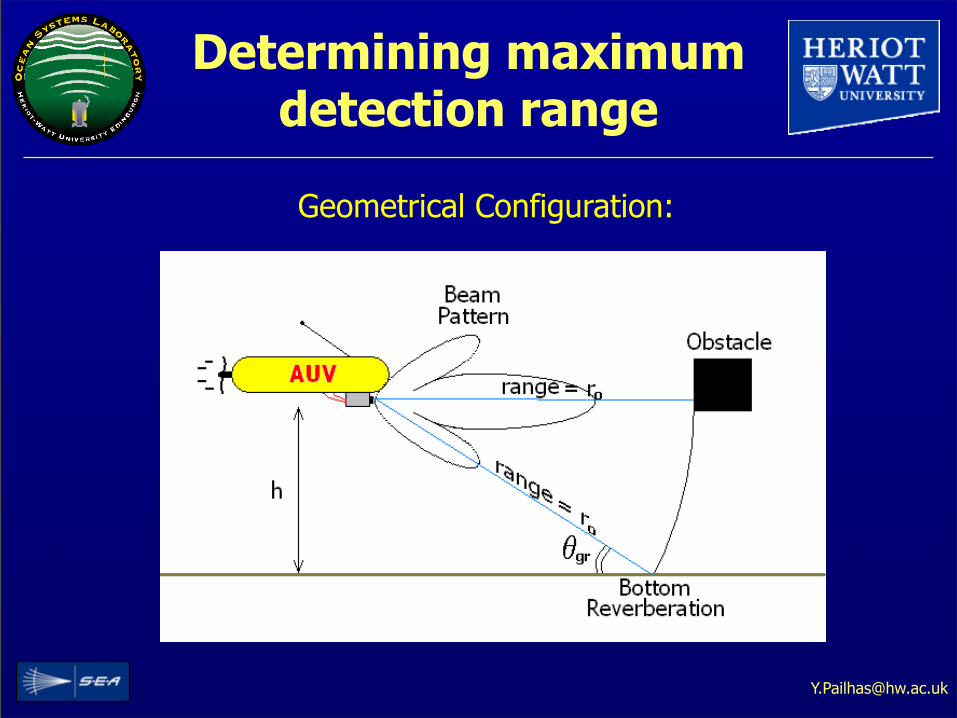
Determining maximum detection range
Target Strength for a net
Transmission Loss as a function of the range and
the frequency
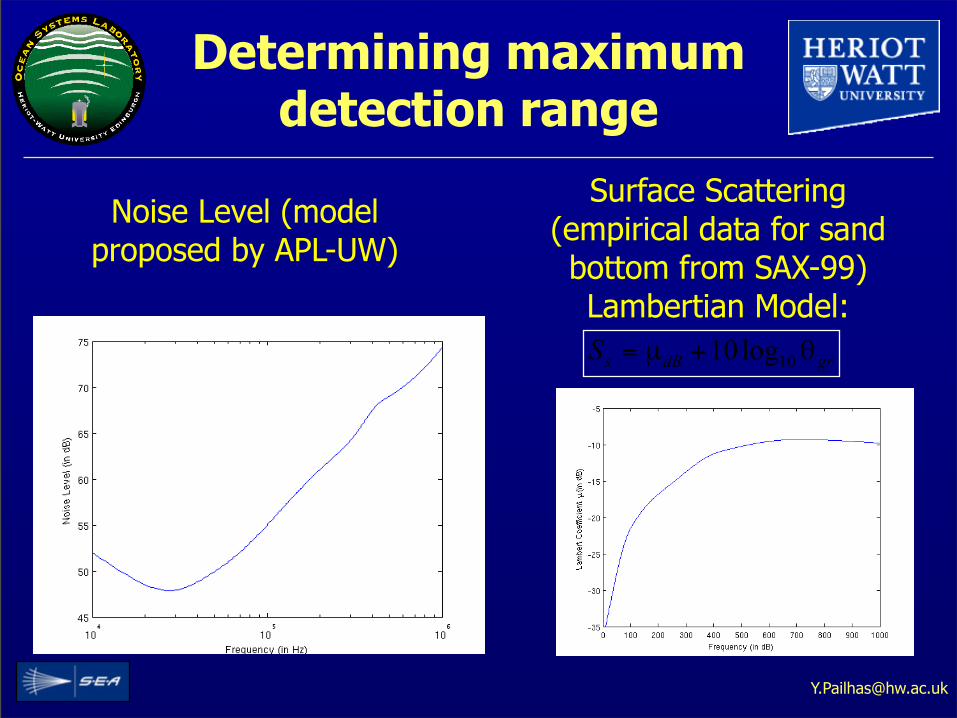
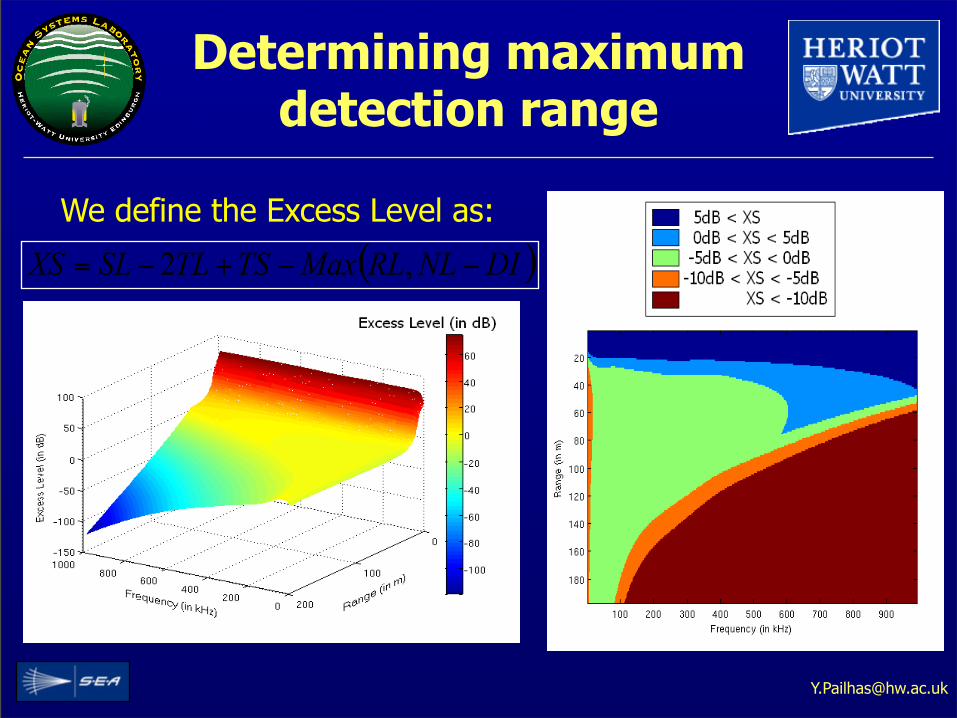
Determining maximum detection range
Noise Level (model proposed by APL-UW)
Surface Scattering (empirical data for sand bottom from SAX-99) Lambertian Model:
Determining maximum detection range
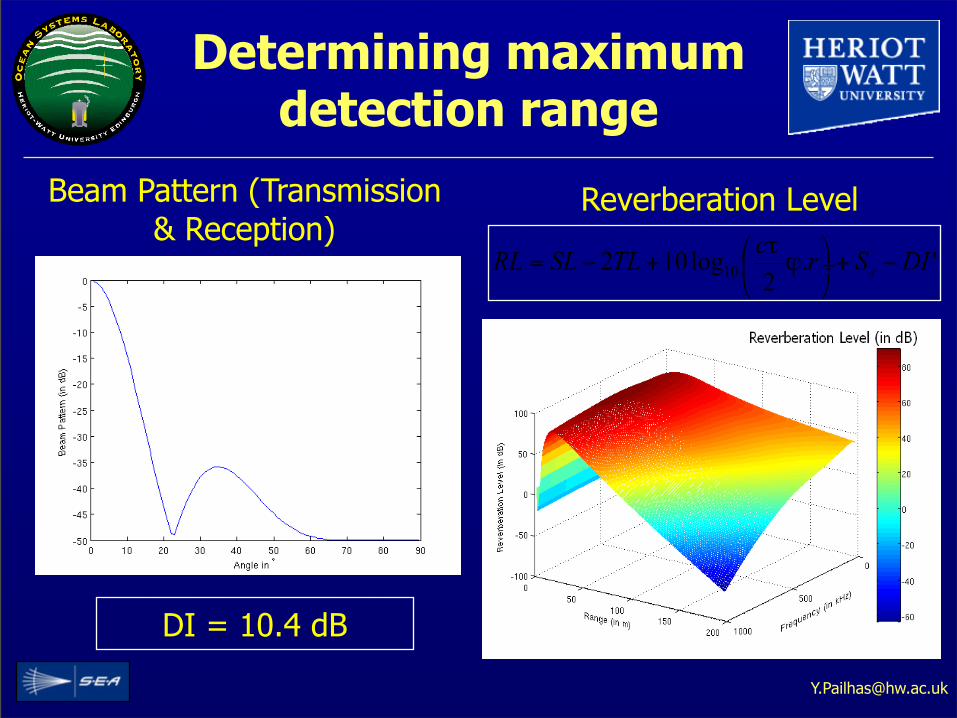
Beam Pattern (Transmission & Reception)
DI = 10.4 dB
Reverberation Level
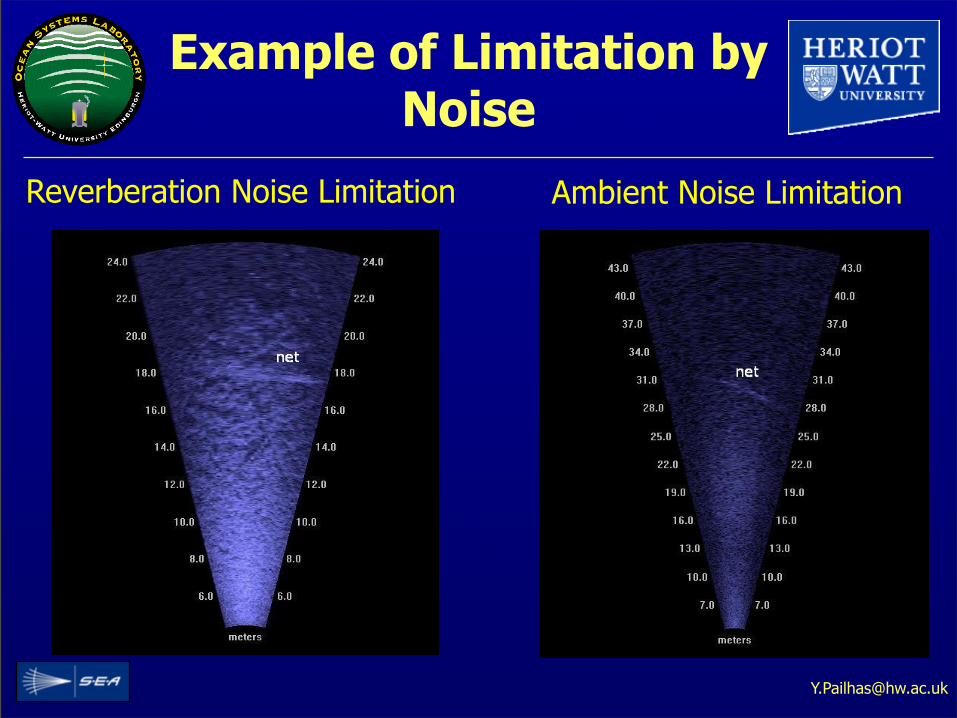
Example of Limitation by Noise
Reverberation Noise Limitation Ambient Noise Limitation
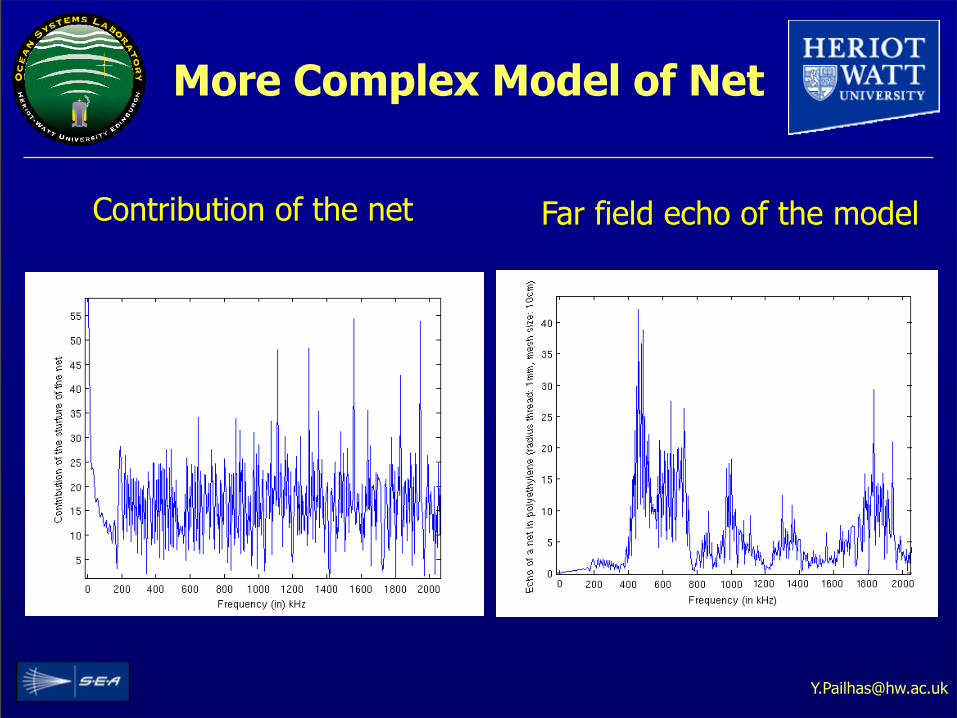
More Complex Model of Net
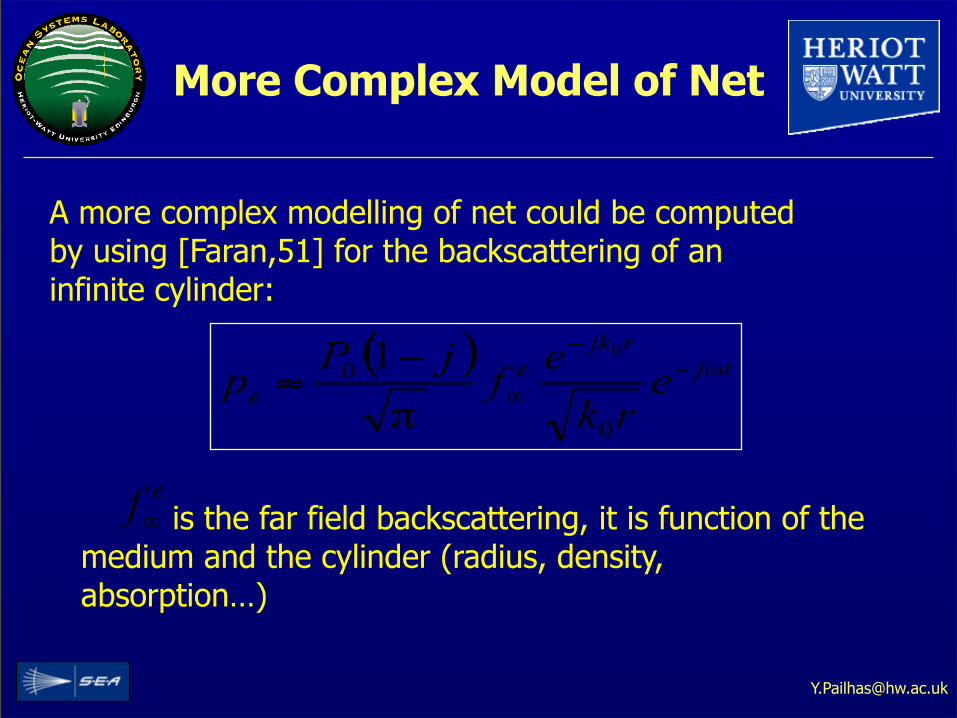
A more complex modelling of net could be computed by using [Faran,51] for the backscattering of an infinite cylinder:
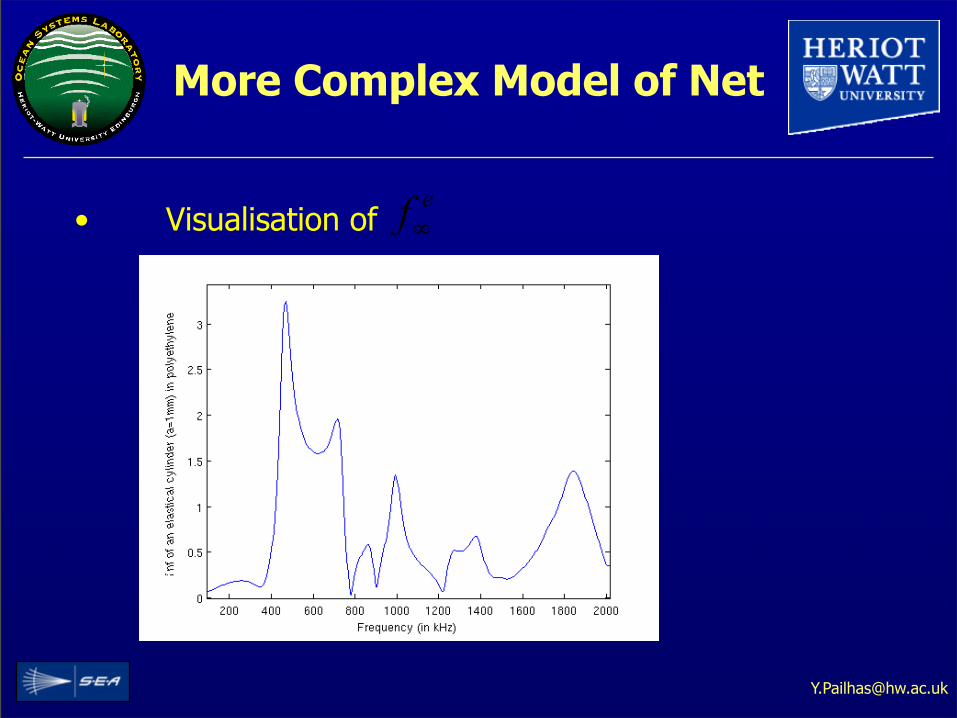
is the far field backscattering, it is function of the medium and the cylinder (radius, density, absorption…)
More Complex Model of Net
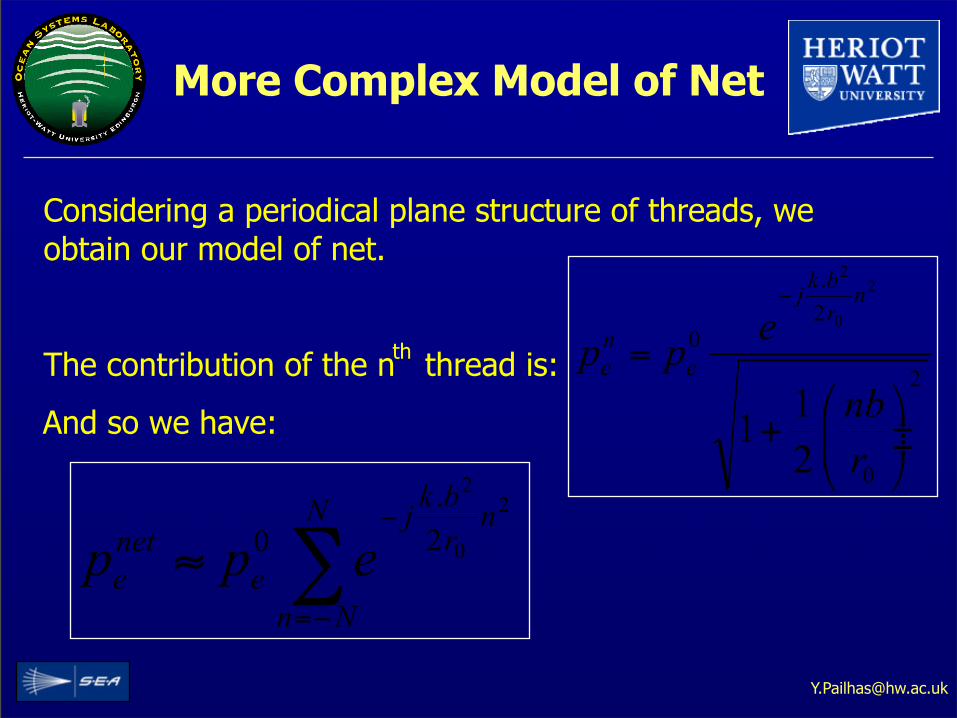
Considering a periodical plane structure of threads, we obtain our model of net.
The contribution of the n thread is:
And so we have:
th
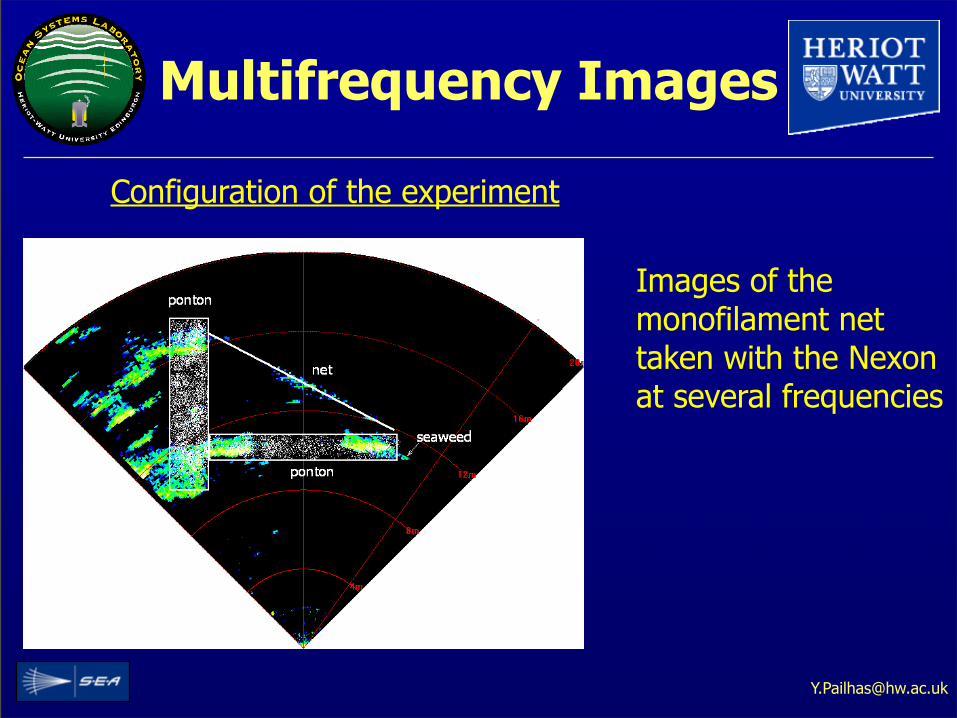
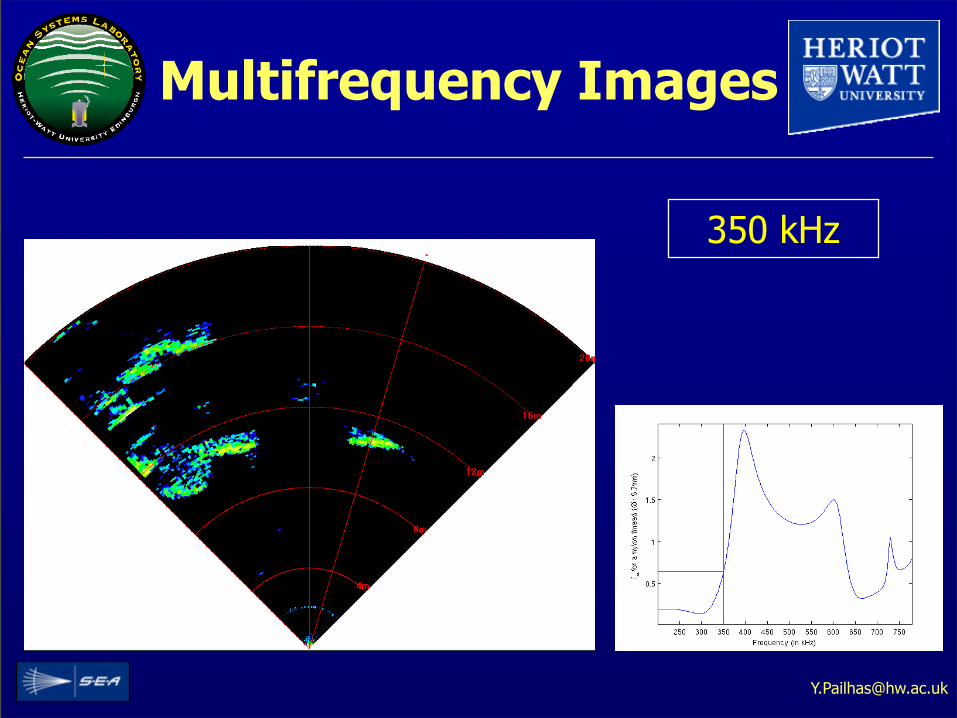
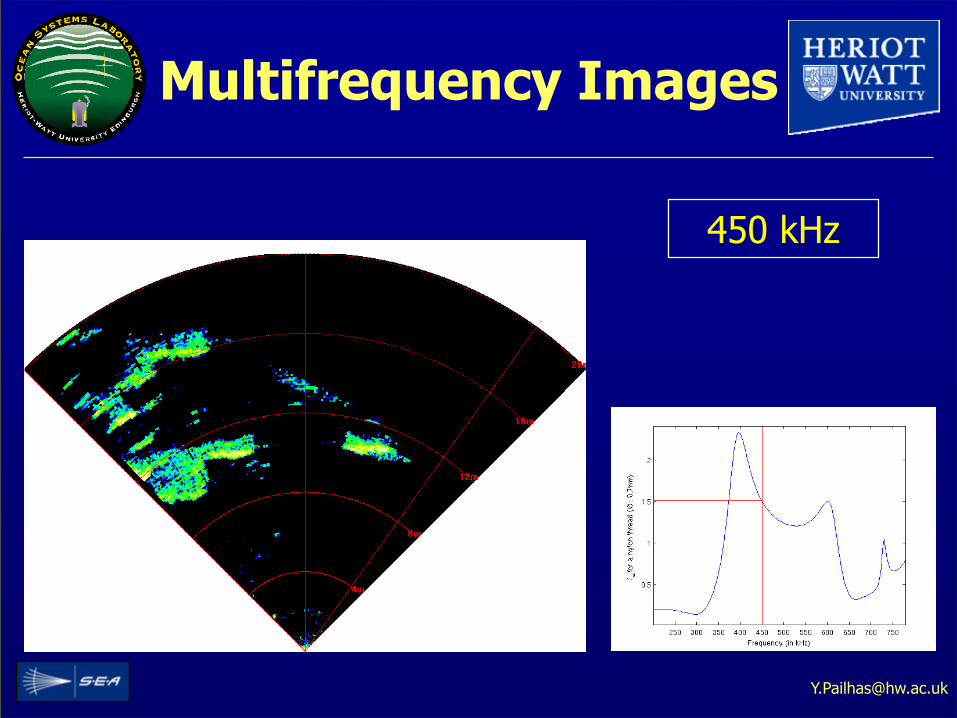
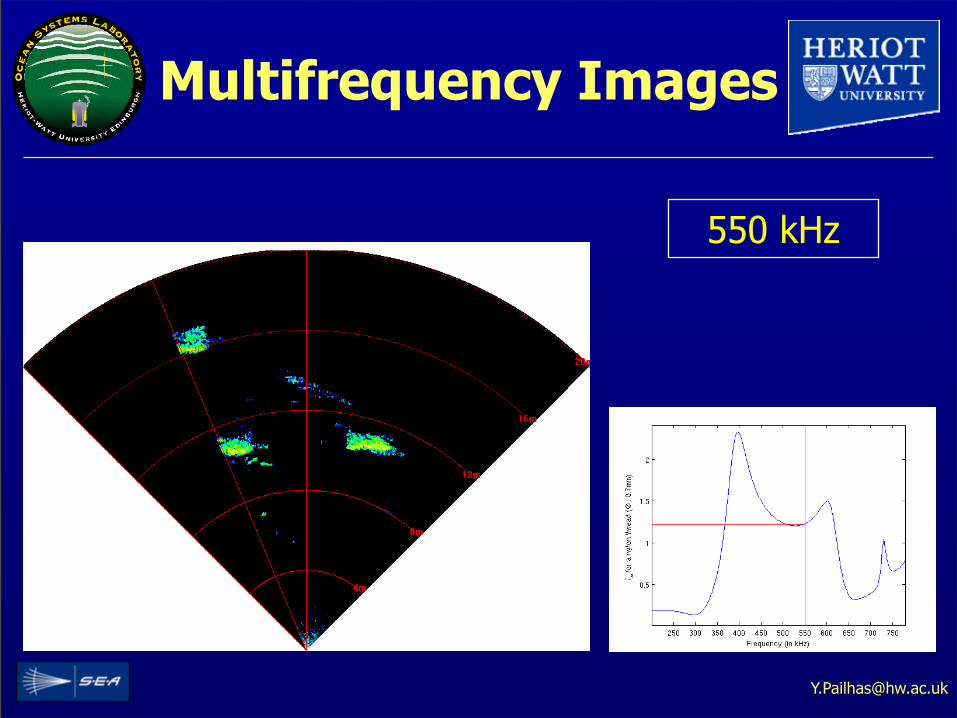
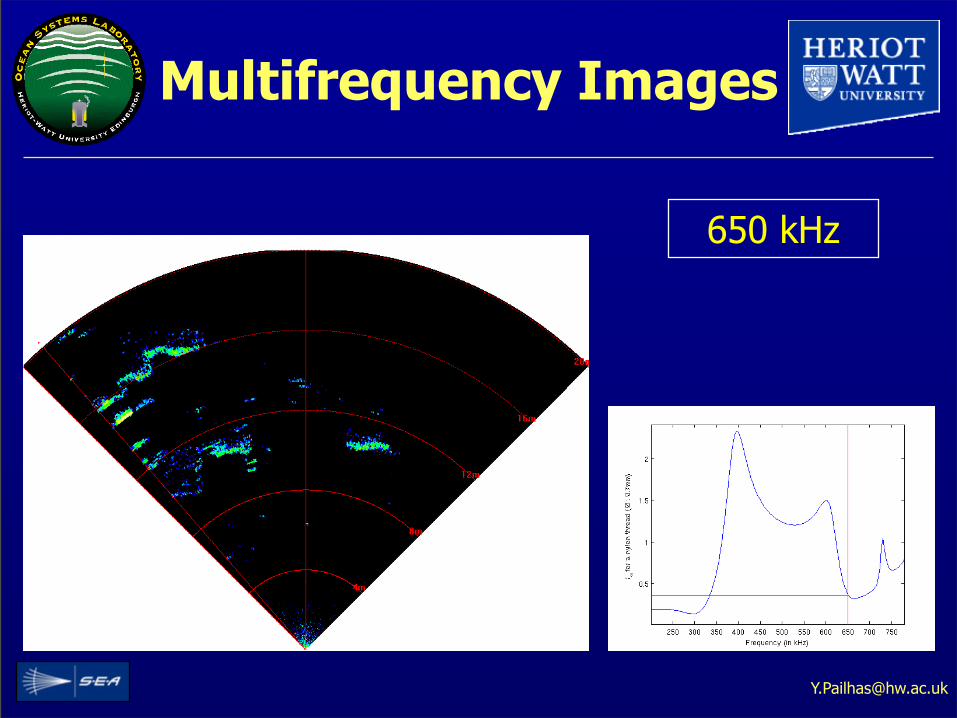
Multifrequency Images
Images of the monofilament net taken with the Nexon at several frequencies
Configuration of the experiment
Conclusions
Net detection It can be done Even monofilament nylon (0.4mm)
Maximum range 20m now 50m with more advanced signals and signal processing?
wideband AUV detection scenarios
Noise limited Reverberation a problem for bottom set obstacles
Best frequency ranges for detection Very high frequencies not required Target dependent
Commercial fishing nets 400-600kHz Models agree well with data gathered so far
Other difficult targets Can use same approach Specify and/or design sensors to suit task