hybrid hydrogen energy storage - hydrogen & fuel … hydrogen oxygen h 2 o + electricity h 2 +...
TRANSCRIPT
NREL is a national laboratory of the U.S. Department of Energy, Office of Energy Efficiency and Renewable Energy, operated by the Alliance for Sustainable Energy, LLC.
Hybrid Hydrogen
Energy Storage
Michael Penev
May 22, 2013
All-Energy 2013
Aberdeen, UK
2
Talk Overview
Key Components of H2 Storage
Case Study of Islanded Hybrid-H2 Storage
Concept of Power to Gas Energy Storage
3
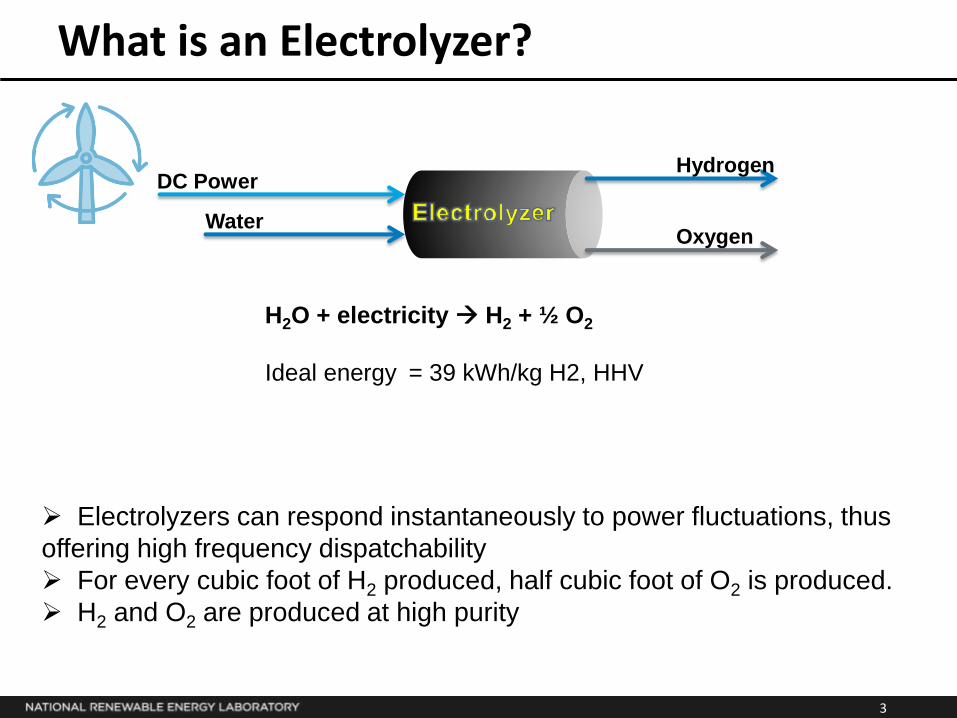
What is an Electrolyzer?
Electrolyzers can respond instantaneously to power fluctuations, thus
offering high frequency dispatchability
For every cubic foot of H2 produced, half cubic foot of O2 is produced.
H2 and O2 are produced at high purity
DC Power
Water
Hydrogen
Oxygen
H2O + electricity H2 + ½ O2
Ideal energy = 39 kWh/kg H2, HHV
4
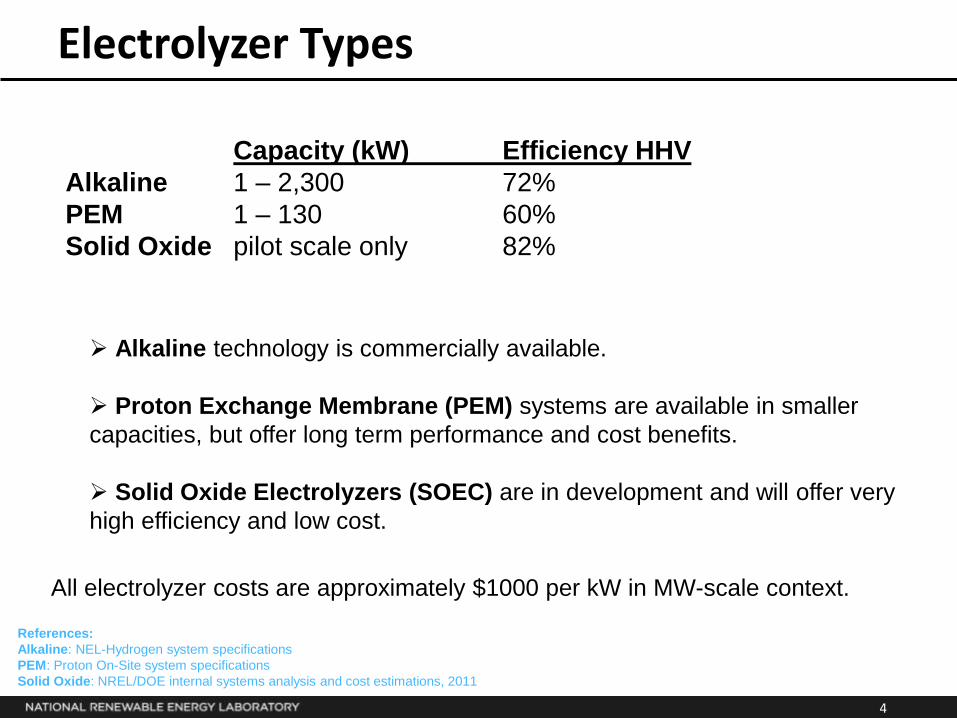
Electrolyzer Types
Capacity (kW) Efficiency HHV
Alkaline 1 – 2,300 72%
PEM 1 – 130 60%
Solid Oxide pilot scale only 82%
Alkaline technology is commercially available.
Proton Exchange Membrane (PEM) systems are available in smaller
capacities, but offer long term performance and cost benefits.
Solid Oxide Electrolyzers (SOEC) are in development and will offer very
high efficiency and low cost.
All electrolyzer costs are approximately $1000 per kW in MW-scale context.
References:
Alkaline: NEL-Hydrogen system specifications
PEM: Proton On-Site system specifications
Solid Oxide: NREL/DOE internal systems analysis and cost estimations, 2011

5
Norsk Hydro’s 30,000 Nm3/h (~150 MW)
Electrolyzer Plant (1948 - 1990)
Reference: Knut Harg, Hydro Oil & Energy, Hydrogen Technologies
NAS – Hydrogen Resource Committee, April 19, 2007
Connected to a hydroelectric plant, generating about 70,000 kg/day
Alkaline Electrolyzers – Largest Installations

6
Hydrogen Storage Types
Storage Type H2 Storage cost $/kWh* • Terrestrial compressed tank** $ 45
• Deep-ocean gas storage*** $ 10
• Liquid hydrogen storage ** $ 2.5
• Geologic storage (porous rock formations) $ 0.50
• Dry-mined salt caverns $ 0.25
• Solution-mined salt caverns $ 0.05
* using 20 kWh/kg H2 (51% HHV efficiency)
** using H2A components model cost estimates
*** NREL cost estimate
Reference: Crotogino, F.; Huebner, S. (2008). “Energy Storage in Salt Caverns: Developments and Concrete Projects for Adiabatic Compressed
Air and for Hydrogen Storage.” Solution Mining Research Institute Spring 2008 Technical Conference, Porto, Portugal, April 28–29, 2008.
Deep ocean gas storage: NREL internal cost estimation, 2010

7
Power Generation Equipment
Generator Type Scale MW Cost $/kW Efficiency (HHV) Combine cycle (CC) plant 50 - 550 $550-720 51%
Oxy-combustion CC 50 - 550 $550-720* 62%
PEM Fuel Cells 0.1 -1.0 $2,500-5,000 40%
SOFC Fuel Cells 0.01 - TBD $4,500 61%
Only PEM Fuel Cells have been demonstrated for H2 to power for grid support.
* Oxy-combustion plant is assumed to have the same per-kW cost as CC. Oxy-
combustion has many simplifying aspects over air-combustion CC.
References:
Combine Cycle: “Cost and Performance Baseline for Fossil Energy Plants”, DOE/NETL, 2010
http://www.netl.doe.gov/energy-analyses/pubs/BitBase_FinRep_Rev2.pdf
Attachment:
http://www.netl.doe.gov/KMD/cds/disk50/NGCC%20Plant%20Case_FClass_051607.pdf
Oxy-combustion reference: Masafumi Fukuda and Yoshikazu Dozono, “Double Reheat Rankine Cycle for Hydrogen-Combustion Turbine Power
Plants”, Toshiba Corporation, Journal of Propulsion and Power, Vol. 16, No. 4, July-August 2000, Page 562
Solid Oxide: NREL/DOE internal systems analysis and cost estimations, 2011
PEM Fuel Cells: Personal communication with Kevin Bell from Ballard Power.
8
Talk Overview
Key Components of H2 Storage
Case Study of Islanded Hybrid-H2 Storage
Concept of Power to Gas Energy Storage
9
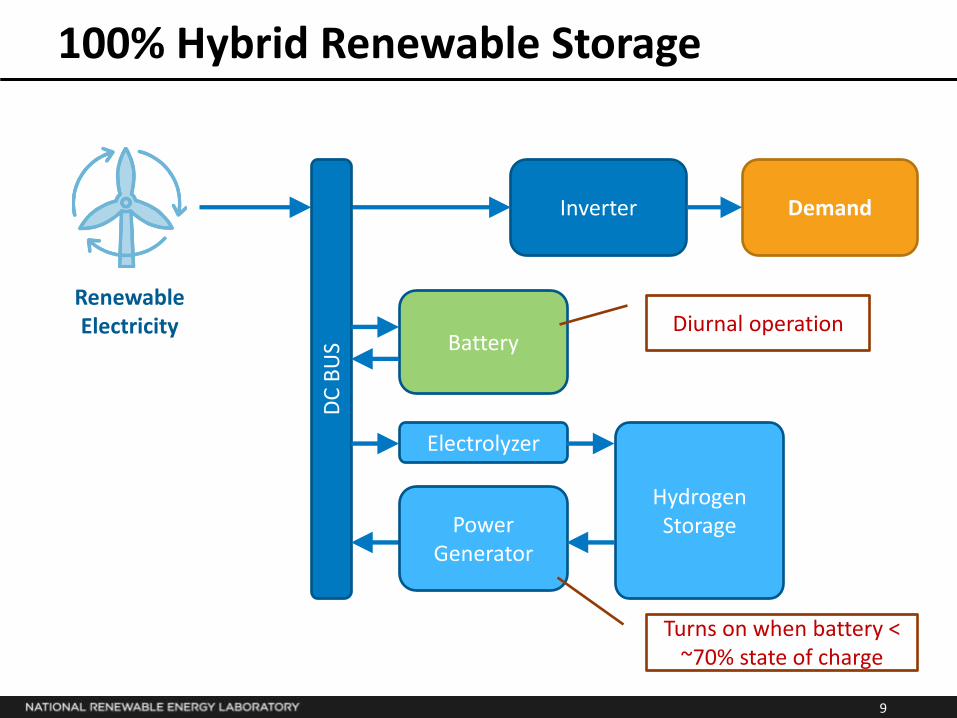
100% Hybrid Renewable Storage
Demand
Renewable Electricity
Battery
Inverter
DC
BU
S
Electrolyzer
Power Generator
Hydrogen Storage
Diurnal operation
Turns on when battery < ~70% state of charge
10
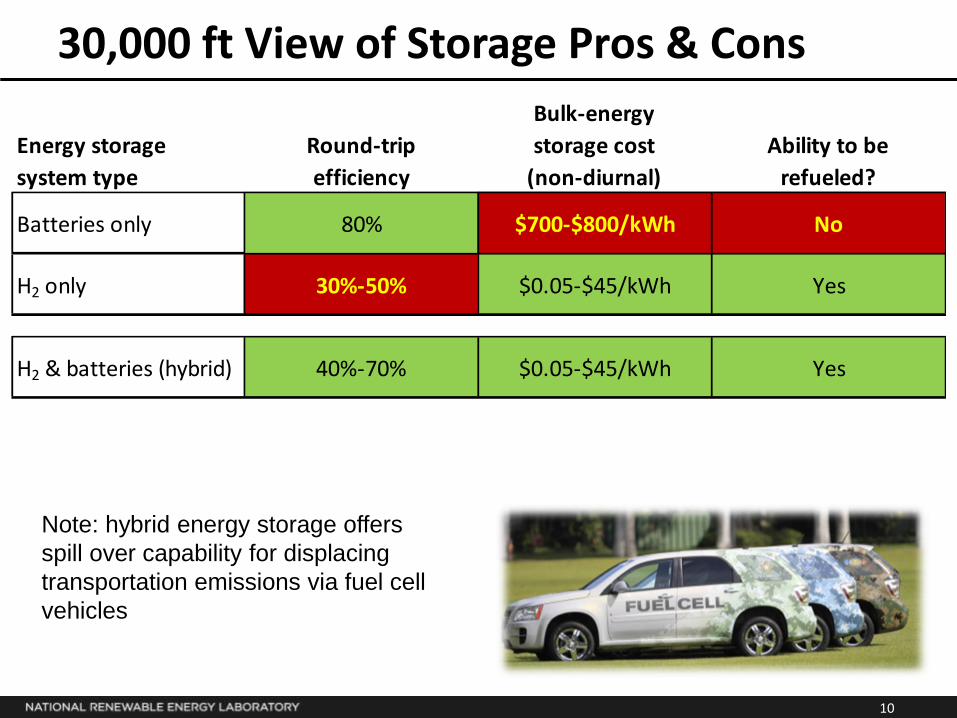
30,000 ft View of Storage Pros & Cons
Note: hybrid energy storage offers
spill over capability for displacing
transportation emissions via fuel cell
vehicles
Energy storage
system type
Round-trip
efficiency
Bulk-energy
storage cost
(non-diurnal)
Ability to be
refueled?
Batteries only 80% $700-$800/kWh No
H2 only 30%-50% $0.05-$45/kWh Yes
H2 & batteries (hybrid) 40%-70% $0.05-$45/kWh Yes
11
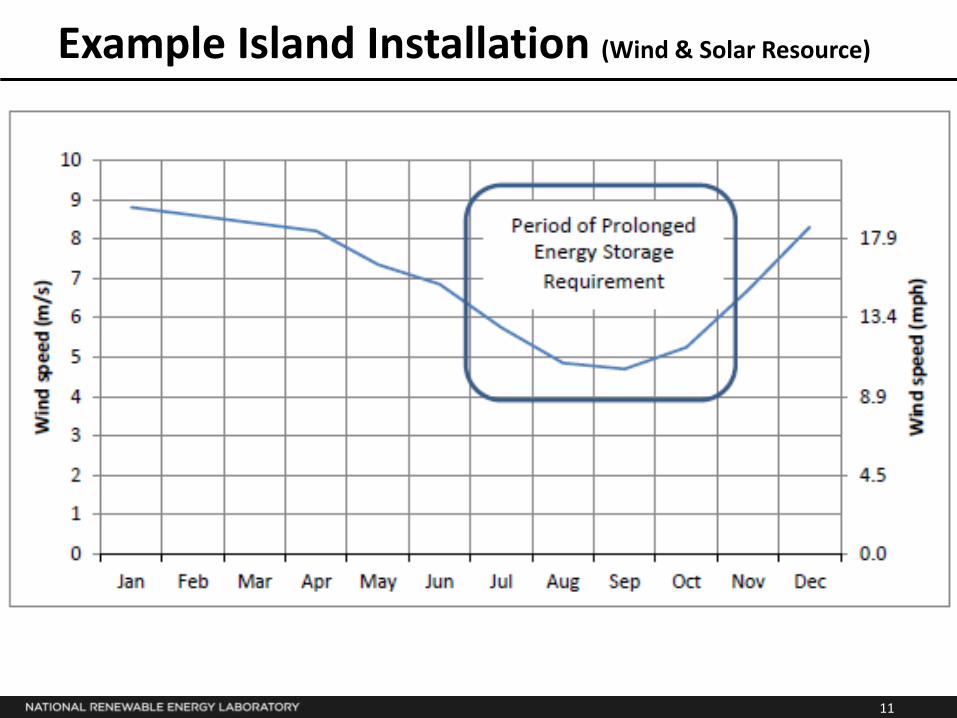
Example Island Installation (Wind & Solar Resource)
12
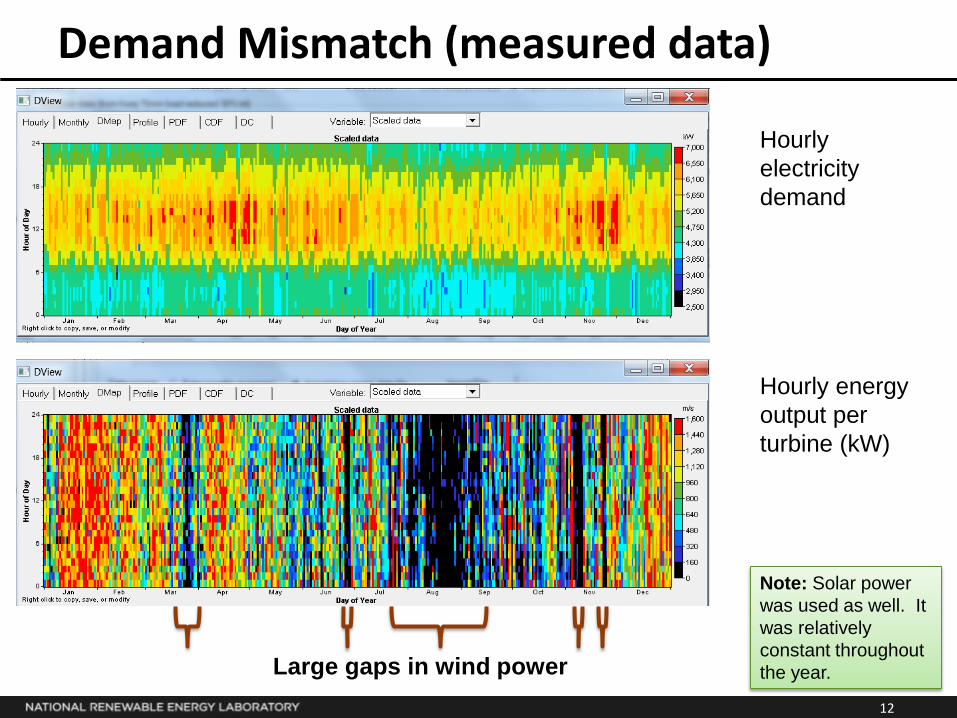
Demand Mismatch (measured data)
Hourly
electricity
demand
Hourly energy
output per
turbine (kW)
Large gaps in wind power
Note: Solar power
was used as well. It
was relatively
constant throughout
the year.
13
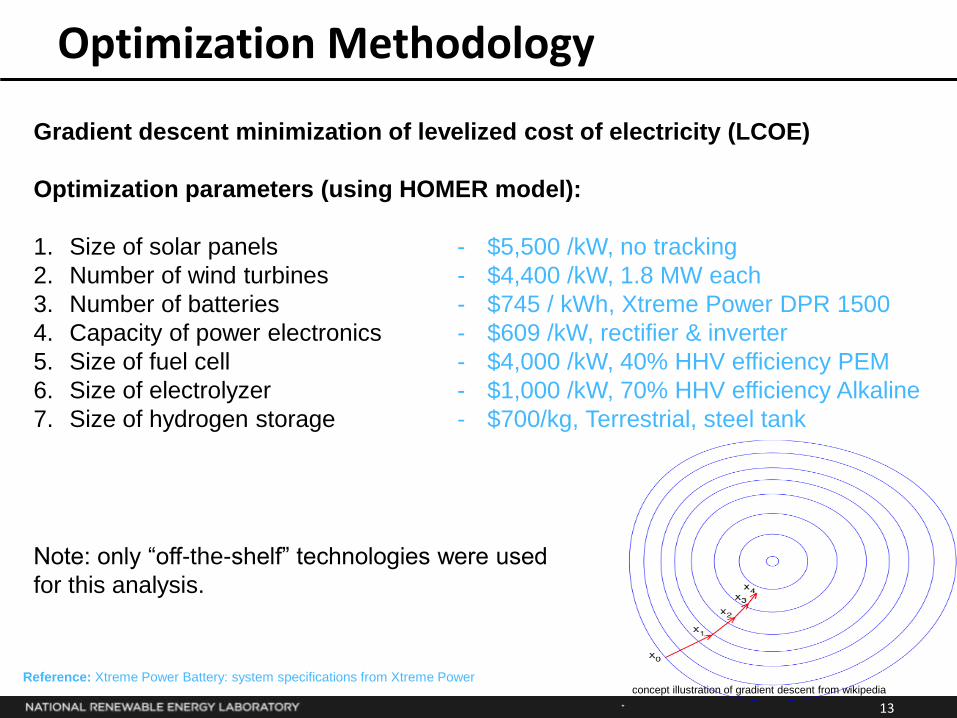
Optimization Methodology
Gradient descent minimization of levelized cost of electricity (LCOE)
Optimization parameters (using HOMER model):
1. Size of solar panels
2. Number of wind turbines
3. Number of batteries
4. Capacity of power electronics
5. Size of fuel cell
6. Size of electrolyzer
7. Size of hydrogen storage
concept illustration of gradient descent from wikipedia
- $5,500 /kW, no tracking
- $4,400 /kW, 1.8 MW each
- $745 / kWh, Xtreme Power DPR 1500
- $609 /kW, rectifier & inverter
- $4,000 /kW, 40% HHV efficiency PEM
- $1,000 /kW, 70% HHV efficiency Alkaline
- $700/kg, Terrestrial, steel tank
Note: only “off-the-shelf” technologies were used
for this analysis.
Reference: Xtreme Power Battery: system specifications from Xtreme Power
14
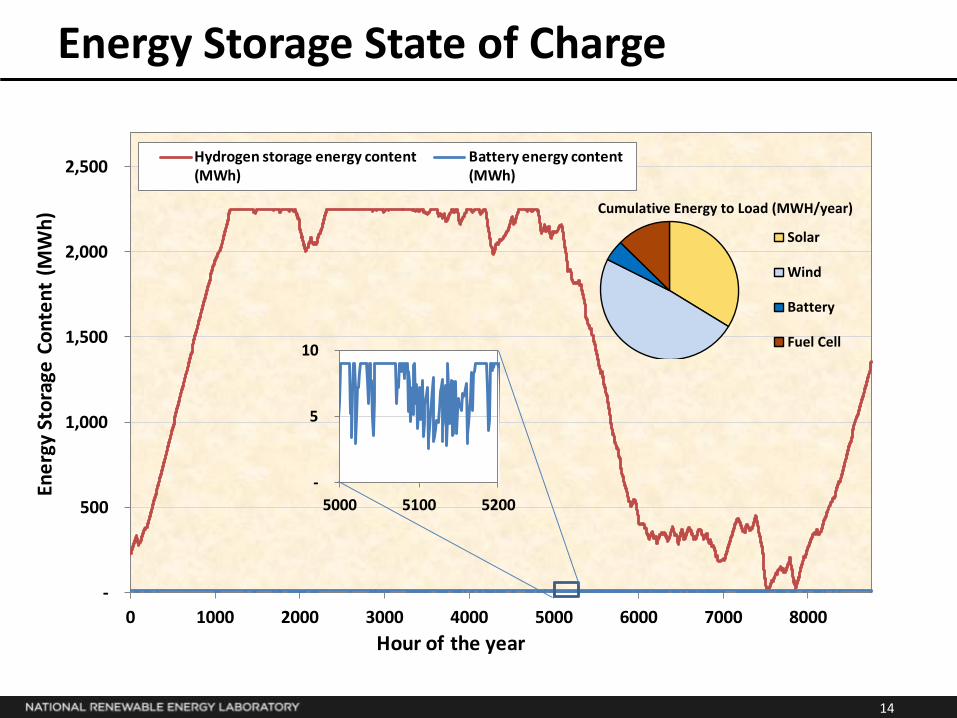
Energy Storage State of Charge
-
500
1,000
1,500
2,000
2,500
0 1000 2000 3000 4000 5000 6000 7000 8000
Hydrogen storage energy content(MWh)
Battery energy content(MWh)
Ene
rgy
Sto
rage
Co
nte
nt
(MW
h)
Hour of the year
-
5
10
5000 5100 5200
Solar
Wind
Battery
Fuel Cell
Cumulative Energy to Load (MWH/year)

15
Energy Storage State of Charge
Jan Feb Mar Apr May Jun Jul Aug Sep Oct Nov Dec0
6
12
18
24
Ho
ur
of
Day
Battery Energy Content
Day of Year
1,600
2,400
3,200
4,000
4,800
5,600
6,400
7,200
8,000
8,800
9,600
kWh
Jan Feb Mar Apr May Jun Jul Aug Sep Oct Nov Dec0
6
12
18
24
Ho
ur
of
Day
Stored Hydrogen
Day of Year
0
16,000
32,000
48,000
64,000
80,000
96,000
112,000
128,000
144,000
160,000
kg
Stored energy in batteries (MWh)
Stored hydrogen (MWh) MWh
2,400
2,160
1,920
1,680
1,440
1,200
960
720
480
240
-
MWh
9.6
8.8
8.0
7.2
6.4
5.6
4.8
4.0
3.2
2.4
1.6
Total batteries = 9 MWh, $6.8 million
Total H2 stored = 150,000 kg, $105 million

16
LCOE Vs. Renewables Fraction
$0.00
$0.05
$0.10
$0.15
$0.20
$0.25
$0.30
$0.35
$0.40
$0.45
0% 20% 40% 60% 80% 100%
LCO
E ($
/kW
h)
Renewable Fraction
100% renewable fraction solutions resulting LCOE: - 100% hydrogen = 0.51 $/kWh
- Hybrid hydrogen = 0.43 $/kWh
- 100% batteries = 3.56 $/kWh
17
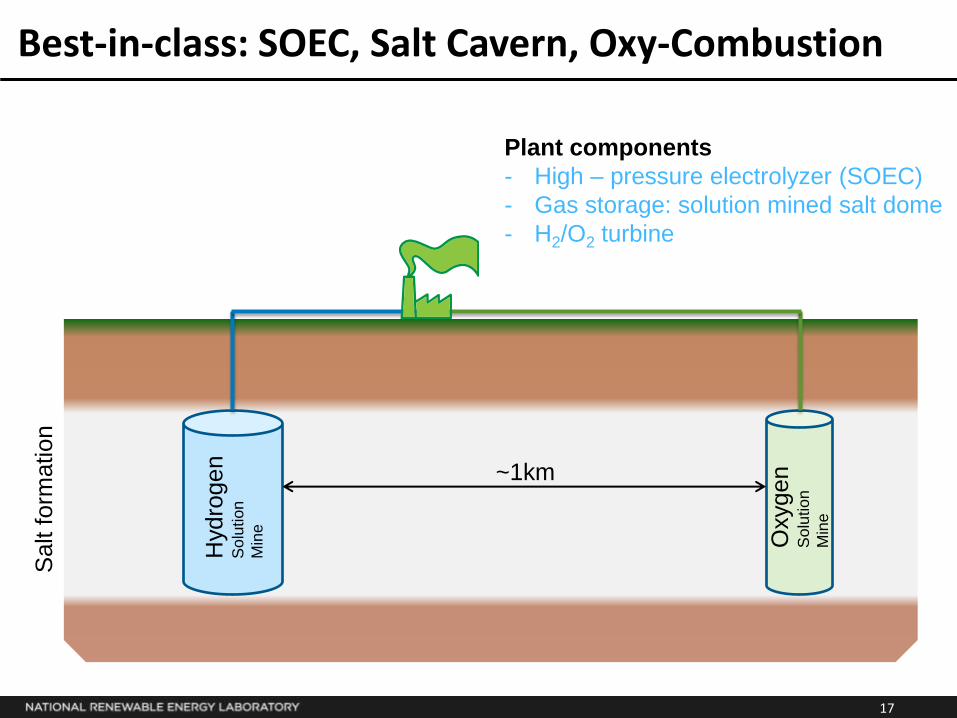
Best-in-class: SOEC, Salt Cavern, Oxy-Combustion S
alt f
orm
ation
Hydro
gen
So
lution
Min
e
Oxygen
So
lution
Min
e
~1km
Plant components
- High – pressure electrolyzer (SOEC)
- Gas storage: solution mined salt dome
- H2/O2 turbine
18
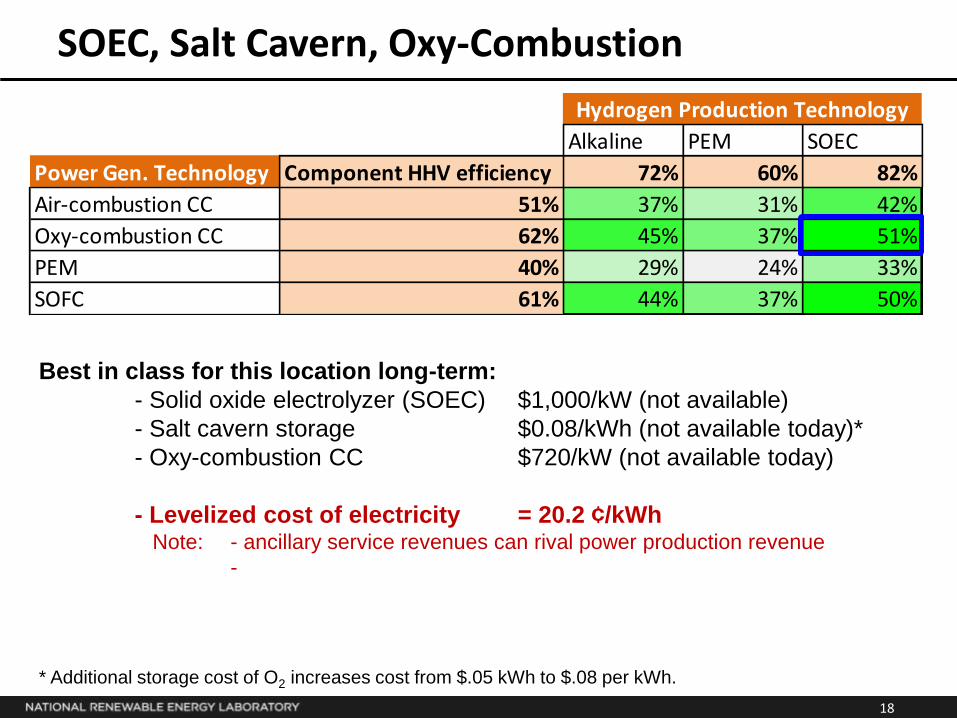
SOEC, Salt Cavern, Oxy-Combustion
Alkaline PEM SOEC
Power Gen. Technology Component HHV efficiency 72% 60% 82%
Air-combustion CC 51% 37% 31% 42%
Oxy-combustion CC 62% 45% 37% 51%
PEM 40% 29% 24% 33%
SOFC 61% 44% 37% 50%
Hydrogen Production Technology
Best in class for this location long-term:
- Solid oxide electrolyzer (SOEC) $1,000/kW (not available)
- Salt cavern storage $0.08/kWh (not available today)*
- Oxy-combustion CC $720/kW (not available today)
- Levelized cost of electricity = 20.2 ¢/kWh Note: - ancillary service revenues can rival power production revenue
-
* Additional storage cost of O2 increases cost from $.05 kWh to $.08 per kWh.

19
SOEC, Salt Cavern, Oxy-Combustion
PVLin
FCDPR1500
ConverterElectr.
H2 Tank0
20,000,000
40,000,000
60,000,000
80,000,000
100,000,000
Net Present Cost ($)
Cash Flow Summary
PV1.8MW Linearized
Fuel Cell
Xtreme Power DPR 1500
Converter
Electrolyzer
Hydrogen Tank
Solar panels
Wind turbines
H2/O2 turbine
Batteries
Power electronics
Electrolyzer
Hydrogen storage
Net present value (millions of $)
20 40 60 80 100 0
NPV of Equipment Cost (including O&M)
20
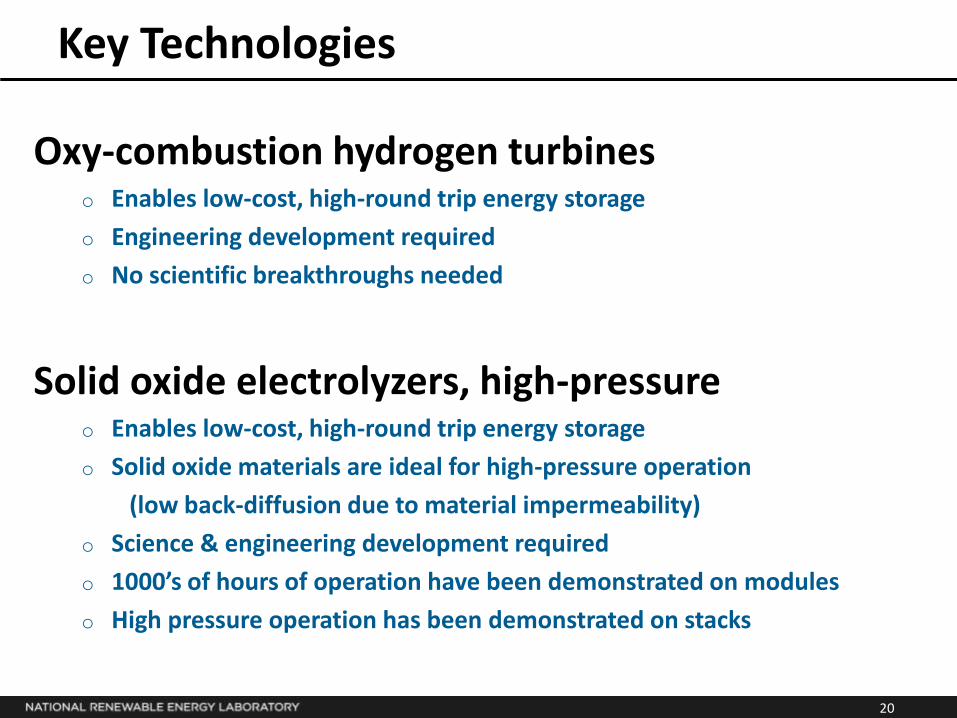
Key Technologies
Oxy-combustion hydrogen turbines o Enables low-cost, high-round trip energy storage
o Engineering development required
o No scientific breakthroughs needed
Solid oxide electrolyzers, high-pressure o Enables low-cost, high-round trip energy storage
o Solid oxide materials are ideal for high-pressure operation
(low back-diffusion due to material impermeability)
o Science & engineering development required
o 1000’s of hours of operation have been demonstrated on modules
o High pressure operation has been demonstrated on stacks

21
Talk Overview
Key Components of H2 Storage
Case Study of Islanded Hybrid-H2 Storage
Concept of Power to Gas Energy Storage
22
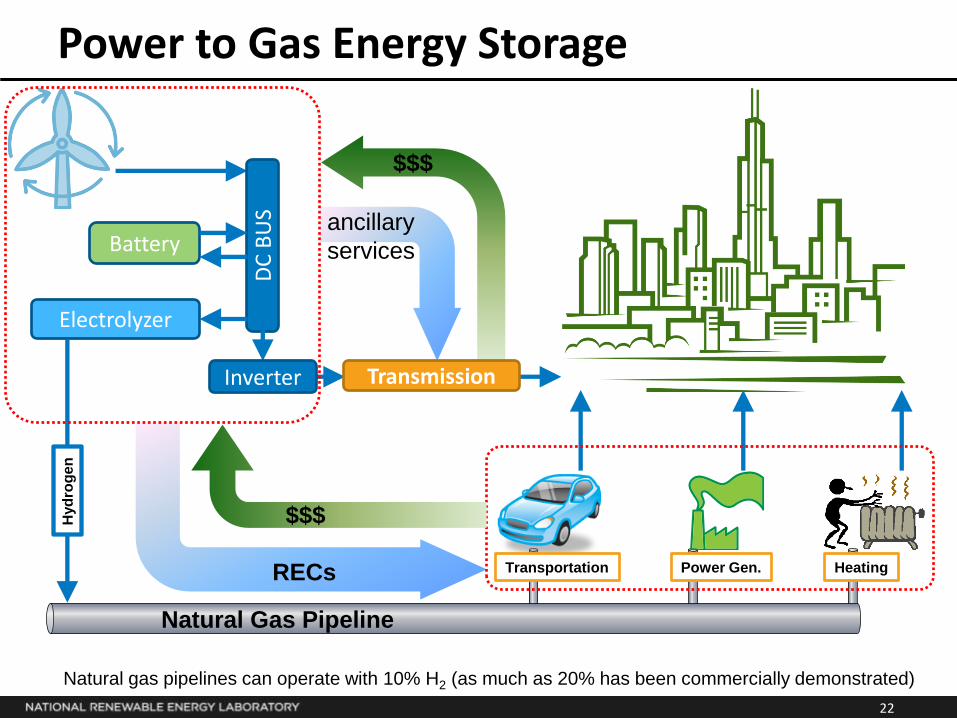
Power to Gas Energy Storage
Battery D
C B
US
Electrolyzer
Natural gas pipelines can operate with 10% H2 (as much as 20% has been commercially demonstrated)
Natural Gas Pipeline
Inverter
RECs
$$$
$$$
ancillary
services
Transmission
Transportation Power Gen. Heating
Hyd
rog
en

23
Questions?
24
BACKUP SLIDES
25
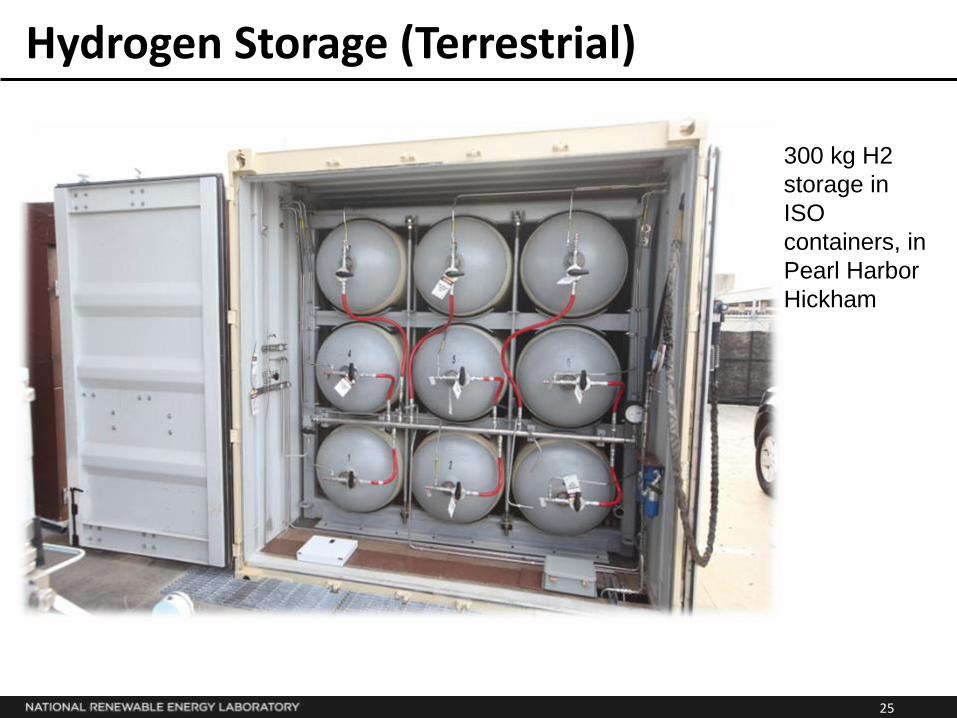
Hydrogen Storage (Terrestrial)
300 kg H2
storage in
ISO
containers, in
Pearl Harbor
Hickham
26
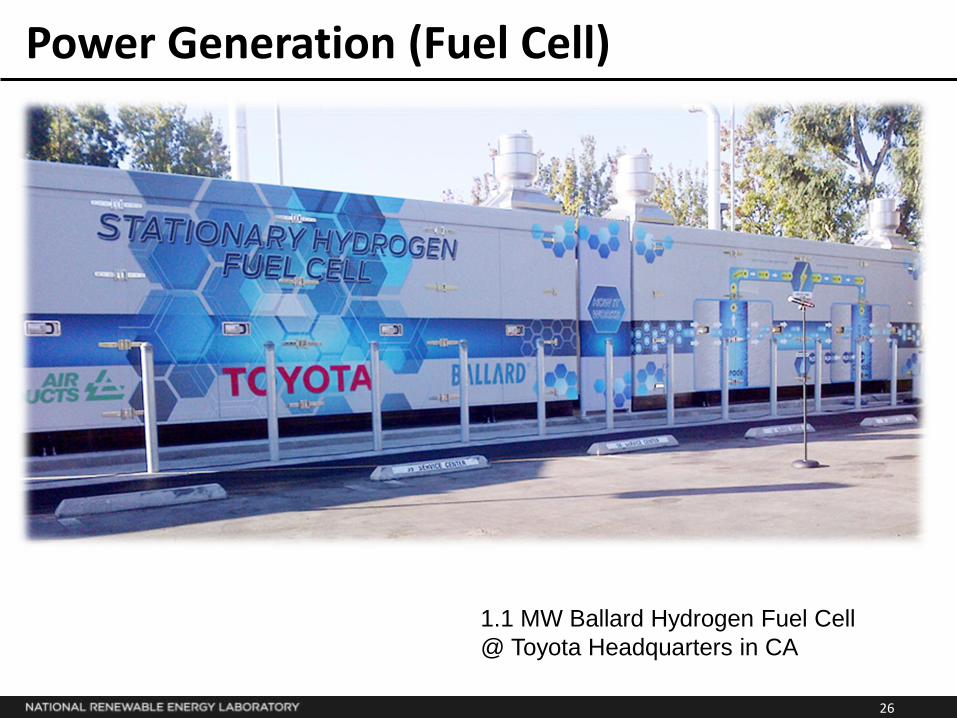
Power Generation (Fuel Cell)
1.1 MW Ballard Hydrogen Fuel Cell
@ Toyota Headquarters in CA
27
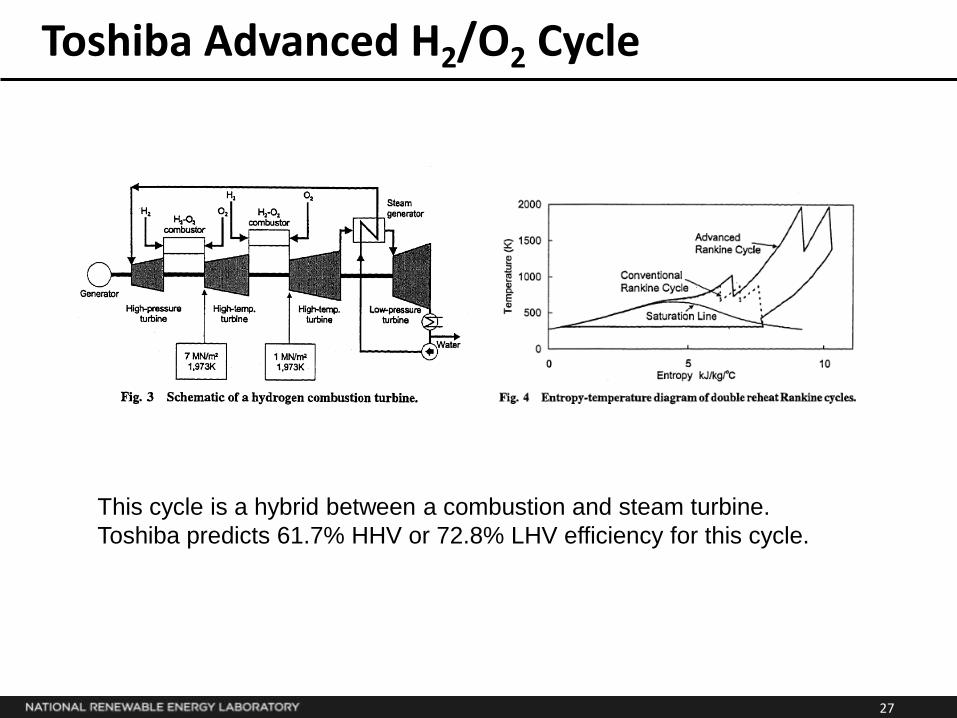
Toshiba Advanced H2/O2 Cycle
This cycle is a hybrid between a combustion and steam turbine.
Toshiba predicts 61.7% HHV or 72.8% LHV efficiency for this cycle.

28
Ongoing Efforts in Oxy-Combustion
• Siemens installation of oxygen-blown combustion turbine. • They experience efficiency gain of 10% on LHV basis over conventional systems. • This system is developed for CO2 sequestration.
29
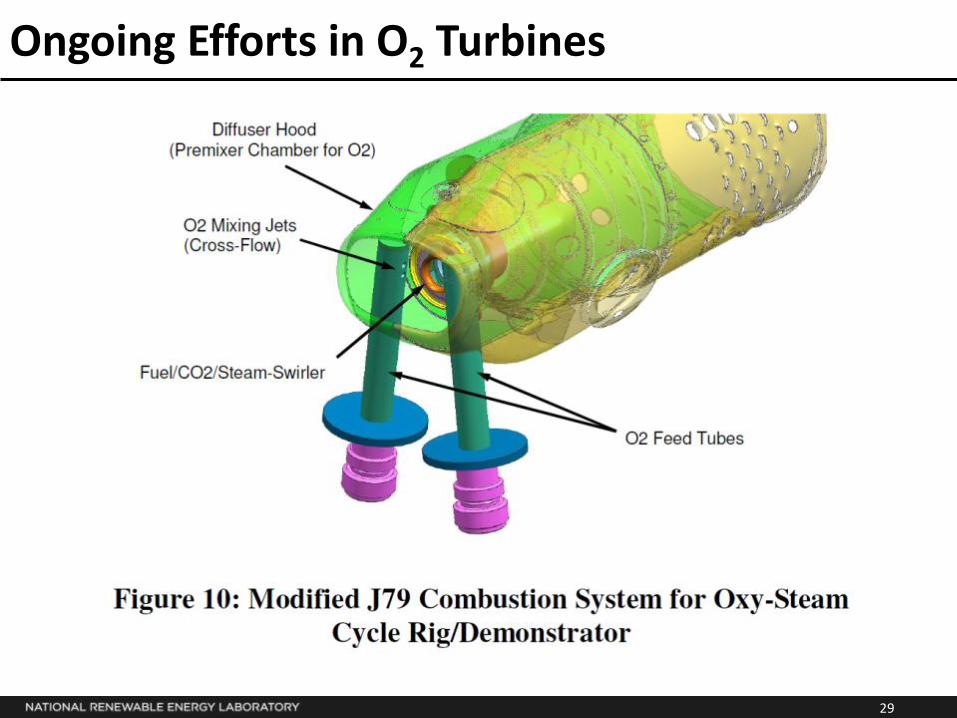
Ongoing Efforts in O2 Turbines

30
Combine Cycle (CC) Turbine
Diagram as seen on: http://www.victorvilletwo.com/
Combine cycle plants are
commonly designed for
peaking power. Their fuel is
more expensive than base-
load coal plants.
Plant efficiency 55-58% LHV
31 31
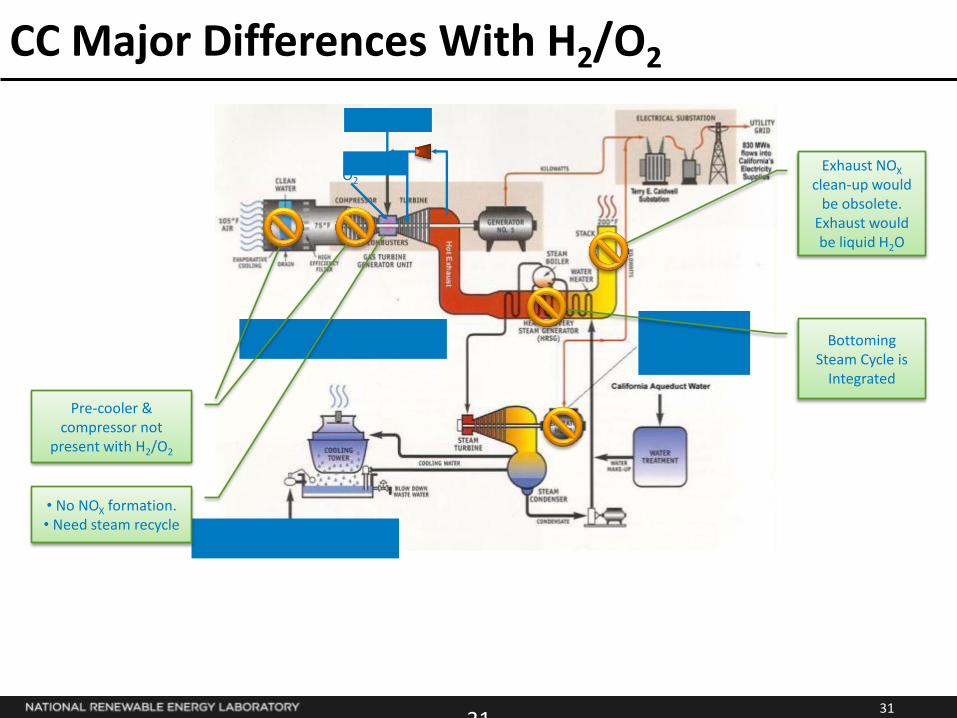
CC Major Differences With H2/O2
Bottoming Steam Cycle is
Integrated
Efficiency of a combine cycle is greatly impeded by atmospheric N2
- Compression shaft energy is used to compress N2
- N2 strips heat from the process, without providing power
- N2 produces NOX in the combustor
- NOX reduction strategies reduce burner efficiency
Pre-cooler & compressor not
present with H2/O2
• No NOX formation. • Need steam recycle
H2
O2
Exhaust NOX clean-up would
be obsolete. Exhaust would be liquid H2O
32
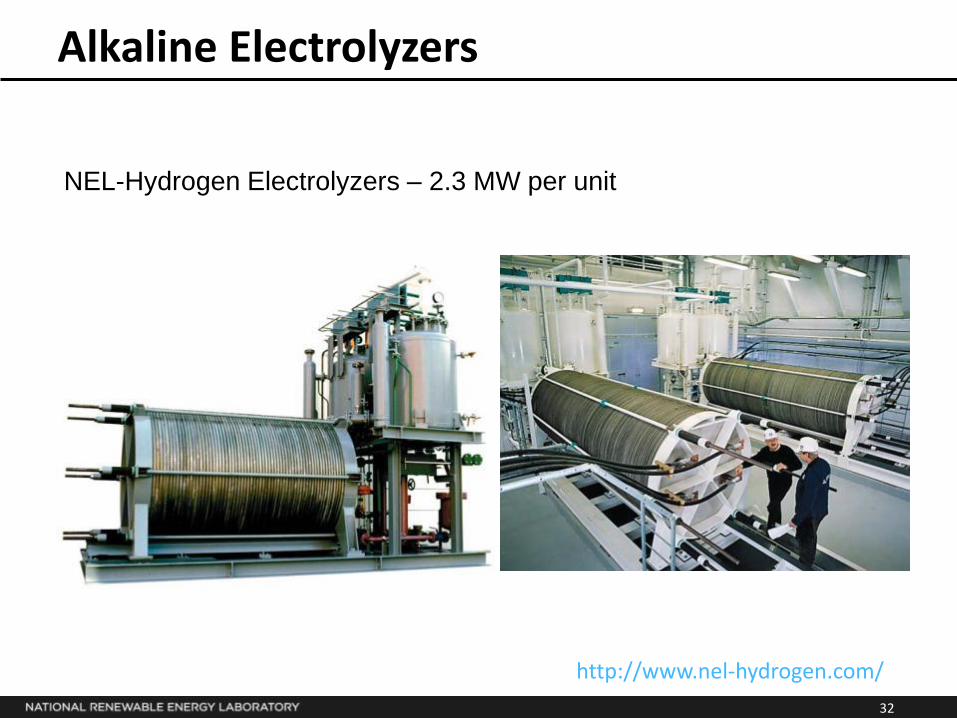
Alkaline Electrolyzers
http://www.nel-hydrogen.com/
NEL-Hydrogen Electrolyzers – 2.3 MW per unit
33
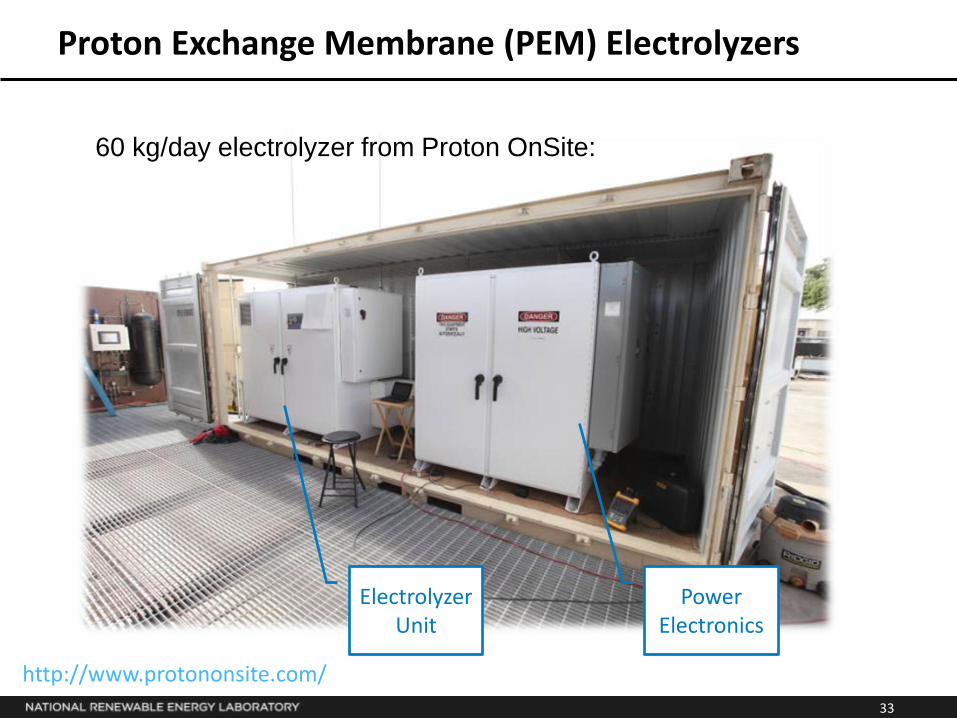
Proton Exchange Membrane (PEM) Electrolyzers
Electrolyzer Unit
Power Electronics
http://www.protononsite.com/
60 kg/day electrolyzer from Proton OnSite:
34
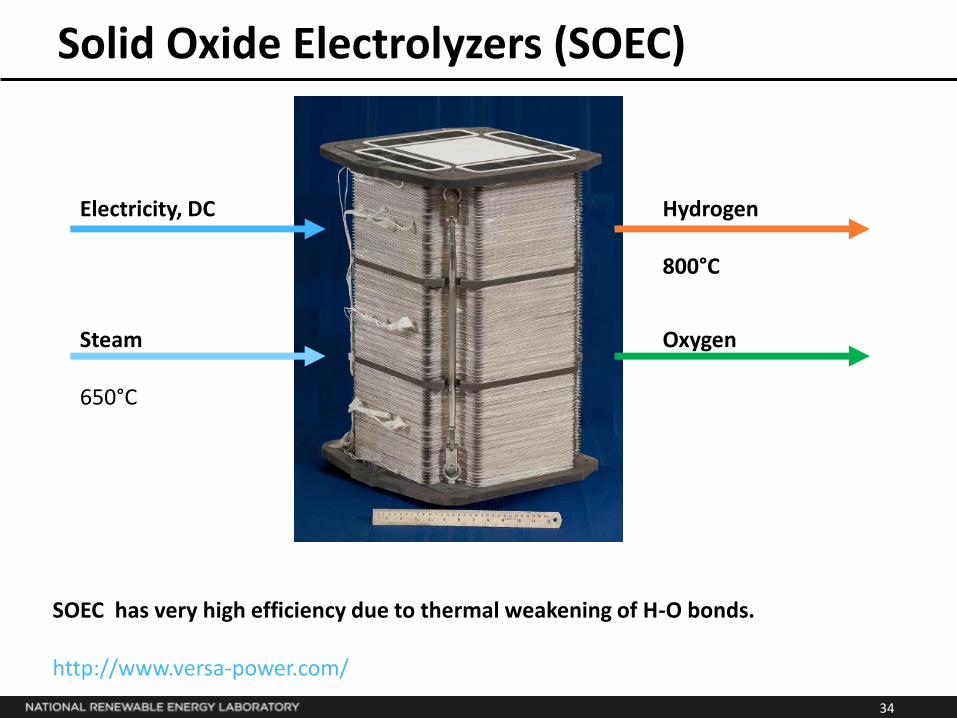
Solid Oxide Electrolyzers (SOEC)
Steam 650°C
Electricity, DC
Oxygen
Hydrogen 800°C
SOEC has very high efficiency due to thermal weakening of H-O bonds.
http://www.versa-power.com/
35
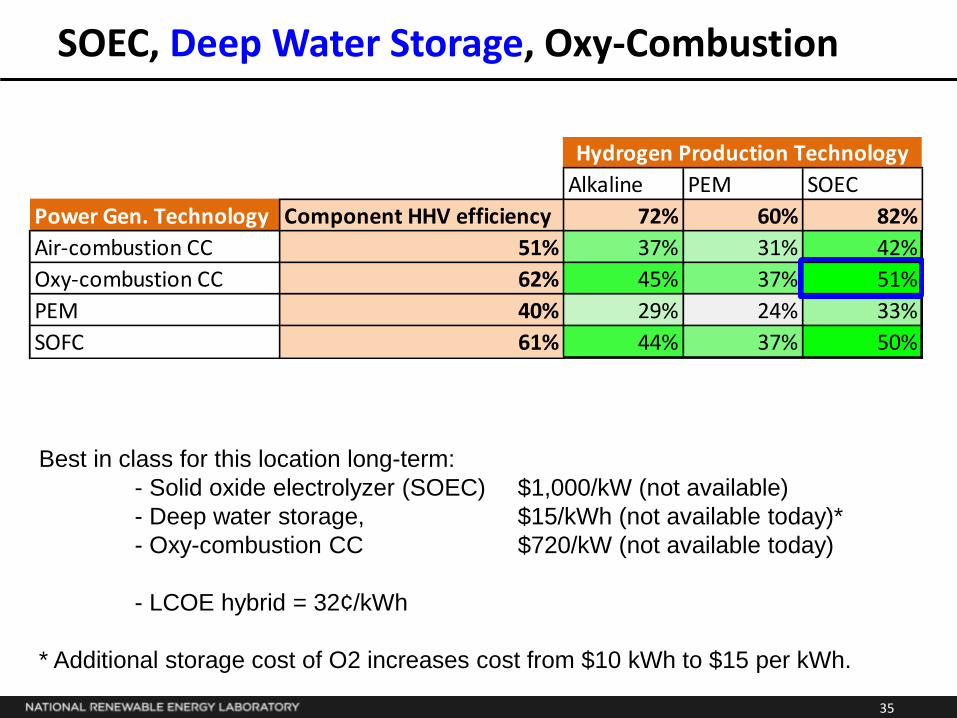
SOEC, Deep Water Storage, Oxy-Combustion
Alkaline PEM SOEC
Power Gen. Technology Component HHV efficiency 72% 60% 82%
Air-combustion CC 51% 37% 31% 42%
Oxy-combustion CC 62% 45% 37% 51%
PEM 40% 29% 24% 33%
SOFC 61% 44% 37% 50%
Hydrogen Production Technology
Best in class for this location long-term:
- Solid oxide electrolyzer (SOEC) $1,000/kW (not available)
- Deep water storage, $15/kWh (not available today)*
- Oxy-combustion CC $720/kW (not available today)
- LCOE hybrid = 32¢/kWh
* Additional storage cost of O2 increases cost from $10 kWh to $15 per kWh.
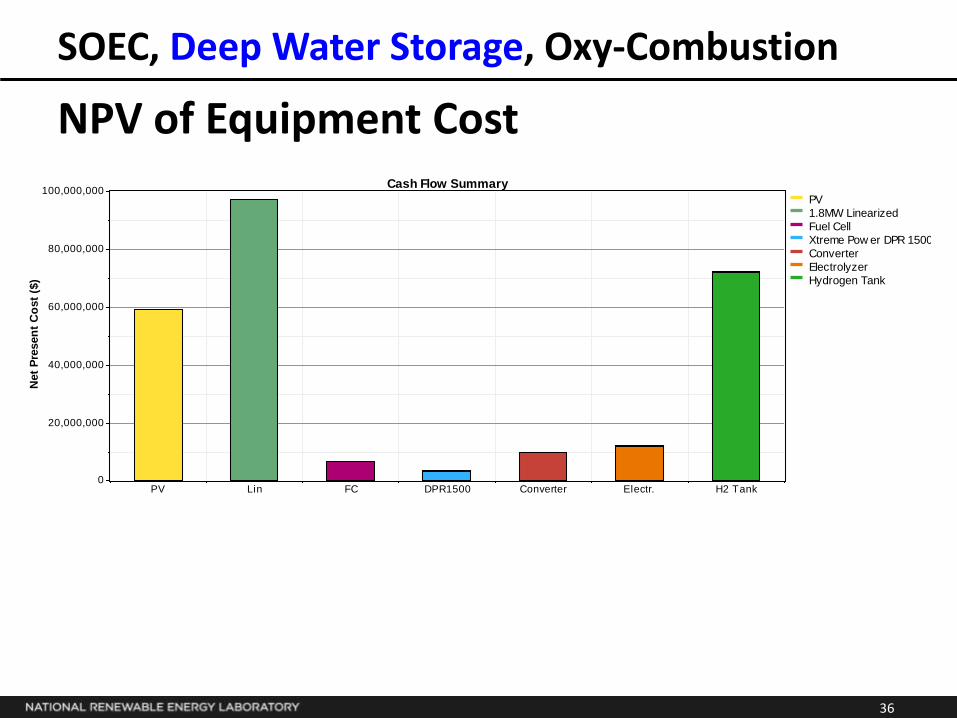
36
NPV of Equipment Cost
PV Lin FC DPR1500 Converter Electr. H2 Tank0
20,000,000
40,000,000
60,000,000
80,000,000
100,000,000
Net
Pre
sen
t C
ost
($)
Cash Flow Summary
PV
1.8MW Linearized
Fuel Cell
Xtreme Pow er DPR 1500
Converter
Electrolyzer
Hydrogen Tank
SOEC, Deep Water Storage, Oxy-Combustion

37
Alkaline, Salt Cavern, Oxy-Combustion
Alkaline PEM SOEC
Power Gen. Technology Component HHV efficiency 72% 60% 82%
Air-combustion CC 51% 37% 31% 42%
Oxy-combustion CC 62% 45% 37% 51%
PEM 40% 29% 24% 33%
SOFC 61% 44% 37% 50%
Hydrogen Production Technology
Best in class for this location long-term:
- Alkaline electrolyzer $1,000/kW
- Salt cavern storage $0.08/kWh (not available today)*
- Oxy-combustion CC $720/kW (not available today)
- LCOE hybrid = 21.3 ¢/kWh
* Additional storage cost of O2 increases cost from $.05 kWh to $.08 per kWh.
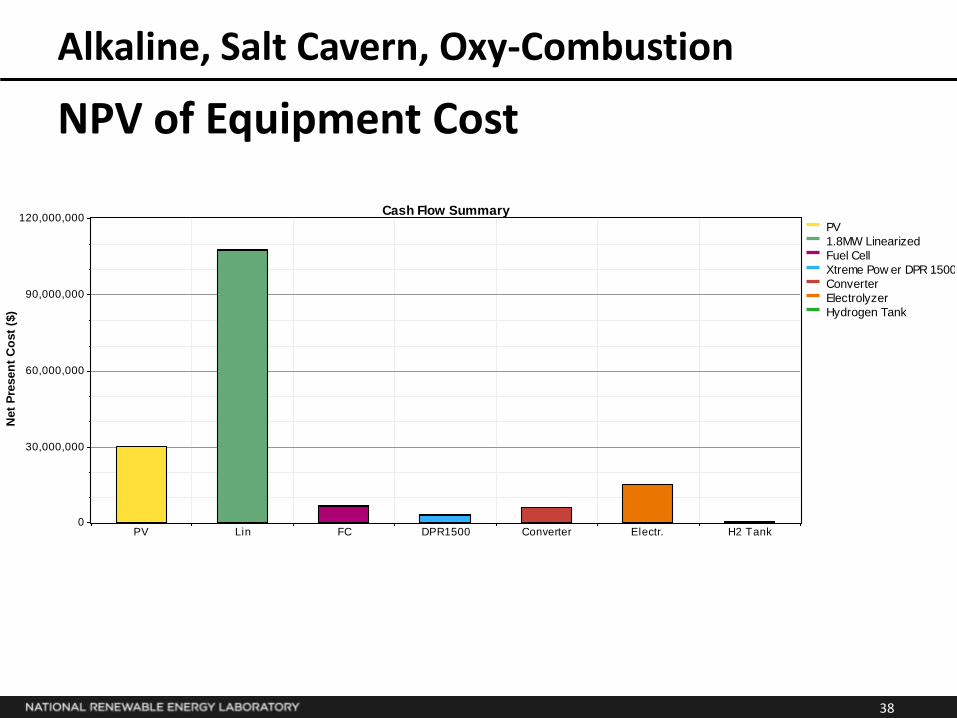
38
NPV of Equipment Cost
Alkaline, Salt Cavern, Oxy-Combustion
PV Lin FC DPR1500 Converter Electr. H2 Tank0
30,000,000
60,000,000
90,000,000
120,000,000
Net
Pre
sen
t C
ost
($)
Cash Flow Summary
PV
1.8MW Linearized
Fuel Cell
Xtreme Pow er DPR 1500
Converter
Electrolyzer
Hydrogen Tank