florida fish and wildlife conservation commission fish and wildlife conservation commission...
TRANSCRIPT

Florida Fish and Wildlife Conservation Commission Commissioners
Rodney Barreto
Chairman
Miami Richard A. Corbett
Vice Chairman
Tampa Kathy Barco
Jacksonville Ronald M. Bergeron
Fort Lauderdale Dwight Stephenson
Delray Beach Kenneth W. Wright
Winter Park Brian S. Yablonski
Tallahassee
Executive Staff
Nick Wiley
Executive Director Greg Holder
Assistant Executive Director Karen Ventimiglia
Deputy Chief of Staff
Managing fish and wildlife
resources for their long-term
well-being and the benefit
of people.
620 South Meridian Street
Tallahassee, Florida
32399-1600
Voice: (850) 488-4676
Hearing/speech impaired:
(800) 955-8771 (T)
(800) 955-8770 (V)
MyFWC.com
Imperiled Species
Management Section
Kipp Frohlich
Section Leader
(850) 922-4330
(850) 922-4338 fax
June 29, 2010
Committee Members
Broward County Local Rule Review Committee
Thank you for agreeing to serve on the Local Rule Review Committee (LRRC) for
Broward County. The Florida Fish and Wildlife Conservation Committee (FWC) is
required to initiate the LRRC process before proposing new or amended rules that
would regulate the speed and operation of motorboats for the purpose of manatee
protection. The letter we sent on March 15, 2010, to notify Broward County of our
intent to consider rule making (copy attached) provides additional information about
the LRRC process and other background information.
As stated in the letter, the FWC is reviewing the existing Broward County rule to
determine if any modifications should be made. Based on our preliminary staff
review and issues raised by others, a number of potential rule changes have been
identified. The potential rule changes and a discussion of the rationale for them are
detailed in the attached document (Data Discussion and Preliminary Identification
of Areas for LRRC Review). It is important to stress that the potential changes are
not final staff recommendations. Before we finalize the staff recommendations, we
want to fully evaluate the perspectives and issues raised during the LRRC process.
We therefore request that the LRRC review the identified potential rule changes and
provide recommendations as to what changes, if any, should be proposed. If the
LRRC identifies any other changes it feels are needed, we would like to know about
these as well.
We have provided County staff with the documents mentioned above as well as other
documents that may be of interest. A list and description of the documents is
included in Appendix A of the attached document. Geographic information system
(GIS) data used in the analyses are also listed in Appendix A. The GIS data, which
can be displayed, queried, and analyzed in ArcGIS®, are available if desired.
In closing, I want to again thank you for agreeing to serve on the Broward County
LRRC. The FWC greatly appreciates the work that you will perform. I can assure
you that FWC staff and the Commissioners will give very careful and deliberate
consideration to the recommendations that the LRRC provides. We look forward to
working with you.
Sincerely,
R. Kipp Frohlich, Section Leader
Imperiled Species Management Section
Attachments

Broward County Manatee Protection Rule Review
Data Discussion and Preliminary Identification of Areas for LRRC Review
Prepared by FWC staff for use by the Broward County Local Rule Review Committee (LRRC)
June 2010
This document summarizes and discusses the primary data and analyses used during the Florida Fish and Wildlife
Conservation Commission’s (FWC) preliminary review of the Broward County manatee protection rule. The document
identifies and discusses 12 potential rule changes that may be warranted based on the data review and other factors. At
this time staff has not made a final determination as to whether any of these potential rule changes should be presented
to the FWC Commissioners for consideration. Prior to making a final determination, staff will fully evaluate the local
perspective as provided by the LRRC. The FWC requests that the LRRC review these potential changes and provide
recommendations as to what changes, if any, it believes should be made. This document should not be construed to
limit what information the LRRC may consider or what rule changes it can recommend. The LRRC report may contain
any recommendations the LRRC deems worthy and the FWC response to the LRRC report will address all
recommendations.
A. Overview of Data Analysis
1. Notes on data analysis and data sources
a. For purposes of analyzing and summarizing data, the county was divided into four primary zones, with three
of the four primary zones further subdivided into two or more smaller sub-zones (Figure 1). The primary
zones were: North County (north of East Las Olas Blvd, including the Hillsboro Canal, Pompano Canal, and
Middle River); Port Everglades (Intracoastal Waterway (ICW) area between East Las Olas Blvd and the Dania
Cutoff Canal); South County (south of the Dania Cutoff Canal); and, Inland Areas (inland waterways generally
west of Port Everglades, including New River, Dania Cutoff Canal, and the C-10 Canal).
b. For purposes of creating maps to display data, the county was divided into four regions: the North Region
extends from the Palm Beach County line to the vicinity of Commercial Blvd; the North-Central Region runs
from the vicinity of Commercial Blvd to just north of the Dania Cutoff Canal; the South Region extends from
the vicinity of SE 17th Street to the Miami-Dade County line; and, the Inland Region covers the inland
waterways generally west of Port Everglades.
c. Because manatee use of Broward County is highly seasonal, data were mapped and analyzed using a cold
season (Nov – Mar) and a warm season (Apr – Oct) rather than as combined year-round data.
d. The primary data used in this review are listed below and/or discussed in the following sections. Other data
that are not discussed in this document were also considered in the review, such as manatee telemetry data.
These data and other information are included in the list of supporting data (Appendix A).
e. Manatee aerial survey (AS) data for Broward County have been collected during several different periods in
the last 20-30 years. Although all available data were reviewed, detailed analyses used only data from the
1988-92 and 2004-09 periods. The 1988-92 data were the primary AS data available when the countywide rule
was first developed in the early 1990s, while the 2004-09 data represent current use and distribution.
f. Manatee mortality data have been collected since 1974. Data through December 2009 were used for this
review.
g. The primary boating data used for this review were collected by Mote Marine Laboratory (MML) in 2004-05
using aerial surveys. The written final report prepared by MML and provided to the FWC in June 2005 has
been provided to County staff.
h. Data on seagrass were collected by Broward County staff in 2006-07. The data represent where seagrass was
present based on field measurements. Positions are approximate, and additional areas of seagrass are believed
to exist but have not yet been verified.
2. Notes on manatee aerial survey data and comparisons between 1988-92 and 2004-09
a. The data do not account for manatees that may have been present but not counted during the surveys due to a
variety of potential survey biases (e.g., detection and availability biases). These biases can and likely do vary
spatially and temporally so counts should not be assumed to represent the absolute number of manatees that
were using the area when the surveys were flown. Failure to account for the biases (which cannot be done
after-the-fact given the survey design) limits how much significance should be placed on the results. This same

- 2 -
situation exists in almost all other areas where data have been collected. Nevertheless, we believe the data are
still useful in assessing the relative abundance and distribution of manatees and potential changes over time.
b. Data for the 1988-92 period were collected during two separate survey efforts: 1988-90 and 1991-92. The
combined period includes data from 60 surveys.
c. The 1988-90 data include a total of 48 surveys, flown between January 1988 and March 1990. The survey
area covered the ICW area but not Hillsboro Canal, the Pompano Canal area, Middle River, or inland areas.
d. The 1991-92 data include a total of 12 surveys, flown between November 1991 and September 1992. The
survey area covered the ICW area and the inland areas but not Hillsboro Canal, the Pompano Canal area, or
Middle River.
e. Data for the 2004-09 period were collected during two separate survey efforts: 2004-07 and 2007-09. The
combined period includes data from 93 surveys.
f. The 2004-07 data include a total of 48 surveys, flown between January 2004 and April 2007. The survey area
covered the ICW area, Hillsboro Canal, Middle River, and inland areas, but not the Pompano Canal area. The
South Fork of the Middle River was not surveyed consistently because of the limited ability to see manatees
due to overhanging vegetation and related issues.
g. The 2007-09 data include a total of 45 surveys, flown between November 2007 and December 2009. Most of
the surveys were flown during the cold season. The survey area covered the ICW area, Hillsboro Canal, the
Pompano Canal area, Middle River, and inland areas; however, the Pompano Canal area, Middle River, and C-
10 Canal were not included in many of the surveys. As with the 2004-07 surveys, the South Fork of the Middle
River was not surveyed consistently because of the limited ability to see manatees due to overhanging
vegetation and related issues.
h. Because the areas surveyed within Broward County during the various survey efforts were not identical, the
sighting densities and percent totals reported in Table 1 were not all based on the exact same areas. Also, eight
manatees seen in nearshore waters of the Atlantic Ocean were not included in the analyses.
3. Notes on manatee mortality data
a. Each data point in the mortality database represents the location where a carcass was recovered and not
necessarily the location where a manatee died. In many cases, winds and currents can move a carcass after a
manatee has died and, in the case of boat-related deaths, if a manatee is not killed immediately it can move
under its own power before ultimately succumbing to its injuries. Depending on the nature and extent of the
injuries, manatees can sometimes survive for days or weeks (and occasionally even months) after being hit by
a boat. For these reasons, care should be taken when interpreting these data because the absence of data points
cannot be assumed to mean no deaths occurred and vice versa.
4. Notes on boat aerial survey data
a. The 2004-05 boat data include a total of 17 surveys, flown between May 2004 and January 2005. Two
surveys were flown on each survey date (except for one day when only one survey was flown), one in the
morning and one in the afternoon, with the surveys split evenly between weekdays and weekends. The survey
area covered the ICW area (but only as far south as Hallandale Beach Blvd), the Pompano Canal area, Middle
River, and inland areas, but not most of Hillsboro Canal or the C-10 Canal. Surveys of the inland areas were
often abbreviated due to flight restrictions imposed by the Ft. Lauderdale airport. A total of 3452 boats were
recorded, including 42 in the extreme southern portion of Palm Beach County.
b. The boat data used in the manatee-boat coincidence analysis (see below) was a subset of the overall dataset.
Not included in the analysis were the following categories of boats: Type = Other and Size < 16 feet
(predominately unpowered canoes and kayaks); and, Type = Sailboat and Size < 16 feet (predominately
unpowered sailboats). There were 128 boats in these excluded groups. The reduced subset (“All Boats”)
included a total of 3342 boats.
c. The “All Boats” dataset was further subdivided to create a “Fast Boats” dataset, which included only boats
with Speed = Planing, Cruising, or Plowing. The Fast Boats dataset included a total of 889 boats, or 27% of
the All Boats dataset.
5. Notes on manatee-boat coincidence
a. The manatee and boat aerial survey point data were processed in ArcGIS using the kernel density command
with a cell size of 25 meters and a search radius of 325 meters. Coincidence values were calculated by
multiplying the per survey manatee cover by the per survey boating cover.

- 3 -
b. Because no boat aerial survey data were collected prior to 2004, we only calculated coincidence values using
the 2004-09 manatee data. Because of this, no comparisons of coincidence can be made between 2004-09 and
1988-92, as was done for the manatee data.
c. Two coincidence covers were created for each season, one using the All Boats dataset (“Coin”) and one using
just the Fast Boats dataset (“Fast Coin”), as described above. The ratio of Fast Coin to Coin gives an indication
of how much of the overall coincidence was the result of boats traveling at higher speeds.
6. Areas where a rule change may be warranted
Site-specific areas identified as potentially warranting a rule change are discussed in the zone by zone
discussions below, with issues not tied to a specific site discussed after the zone by zone discussions. Figures
showing the locations of the site-specific areas are also included for each region.
B. Countywide Data Summary
1. Comparison of manatee aerial survey data from 2004-09 vs. 1988-92
a. The mean density of manatees seen per km2 per survey (“manatee density”) increased during both the cold
season and warm season between 1988-92 and 2004-09, with a much more substantial increase during the cold
season. The manatee density during the cold season increased from 3.90 to 10.48, while it increased from 0.45
to 0.60 during the warm season. Table 1 summarizes the aerial survey data by zone and season.
b. Considering the relative proportion of manatees seen in each zone, there were some changes between 1988-92
and 2004-09. The most noticeable change for the cold season was an increase in the proportion of manatees
using the inland power plant area (5% for 1988-92; 53% for 2004-09) and a corresponding decrease in the
proportion using the Port Everglades power plant (76% for 1988-92; 29% for 2004-09). Changes for the warm
season were more subtle, with the most noticeable change being an increase in the proportion of manatees
using the North County zone (11% for 1988-92; 34% for 2004-09).Changes in use and distribution are
discussed in greater detail in the zone by zone discussions below.
2. Manatee mortality
a. 203 carcasses were recovered in the county through 2009, with 68 (33%) recovered during the warm season
and 135 (67%) recovered during the cold season. (The warm season account for 58% of the year while the cold
season account for 42%.) The “Boat-related” category had the most deaths (70). “Undetermined/Unrecovered”
and “perinatal” deaths were the next two highest categories, with 56 and 39 deaths, respectively. Table 2
summarizes the mortality data by zone and season.
b. Of the 70 boat-related deaths recorded in the county, 47 (67%) were recovered during the cold season and 23
(33%) were recovered during the warm season. Half of the boat-related deaths (35) were recovered in January
or February. Six boat-related deaths (in 2006) are the most ever recovered in the county in one year, followed
by five (in 1987, 1999, and again in 2003). Table 3 summarizes the mortality data by year and category.
3. Manatee-boat coincidence
a. The mean overall “All Boats” coincidence value (“Coin”) and the mean overall “Fast Boats” coincidence
value (“Fast Coin”) were each 4-5 times greater for the cold season (Coin = 4.34; Fast Coin = 1.45) than the
corresponding values for the warm season (Coin = 1.04; Fast Coin = 0.28). Table 4 summarizes the
coincidence analysis results by zone and season.
b. The overall ratio of Fast Coin to Coin was greater during the cold season (0.33) than it was during the warm
season (0.27), which is a bit surprising given the existing manatee protection zones are more restrictive in
many places during the cold season.
c. These data suggest the overall boating risk to manatees is substantially higher during the cold season and that
fast boats also represent a higher proportion of the risk during this time.
C. North County
1. Comparison of manatee aerial survey data from 2004-09 vs. 1988-92 (Table 1; Figures 2-5 & Figures 14-17)
a. The manatee density increased during both the cold season and warm season between 1988-92 and 2004-09,
with both mean densities increasing by a factor of close to three. The manatee density during the cold season
increased from 0.71 to 1.90, while it increased from 0.15 to 0.47 during the warm season. The relative

- 4 -
proportion of manatees seen in this zone during the warm season was noticeably higher in 2004-09 (34%, up
from 11%), while the proportions stayed about the same for the cold season. Some of the difference can be
explained by the fact the Middle River was surveyed in 2004-09 but not in 1988-92.
b. Regarding the relative distribution of manatee sightings within this zone, areas that had high relative densities
in 1988-92 continued to have high relative densities in 2004-09; however, more of the area had high-end
densities in 2004-09, particularly during the cold season in the portion of the zone north of NE 14th Street. The
area in and around Hillsboro Inlet had the highest densities in this zone during both periods.
2. Manatee mortality (Table 2; Figure 6 & Figure 18)
a. 38 carcasses were recovered in this zone, with eight of these attributed to boats (five of which occurred since
2000). Six of the boat-related deaths were recorded during the cold season and two during the warm season.
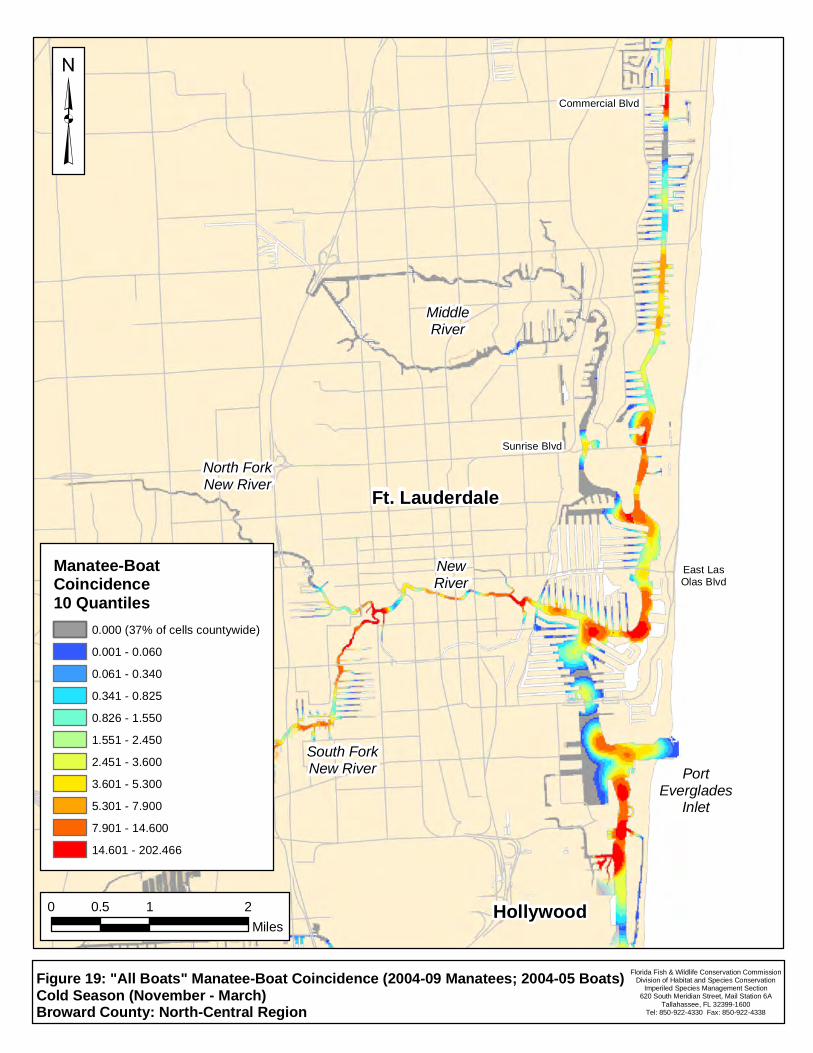
3. Manatee-boat coincidence (Table 4; Figures 7-10 & Figures 19-22)
a. Cold season: Coin for this zone was 5.23 and FastCoin was 1.95. The FastCoin value was close to 35% above
the mean FastCoin value for the whole county. The North County to Hillsboro Inlet area and continuing south
to Atlantic Blvd had some of the highest FastCoin values. Much of the higher FastCoin values occurred in
areas that are currently regulated at Idle Speed or Slow Speed for boating safety and/or manatee protection
purposes.
b. Warm season: Coin for this zone was 1.26 and FastCoin was 0.29. The FastCoin value was only slightly
greater than the mean FastCoin value for the whole county.
4. Other information
a. Figure 11 & Figure 23 show the locations of seagrass in 2006-07.
b. Figure 12 & Figure 24 show the existing FWC manatee protection zones and boating safety zones.
5. Areas where a rule change may be warranted (Figure 13 & Figure 25)
a. C1: Hillsboro Canal. This area had moderate to high manatee density during both the cold season and the
warm season. Boat data was not collected for most of the canal so manatee-boat coincidence could not be
calculated. Most of the canal is a year-round 50-foot Slow Speed shoreline buffer with the area beyond the
buffer unregulated. The middle of the canal is the boundary between Broward County and Palm Beach
County. The northern portion of the canal is regulated by the Palm Beach County rule as a year-round 50-foot
Slow Speed shoreline buffer. FWC has received requests from law enforcement to make the entire canal a
shore-to-shore Slow Speed zone.
Potential Rule Change (year-round): Change the 50-foot Slow Speed shoreline buffer to a shore-to-shore Slow
Speed zone. This change could not be fully implemented unless the Palm Beach County rule was also
changed.
b. C2: Hillsboro Inlet Area. This area (from marker “68A” to just south of NE 14th Street) had high manatee
density and FastCoin during both the cold season and the warm season but is only regulated at Slow Speed
during the cold season. This area is regulated year-round for boating safety.
Potential Rule Change (warm season): Change the existing cold season Slow Speed zone to a year-round zone.
This change would not have any effect on-water because of the existing boating safety zones. This change
would be consistent with the resolution passed by the city of Lighthouse Point (see Area C3, below) except
that the City requested Idle Speed.
c. C3: Intracoastal Waterway (ICW) from Palm Beach County line to Marker “68A”. This area had high manatee
density and FastCoin during the cold season. Most of this area is regulated at Slow Speed on weekends only
during the cold season (25 MPH with a 50-foot Slow Speed buffer during other times). The area between
markers “68” and “68A” (approximately 4600 feet) is also regulated as a year-round Idle Speed boating safety
zone. The city of Lighthouse Point passed a resolution in June 2010 requesting that the entire ICW within its
jurisdiction be changed to a year-round Idle Speed zone; the northern city limit is approximately 3100 feet
north of marker “68”.

- 5 -
Potential Rule Change (cold season): Change the existing cold season weekend only Slow Speed zone to all
days during the cold season. For the cold season (but not the warm season), this change would be consistent
with the resolution passed by the city of Lighthouse Point except that the City requested Idle Speed.
d. C4: ICW from NE 14th Street to Atlantic (or possibly Commercial) Blvd. This area had high manatee density
and moderate FastCoin during the cold season. This area is regulated at Slow Speed on weekends only during
the cold season (25 MPH with a 50-foot Slow Speed buffer during other times). FWC has received requests
from the public to make the area between NE 14th Street and Atlantic Blvd a year-round Idle Speed or Slow
Speed zone.
Potential Rule Change (cold season): Change the existing cold season weekend only Slow Speed zone to all
days during the cold season.
e. C5: ICW from Palm Beach County line to Burnham Point. This area includes the area covered by C3 and C4
plus additional area to the south (but not the Hillsboro Inlet zone). This area, which had moderate manatee
density and FastCoin during the warm season, is regulated at 25 MPH with a 50-foot Slow Speed buffer during
the warm season. There are multiple boating safety zones in this area as well as an underlying 30 MPH zone
with a 15-inch wake limitation that was established by a Special Act of the Florida Legislature. This latter
zone is not currently posted because the existing boating safety and manatee protection zones completely
overlap it with more restrictive zones.
Potential Rule Change (warm season): Remove the entire warm season manatee protection zone or possibly
change it to a shore-to-shore 25 MPH zone (i.e., remove only the 50-foot Slow Speed buffers). Removal of the
zone completely would mean the areas outside of the other existing zones would be governed by the Special
Act zones. Removal of the shoreline buffer is not expected to have any significant negative effects because
boat lifts, docks, and other shore-based structures already limit high speed boat operation in many parts of this
area. Removal of the buffer would make zone marking much easier because the regulatory markers would
need to contain much less text.
f. C6: Entrance to Pompano Canal / Cypress Creek. The area east of US 1 and west of the ICW is currently
unregulated but sandwiched between the year-round Slow Speed zone on Pompano Canal / Cypress Creek and
the seasonally-differentiated zone on the ICW. This area was likely excluded from the existing zones to allow
higher speeds for water sports. The ICW area immediately to the east had moderate to high manatee density
and moderate FastCoin during both seasons.
Potential Rule Change (cold season): Include this area in the zone that covers the ICW immediately to the east.
The ICW is currently regulated at Slow Speed on weekends only during the cold season (25 MPH with a 50-
foot Slow Speed buffer during other times) but is identified in Areas C4 and C5 for a potential change.
D. Port Everglades
1. Comparison of manatee aerial survey data from 2004-09 vs. 1988-92 (Table 1; Figures 14-17)
a. The manatee density increased during the cold season between 1988-92 and 2004-09 but decreased during the
warm season. The manatee density during the cold season increased from 13.70 to 16.70 but decreased from
0.39 to 0.26 during the warm season. The relative proportion of manatees seen in this zone during the cold
season was substantially lower in 2004-09 (29%, down from 79%) even though the manatee density was
higher. This appears to be largely a result of increased use of the inland power plant area during the cold
season. The relative proportion of manatees seen in this zone during the warm season was also lower in 2004-
09 (8%, down from 19%) but the change was far less than the cold season change.
b. The relative distribution of manatee sightings within this zone did not change noticeably between 1988-92 and
2004-09.
- 6 -
2. Summary of manatee mortality (Table 2; Figure 18)
a. 67 carcasses were recovered in this zone, with 40 of these attributed to boats (17 of which occurred since
2000). Twenty-eight (28) of the boat-related deaths were recorded during the cold season and 12 during the
warm season.
3. Summary of manatee-boat coincidence (Table 4; Figures 19-22)
a. Cold season: Coin for this zone was 6.20 and FastCoin was 2.11. The FastCoin value was close to 46% above
the mean FastCoin value for the whole county. The area adjacent to the power plant and the area west of
Burnham Point had some of the highest FastCoin values. Almost all of the higher FastCoin values occurred in
areas that are currently regulated at Idle Speed or Slow Speed for boating safety and/or manatee protection
purposes.
b. Warm season: Coin for this zone was 0.77 and FastCoin was 0.33. The FastCoin value was close to 18% above
the mean FastCoin value for the whole county.
4. Other information
a. Figure 23 shows the locations of seagrass in 2006-07.
b. Figure 24 shows the existing FWC manatee protection zones and boating safety zones.
5. Areas where a rule change may be warranted (Figure 25)
a. D1: Port Everglades Power Plant Discharge Canal. This area had high manatee density during both the cold
season and the warm season. Most of the canal is a year-round No Entry zone but the east-west portion of the
canal that connects to the ICW is regulated at Idle Speed during the cold season and at Slow Speed during the
warm season. FWC has received requests from law enforcement and others to expand the existing No Entry
zone to include the east-west portion of the canal.
Potential Rule Change (warm season): Expand the No Entry zone to include the east-west portion of the canal.
E. South County
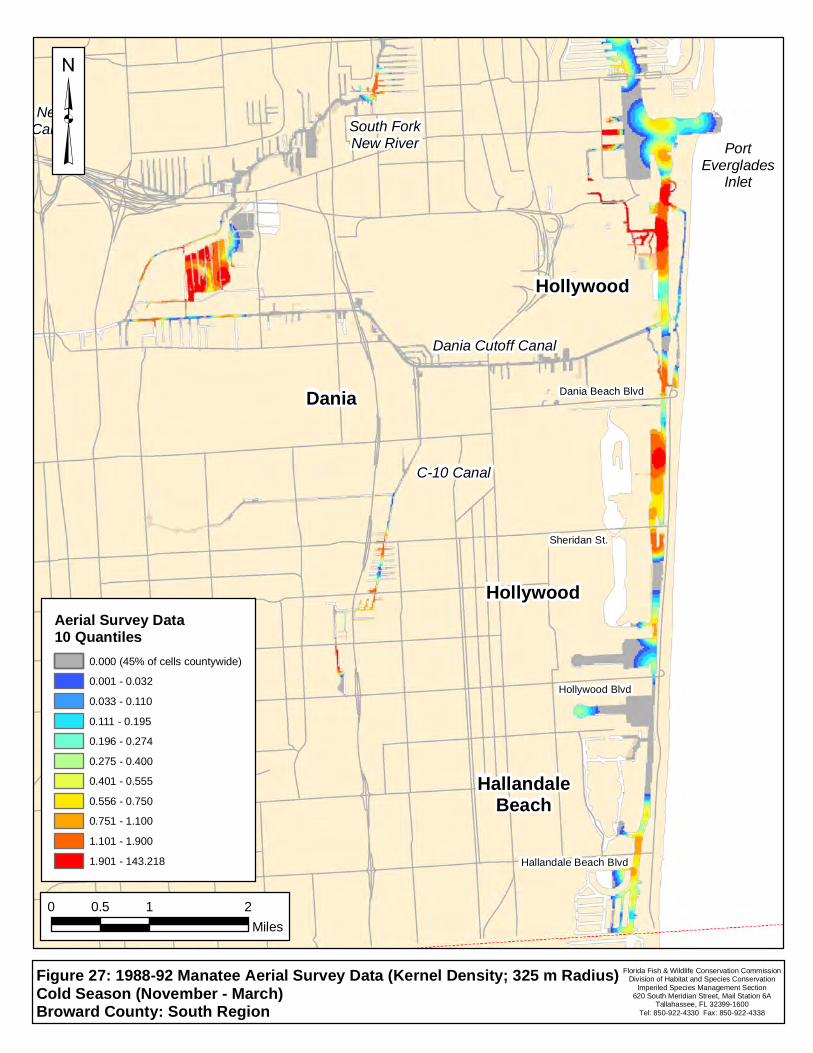
1. Comparison of manatee aerial survey data from 2004-09 vs. 1988-92 (Table 1; Figures 26-29)
a. The manatee density decreased during both the warm season and cold season between 1988-92 and 2004-09,
with both mean densities decreasing by close to 25%. The manatee density during the cold season decreased
from 0.84 to 0.60, while it decreased from 0.40 to 0.30 during the warm season. The relative proportion of
manatees seen in this zone also decreased noticeably during the both seasons (from 4% to 1% during the cold
season and from 16% to 8% during the warm season).
b. The relative distribution of manatee sightings within this zone did not change noticeably between 1988-92 and
2004-09.
2. Summary of manatee mortality (Table 2; Figure 30)
a. Five carcasses were recovered in this zone, with two of these attributed to boats (neither of which occurred
since 2000). Both of the boat-related deaths were recorded during the warm season.
3. Summary of manatee-boat coincidence (Table 4; Figures 31-34)
a. Cold season: Coin for this zone was 1.36 and FastCoin was 0.66. The FastCoin value was about 50% below
the mean FastCoin value for the whole county. The areas where FastCoin was the highest were immediately
south of the Dania Cutoff Canal and in the vicinity of Sheridan Street. Much of the higher FastCoin values
occurred in areas that are currently regulated at Idle Speed or Slow Speed for boating safety and/or manatee
protection purposes.
b. Warm season: Coin for this zone was 1.44 and FastCoin was 0.56. The FastCoin value was two times greater
than the mean FastCoin value for the whole county.
4. Other information
a. Figure 35 shows the locations of seagrass in 2006-07.
b. Figure 36 shows the existing FWC manatee protection zones and boating safety zones.

- 7 -
5. Areas where a rule change may be warranted (Figure 37)
a. E1: West of ICW, South of Dania Beach Blvd. This existing cold season Slow Speed zone had high manatee
density and FastCoin during the warm season. The area is 25 MPH with a 50-foot Slow Speed shoreline buffer
during the warm season. It is one of only a few locations that has substantial seagrass.
Potential Rule Change (warm season): Change the existing cold season Slow Speed zone to a year-round zone.
b. E2: ICW from just south of Dania Beach Blvd. to the Miami-Dade County line. This area had moderate to low
manatee density but moderate to high FastCoin during the warm season. As with Area C5, this area is
regulated at 25 MPH with a 50-foot Slow Speed buffer during the warm season. There are multiple boating
safety zones in this area as well as an underlying 30 MPH zone with a 15-inch wake limitation that was
established by a Special Act of the Florida Legislature. This latter zone is not currently posted because the
existing boating safety and manatee protection zones completely overlap it with more restrictive zones. The
city of Hollywood has requested the ICW between Hollywood Blvd and Hallandale Beach Blvd be regulated
at Idle Speed and the city of Hallandale Beach has requested that the ICW within its jurisdictions be changed
to a year-round Slow Speed zone.
Potential Rule Change (warm season or possibly year-round): Remove the entire warm season manatee
protection zone or possibly change it to a shore-to-shore 25 MPH zone (i.e., remove only the 50-foot Slow
Speed buffers). Removal of the zone completely would mean the areas outside of the other existing zones
would be governed by the Special Act zones. Removal of the shoreline buffer is not expected to have any
significant negative effects because boat lifts, docks, and other shore-based structures already limit high speed
boat operation in many parts of this area. Removal of the buffer would make zone marking much easier
because the regulatory markers would need to contain much less text.
F. Inland Areas
1. Comparison of manatee aerial survey data from 2004-09 vs. 1988-92 (Table 1; Figures 38-41)
a. The manatee density increased during both the cold season and warm season between 1988-92 and 2004-09.
The manatee density during the cold season increased from 1.70 to 28.65, while it increased from 0.94 to 1.32
during the warm season. The relative proportion of manatees seen in this zone during the cold season was
noticeably higher in 2004-09 (34%, up from 11%), while the proportions stayed about the same for the warm
season. The relative proportion of manatees seen in this zone during the cold season was substantially higher
in 2004-09 (62%, up from 11%). This appears to be largely a result of increased use of the inland power plant
area during the cold season. The relative proportion of manatees seen in this zone during the warm season
remained essentially unchanged.
b. Regarding the relative distribution of manatee sightings within this zone, areas that had high relative densities
in 1988-92 continued to have high relative densities in 2004-09; however, more of the area had high-end
densities in 2004-09, particularly during the cold season throughout the New River and new River Canal and
in parts of the Dania Cutoff Canal and C-10 Canal.
2. Summary of manatee mortality (Table 2; Figure 42)
a. 86 carcasses were recovered in this zone, with 17 of these attributed to boats (eight of which occurred since
2000). Ten of the boat-related deaths were recorded during the cold season and seven during the warm season.
3. Summary of manatee-boat coincidence (Table 4; Figures 43-46)
a. Cold season: Coin for this zone was 2.71 and FastCoin was 0.33. The low FastCoin value is not surprising
because almost all inland waters are currently regulated at Slow Speed for boating safety and/or manatee
protection purposes.
b. Warm season: Coin for this zone was 0.62 and FastCoin was 0.05.
4. Other information
a. No seagrass was identified in the inland areas so no figure is provided.
b. Figure 47 shows the existing FWC manatee protection zones and boating safety zones.

- 8 -
5. Areas where a rule change may be warranted (Figure 48)
a. F1: Ft. Lauderdale Inland Power Plant cooling ponds. Although the cooling ponds are used by manatees year-
round, the manatee density during the warm season is moderate to low (as compared to extremely high during
the cold season). The area’s importance to manatees is primarily as a warm water aggregation site but this is
not an issue during the warm season. The cooling ponds are not accessible to the general public and given the
low to moderate manatee use, retaining the No Entry zone during the warm season may not be necessary.
Potential Rule Change (warm season): Change the existing year-round No Entry zone in the discharge ponds
to be in effect only during the cold season.
G. Other Rule Issues
1. Preamble language in § (1) of the rule
Since the rule was adopted in 1993, there have been numerous amendments to the Florida Manatee Sanctuary
Act [§ 379.2431(2), FS] and to Rule 68C-22.001, FAC. The Act provides the authority for the FWC to
establish manatee protection rules and Rule 68C-22.001 provides additional guidelines and requirements
related to the rule making process. Because of these changes, the existing Broward County rule does not track
the language currently contained in the Act or Rule 68C-22.001.
Potential Rule Change (G1): Amend the rule to make the language consistent with the current Act and rule
language. The revised language would closely mirror the language used in the Sarasota County rule (68C-
22.026), which was amended in June 2010 for the same reasons.
2. Add holidays to the zones that are only in effect on weekends
The existing weekend-only zones do not include holidays. In other rules that differentiate between weekends
and holidays, including boating safety zones in Broward County, holidays are included in the weekend zones.
The reason for this is boating traffic on holidays is typically the similar to or greater than weekend traffic.
Potential Rule Change (G2): Revise the weekend-only zones to include holidays
3. Clean-up and confirmation of zone descriptions
All zone descriptions need to be reviewed to confirm or update the latitude and longitude coordinates and to
otherwise check for accuracy (e.g., confirm or update references to channel markers, etc.). Descriptions should
be reviewed to see if they can be written more clearly and succinctly – to make them more understandable to
the public. References to plat books and/or Township and Range coordinates should be removed unless
absolutely necessary because these are arcane to most people; references to landmarks and/or specific latitude
and longitude coordinates would be much better. Also, because a person’s ability to accurately locate a
specific coordinate requires the person to know what reference datum was used, it may be worthwhile for § (1)
of the rule to state what datum was used (e.g., UTM, NAD27).
Potential Rule Change (G3): Amend the rule to clean-up zone descriptions where needed.

Table 1: Broward County Manatee Aerial Survey Data: Comparison between 2004-09 and 1988-92
Aerial Survey Season:
Aerial Survey Period:
Location [1]
Density
[2]
Percent
Total
[3]
Percent
Surveys
[4]
Density
[2]
Percent
Total
[3]
Percent
Surveys
[4]
Density
[2]
Percent
Total
[3]
Percent
Surveys
[4]
Density
[2]
Percent
Total
[3]
Percent
Surveys
[4]
North County 0.47 34% 71% 0.15 11% 24% 1.90 8% 88% 0.71 6% 61%
North County to Hillsboro Inlet [a] 0.82 16% 43% 0.19 5% 17% 3.96 4% 80% 1.25 4% 48%
NE 14th to East Las Olas 0.38 12% 32% 0.13 6% 10% 1.75 3% 71% 0.43 2% 42%
Pompano Canal / Cypress Creek [b] 0.00 0% 0% -- -- -- 0.00 0% 0% -- -- --
Middle River [c] 0.47 7% 33% -- -- -- 0.66 1% 43% -- -- --
Port Everglades 0.26 8% 32% 0.39 19% 55% 16.70 29% 85% 13.70 79% 81%
East Las Olas to Port 0.09 2% 18% 0.18 7% 14% 0.37 0% 25% 0.63 3% 32%
Power Plant / John Lloyd SP 0.79 6% 18% 1.01 12% 52% 66.88 29% 82% 53.84 76% 81%
South County 0.30 8% 25% 0.40 16% 34% 0.60 1% 55% 0.84 4% 58%
Dania to South County 0.30 8% 25% 0.40 16% 34% 0.60 1% 55% 0.84 4% 58%
Inland Areas 1.32 50% 82% 0.94 54% 50% 28.65 62% 100% 1.70 11% 80%
New River 1.84 25% 64% 1.64 36% 50% 7.93 6% 92% 1.15 3% 60%
Inland Power Plant / New River Canal 1.18 17% 50% 0.48 9% 50% 65.84 53% 94% 2.38 5% 60%
Dania Cutoff Canal 0.37 2% 14% 0.00 0% 0% 3.37 1% 54% 0.52 1% 20%
C-10 Canal 1.57 6% 30% 1.52 9% 50% 6.60 1% 50% 3.64 2% 40%
Broward County 0.60 100% 89% 0.45 100% 76% 10.48 100% 100% 3.90 100% 94%
[1] The areas surveyed during the different periods were not identical
[2] Density: Mean number of manatees seen per survey per sq. km
[3] Percent Total: Proportion of the mean number of manatees seen per survey countywide that were seen in each area
[4] Percent Surveys: Percentage of all surveys during which at least one manatee was seen in the area
[a] Most of Hillsboro Canal not surveyed in 1988-92
[b] Pompano Canal / Cypress Creek area not surveyed in 1988-92 or 2004-07. Surveyed five times after Nov 2007
[c] Middle River not surveyed in 1988-92. South Fork of the Middle River not covered during many of the surveys because of limited ability to see
manatees due to overhanging vegetation, etc.
April - October November - March
2004-09 1988-92 2004-09 1988-92

Table 2: Broward County Manatee Mortality by Zone and Season (through December 2009)
Seasonal Period:
Location Total 1 2 3 4 5 6 7-9 Total 1 2 3 4 5 6 7-9 Total 1 2 3 4 5 6 7-9
North County 12 2 1 1 3 1 0 4 26 6 0 1 4 4 3 8 38 8 1 2 7 5 3 12
North County to Hillsboro Inlet 3 1 0 0 0 0 0 2 7 3 0 0 1 2 1 0 10 4 0 0 1 2 1 2
NE 14th to East Las Olas 1 0 0 0 1 0 0 0 6 2 0 0 0 1 2 1 7 2 0 0 1 1 2 1
Pompano Canal / Cypress Creek 5 1 0 0 2 1 0 1 10 1 0 1 2 1 0 5 15 2 0 1 4 2 0 6
Middle River 3 0 1 1 0 0 0 1 3 0 0 0 1 0 0 2 6 0 1 1 1 0 0 3
Port Everglades 16 12 0 1 1 0 0 2 51 28 0 2 4 2 6 9 67 40 0 3 5 2 6 11
East Las Olas to Port 7 5 0 0 1 0 0 1 11 7 0 0 0 0 3 1 18 12 0 0 1 0 3 2
Power Plant / John Lloyd SP 9 7 0 1 0 0 0 1 40 21 0 2 4 2 3 8 49 28 0 3 4 2 3 9
South County 2 2 0 0 0 0 0 0 3 0 0 0 1 0 0 2 5 2 0 0 1 0 0 2
Dania to South County 2 2 0 0 0 0 0 0 3 0 0 0 1 0 0 2 5 2 0 0 1 0 0 2
Inland Areas 37 7 4 3 14 0 0 9 49 10 2 1 11 5 1 19 86 17 6 4 25 5 1 28
New River 11 2 2 0 4 0 0 3 10 5 0 1 1 1 0 2 21 7 2 1 5 1 0 5
Inland Power Plant / New River Canal 15 4 1 3 3 0 0 4 28 4 2 0 8 3 0 11 43 8 3 3 11 3 0 15
Dania Cutoff Canal 10 1 1 0 6 0 0 2 8 1 0 0 1 1 1 4 18 2 1 0 7 1 1 6
C-10 Canal 1 0 0 0 1 0 0 0 3 0 0 0 1 0 0 2 4 0 0 0 2 0 0 2
Broward County [a] 68 23 5 5 18 1 0 16 135 47 2 4 21 11 10 40 203 70 7 9 39 12 10 56
[a] Includes 7 carcasses recovered in the Atlantic Ocean
Mortality Breakdown by Month and Death Code
Death Code [*]
1
2
3
4
5
6
7-9
All Codes 1610 11 13 937 47 22 14
0
0
4
0
0
3
3 8 13
3
3
1
1
4
0
0
2
2
1
6
0
1
2
3
1
1
3
0
0
1
0
0
0
1
3
7
0
1
2
0
0
2
5
2
1
2
0
3
0
0
6
0
0
4
1
0
3
1
1
0
0
2
2
0
2
4
2
3
0
7
3
2
8
18
0
1
3
3
4
18
17
0
7
3
1
1
5
Recoveries by Death Code [*]
Jan Feb Mar Apr
All MonthsNovember - MarchApril - October
[*] Death Codes: 1 = Watercraft; 2 = Flood Gate / Lock; 3 = Other Human; 4 = Perinatal; 5 = Cold Stress; 6 = Other Natural; 7-9; Undetermined or Verified/Not Recovered
Recoveries by Death Code [*]Recoveries by Death Code [*]
Sep Oct Nov DecMay Jun Jul Aug

Table 3: Broward County Manatee Mortality by Year and Category (through December 2009)
REPYEAR D_Code1 D_Code2 D_Code3 D_Code4 D_Code5 D_Code6 D_Code7-9 D-Code2-9 All Causes
1974 0 0 0 0 0 0 1 1 1
1975 1 0 0 0 0 0 0 0 1
1976 1 0 0 0 0 0 0 0 1
1977 0 0 1 1 0 0 2 4 4
1978 0 0 0 1 0 0 1 2 2
1979 0 0 0 0 0 0 2 2 2
1980 2 1 0 2 0 0 2 5 7
1981 1 0 0 0 0 0 1 1 2
1982 2 1 0 0 0 0 1 2 4
1983 1 0 0 0 0 1 0 1 2
1984 2 0 0 0 0 0 3 3 5
1985 0 1 2 0 0 0 1 4 4
1986 2 0 0 2 1 0 1 4 6
1987 5 0 0 0 0 0 1 1 6
1988 2 0 1 0 1 1 0 3 5
1989 3 0 0 1 0 0 0 1 4
1990 1 0 0 0 0 0 0 0 1
1991 2 1 0 0 0 0 0 1 3
1992 2 0 0 5 0 0 2 7 9
1993 2 0 0 1 0 0 1 2 4
1994 3 0 0 1 0 0 0 1 4
1995 0 1 0 4 0 0 0 5 5
1996 1 0 0 2 0 1 2 5 6
1997 0 0 0 1 0 0 2 3 3
1998 2 1 0 2 0 0 2 5 7
1999 5 0 0 4 0 1 5 10 15
2000 2 0 0 1 0 0 1 2 4
2001 4 0 0 3 1 0 1 5 9
2002 3 0 1 1 1 0 4 7 10
2003 5 0 1 1 0 0 1 3 8
2004 1 1 0 1 1 0 2 5 6
2005 2 0 0 1 1 1 4 7 9
2006 6 0 1 1 1 2 4 9 15
2007 1 0 1 0 0 0 2 3 4
2008 3 0 0 3 1 0 3 7 10
2009 3 0 1 0 4 3 4 12 15
Total 70 7 9 39 12 10 56 133 203
D_Codes: 1 = Watercraft-related; 2 = Structure; 3 = Other Human; 4 = Perinatal; 5 = Cold Stress;
6 = Other Natural; 7-9 = Undetermined or Verified/Not Recovered

Table 4: Broward County Manatee Density, "Fast" Boat Density, and Manatee-Boat Coincidence by Area and Season
Seasonal Period: April - October November - March
Location
Manatee
Density
[1]
Fast Boat
Density
[2]
Coin
[3]
"Fast"
Coin
[4]
Coin
Ratio
[5]
Manatee
Density
[1]
Fast Boat
Density
[2]
Coin
[3]
"Fast"
Coin
[4]
Coin
Ratio
[5]
North County 0.13 1.20 1.26 0.29 0.23 0.61 1.38 5.23 1.95 0.37
North County to Hillsboro Inlet [a] 0.22 1.20 3.62 0.44 0.12 1.26 1.88 17.38 6.02 0.35
NE 14th to East Las Olas 0.13 1.83 0.94 0.39 0.42 0.60 1.79 3.05 1.42 0.47
Pompano Canal / Cypress Creek [b] 0.01 0.20 0.14 0.04 0.31 0.01 0.58 0.10 0.05 0.53
Middle River [c] 0.11 0.55 0.22 0.09 0.38 0.22 0.30 0.50 0.06 0.12
Port Everglades 0.10 3.09 0.77 0.33 0.42 3.96 3.09 6.20 2.11 0.34
East Las Olas to Port 0.05 2.86 0.95 0.42 0.44 0.23 3.14 3.30 1.32 0.40
Power Plant / John Lloyd SP 0.22 3.81 0.32 0.10 0.32 13.06 2.94 13.26 4.04 0.31
South County 0.14 1.22 1.44 0.56 0.39 0.26 1.03 1.36 0.66 0.48
Dania to South County [d] 0.14 1.22 1.44 0.56 0.39 0.26 1.03 1.36 0.66 0.48
Inland Areas 0.22 0.28 0.62 0.05 0.08 9.46 0.27 2.71 0.33 0.12
New River 0.27 0.47 0.92 0.09 0.10 1.57 0.49 4.25 0.68 0.16
Inland Power Plant / New River Canal 0.25 0.04 0.53 0.02 0.04 22.98 0.03 1.98 0.05 0.03
Dania Cutoff Canal 0.07 0.30 0.17 0.00 0.00 1.05 0.25 1.01 0.17 0.17
C-10 Canal [e] 0.17 -- -- -- -- 0.72 -- -- -- --
Broward County 0.15 1.39 1.04 0.28 0.27 3.38 1.43 4.34 1.45 0.33
[1] Manatee Density: Mean manatee density per survey for the 2004-09 period (ArcGIS kernel density using a 325 m search radius)
[3] Coin: Mean manatee-boat coincidence value (ArcGIS kernel density for manatees times the kernel density for boats)
[a] Hillsboro Canal west of US 1 not surveyed for boats so manatee-boat coincidence does not include this area
[b] Pompano Canal / Cypress Creek area only surveyed five times for manatees
[c] South Fork of the Middle River not covered during many of the manatee surveys
[d] Area south of Hallandale Beach Blvd not surveyed for boats so manatee-boat coincidence does not include this area
[e] C-10 Canal not surveyed for boats so manatee-boat coincidence cannot be calculated
[2] Fast Boat Density: Mean boat density per survey for the 2004-05 period for only boats with observed speeds of "planing," "cruising," or "plowing"
(ArcGIS kernel density using a 325 m search radius)
[4] "Fast" Coin: Mean manatee-boat coincidence value using only boats with observed speeds of "planing," "cruising," or "plowing" (ArcGIS kernel density
for manatees times the kernel density for "fast" boats)
[5] Coin Ratio: Ratio of Fast Coin to Coin (Column [4] value divided by Column [3] value). In some cases this ratio may appear incorrect based on the
Coin and Fast Coin values but this is due to the Coin and Fast Coin values only being shown to two decimal places.
Note on Manatee Density (Column [1]) : These values are the mean kernel density values calculated in ArcGIS and are not the same as the values shown
for the aerial survey summary tables. The kernel density calculation includes a distance decay function and the water grid was used as a mask (so means
are based on only values that occurred over water). The density values reported in the aerial survey comparison table were calculated by dividing the
number of manatees seen within each area by the amount of area surveyed. Except for the Pompano Canal Area, the mean kernel density values are
lower than the means reported in the aerial survey summary tables.

Middle River
New River
Inland Power Plant / New River Canal
C-10 Canal
Dania to South County
NE 14th to East Las Olas
North County to Hillsboro Inlet
Dania Cutoff Canal
East Las Olas to Port
Pompano Canal / Cypress Creek
Power Plant / John Lloyd
Florida Fish & Wildlife Conservation CommissionDivision of Habitat and Species Conservation
Imperiled Species Management Section620 South Meridian Street, Mail Station 6A
Tallahassee, FL 32399-1600Tel: 850-922-4330 Fax: 850-922-4338
0 3 61.5Miles
³
Figure 1: Data Summary Areas (Broward County)
Summary AreasNorth CountyPort EvergladesSouth CountyInland Areas

DeerfieldBeach
PompanoBeach
PompanoCanal
HillsboroInlet
CypressCreek
N.E. 14th Street
Atlantic Blvd
Florida Fish & Wildlife Conservation CommissionDivision of Habitat and Species Conservation
Imperiled Species Management Section620 South Meridian Street, Mail Station 6A
Tallahassee, FL 32399-1600Tel: 850-922-4330 Fax: 850-922-4338
0 1 20.5Miles
Figure 2: 2004-09 Manatee Aerial Survey Data (Kernel Density; 325 m Radius)Cold Season (November - March)Broward County: North Region
³
Aerial Survey Data10 Quantiles
0.000 (20% of cells countywide)0.001 - 0.0520.053 - 0.1400.141 - 0.2530.254 - 0.3880.389 - 0.5450.546 - 0.7600.761 - 1.1101.111 - 1.8201.821 - 3.7003.701 - 171.198
DeerfieldBeach
PompanoBeach
PompanoCanal
HillsboroInlet
CypressCreek
N.E. 14th Street
Atlantic Blvd
Florida Fish & Wildlife Conservation CommissionDivision of Habitat and Species Conservation
Imperiled Species Management Section620 South Meridian Street, Mail Station 6A
Tallahassee, FL 32399-1600Tel: 850-922-4330 Fax: 850-922-4338
0 1 20.5Miles
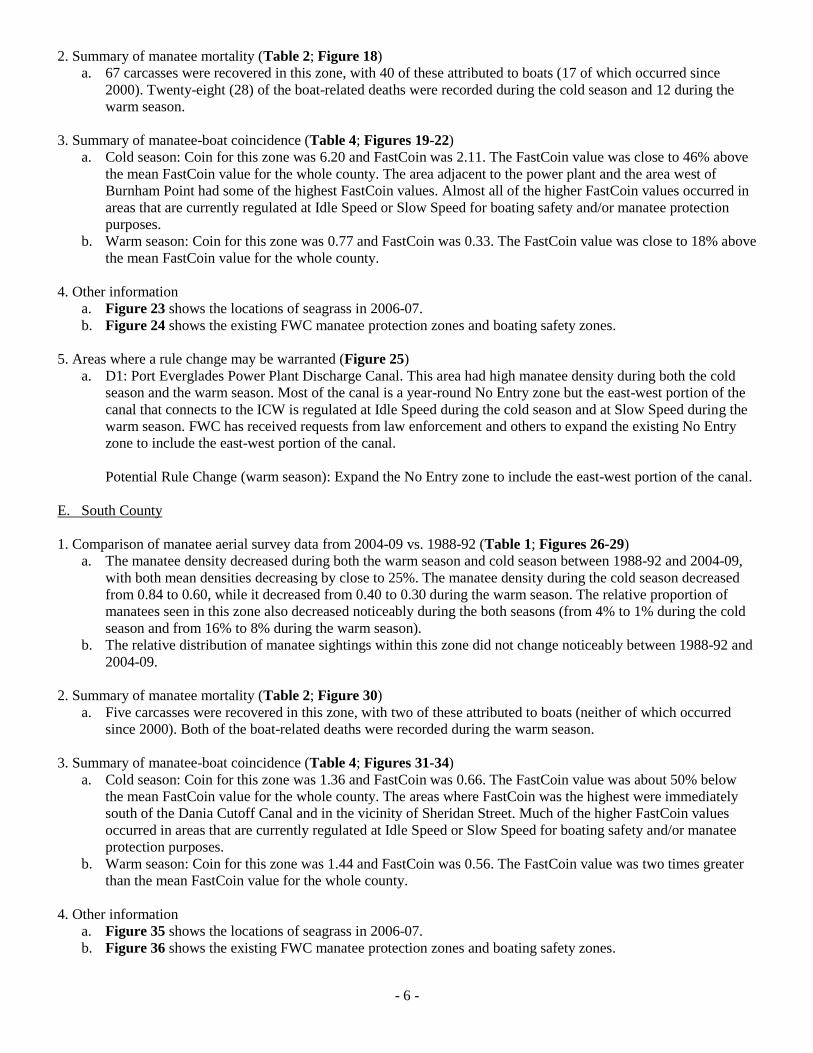
Figure 3: 1988-92 Manatee Aerial Survey Data (Kernel Density; 325 m Radius)Cold Season (November - March)Broward County: North Region
³
Aerial Survey Data10 Quantiles
0.000 (45% of cells countywide)0.001 - 0.0320.033 - 0.1100.111 - 0.1950.196 - 0.2740.275 - 0.4000.401 - 0.5550.556 - 0.7500.751 - 1.1001.101 - 1.9001.901 - 143.218

DeerfieldBeach
PompanoBeach
PompanoCanal
HillsboroInlet
CypressCreek
N.E. 14th Street
Atlantic Blvd
Florida Fish & Wildlife Conservation CommissionDivision of Habitat and Species Conservation
Imperiled Species Management Section620 South Meridian Street, Mail Station 6A
Tallahassee, FL 32399-1600Tel: 850-922-4330 Fax: 850-922-4338
0 1 20.5Miles
Figure 4: 2004-09 Manatee Aerial Survey Data (Kernel Density; 325 m Radius)Warm Season (April - October)Broward County: North Region
³
Aerial Survey Data10 Quantiles
0.000 (66% of cells countywide)0.001 - 0.0140.015 - 0.0540.055 - 0.1110.112 - 0.1750.176 - 0.2450.246 - 0.3050.306 - 0.4200.421 - 0.6300.631 - 1.1501.151 - 3.731

DeerfieldBeach
PompanoBeach
PompanoCanal
HillsboroInlet
CypressCreek
N.E. 14th Street
Atlantic Blvd
Florida Fish & Wildlife Conservation CommissionDivision of Habitat and Species Conservation
Imperiled Species Management Section620 South Meridian Street, Mail Station 6A
Tallahassee, FL 32399-1600Tel: 850-922-4330 Fax: 850-922-4338
0 1 20.5Miles
Figure 5: 1988-92 Manatee Aerial Survey Data (Kernel Density; 325 m Radius)Warm Season (April - October)Broward County: North Region
³
Aerial Survey Data10 Quantiles
0.000 (77% of cells countywide)0.001 - 0.0220.023 - 0.0750.076 - 0.1520.153 - 0.2500.251 - 0.3400.341 - 0.4750.476 - 0.6200.621 - 0.8500.851 - 1.4501.451 - 13.533

!(
k
k
!(
k
!(
!(
k
!(
!(k
k
k
k
k
k
kk
k
k
k
k
k
GFGF
GF
GF
GF
GF
GF
GF GF
DeerfieldBeach
PompanoBeach
PompanoCanal
HillsboroInlet
CypressCreek
N.E. 14th Street
Atlantic Blvd
Commercial Blvd
20052004
2003
20022000
1998
1991
19881988
Florida Fish & Wildlife Conservation CommissionDivision of Habitat and Species Conservation
Imperiled Species Management Section620 South Meridian Street, Mail Station 6A
Tallahassee, FL 32399-1600Tel: 850-922-4330 Fax: 850-922-4338
0 1 20.5Miles
³
Figure 6: Manatee Mortality (1974 - December 2009)Broward County: North Region(Year of occurrence noted for boat-related deaths)
Death Category by SeasonGF Boat-related (Nov - Mar)GF Boat-related (Apr - Oct)!( Perinatal (Nov - Mar)!( Perinatal (Apr - Oct)k Other Causes (Nov - Mar)k Other Causes (Apr - Oct)

DeerfieldBeach
PompanoBeach
PompanoCanal
HillsboroInlet
CypressCreek
N.E. 14th Street
Atlantic Blvd
Florida Fish & Wildlife Conservation CommissionDivision of Habitat and Species Conservation
Imperiled Species Management Section620 South Meridian Street, Mail Station 6A
Tallahassee, FL 32399-1600Tel: 850-922-4330 Fax: 850-922-4338
0 1 20.5Miles
Figure 7: "All Boats" Manatee-Boat Coincidence (2004-09 Manatees; 2004-05 Boats)Cold Season (November - March)Broward County: North Region
³
Manatee-BoatCoincidence10 Quantiles
0.000 (37% of cells countywide)0.001 - 0.0600.061 - 0.3400.341 - 0.8250.826 - 1.5501.551 - 2.4502.451 - 3.6003.601 - 5.3005.301 - 7.9007.901 - 14.60014.601 - 202.466

DeerfieldBeach
PompanoBeach
PompanoCanal
HillsboroInlet
CypressCreek
N.E. 14th Street
Atlantic Blvd
Florida Fish & Wildlife Conservation CommissionDivision of Habitat and Species Conservation
Imperiled Species Management Section620 South Meridian Street, Mail Station 6A
Tallahassee, FL 32399-1600Tel: 850-922-4330 Fax: 850-922-4338
0 1 20.5Miles
Figure 8: "Fast Boats" Manatee-Boat Coincidence (2004-09 Manatees; 2004-05 Boats)Cold Season (November - March)Broward County: North Region
³
Manatee-BoatCoincidence10 Quantiles
0.000 (49% of cells countywide)0.001 - 0.060 (7.0%)0.061 - 0.340 (8.7%)0.341 - 0.825 (7.9%)0.826 - 1.550 (6.1%)1.551 - 2.450 (5.8%)2.451 - 3.600 (4.7%)3.601 - 5.300 (4.4%)5.301 - 7.900 (2.8%)7.901 - 14.600 (2.0%)14.601 - 69.790 (1.9%)
This legend uses the quantiles from the Cold Season"All Boats" Coincidence map. Percentages for eachcategory for this cover are noted
DeerfieldBeach
PompanoBeach
PompanoCanal
HillsboroInlet
CypressCreek
N.E. 14th Street
Atlantic Blvd
Florida Fish & Wildlife Conservation CommissionDivision of Habitat and Species Conservation
Imperiled Species Management Section620 South Meridian Street, Mail Station 6A
Tallahassee, FL 32399-1600Tel: 850-922-4330 Fax: 850-922-4338
0 1 20.5Miles
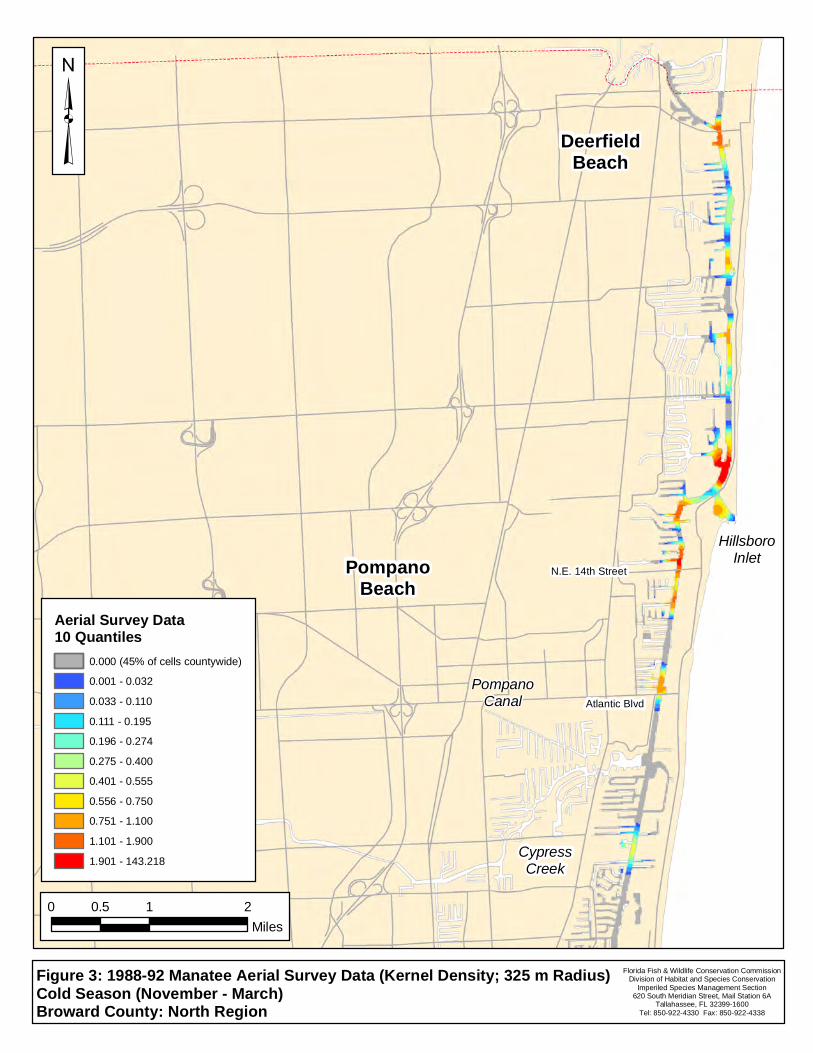
Figure 9: "All Boats" Manatee-Boat Coincidence (2004-09 Manatees; 2004-05 Boats)Warm Season (April - October)Broward County: North Region
³
Manatee-BoatCoincidence10 Quantiles
0.000 (72% of cells countywide)0.001 - 0.060 (3.9%)0.061 - 0.340 (4.3%)0.341 - 0.825 (3.8%)0.826 - 1.550 (3.7%)1.551 - 2.450 (3.1%)2.451 - 3.600 (1.9%)3.601 - 5.300 (1.7%)5.301 - 7.900 (2.0%)7.901 - 14.600 (2.1%)14.601 - 42.483 (1.6%)
This legend uses the quantiles from the Cold Season"All Boats" Coincidence map. Percentages for eachcategory for this cover are noted

DeerfieldBeach
PompanoBeach
PompanoCanal
HillsboroInlet
CypressCreek
N.E. 14th Street
Atlantic Blvd
Florida Fish & Wildlife Conservation CommissionDivision of Habitat and Species Conservation
Imperiled Species Management Section620 South Meridian Street, Mail Station 6A
Tallahassee, FL 32399-1600Tel: 850-922-4330 Fax: 850-922-4338
0 1 20.5Miles
Figure 10: "Fast Boats" Manatee-Boat Coincidence (2004-09 Manatees; 2004-05 Boats)Warm Season (April - October)Broward County: North Region
³
Manatee-BoatCoincidence10 Quantiles
0.000 (80% of cells countywide)0.001 - 0.050 (3.9%)0.051 - 0.300 (4.7%)0.301 - 0.750 (4.8%)0.751 - 1.450 (2.1%)1.451 - 2.350 (1.3%)2.351 - 3.450 (1.0%)3.451 - 5.200 (0.74%)5.201 - 7.800 (0.65%)7.801 - 14.500 (0.47%)14.501 - 16.516 (0.06%)
This legend uses the quantiles from the Cold Season"All Boats" Coincidence map. Percentages for eachcategory for this cover are noted

DeerfieldBeach
PompanoBeach
PompanoCanal
HillsboroInlet
CypressCreek
N.E. 14th Street
Atlantic Blvd
Florida Fish & Wildlife Conservation CommissionDivision of Habitat and Species Conservation
Imperiled Species Management Section620 South Meridian Street, Mail Station 6A
Tallahassee, FL 32399-1600Tel: 850-922-4330 Fax: 850-922-4338
0 1 20.5Miles
³
Figure 11: Seagrass (2006-07)Broward County: North Region(Source: Broward County)
Seagrass present
These data represent where seagrass was presentbased on field measurements. Positions areapproximate. Additional areas of seagrass arebelieved to exist but have not yet been verified.

DeerfieldBeach
PompanoBeach
PompanoCanal
HillsboroInlet
CypressCreek
N.E. 14th Street
Atlantic Blvd
Florida Fish & Wildlife Conservation CommissionDivision of Habitat and Species Conservation
Imperiled Species Management Section620 South Meridian Street, Mail Station 6A
Tallahassee, FL 32399-1600Tel: 850-922-4330 Fax: 850-922-4338
0 1 20.5Miles
³
Figure 12: Existing FWC Manatee Protection and Boating Safety ZonesBroward County: North Region
FWC Manatee Zones (Current)No EntryIdle SpeedIdle Speed (cold) / Slow Speed (warm)Slow SpeedSlow Speed (50-foot buffer)Slow Speed (cold) **Slow Speed on Weekends (cold) **25 MPH (50-ft Slow Speed buffer)
FWC Boating Safety Zones (Current)Idle SpeedSlow SpeedSlow Speed (Weekends/Holidays)
** During all other times zone is 25 MPH with a50-foot Slow Speed shoreline bufferNot shown: 30 MPH / 15 inch wake in all watersof the ICW and New River Canal except whereother zones apply (boating safety)

DeerfieldBeach
PompanoBeach
PompanoCanal
HillsboroInlet
CypressCreek
N.E. 14th Street
Atlantic Blvd
C1
C2
C4, C5
C3, C5
C6
Florida Fish & Wildlife Conservation CommissionDivision of Habitat and Species Conservation
Imperiled Species Management Section620 South Meridian Street, Mail Station 6A
Tallahassee, FL 32399-1600Tel: 850-922-4330 Fax: 850-922-4338
0 1 20.5Miles
³
Figure 13: Areas Identified as Potentially Warranting a Rule Change Broward County: North Region
Areas of Potential Change
FWC Manatee Zones (Current)No EntryIdle SpeedIdle Speed (cold) / Slow Speed (warm)Slow SpeedSlow Speed (50-foot buffer)Slow Speed (cold) **Slow Speed on Weekends (cold) **25 MPH (50-ft Slow Speed buffer)
** During all other times zone is 25 MPH with a 50-foot Slow Speed shoreline buffer

Ft. Lauderdale
MiddleRiver
Hollywood
NewRiver
North ForkNew River
South ForkNew River Port
EvergladesInlet
Commercial Blvd
Sunrise Blvd
East LasOlas Blvd
Florida Fish & Wildlife Conservation CommissionDivision of Habitat and Species Conservation
Imperiled Species Management Section620 South Meridian Street, Mail Station 6A
Tallahassee, FL 32399-1600Tel: 850-922-4330 Fax: 850-922-4338
0 1 20.5Miles
Figure 14: 2004-09 Manatee Aerial Survey Data (Kernel Density; 325 m Radius)Cold Season (November - March)Broward County: North-Central Region
³
Aerial Survey Data10 Quantiles
0.000 (20% of cells countywide)0.001 - 0.0520.053 - 0.1400.141 - 0.2530.254 - 0.3880.389 - 0.5450.546 - 0.7600.761 - 1.1101.111 - 1.8201.821 - 3.7003.701 - 171.198

Ft. Lauderdale
MiddleRiver
Hollywood
NewRiver
North ForkNew River
South ForkNew River Port
EvergladesInlet
Commercial Blvd
Sunrise Blvd
East LasOlas Blvd
Florida Fish & Wildlife Conservation CommissionDivision of Habitat and Species Conservation
Imperiled Species Management Section620 South Meridian Street, Mail Station 6A
Tallahassee, FL 32399-1600Tel: 850-922-4330 Fax: 850-922-4338
0 1 20.5Miles
Figure 15: 1988-92 Manatee Aerial Survey Data (Kernel Density; 325 m Radius)Cold Season (November - March)Broward County: North-Central Region
³
Aerial Survey Data10 Quantiles
0.000 (45% of cells countywide)0.001 - 0.0320.033 - 0.1100.111 - 0.1950.196 - 0.2740.275 - 0.4000.401 - 0.5550.556 - 0.7500.751 - 1.1001.101 - 1.9001.901 - 143.218

Ft. Lauderdale
MiddleRiver
Hollywood
NewRiver
North ForkNew River
South ForkNew River Port
EvergladesInlet
Commercial Blvd
Sunrise Blvd
East LasOlas Blvd
Florida Fish & Wildlife Conservation CommissionDivision of Habitat and Species Conservation
Imperiled Species Management Section620 South Meridian Street, Mail Station 6A
Tallahassee, FL 32399-1600Tel: 850-922-4330 Fax: 850-922-4338
0 1 20.5Miles
Figure 16: 2004-09 Manatee Aerial Survey Data (Kernel Density; 325 m Radius)Warm Season (April - October)Broward County: North-Central Region
³
Aerial Survey Data10 Quantiles
0.000 (66% of cells countywide)0.001 - 0.0140.015 - 0.0540.055 - 0.1110.112 - 0.1750.176 - 0.2450.246 - 0.3050.306 - 0.4200.421 - 0.6300.631 - 1.1501.151 - 3.731
Ft. Lauderdale
MiddleRiver
Hollywood
NewRiver
North ForkNew River
South ForkNew River Port
EvergladesInlet
Commercial Blvd
Sunrise Blvd
East LasOlas Blvd
Florida Fish & Wildlife Conservation CommissionDivision of Habitat and Species Conservation
Imperiled Species Management Section620 South Meridian Street, Mail Station 6A
Tallahassee, FL 32399-1600Tel: 850-922-4330 Fax: 850-922-4338
0 1 20.5Miles
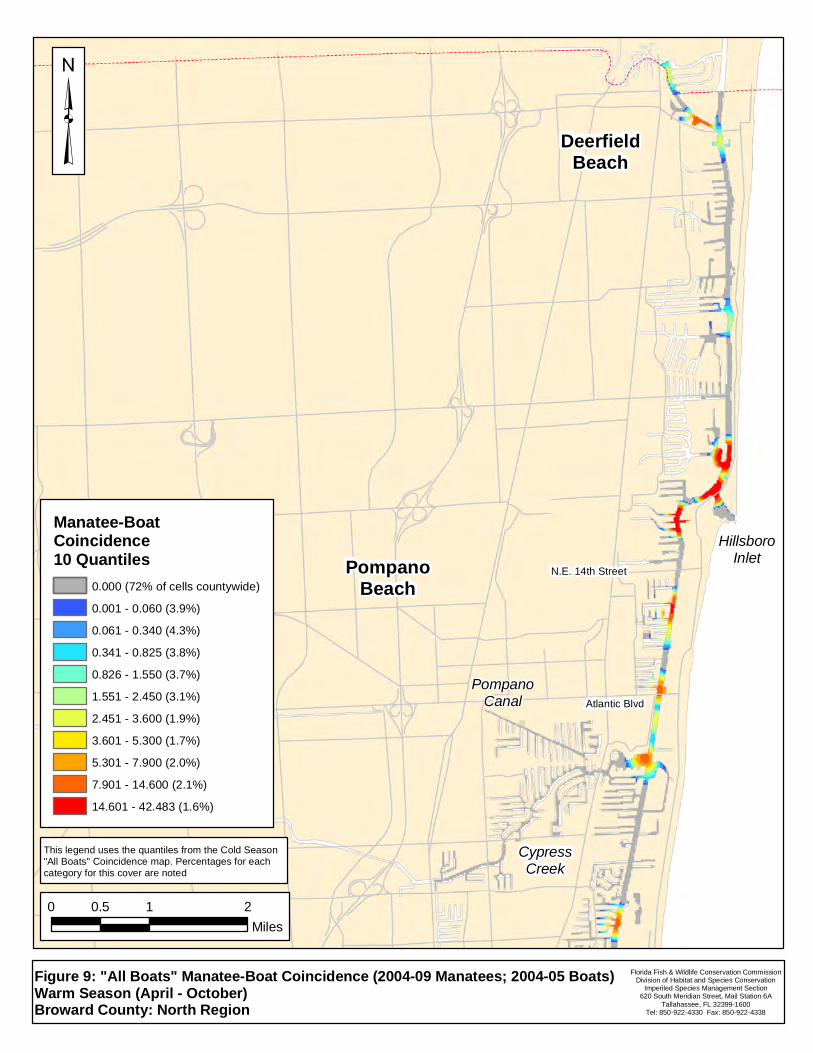
Figure 17: 1988-92 Manatee Aerial Survey Data (Kernel Density; 325 m Radius)Warm Season (April - October)Broward County: North-Central Region
³
Aerial Survey Data10 Quantiles
0.000 (77% of cells countywide)0.001 - 0.0220.023 - 0.0750.076 - 0.1520.153 - 0.2500.251 - 0.3400.341 - 0.4750.476 - 0.6200.621 - 0.8500.851 - 1.4501.451 - 13.533

k
kk!(k k
k
k
!(
k
k
k
k
k
k
k
k
k
!(
k
k
k
k
k
!(
!(!(
!(!(
!(
!(
k
k
!(
k
k
k
k
k
!(!(
k
k
kk
!(
k
!(
k
!(
k
!(
!(
!(
k
k
k
k
!(k
k
k
k
k
k!(
k
k
!(
k
k
k
k
k
k
kkk
!(
!(
k
k
k
k
k
k
k
GFGF
GF
GF
GF
GF
GF
GF
GF
GF
GFGF
GF
GF
GF
GF
GF
GFGFGF GF
GF
GF
GF
GFGF
GF
GF
GF
GFGF
GF
GF
GFGFGFGF
GF
GF
GF
GF
GF
GF
GF
GFGF
GF
GF
GF
GFGF
GF
GF
GF
GF
GF
GFGF
CypressCreek
Ft. Lauderdale
MiddleRiver
Hollywood
NewRiver
North ForkNew River
South ForkNew River
North NewRiver Canal
Dania Cutoff Canal
PortEverglades
Inlet
Commercial Blvd
Sunrise Blvd
East LasOlas Blvd
20092009
2009
2008
20082008
20072006
2006
2006
2006
2006
20062003
20032003
2003
2002
2002
20012001
2001
1999
1999
19991999
1998
1996
1992
1992199019871984
1984
1982
1982
1980
1980
1976
2005
200120001999
19941994
1994
1993
198919891989
1987
1987
1987198719861983
1981
1975
Florida Fish & Wildlife Conservation CommissionDivision of Habitat and Species Conservation
Imperiled Species Management Section620 South Meridian Street, Mail Station 6A
Tallahassee, FL 32399-1600Tel: 850-922-4330 Fax: 850-922-4338
0 1 20.5Miles
³
Figure 18: Manatee Mortality (1974 - December 2009)Broward County: North-Central Region(Year of occurrence noted for boat-related deaths)
Death Category by SeasonGF Boat-related (Nov - Mar)GF Boat-related (Apr - Oct)!( Perinatal (Nov - Mar)!( Perinatal (Apr - Oct)k Other Causes (Nov - Mar)k Other Causes (Apr - Oct)
Ft. Lauderdale
MiddleRiver
Hollywood
NewRiver
North ForkNew River
South ForkNew River Port
EvergladesInlet
Commercial Blvd
Sunrise Blvd
East LasOlas Blvd
Florida Fish & Wildlife Conservation CommissionDivision of Habitat and Species Conservation
Imperiled Species Management Section620 South Meridian Street, Mail Station 6A
Tallahassee, FL 32399-1600Tel: 850-922-4330 Fax: 850-922-4338
0 1 20.5Miles
Figure 19: "All Boats" Manatee-Boat Coincidence (2004-09 Manatees; 2004-05 Boats)Cold Season (November - March)Broward County: North-Central Region
³
Manatee-BoatCoincidence10 Quantiles
0.000 (37% of cells countywide)0.001 - 0.0600.061 - 0.3400.341 - 0.8250.826 - 1.5501.551 - 2.4502.451 - 3.6003.601 - 5.3005.301 - 7.9007.901 - 14.60014.601 - 202.466

Ft. Lauderdale
MiddleRiver
Hollywood
NewRiver
North ForkNew River
South ForkNew River Port
EvergladesInlet
Commercial Blvd
Sunrise Blvd
East LasOlas Blvd
Florida Fish & Wildlife Conservation CommissionDivision of Habitat and Species Conservation
Imperiled Species Management Section620 South Meridian Street, Mail Station 6A
Tallahassee, FL 32399-1600Tel: 850-922-4330 Fax: 850-922-4338
0 1 20.5Miles
Figure 20: "Fast Boats" Manatee-Boat Coincidence (2004-09 Manatees; 2004-05 Boats)Cold Season (November - March)Broward County: North-Central Region
³
Manatee-BoatCoincidence10 Quantiles
0.000 (49% of cells countywide)0.001 - 0.060 (7.0%)0.061 - 0.340 (8.7%)0.341 - 0.825 (7.9%)0.826 - 1.550 (6.1%)1.551 - 2.450 (5.8%)2.451 - 3.600 (4.7%)3.601 - 5.300 (4.4%)5.301 - 7.900 (2.8%)7.901 - 14.600 (2.0%)14.601 - 69.790 (1.9%)
This legend uses the quantiles from the Cold Season"All Boats" Coincidence map. Percentages for eachcategory for this cover are noted

Ft. Lauderdale
MiddleRiver
Hollywood
NewRiver
North ForkNew River
South ForkNew River Port
EvergladesInlet
Commercial Blvd
Sunrise Blvd
East LasOlas Blvd
Florida Fish & Wildlife Conservation CommissionDivision of Habitat and Species Conservation
Imperiled Species Management Section620 South Meridian Street, Mail Station 6A
Tallahassee, FL 32399-1600Tel: 850-922-4330 Fax: 850-922-4338
0 1 20.5Miles
Figure 21: "All Boats" Manatee-Boat Coincidence (2004-09 Manatees; 2004-05 Boats)Warm Season (April - October)Broward County: North-Central Region
³
Manatee-BoatCoincidence10 Quantiles
0.000 (72% of cells countywide)0.001 - 0.060 (3.9%)0.061 - 0.340 (4.3%)0.341 - 0.825 (3.8%)0.826 - 1.550 (3.7%)1.551 - 2.450 (3.1%)2.451 - 3.600 (1.9%)3.601 - 5.300 (1.7%)5.301 - 7.900 (2.0%)7.901 - 14.600 (2.1%)14.601 - 42.483 (1.6%)
This legend uses the quantiles from the Cold Season"All Boats" Coincidence map. Percentages for eachcategory for this cover are noted

Ft. Lauderdale
MiddleRiver
Hollywood
NewRiver
North ForkNew River
South ForkNew River Port
EvergladesInlet
Commercial Blvd
Sunrise Blvd
East LasOlas Blvd
Florida Fish & Wildlife Conservation CommissionDivision of Habitat and Species Conservation
Imperiled Species Management Section620 South Meridian Street, Mail Station 6A
Tallahassee, FL 32399-1600Tel: 850-922-4330 Fax: 850-922-4338
0 1 20.5Miles
Figure 22: "Fast Boats" Manatee-Boat Coincidence (2004-09 Manatees; 2004-05 Boats)Warm Season (April - October)Broward County: North-Central Region
³
Manatee-BoatCoincidence10 Quantiles
0.000 (80% of cells countywide)0.001 - 0.050 (3.9%)0.051 - 0.300 (4.7%)0.301 - 0.750 (4.8%)0.751 - 1.450 (2.1%)1.451 - 2.350 (1.3%)2.351 - 3.450 (1.0%)3.451 - 5.200 (0.74%)5.201 - 7.800 (0.65%)7.801 - 14.500 (0.47%)14.501 - 16.516 (0.06%)
This legend uses the quantiles from the Cold Season"All Boats" Coincidence map. Percentages for eachcategory for this cover are noted

Ft. Lauderdale
MiddleRiver
Hollywood
NewRiver
North ForkNew River
South ForkNew River
North NewRiver Canal
PortEverglades
Inlet
Commercial Blvd
Sunrise Blvd
East LasOlas Blvd
Florida Fish & Wildlife Conservation CommissionDivision of Habitat and Species Conservation
Imperiled Species Management Section620 South Meridian Street, Mail Station 6A
Tallahassee, FL 32399-1600Tel: 850-922-4330 Fax: 850-922-4338
0 1 20.5Miles
³
Figure 23: Seagrass (2006-07)Broward County: North-Central Region(Source: Broward County)
Seagrass present
These data represent where seagrass was presentbased on field measurements. Positions areapproximate. Additional areas of seagrass arebelieved to exist but have not yet been verified.

Ft. Lauderdale
MiddleRiver
Hollywood
NewRiver
North ForkNew River
South ForkNew River
North NewRiver Canal
PortEverglades
Inlet
Commercial Blvd
Sunrise Blvd
East LasOlas Blvd
Florida Fish & Wildlife Conservation CommissionDivision of Habitat and Species Conservation
Imperiled Species Management Section620 South Meridian Street, Mail Station 6A
Tallahassee, FL 32399-1600Tel: 850-922-4330 Fax: 850-922-4338
0 1 20.5Miles
³
Figure 24: Existing FWC Manatee Protection and Boating Safety ZonesBroward County: North-Central Region
FWC Manatee Zones (Current)No EntryIdle SpeedIdle Speed (cold) / Slow Speed (warm)Slow SpeedSlow Speed (50-foot buffer)Slow Speed (cold) **Slow Speed on Weekends (cold) **25 MPH (50-ft Slow Speed buffer)
FWC Boating Safety Zones (Current)Idle SpeedSlow SpeedSlow Speed (Weekends/Holidays)
** During all other times zone is 25 MPH with a50-foot Slow Speed shoreline bufferNot shown: 30 MPH / 15 inch wake in all watersof the ICW and New River Canal except whereother zones apply (boating safety)

Ft. Lauderdale
MiddleRiver
Hollywood
NewRiver
North ForkNew River
South ForkNew River
North NewRiver Canal
PortEverglades
Inlet
Commercial Blvd
Sunrise Blvd
East LasOlas Blvd
C5
F1
C4, C5
D1
Florida Fish & Wildlife Conservation CommissionDivision of Habitat and Species Conservation
Imperiled Species Management Section620 South Meridian Street, Mail Station 6A
Tallahassee, FL 32399-1600Tel: 850-922-4330 Fax: 850-922-4338
0 1 20.5Miles
³
Figure 25: Areas Identified as Potentially Warranting a Rule Change Broward County: North-Central Region
Areas of Potential Change
FWC Manatee Zones (Current)No EntryIdle SpeedIdle Speed (cold) / Slow Speed (warm)Slow SpeedSlow Speed (50-foot buffer)Slow Speed (cold) **Slow Speed on Weekends (cold) **25 MPH (50-ft Slow Speed buffer)
** During all other times zone is 25 MPH with a 50-foot Slow Speed shoreline buffer

Hollywood
South ForkNew River
HallandaleBeach
Hollywood
Dania
North NewRiver Canal
Dania Cutoff Canal
C-10 Canal
PortEverglades
Inlet
Dania Beach Blvd
Sheridan St.
Hollywood Blvd
Hallandale Beach Blvd
Florida Fish & Wildlife Conservation CommissionDivision of Habitat and Species Conservation
Imperiled Species Management Section620 South Meridian Street, Mail Station 6A
Tallahassee, FL 32399-1600Tel: 850-922-4330 Fax: 850-922-4338
0 1 20.5Miles
Figure 26: 2004-09 Manatee Aerial Survey Data (Kernel Density; 325 m Radius)Cold Season (November - March)Broward County: South Region
³
Aerial Survey Data10 Quantiles
0.000 (20% of cells countywide)0.001 - 0.0520.053 - 0.1400.141 - 0.2530.254 - 0.3880.389 - 0.5450.546 - 0.7600.761 - 1.1101.111 - 1.8201.821 - 3.7003.701 - 171.198
Hollywood
South ForkNew River
HallandaleBeach
Hollywood
Dania
North NewRiver Canal
Dania Cutoff Canal
C-10 Canal
PortEverglades
Inlet
Dania Beach Blvd
Sheridan St.
Hollywood Blvd
Hallandale Beach Blvd
Florida Fish & Wildlife Conservation CommissionDivision of Habitat and Species Conservation
Imperiled Species Management Section620 South Meridian Street, Mail Station 6A
Tallahassee, FL 32399-1600Tel: 850-922-4330 Fax: 850-922-4338
0 1 20.5Miles
Figure 27: 1988-92 Manatee Aerial Survey Data (Kernel Density; 325 m Radius)Cold Season (November - March)Broward County: South Region
³
Aerial Survey Data10 Quantiles
0.000 (45% of cells countywide)0.001 - 0.0320.033 - 0.1100.111 - 0.1950.196 - 0.2740.275 - 0.4000.401 - 0.5550.556 - 0.7500.751 - 1.1001.101 - 1.9001.901 - 143.218

Hollywood
South ForkNew River
HallandaleBeach
Hollywood
Dania
North NewRiver Canal
Dania Cutoff Canal
C-10 Canal
PortEverglades
Inlet
Dania Beach Blvd
Sheridan St.
Hollywood Blvd
Hallandale Beach Blvd
Florida Fish & Wildlife Conservation CommissionDivision of Habitat and Species Conservation
Imperiled Species Management Section620 South Meridian Street, Mail Station 6A
Tallahassee, FL 32399-1600Tel: 850-922-4330 Fax: 850-922-4338
0 1 20.5Miles
Figure 28: 2004-09 Manatee Aerial Survey Data (Kernel Density; 325 m Radius)Warm Season (April - October)Broward County: South Region
³
Aerial Survey Data10 Quantiles
0.000 (66% of cells countywide)0.001 - 0.0140.015 - 0.0540.055 - 0.1110.112 - 0.1750.176 - 0.2450.246 - 0.3050.306 - 0.4200.421 - 0.6300.631 - 1.1501.151 - 3.731

Hollywood
South ForkNew River
HallandaleBeach
Hollywood
Dania
North NewRiver Canal
Dania Cutoff Canal
C-10 Canal
PortEverglades
Inlet
Dania Beach Blvd
Sheridan St.
Hollywood Blvd
Hallandale Beach Blvd
Florida Fish & Wildlife Conservation CommissionDivision of Habitat and Species Conservation
Imperiled Species Management Section620 South Meridian Street, Mail Station 6A
Tallahassee, FL 32399-1600Tel: 850-922-4330 Fax: 850-922-4338
0 1 20.5Miles
Figure 29: 1988-92 Manatee Aerial Survey Data (Kernel Density; 325 m Radius)Warm Season (April - October)Broward County: South Region
³
Aerial Survey Data10 Quantiles
0.000 (77% of cells countywide)0.001 - 0.0220.023 - 0.0750.076 - 0.1520.153 - 0.2500.251 - 0.3400.341 - 0.4750.476 - 0.6200.621 - 0.8500.851 - 1.4501.451 - 13.533

k
kk!(k k
k
!(
k
!(
k
k
kk
k
k
k
k
!(
!(
k
k
k
k
k
!(
k
!(
!(
!(
k
k
k
k
k
!(!(
k
k
kk
!(
k
k
!(
!(
!(
k
!(
!(k
k
k
k
k
!(k
k
k
k
k!(
k
k
k
k
k
k
kkk
!(
!(
!(
k
k
k
k k GFGF
GF
GF
GF
GF
GF
GF
GF
GFGF
GF
GF
GF
GF
GF
GFGFGF
GF
GF
GF
GF
GF
GF
GFGF
GF
GF
GF
GFGF
GF
GFGFGFGF
GF
GF
GF
GF
GF
GF
GF
GFGF
GF
GF
GF
GFGF
GF
GF
GF
GF
GF
GFGF
Hollywood
South ForkNew River
HallandaleBeach
Hollywood
Dania
North NewRiver Canal
South NewRiver Canal
Dania Cutoff Canal
C-10 Canal
PortEverglades
Inlet
Dania Beach Blvd
Sheridan St.
Hollywood Blvd
Hallandale Beach Blvd
20092009
2009
2008
20082008
20072006
2006
2006
2006
2006
20062003
20032003
2003
2002
2002
20012001
2001
1999
19991999
1998
1993
1992
1992
1991
199019871984
1984
1982
1980
1980
19761975
2005
200120001999
19941994
1994
1993
198919891989
1987
1987
1987198719861983
1981
Florida Fish & Wildlife Conservation CommissionDivision of Habitat and Species Conservation
Imperiled Species Management Section620 South Meridian Street, Mail Station 6A
Tallahassee, FL 32399-1600Tel: 850-922-4330 Fax: 850-922-4338
0 1 20.5Miles
³
Figure 30: Manatee Mortality (1974 - December 2009)Broward County: South Region(Year of occurrence noted for boat-related deaths)
Death Category by SeasonGF Boat-related (Nov - Mar)GF Boat-related (Apr - Oct)!( Perinatal (Nov - Mar)!( Perinatal (Apr - Oct)k Other Causes (Nov - Mar)k Other Causes (Apr - Oct)

Hollywood
South ForkNew River
HallandaleBeach
Hollywood
Dania
North NewRiver Canal
Dania Cutoff Canal
C-10 Canal
PortEverglades
Inlet
Dania Beach Blvd
Sheridan St.
Hollywood Blvd
Hallandale Beach Blvd
Florida Fish & Wildlife Conservation CommissionDivision of Habitat and Species Conservation
Imperiled Species Management Section620 South Meridian Street, Mail Station 6A
Tallahassee, FL 32399-1600Tel: 850-922-4330 Fax: 850-922-4338
0 1 20.5Miles
Figure 31: "All Boats" Manatee-Boat Coincidence (2004-09 Manatees; 2004-05 Boats)Cold Season (November - March)Broward County: South Region
³
Manatee-BoatCoincidence10 Quantiles
0.000 (37% of cells countywide)0.001 - 0.0600.061 - 0.3400.341 - 0.8250.826 - 1.5501.551 - 2.4502.451 - 3.6003.601 - 5.3005.301 - 7.9007.901 - 14.60014.601 - 202.466

Hollywood
South ForkNew River
HallandaleBeach
Hollywood
Dania
North NewRiver Canal
Dania Cutoff Canal
C-10 Canal
PortEverglades
Inlet
Dania Beach Blvd
Sheridan St.
Hollywood Blvd
Hallandale Beach Blvd
Florida Fish & Wildlife Conservation CommissionDivision of Habitat and Species Conservation
Imperiled Species Management Section620 South Meridian Street, Mail Station 6A
Tallahassee, FL 32399-1600Tel: 850-922-4330 Fax: 850-922-4338
0 1 20.5Miles
Figure 32: "Fast Boats" Manatee-Boat Coincidence (2004-09 Manatees; 2004-05 Boats)Cold Season (November - March)Broward County: South Region
³
Manatee-BoatCoincidence10 Quantiles
0.000 (49% of cells countywide)0.001 - 0.060 (7.0%)0.061 - 0.340 (8.7%)0.341 - 0.825 (7.9%)0.826 - 1.550 (6.1%)1.551 - 2.450 (5.8%)2.451 - 3.600 (4.7%)3.601 - 5.300 (4.4%)5.301 - 7.900 (2.8%)7.901 - 14.600 (2.0%)14.601 - 69.790 (1.9%)
This legend uses the quantiles from the Cold Season"All Boats" Coincidence map. Percentages for eachcategory for this cover are noted

Hollywood
South ForkNew River
HallandaleBeach
Hollywood
Dania
North NewRiver Canal
Dania Cutoff Canal
C-10 Canal
PortEverglades
Inlet
Dania Beach Blvd
Sheridan St.
Hollywood Blvd
Hallandale Beach Blvd
Florida Fish & Wildlife Conservation CommissionDivision of Habitat and Species Conservation
Imperiled Species Management Section620 South Meridian Street, Mail Station 6A
Tallahassee, FL 32399-1600Tel: 850-922-4330 Fax: 850-922-4338
0 1 20.5Miles
Figure 33: "All Boats" Manatee-Boat Coincidence (2004-09 Manatees; 2004-05 Boats)Warm Season (April - October)Broward County: South Region
³
Manatee-BoatCoincidence10 Quantiles
0.000 (72% of cells countywide)0.001 - 0.060 (3.9%)0.061 - 0.340 (4.3%)0.341 - 0.825 (3.8%)0.826 - 1.550 (3.7%)1.551 - 2.450 (3.1%)2.451 - 3.600 (1.9%)3.601 - 5.300 (1.7%)5.301 - 7.900 (2.0%)7.901 - 14.600 (2.1%)14.601 - 42.483 (1.6%)
This legend uses the quantiles from the Cold Season"All Boats" Coincidence map. Percentages for eachcategory for this cover are noted

Hollywood
South ForkNew River
HallandaleBeach
Hollywood
Dania
North NewRiver Canal
Dania Cutoff Canal
C-10 Canal
PortEverglades
Inlet
Dania Beach Blvd
Sheridan St.
Hollywood Blvd
Hallandale Beach Blvd
Florida Fish & Wildlife Conservation CommissionDivision of Habitat and Species Conservation
Imperiled Species Management Section620 South Meridian Street, Mail Station 6A
Tallahassee, FL 32399-1600Tel: 850-922-4330 Fax: 850-922-4338
0 1 20.5Miles
Figure 34: "Fast Boats" Manatee-Boat Coincidence (2004-09 Manatees; 2004-05 Boats)Warm Season (April - October)Broward County: South Region
³
Manatee-BoatCoincidence10 Quantiles
0.000 (80% of cells countywide)0.001 - 0.050 (3.9%)0.051 - 0.300 (4.7%)0.301 - 0.750 (4.8%)0.751 - 1.450 (2.1%)1.451 - 2.350 (1.3%)2.351 - 3.450 (1.0%)3.451 - 5.200 (0.74%)5.201 - 7.800 (0.65%)7.801 - 14.500 (0.47%)14.501 - 16.516 (0.06%)
This legend uses the quantiles from the Cold Season"All Boats" Coincidence map. Percentages for eachcategory for this cover are noted

Hollywood
South ForkNew River
HallandaleBeach
Hollywood
Dania
North NewRiver Canal
Dania Cutoff Canal
C-10 Canal
PortEverglades
Inlet
Dania Beach Blvd
Sheridan St.
Hollywood Blvd
Hallandale Beach Blvd
Florida Fish & Wildlife Conservation CommissionDivision of Habitat and Species Conservation
Imperiled Species Management Section620 South Meridian Street, Mail Station 6A
Tallahassee, FL 32399-1600Tel: 850-922-4330 Fax: 850-922-4338
0 1 20.5Miles
³
Figure 35: Seagrass (2006-07)Broward County: South Region(Source: Broward County)
Seagrass present
These data represent where seagrass was presentbased on field measurements. Positions areapproximate. Additional areas of seagrass arebelieved to exist but have not yet been verified.

Hollywood
South ForkNew River
HallandaleBeach
Hollywood
Dania
North NewRiver Canal
Dania Cutoff Canal
C-10 Canal
PortEverglades
Inlet
Dania Beach Blvd
Sheridan St.
Hollywood Blvd
Hallandale Beach Blvd
Florida Fish & Wildlife Conservation CommissionDivision of Habitat and Species Conservation
Imperiled Species Management Section620 South Meridian Street, Mail Station 6A
Tallahassee, FL 32399-1600Tel: 850-922-4330 Fax: 850-922-4338
0 1 20.5Miles
³
Figure 36: Existing FWC Manatee Protection and Boating Safety ZonesBroward County: South Region
FWC Manatee Zones (Current)No EntryIdle SpeedIdle Speed (cold) / Slow Speed (warm)Slow SpeedSlow Speed (50-foot buffer)Slow Speed (cold) **Slow Speed on Weekends (cold) **25 MPH (50-ft Slow Speed buffer)
FWC Boating Safety Zones (Current)Idle SpeedSlow SpeedSlow Speed (Weekends/Holidays)
** During all other times zone is 25 MPH with a50-foot Slow Speed shoreline bufferNot shown: 30 MPH / 15 inch wake in all watersof the ICW and New River Canal except whereother zones apply (boating safety)
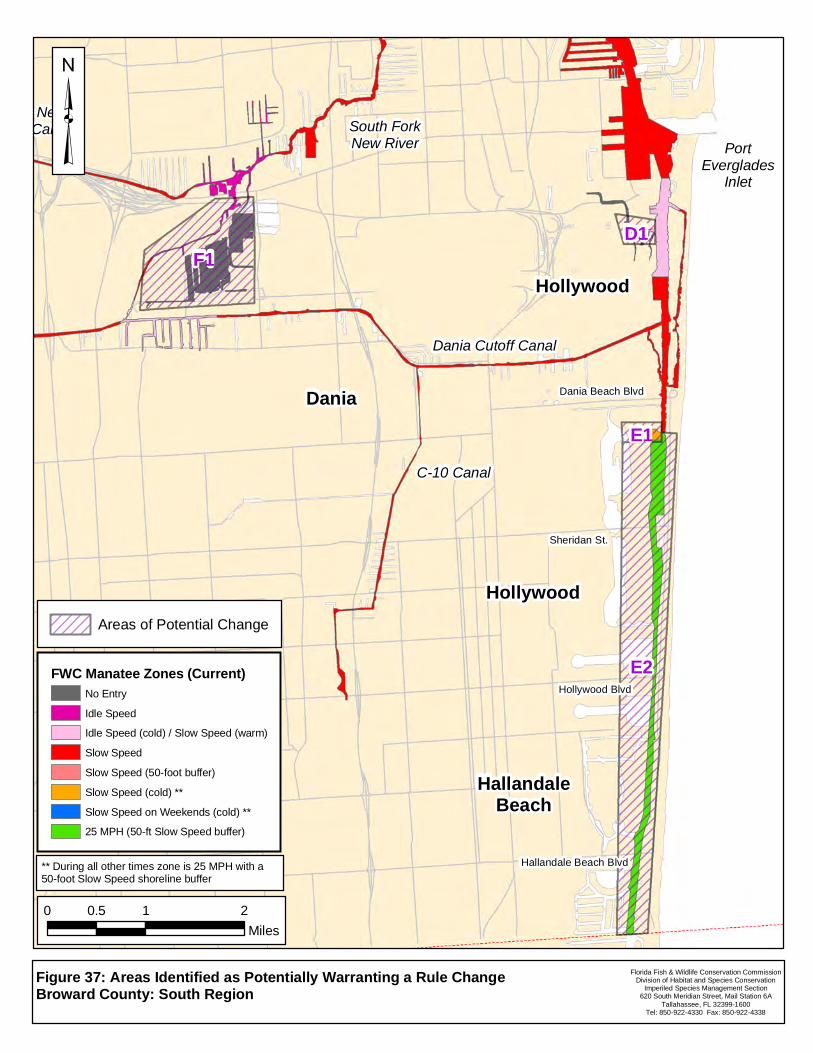
Hollywood
South ForkNew River
HallandaleBeach
Hollywood
Dania
North NewRiver Canal
Dania Cutoff Canal
C-10 Canal
PortEverglades
Inlet
Dania Beach Blvd
Sheridan St.
Hollywood Blvd
Hallandale Beach Blvd
E2
F1D1
E1
Florida Fish & Wildlife Conservation CommissionDivision of Habitat and Species Conservation
Imperiled Species Management Section620 South Meridian Street, Mail Station 6A
Tallahassee, FL 32399-1600Tel: 850-922-4330 Fax: 850-922-4338
0 1 20.5Miles
³
Figure 37: Areas Identified as Potentially Warranting a Rule Change Broward County: South Region
Areas of Potential Change
FWC Manatee Zones (Current)No EntryIdle SpeedIdle Speed (cold) / Slow Speed (warm)Slow SpeedSlow Speed (50-foot buffer)Slow Speed (cold) **Slow Speed on Weekends (cold) **25 MPH (50-ft Slow Speed buffer)
** During all other times zone is 25 MPH with a 50-foot Slow Speed shoreline buffer

Ft. Lauderdale
Hollywood
NewRiver
North ForkNew River
South ForkNew River
Hollywood
Dania
North NewRiver Canal
South NewRiver Canal
Dania Cutoff Canal
C-10 Canal
Sunrise Blvd
Dania Beach Blvd
Sheridan St.
Hollywood Blvd
Florida Fish & Wildlife Conservation CommissionDivision of Habitat and Species Conservation
Imperiled Species Management Section620 South Meridian Street, Mail Station 6A
Tallahassee, FL 32399-1600Tel: 850-922-4330 Fax: 850-922-4338
0 1 20.5Miles
Figure 38: 2004-09 Manatee Aerial Survey Data (Kernel Density; 325 m Radius)Cold Season (November - March)Broward County: Inland Region
³
Aerial Survey Data10 Quantiles
0.000 (20% of cells countywide)0.001 - 0.0520.053 - 0.1400.141 - 0.2530.254 - 0.3880.389 - 0.5450.546 - 0.7600.761 - 1.1101.111 - 1.8201.821 - 3.7003.701 - 171.198
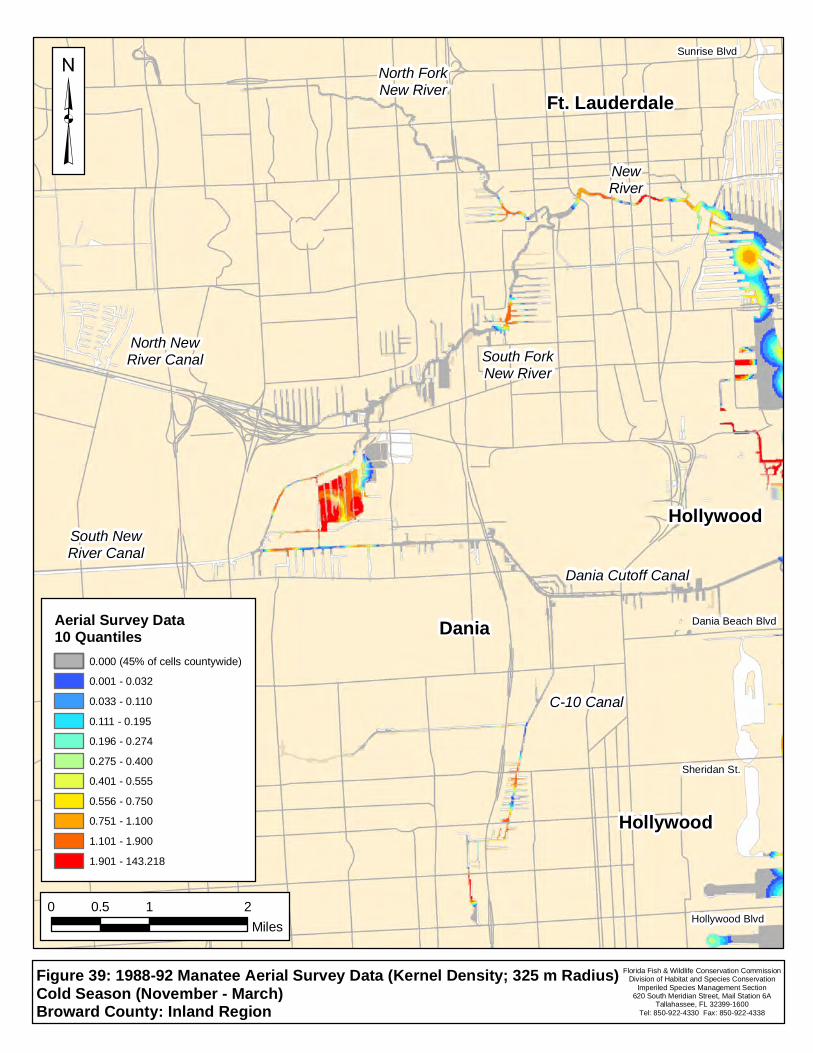
Ft. Lauderdale
Hollywood
NewRiver
North ForkNew River
South ForkNew River
Hollywood
Dania
North NewRiver Canal
South NewRiver Canal
Dania Cutoff Canal
C-10 Canal
Sunrise Blvd
Dania Beach Blvd
Sheridan St.
Hollywood Blvd
Florida Fish & Wildlife Conservation CommissionDivision of Habitat and Species Conservation
Imperiled Species Management Section620 South Meridian Street, Mail Station 6A
Tallahassee, FL 32399-1600Tel: 850-922-4330 Fax: 850-922-4338
0 1 20.5Miles
Figure 39: 1988-92 Manatee Aerial Survey Data (Kernel Density; 325 m Radius)Cold Season (November - March)Broward County: Inland Region
³
Aerial Survey Data10 Quantiles
0.000 (45% of cells countywide)0.001 - 0.0320.033 - 0.1100.111 - 0.1950.196 - 0.2740.275 - 0.4000.401 - 0.5550.556 - 0.7500.751 - 1.1001.101 - 1.9001.901 - 143.218

Ft. Lauderdale
Hollywood
NewRiver
North ForkNew River
South ForkNew River
Hollywood
Dania
North NewRiver Canal
South NewRiver Canal
Dania Cutoff Canal
C-10 Canal
Sunrise Blvd
Dania Beach Blvd
Sheridan St.
Hollywood Blvd
Florida Fish & Wildlife Conservation CommissionDivision of Habitat and Species Conservation
Imperiled Species Management Section620 South Meridian Street, Mail Station 6A
Tallahassee, FL 32399-1600Tel: 850-922-4330 Fax: 850-922-4338
0 1 20.5Miles
Figure 40: 2004-09 Manatee Aerial Survey Data (Kernel Density; 325 m Radius)Warm Season (April - October)Broward County: Inland Region
³
Aerial Survey Data10 Quantiles
0.000 (66% of cells countywide)0.001 - 0.0140.015 - 0.0540.055 - 0.1110.112 - 0.1750.176 - 0.2450.246 - 0.3050.306 - 0.4200.421 - 0.6300.631 - 1.1501.151 - 3.731

Ft. Lauderdale
Hollywood
NewRiver
North ForkNew River
South ForkNew River
Hollywood
Dania
North NewRiver Canal
South NewRiver Canal
Dania Cutoff Canal
C-10 Canal
Sunrise Blvd
Dania Beach Blvd
Sheridan St.
Hollywood Blvd
Florida Fish & Wildlife Conservation CommissionDivision of Habitat and Species Conservation
Imperiled Species Management Section620 South Meridian Street, Mail Station 6A
Tallahassee, FL 32399-1600Tel: 850-922-4330 Fax: 850-922-4338
0 1 20.5Miles
Figure 41: 1988-92 Manatee Aerial Survey Data (Kernel Density; 325 m Radius)Warm Season (April - October)Broward County: Inland Region
³
Aerial Survey Data10 Quantiles
0.000 (77% of cells countywide)0.001 - 0.0220.023 - 0.0750.076 - 0.1520.153 - 0.2500.251 - 0.3400.341 - 0.4750.476 - 0.6200.621 - 0.8500.851 - 1.4501.451 - 13.533

k
kk!(k k
k
k
k
!(
k
!(
k
k
kk
k
k
k
k
k
k
k
!(
k
k
k
k
!(
k
!(
!(!(
k
!(
!(
!(
!(
!(
!(
k
k
k
!(!(
k
k
k
!(
k
!(
k
k
!(
!(
!(
k
!(
!(k
k
k
k
k
!(
k
!(
k
k
k
k
!(
k
k
k
k
k
k
kkk
!(
!(
!(
k
k
k
k
k k GFGF
GF
GF
GF
GF
GF
GF
GF
GF
GFGF
GF
GF
GF
GF
GFGFGF GF
GF
GF
GF
GF
GFGF
GF
GF
GF
GFGF
GF
GF
GFGFGF
GF
GF
GF
GF
GF
GF
GFGF
GF
GF
GF
GFGF
GF
GF
GF
GF
GF
GFGF
Ft. Lauderdale
Hollywood
NewRiver
North ForkNew River
South ForkNew River
HallandaleBeach
Hollywood
Dania
North NewRiver Canal
South NewRiver Canal
Dania Cutoff Canal
C-10 Canal
PortEverglades
Inlet
Sunrise Blvd
Dania Beach Blvd
Sheridan St.
Hollywood Blvd
20092009
20092008
2007
2006
2006
200620062003
2002
2002
1999
1999
1996
1992
19901987
1986
19841982
1980
1980
19761975
19991999
1998
1989
198919871983
Florida Fish & Wildlife Conservation CommissionDivision of Habitat and Species Conservation
Imperiled Species Management Section620 South Meridian Street, Mail Station 6A
Tallahassee, FL 32399-1600Tel: 850-922-4330 Fax: 850-922-4338
0 1 20.5Miles
³
Figure 42: Manatee Mortality (1974 - December 2009)Broward County: Inland Region(Year of occurrence noted for boat-related deaths)
Death Category by SeasonGF Boat-related (Nov - Mar)GF Boat-related (Apr - Oct)!( Perinatal (Nov - Mar)!( Perinatal (Apr - Oct)k Other Causes (Nov - Mar)k Other Causes (Apr - Oct)

Ft. Lauderdale
Hollywood
NewRiver
North ForkNew River
South ForkNew River
Hollywood
Dania
North NewRiver Canal
South NewRiver Canal
Dania Cutoff Canal
C-10 Canal
Sunrise Blvd
Dania Beach Blvd
Sheridan St.
Hollywood Blvd
Florida Fish & Wildlife Conservation CommissionDivision of Habitat and Species Conservation
Imperiled Species Management Section620 South Meridian Street, Mail Station 6A
Tallahassee, FL 32399-1600Tel: 850-922-4330 Fax: 850-922-4338
0 1 20.5Miles
Figure 43: "All Boats" Manatee-Boat Coincidence (2004-09 Manatees; 2004-05 Boats)Cold Season (November - March)Broward County: Inland Region
³
Manatee-BoatCoincidence10 Quantiles
0.000 (37% of cells countywide)0.001 - 0.0600.061 - 0.3400.341 - 0.8250.826 - 1.5501.551 - 2.4502.451 - 3.6003.601 - 5.3005.301 - 7.9007.901 - 14.60014.601 - 202.466

Ft. Lauderdale
Hollywood
NewRiver
North ForkNew River
South ForkNew River
Hollywood
Dania
North NewRiver Canal
South NewRiver Canal
Dania Cutoff Canal
C-10 Canal
Sunrise Blvd
Dania Beach Blvd
Sheridan St.
Hollywood Blvd
Florida Fish & Wildlife Conservation CommissionDivision of Habitat and Species Conservation
Imperiled Species Management Section620 South Meridian Street, Mail Station 6A
Tallahassee, FL 32399-1600Tel: 850-922-4330 Fax: 850-922-4338
0 1 20.5Miles
Figure 44: "Fast Boats" Manatee-Boat Coincidence (2004-09 Manatees; 2004-05 Boats)Cold Season (November - March)Broward County: Inland Region
³
Manatee-BoatCoincidence10 Quantiles
0.000 (49% of cells countywide)0.001 - 0.060 (7.0%)0.061 - 0.340 (8.7%)0.341 - 0.825 (7.9%)0.826 - 1.550 (6.1%)1.551 - 2.450 (5.8%)2.451 - 3.600 (4.7%)3.601 - 5.300 (4.4%)5.301 - 7.900 (2.8%)7.901 - 14.600 (2.0%)14.601 - 69.790 (1.9%)
This legend uses the quantiles from the Cold Season"All Boats" Coincidence map. Percentages for eachcategory for this cover are noted

Ft. Lauderdale
Hollywood
NewRiver
North ForkNew River
South ForkNew River
Hollywood
Dania
North NewRiver Canal
South NewRiver Canal
Dania Cutoff Canal
C-10 Canal
Sunrise Blvd
Dania Beach Blvd
Sheridan St.
Hollywood Blvd
Florida Fish & Wildlife Conservation CommissionDivision of Habitat and Species Conservation
Imperiled Species Management Section620 South Meridian Street, Mail Station 6A
Tallahassee, FL 32399-1600Tel: 850-922-4330 Fax: 850-922-4338
0 1 20.5Miles
Figure 45: "All Boats" Manatee-Boat Coincidence (2004-09 Manatees; 2004-05 Boats)Warm Season (April - October)Broward County: Inland Region
³
Manatee-BoatCoincidence10 Quantiles
0.000 (72% of cells countywide)0.001 - 0.060 (3.9%)0.061 - 0.340 (4.3%)0.341 - 0.825 (3.8%)0.826 - 1.550 (3.7%)1.551 - 2.450 (3.1%)2.451 - 3.600 (1.9%)3.601 - 5.300 (1.7%)5.301 - 7.900 (2.0%)7.901 - 14.600 (2.1%)14.601 - 42.483 (1.6%)
This legend uses the quantiles from the Cold Season"All Boats" Coincidence map. Percentages for eachcategory for this cover are noted

Ft. Lauderdale
Hollywood
NewRiver
North ForkNew River
South ForkNew River
Hollywood
Dania
North NewRiver Canal
South NewRiver Canal
Dania Cutoff Canal
C-10 Canal
Sunrise Blvd
Dania Beach Blvd
Sheridan St.
Hollywood Blvd
Florida Fish & Wildlife Conservation CommissionDivision of Habitat and Species Conservation
Imperiled Species Management Section620 South Meridian Street, Mail Station 6A
Tallahassee, FL 32399-1600Tel: 850-922-4330 Fax: 850-922-4338
0 1 20.5Miles
³
Manatee-BoatCoincidence10 Quantiles
0.000 (80% of cells countywide)0.001 - 0.050 (3.9%)0.051 - 0.300 (4.7%)0.301 - 0.750 (4.8%)0.751 - 1.450 (2.1%)1.451 - 2.350 (1.3%)2.351 - 3.450 (1.0%)3.451 - 5.200 (0.74%)5.201 - 7.800 (0.65%)7.801 - 14.500 (0.47%)14.501 - 16.516 (0.06%)
This legend uses the quantiles from the Cold Season"All Boats" Coincidence map. Percentages for eachcategory for this cover are noted
Figure 46: "Fast Boats" Manatee-Boat Coincidence (2004-09 Manatees; 2004-05 Boats)Warm Season (April - October)Broward County: Inland Region

Ft. Lauderdale
Hollywood
NewRiver
North ForkNew River
South ForkNew River
Hollywood
Dania
North NewRiver Canal
South NewRiver Canal
Dania Cutoff Canal
C-10 Canal
Sunrise Blvd
Dania Beach Blvd
Sheridan St.
Hollywood Blvd
Florida Fish & Wildlife Conservation CommissionDivision of Habitat and Species Conservation
Imperiled Species Management Section620 South Meridian Street, Mail Station 6A
Tallahassee, FL 32399-1600Tel: 850-922-4330 Fax: 850-922-4338
0 1 20.5Miles
³
Figure 47: Existing FWC Manatee Protection and Boating Safety ZonesBroward County: Inland Region
FWC Manatee Zones (Current)No EntryIdle SpeedIdle Speed (cold) / Slow Speed (warm)Slow SpeedSlow Speed (50-foot buffer)Slow Speed (cold) **Slow Speed on Weekends (cold) **25 MPH (50-ft Slow Speed buffer)
FWC Boating Safety Zones (Current)Idle SpeedSlow SpeedSlow Speed (Weekends/Holidays)
** During all other times zone is 25 MPH with a50-foot Slow Speed shoreline bufferNot shown: 30 MPH / 15 inch wake in all watersof the ICW and New River Canal except whereother zones apply (boating safety)

Ft. Lauderdale
Hollywood
NewRiver
North ForkNew River
South ForkNew River
Hollywood
Dania
North NewRiver Canal
South NewRiver Canal
Dania Cutoff Canal
C-10 Canal
Sunrise Blvd
Dania Beach Blvd
Sheridan St.
Hollywood Blvd
F1
E2
D1
E1
Florida Fish & Wildlife Conservation CommissionDivision of Habitat and Species Conservation
Imperiled Species Management Section620 South Meridian Street, Mail Station 6A
Tallahassee, FL 32399-1600Tel: 850-922-4330 Fax: 850-922-4338
0 1 20.5Miles
³
Figure 48: Areas Identified as Potentially Warranting a Rule Change Broward County: Inland Region
Areas of Potential Change
FWC Manatee Zones (Current)No EntryIdle SpeedIdle Speed (cold) / Slow Speed (warm)Slow SpeedSlow Speed (50-foot buffer)Slow Speed (cold) **Slow Speed on Weekends (cold) **25 MPH (50-ft Slow Speed buffer)
** During all other times zone is 25 MPH with a 50-foot Slow Speed shoreline buffer

Appendix A
Supporting Information and Data: Review of Broward County Manatee Protection Rule Review (June 2010)
Documents:
379.2431 (2008): Manatee Sanctuary Act
68C-22.001-002: The “Scope and Purpose” and “Definitions” rules of Chapter 68C-22, FAC
68C-22.010 (text): Current FWC manatee protection rule for Broward County (68C-22.010, FAC)
68C-22.026 (portions): Sections of the FWC manatee protection rule for Sarasota County relating to preamble language
LRRC cover letter (Broward_100629): FWC cover letter to Broward LRRC (6/29/10)
LRRC notice to county (Broward_100315): FWC letter to Broward County (3/15/10)
LRRC Prelim Area Discussion (Brow10): Data Discussion and Preliminary Identification of Areas for LRRC Review, prepared by FWC
staff for use by the Broward County LRRC (June 2010).
Rulemaking Process (for Broward LRRC): Description of the FWC manatee protection rule development process, including the role of
the LRRC in the overall process
Other: Calleson, C.S. and R.K. Frohlich. 2007. Slower boat speeds reduce risks to manatees. Endangered Species Research, Vol. 3:
295-304. This published paper addresses the rationale for reducing boat speeds to protect manatees and includes a discussion on
manatee mortality and the physics of manatee-boat collisions.
Other: Deutsch, C.J. et al. 2003. Seasonal movements, migratory behavior, and site fidelity of West Indian manatees along the Atlantic
coast of the United States. Wildlife Monographs. The Wildlife Society. This published paper discusses manatee telemetry data and
what it shows about manatee use along the Atlantic coast of Florida.
GIS Data: [Coordinate system for all covers is: Albers, NAD 1983]
Aerial_Survey_1988-90: 1988-90 manatee aerial survey point data collected between January 1988 and March 1990
Aerial_Survey_1991-92: 1991-92 manatee aerial survey point data collected between November 1991 and September 1992
Aerial_Survey_2004-07: 2004-07 manatee aerial survey point data collected between January 2004 and April 2007
Aerial_Survey_2007-09: 2007-09 manatee aerial survey point data collected between November 2007 and December 2009
Aerial_Survey_Syn91-10: 1991-2010 synoptic aerial survey point data for Florida
Man0409_Cold: Raster cover derived from the November – March (“cold season”) 2004-09 aerial survey data using the kernel density
command in ArcGIS (Population field = Total; 325 meter search radius) and then dividing each cell value by the number of surveys
flown over the cell during the cold season
Man0409_Warm: Raster cover derived from the April – October (“warm season”) 2004-09 aerial survey data using the kernel density
command in ArcGIS (Population field = Total; 325 meter search radius) and then dividing each cell value by the number of surveys
flown over the cell during the warm season
Man8892_Cold: Raster cover derived from the November – March (“cold season”) 1988-92 aerial survey data using the kernel density
command in ArcGIS (Population field = Total; 325 meter search radius) and then dividing each cell value by the number of surveys
flown over the cell during the cold season
Man8892_Warm: Raster cover derived from the April – October (“warm season”) 1988-92 aerial survey data using the kernel density
command in ArcGIS (Population field = Total; 325 meter search radius) and then dividing each cell value by the number of surveys
flown over the cell during the warm season
ATONS_Broward_08: Locations of aids to navigation (i.e., channel markers) in or within close proximity to Broward County as of 2008
Boats_2004-05: 2004-05 boat aerial survey point data collected between May 2004 and January 2005. Definitions of fields are included
in the file Boats_2004-05_Data_Dictionary.
Boat_Cold: Raster cover derived from the November – March (“cold season”) 2004-05 aerial survey data using the kernel density
command in ArcGIS (325 meter search radius) and then dividing each cell value by the number of surveys flown over the cell during
the cold season
BoatFast_Cold: Raster cover derived from the November – March (“cold season”) 2004-05 aerial survey data using only boats with
speeds of Plowing, Cruising, or Planing. The kernel density command in ArcGIS was used (325 meter search radius) and each cell
value was divided by the number of surveys flown over the cell during the cold season.
Boat_Warm: Raster cover derived from the April – October (“warm season”) 2004-05 aerial survey data using the kernel density
command in ArcGIS (325 meter search radius) and then dividing each cell value by the number of surveys flown over the cell during
the warm season
BoatFast_Warm: Raster cover derived from the April – October (“warm season”) 2004-05 aerial survey data using only boats with
speeds of Plowing, Cruising, or Planing. The kernel density command in ArcGIS was used (325 meter search radius) and each cell
value was divided by the number of surveys flown over the cell during the warm season.
Broward_Rule_BS: Existing FWC boating safety zones in Broward County
Broward_Rule_Man: Polygon shapefile of the existing FWC manatee protection zones in Broward County. Data are preliminary but are
not known to contain any errors.
Broward_Rule_Prelim1006: Preliminary areas identified where a change to the Broward County rule may be warranted
Coin_Cold: Raster cover of November – March (“cold season”) manatee-boat spatial coincidence created by multiplying the 2004-09
cold season manatee raster by the 2004-05 cold season boat raster

CoinFast_Cold: Raster cover of November – March (“cold season”) manatee- “fast” boat spatial coincidence created by multiplying the
2004-09 cold season manatee raster by the 2004-05 cold season “fast” boat raster
Coin_Warm: Raster cover of April – October (“warm season”) manatee-boat spatial coincidence created by multiplying the 2004-09
warm season manatee raster by the 2004-05 warm season boat raster
CoinFast_Warm: Raster cover of April – October (“warm season”) manatee- “fast” boat spatial coincidence created by multiplying the
2004-09 warm season manatee raster by the 2004-05 warm season “fast” boat raster
County_Boundaries: County boundaries in line format
Deaths0912: Manatee mortality point data through December 2009
Roads_Major: Major roads in Broward County
Seagrass_Broward_2006-07: 2006-07 seagrass data collected by Broward County staff. The data represent where seagrass was present
based on field measurements.
Shoreline_2004: Shoreline data in line format
Summary_Areas_Broward2010: Zones used for analyzing and summarizing data within Broward County
Telemetry_Broward_87-98: Telemetry tracking data collected from manatees fitted with PTT tags (Location Class 2 or 3). Only
locations in or within close proximity to Broward County are included. Data are available for manatees that were tagged for varying
amounts of time between 1987 and 1998. Location Class 3 are the most accurate satellite locations. Additional information about the
telemetry data can be found in: Deutsch, C.J. et al. 2003. Seasonal movements, migratory behavior, and site fidelity of West Indian
manatees along the Atlantic coast of the United States. Wildlife Monographs. The Wildlife Society.
WaterMask: Rasterized data of the water area in Broward County using 25m x 25 m cells. Layer based upon a statewide shoreline
accurate to a scale of 1:12,000 and compared to aerial photography.
If more information is needed about any of the above data or documents, please contact Scott Calleson of the Florida Fish and Wildlife
Conservation Commission at 850-922-4330.