aade-03-ntce-12 real time decision making for … real time decision making for value creation while...
TRANSCRIPT

§ University of Houston. Chemical Engineering Department. Houston, TX, 77204-4004. Fax (713) 743-4323. Email: [email protected]
Copyright 2003 AADE Technical Conference This paper was prepared for presentation at the AADE 2003 National Technology Conference “Practical Solutions for Drilling Challenges”, held at the Radisson Astrodome Houston, Texas, April 1 - 3, 2003 in Houston, Texas. This conference was hosted by the Houston Chapter of the American Association of Drilling Engineers. The information presented in this paper does not reflect any position, claim or endorsement made or implied by the American Association of Drilling Engineers, their officers or members. Questions concerning the content of this paper should be directed to the individuals listed as author/s of this work.
Abstract
Geological and operational uncertainties usually impair the ability of operators to achieve technical and economic goals of a drilling project. Use of real-time data integrated to the earth model has recently reduced the above uncertainties, thus improving project performance. However, the above solution has only addressed part of the overall problem of optimizing the well’s economics, it cannot easily cope with the rapidly increasing amounts of data collected while drilling, and it has not been fully integrated with the control of operations yet. Therefore, we propose a multilayer and multiscale integrated strategy for decision making while drilling and in well intervention. The proposed strategy aims to simultaneously optimize in real time the following four objectives (a) operational drilling performance, (b) initial well completion design, (c) well productivity and (d) value creation. By seeking to optimize an overall integrated objective rather than individual ones, the proposed strategy creates the possibility of achieving a solution that is superior to the aggregate of individually optimized solutions. In this paper we outline the strategy mentioned above and discuss recent applications that support our proposition.
Introduction
Well construction and maintenance expenditures represent at least 50% of any field exploitation capital and operating expenses. In addition, planned expenditures and execution times often deviate from actual ones because of
� poor characterization of reservoir rock and fluids, and
� poor anticipation and management of abnormal operational situations.
Because of such uncertainties on reservoir geology and operations, which are inherent in all petroleum formations, real-time decision-making (while drilling and/or in workover) has traditionally played a crucial role in the construction and maintenance of any well. Improvising at
the rig site has been the mainstay of the past; the results have not always been optimum.
Recently, many conventional sensors have been put in place at the rig site in both the surface and downhole to measure some of the important operational parameters such as bit rotation, mud weight, stress, weight on bit, and reservoir properties such as pressure, grain, porosity and permeability distribution. Real-time data provided by such sensors have been integrated to the earth model, resulting in reduction of uncertainty to some extent. Also, real-time data have been used to control individual rig operations such as rotary steerable directional drilling, hydraulic fracturing, blow-out prevention, and well completion. Similarly, recently developed technologies allow integrated reservoir study teams to access and assess vast amounts of information, including drilling performance, and be able to decide “at the last minute” about well architecture, completion and value creation.
However,
� Each of the above solutions addresses an individual piece of the overall problem.
� Current methods for data interpretation and decision making cannot easily cope with the rapidly increasing amounts of real-time data collected while drilling. Such a poorly defined decision-making process usually consumes daily rig-time and, indeed, may not be quite accurate or encompassing.
� Real-time geological characterization and control of operations have not been integrated to produce a global solution.
The above realizations indicate that there are many opportunities for improving the decision making process. Therefore, we propose a multilayer and multiscale integrated strategy for decision making while drilling and in well intervention. This strategy aims to simultaneously optimize in real time the following four objectives
(a) operational drilling performance,
AADE-03-NTCE-12
Real Time Decision Making for Value Creation while Drilling and in Well Intervention L. Saputelli 1,2, M. Economides 1,§, M. Nikolaou1, A. Demarchos1. 1University of Houston, 2PDVSA
2 L. SAPUTELLI, M. ECONOMIDES, M. NIKOLAOU, A. DEMARCHOS, AADE-03-NTCE-12
(b) initial well completion design,
(c) well productivity, and
(d) value creation.
The proposed approach will rely heavily on utilization of vast amounts of field data that are now rapidly becoming available from novel sensors and data acquisition systems. It will capitalize on earlier successful experiences in the petroleum industry. It will also benefit from the application of similar concepts to related industries such as oil refining and petrochemicals, where multilayer-multiscale integrated decision making strategies have been very successful in the last two decades.
The novelty of the proposed approach is that by seeking to optimize an overall integrated objective rather than individual ones, it creates the possibility of achieving a solution that is superior to the aggregate of individually optimized solutions.
The rest of the paper is divided into five sections:
In Section 1, we discuss several issues regarding decision-making in the upstream, project performance and front-end engineering.
In Section 2, we review the drilling and completion process and the concepts of process-wide control and continuous optimization.
In Section 3, we introduce and review different uses of real-time acquired data for drilling and completion processes, and the physics and benefits of the integration.
In Section 4, we present an overview and we discuss a real-time drilling modeling strategy to simulate the drilling environment and reservoir conditions to dynamically re-design the well architecture.
Finally, in Section 5 we present several field history cases and their relevance to our work.
1. Decision Making in the Upstream Industry
Figure 1 shows the sequence of operations and decision-making processes that some of the best upstream petroleum practices entail today. The diamonds on the illustration denote junctures that are considered as crucial go/no-go decisions. For these points there is a need for key information and knowledge to support the decision.
Today, while most of these activities or fragments of these activities are found throughout the petroleum industry, they are often disjointed, done sequentially and without regard to their inter-connectivity. Current practices are thus almost always inefficient, with some project design cycle times extending to a decade or more with
substantial associated costs. This is the result of the disintegration of many independent micro-processes.
The important result is that the activation index, i.e., the required cost to activate a unit of production, is extremely high. This is particularly true in deep offshore and remote locations with large logistical and operational costs.
A fully integrated design addressing planning, construction, and operation must encompass economics, appraisal, reservoir management, surface, underground facilities, well construction, and drilling. The obvious goal is to reduce cycle time and number of iterations while minimizing uncertainty and mitigating risk.
1.1 Project performance and front-end engineering
Well drilling and completion projects require large capital investments. Practically everywhere well cost may range from $1 to $20 million. In a field development plan, well construction and maintenance expenditures correspond to at least 50% of capital and operating expenses. Drilling is the largest single expense during the life of a producing field.
Additionally, planned target costs and target execution times deviate from actual ones. As shown in Figure 2, only one in five wells that are drilled can meet their volumetric targets, because of geological, stratigraphic and fluid uncertainties and operational troubles, shown in Figure 3 (Saputelli, 1999). It has been amply demonstrated that the only way to mitigate risk during drilling and completions is through the proper establishment of an intensive project front-end planning strategy.
Optimal design of a well drilling plan can be one of the most intense engineering design challenges. Traditionally design involved the extensive revision of offset well data and applicable lessons learned from previous drilling and completion jobs. In many cases, such information does not guarantee the best learning rate or uncertainty reduction. Instead continuous systematic application of the same techniques would lead to the same errors.
Today’s and future drilling techniques promise to add value through the integration of real-time data acquisition (geological and operational) with the 3D earth model. Best practices include the use of a clean sheet of paper when starting the planning of a new well, but remembering the good and bad practices.
Formation pressure and lithology distribution uncertainties may be responsible for most of drilling difficulties and misapplications: pipe over-sizing, mud waste, formation damage and major drilling dynamic dysfunctions. On the other hand, the dynamic behavior of the drill bit is a critical factor for drilling efficiency. It affects the rate of penetration, hole conditions and the frequency of bit trips. Furthering the understanding of this behavior

AADE-03-NTC-12 REAL TIME DECISION MAKING FOR VALUE CREATION WHILE DRILLING AND WELL INTERVENTION 3
will result is significant improvements in all of these areas.
Under the restricted and competitive economy environment that has been experienced for years, it is not sufficient to meet operational expectations. World-class wells should simultaneously meet cost, productivity, environment and time constraints. They will have to compete among each other, even internally of a company. They compete for capital; they are ranked according to their economic value and their estimated risk of failure.
1.2 Integration paradigms from other industries
Integration of design and/or operation activities has been attempted to varying degrees in a number of industries and they may be fruitfully exploited for the benefit of the petroleum industry.
A well-known example from the aerospace industry is the completely paperless (computer-based) design of the Boeing 777 commercial jetliner (Norris, 1995). While it can be argued that there are significant differences between designing a single jetliner that will be produced in large numbers and designing a one-of-a-kind offshore platform, the concept of paperless design could certainly lend itself to the efficient design, reconfiguration, or retrofit of hydrocarbon production (particularly offshore) structures (Saputelli et al., 2000). Given the extremely high cost of an offshore platform, one can envision significant savings coming from streamlining the design process.
Another important example is the integration of operations in the refining industry. Starting with feedback control of individual variables such as levels, flows, temperatures, and pressures in its early days, the oil refining industry has advanced to the point of real-time computer-aided optimization and control of process units, plants, and, recently, entire supply chains (Aspen Technology, 2002). Important for the realization of this integration has been the decomposition of continuous optimization and control tasks at different levels of detail.
2. Drilling, Completion and Process Control
Drilling is the process through which companies access their oil and gas reserves. Drilling has been also related to “well construction”, since it involves all the necessary steps (engineering, procurement, construction and operation) as in any capital project. On the other hand, workover refers to well maintenance, and includes all the necessary activities for this purpose.
Automatic process control is the engineering discipline in which a computer-based algorithm makes decisions upon input process variables to achieve a desired product or maintain a signal value. This concept has been in use for many years in the drilling and completion industry. With
the increasing use of downhole sensors and modeling techniques, process control has also been supported by a number of numerical and data driven model techniques. These have expanded the capabilities of process control up to the adaptive learning level.
2.1 Drilling process
2.1.1 Drilling process components
A drilling process consists by all following steps:
I. Functional reservoir requirements, well description and economic constraints
II. Well and drilling program design
III. Rig selection, service contracting and material procurement
IV. Drilling operations execution, monitoring and control
V. Well completion and performance evaluation
We are interested in understanding the decision making process during rotary drilling operation, which has been the choice in the last five decades. A typical drilling scheduled process may include the following operations:
(a) Rig move to location
(b) Install conductor casing and set blow-out prevention equipment.
(c) Drill holes, run casings and cement them.
(d) Install completion (tubing, packers, cables and downhole equipment)
(e) Bring well to online production
2.1.1 Important elements of the rotary drilling process
The rotary drilling process (Figure 4) comprises a suspension or hoisting system, a driving motor or rotary system, a pumping system and several other machineries. The overall system development history has been of continuous improvement and quantum leaps in the last 50 years.
2.1.1.1 Hoist System.
- A controlled upward tension H, the hook load, is applied on the drill string at the surface, so that, the average force acting on the bit, Wo, is given as the buoyant weight of the pipes minus the average hook load Ho and the potential forces along the borehole wall (Richard, 2001).
- To control the upward tension, H, the suspension system of the rig uses a breaking system comprising a drum for saving the wire rope, a crown and a mast.
2.1.1.2 Rotary System

4 L. SAPUTELLI, M. ECONOMIDES, M. NIKOLAOU, A. DEMARCHOS, AADE-03-NTCE-12
- A motor (electrical or hydraulic) on the rig floor rotates the drill string at angular velocity, �o.�
- A downhole mud-driven motor is used to increase velocity at the bit.
- The total instantaneous angular velocity of the bit, �, is affected by all the potential forces along the borehole wall and the cutting front.
2.1.1.3 Pump System
- A pump system is in charge of boosting and controlling the pressure of a drilling fluid.
- Mud is circulated though the pipes and is distributed by the bit nozzles against the cutting front. It travels upward via the annular space between the pipe and the formation walls.
- The density of the mud plays an important role in the overall efficiency. Mud functions are to provide support of the borehole, transport the cuttings to surface, cooling and cleaning the bit.
- The equivalent circulating density is the net dynamic condition of the mud density, affected by the fluid velocity (flow and area) in the wellbore (drill pipe and annulus) and pressure restrictions at the surface.
2.2 Well intervention processes
Well intervention or workover refers to well maintenance or overhaul, and includes all the necessary activities.
2.2.1 Why Well Intervention?
Well intervention is required when mechanical or energy conditions have impaired the well’s ability to flow under optimal and economical flow rates.
Most popular well intervention objectives may include one or more of the following:
(a) Reservoir stimulation (acidizing, fracturing)
(b) Reservoir solid control (gravel pack, slotted screen, fracturing)
(c) Well re-completion (tubing, gas lift, or downhole pump redesign)
(d) Well cleaning (sand, solids, asphaltenes, parafines, waxes, etc)
(e) Offending zone shut-off (cement squeeze, re-perforation, sleeve operation etc)
(f) Casing, downhole equipment or tubing repairs.
(g) Main wellbore side tracking to create additional reservoir access.
(h) Production logging, behind casing measurements, etc.
A typical well intervention process may include rig or rigless operations listed as follows:
(a) Control of the well
(b) Remove existing well completion (tubing, packers, cables and downhole equipment)
(c) Perform workover job (squeeze, acidize, fracture, perforate)
(d) Install old/new completion (tubing, packers, cables and downhole equipment)
(e) Bring well to online production
2.2.2 Intervention-less wells
One of the greatest worries of any oil/gas producing asset unit is how long would the well be in production without the necessity of intervention. Reservoir studies do not predict a detailed well intervention plan and hence it becomes an unexpected-event management exercise.
Maintenance-free wells are usually “super-wells”, though expensive, because they need to account for the many unknown uncertainties regarding reservoir energy, mechanical constraints and reservoir selectiveness. These super wells are ready to support the unexpected fracturing or acidizing jobs, changes in artificial lift system, and chemical treatments for scale removal.
There have been an increasing number of “fit-for-purpose” technologies that drastically reduce the costs of well maintenance that formerly would have required a rig, wireline or coiled-tubing intervention. This is the case of smart wells and well robots.
. Engineers measure the real performance against a model and make adjustments to optimize production, take corrective action and set inflow and outflows in the field. Downhole tools should adjust formation flows in the wellbore.
2.2.3 Rigless intervention through smart wells
Smart wells use monitoring devices to measure conditions from the reservoir to the surface in real-time. These allow the comparison of the real performance against the model and make adjustments to optimize production, take corrective action and set inflow and outflows in the field. To be considered real-time, the response should be with equal speed by actuating surface-controlled, subsurface instruments through a combination of electronically and hydraulically controlled instruments to affect changes that created the previous measurement. Operators can usually affect the position of an internal control valve. Smart wells with multiple-level intelligent completions can drain multiple oil reservoirs in an optimal manner by measuring flow rates and pressure during production, and reconfiguring the completion specifications on the fly to

AADE-03-NTC-12 REAL TIME DECISION MAKING FOR VALUE CREATION WHILE DRILLING AND WELL INTERVENTION 5
maximize recovery.
These measurement and control functions are particularly useful for reservoirs with compartmentalized production. The biggest business driver for intelligence is higher petroleum recoveries with lower costs. Smart fields allow drilling fewer wells and also reducing surface facilities and costs.
In most components of smart well systems, the essential technology and philosophy behind the internal control valve has existed for decades and is commonly known as a sliding sleeve. It comprises a pre-perforated section of tubing set across a producing zone and an inner sleeve with upper and lower seals that is mechanically moved to fully or partially block production. The valve can also be left partially opened, in effect acting as a downhole choke to regulate the flow volume from a specific zone.
The ultimate goal of smart wells is to produce a maximum percentage of the reservoir’s original oil or gas in place while at the same time minimizing well interventions, the largest single expense to occur during the life of most producing wells.
There exist some challenges:
- If the movable part of a sliding sleeve or choke fails near the end of the well’s life, often the time for which it was designed to capture the last incremental bit of production from a reservoir, the expensive completion strategy will go essentially for naught.
- If a critical piece of monitoring electronics fail at any time during the well’s life it could force an intervention to repair or replace it, an expense that would almost certainly negate any economic advantage for which it was originally intended.
- Intelligent completions require numerous electronic signals going in both directions between surface and down hole simultaneously. Now, the majority of the well’s cost goes into building the signal and power umbilical. Fiber optics may be a near-future solution, a technology some in the oil industry have long resisted as being too delicate to survive long at the bottom of an oil well or even the brutal process of running pipe in the hole.
The ultimate smart well, one that will very nearly run itself, will not be far behind. Such a system will constantly monitor flow rates, fluid makeup, temperature, pressure and other well characteristics at all critical nodes along the flow path between reservoir and surface facility and instantly relay that data to computers located anywhere in the world. The computer's software will then compare the data to an earlier programmed performance model for that well designed to reflects the operator's optimum performance specifications.
2.2.4 Rigless intervention through robotics
Another key to the reduction in well interventions is robotics. Robotized machines are being considered for unmanned operations. In the North Sea, engineers stripped a platform to its minimum necessary equipment. For instance, a platform doesn’t need a helicopter platform if only one visit every 6 months is required.
There have been major advancements and successful field trials on robots that crawl into the well, perform a maintenance task and crawl back out again until they are called to perform their task again, either by time or by a cue from the sensors.
2.3 Process Control and Automation
Feedback control and automation have also generated interest in petroleum industry during the last two decades.
Because of the complexity and ambiguity of such operations, real-time decision-making (while drilling and/or workover) plays one of the most important roles in the construction and maintenance of any producing well.
As shown in Figure 5, the drilling operation can be modeled as a process plant considering all the input variables as the modifiable process parameters (surface orientation, hook load, rotary speed, flow, torque and pressure limits). The system response can involve direct measurements (Hook load, pressure, torque, rotations per minute) or indirect calculations from the measurements (well flowing pressure, reactive torque, rate of penetration, weight on bit, etc). A controller takes decision upon measured and calculated response, creating the proper change in the input variables. A robust controller must also take into account measured (mud weight, tripping) and unmeasured disturbances (wellbore geomechanics, brake temperature) to properly respond under extreme plant conditions.
2.4 Continuous Field Optimization
Continuous field-wide optimization involves continuous data acquisition and decision. At any time, after optimal decisions have been made, actions are taken and the operation proceeds. At a certain future time, optimal decisions will have to be made again, after new data have been collected and processed. This mode of decision making, known as moving horizon or receding horizon optimization, has been successfully used in the process industries, at various levels of the field operation hierarchy (FOH). It is known as model predictive control (Nikolaou, 2001, and references therein) at the supervisory or regulatory control levels. The moving horizon concept is also called rolling horizon in scheduling literature, (Bequette, 2003).
An ideal cycle of continuous optimization of a hydrocarbon producing system can be visualized in Figure

6 L. SAPUTELLI, M. ECONOMIDES, M. NIKOLAOU, A. DEMARCHOS, AADE-03-NTCE-12
6. It starts at the field level (1). Data are collected from field sensors (2), and properly gathered and used in real-time or stored in corporate databases (3) to be processed further. An integrated multidisciplinary team analyzes and integrates data to generate a numerical image of the reservoir, wells and surface components (4). Such an image will permit the conception (prediction) of many producing scenarios (5). Business constraints (6) and production scenarios are properly balanced to produce an optimum solution (7). This would facilitate a decision making process (8) which will depend on many other factors, especially implementation (9) limitations and operational imperatives.
While each of the steps represented in Figure 6 is individually practiced today, there is little coordination of these steps. For example, phases may be disconnected or by-passed. Orchestrating these steps can greatly contribute towards the practical realization of continuous field-wide optimization.
2.4.1 Multi-level, multi-scale approach to continuous optimization and control
The most compelling impetus behind computer integration of field operations is the opportunity to closely coordinate (integrate) a range of individual activities, both human and computer based, in order to achieve overall corporate objectives. The ultimate target of computer integration is to relate dispersed individual activities to an overall corporate optimization problem that could, in turn, be used in optimal decision making over time.
So far, the development of a manageable all-inclusive optimization problem has been practically beyond reach, due to the enormous complexity of the problem. That complexity is manifest in both the algorithms as well as human-computer communication aspects of the problem. As a remedy, hierarchical decomposition of the problem and optimal decision-making at each level can be employed. For field operations, this decomposition can be realized according to the hierarchical structure of Figure 7, in which information at each level is exchanged with information at adjacent levels and possibly beyond. Information gathered at each level is sent to the level above it, and decisions made at each level are passed to the level below it in a feedback fashion.
A distinguishing feature of each level in Figure 7a is the time-scale associated with it (i.e., how frequently decisions are made), ranging from split-seconds for the Regulatory Control level, to years in Capacity Planning & Design. Drilling operation, Figure 7b, is one-of-a-kind process that can be mapped in the industrial standard field operations hierarchy. Examples of tasks accomplished at each level of Figure 7 include:
Regulatory Control: Regulatory controllers are usually
autonomous and self-contained hardware units. Examples: Flow, pressure and temperature control in pumps, wellheads and separators; Fuel injection to produce steam in a boiler; gas lift or pump power in producing wells. Set-points to these regulatory control loops are dictated by the overlying levels.
Supervisory Control: This is a well-known technology in many industries; it orchestrates all the lower level controllers, passes new set points and optimizes multivariable problems on a real-time fashion. Examples: SCADA systems for coordinating rig floor operations, flow stations and pipelines; Gas distribution/optimization on a pipeline network or a single wellhead; Monitoring wellheads, pipelines and flow stations.
Standard optimization techniques employing integrated models generated off-line are used at this level to determine the optimum operation strategies.
Scheduling: This involves the optimum allocation of resources in time to meet short-term operational demands, usually in the range of one day to one month. Examples include: scheduling injection/production rates and resources; opening and closing wells or partial completions; adjusting well operating parameters based on analytical models; movement and transportation of operational equipment. Optimization techniques, involving both continuous and discrete variables are used to search for an optimal scheduling scheme that maximizes value.
Operational Planning: This delineates the total range of activities that would take place within a certain period, in the order of one month up to one year, to meet certain business cycle plan. The plan may be adjusted to meet demands. Examples include: planning ahead of injection/production rates and resources; planning drilling and workover activity to overcome declination or growth needs.
Capacity Planning and Design: This ensures that resources are timely available so that operational planning targets consistent with a long-term business plan are met. It may involve analysis and planning of asset life cycle and installed base maintenance or growth. It also involves supply chain management and market and customer demands prediction.
The implicit assumption in the above decomposition is that the aggregate of the individually optimal decisions at each level will be close to the overall optimal decision at each point in time. While that assumption is not perfect, it renders an unmanageable problem feasible.
3. Real time processes in drilling and well intervention
For many years, drilling and completion operations have been supported with extensive data collection processes.
AADE-03-NTC-12 REAL TIME DECISION MAKING FOR VALUE CREATION WHILE DRILLING AND WELL INTERVENTION 7
In the last decade, with the inclusion of downhole sensors and telecommunication capabilities, there is a broad spectrum of real time data collection processes that occur during drilling and completion operations. These processes are summarized in Table 1.
3.1 Rig floor operations automation and control
Rig floor activities are complex and risky tasks that require safety and autonomous control. Figure 8 shows a suggested rig floor process interaction close-loops among the hoist, pump, and rotary control systems inter-connected in feedback mode with the earth model.
There have been numerous attempts to integrate earth modeling in fully close-loop with the drilling system, as shown in the field cases by Maliverno et al., 2002, Branch et al., 2001, Zin Che Lah et al., 2000. In all of those cases, decisions were made to correct the path of the well based on the collected feedback information while drilling.
Drilling and workover operations are affected by a number of surface and downhole conditions, Boyadjieff (2003) Noble (2003), Mansure et al., 1999. During the last two or three decades many conventional sensors (Table 2) have been put in place at the rig floor site (bit rotation, mud weight, stress, weight on bit) and in the and bottom hole assembly (bottom hole pressure and temperature) in order to estimate some of the important reservoir parameters and reservoir properties (pressure, grain, porosity and permeability distribution), yet critical state variables identification remains uncertain (formation pressure and multiphase flows).
3.2 Measurement and logging while drilling
MWD is a key technology for monitoring and transmitting a number of downhole conditions such as downhole pressure, temperature and well directional data.
LWD (Logging While Drilling) allows the logging and formation evaluation often within minutes of being drilled, which ensure little, or no wellbore alteration or formation invasion. LWD data are transmitted to the surface by mud pulse telemetry and stored in memory for later retrieval on the surface. The real-time LWD data enable real-time decision making on the rig or office.
Formation pressure and lithology distribution uncertainties help to avoid formation damage and prevent major drilling dynamic dysfunctions.
3.2.1 Deepwater formation evaluation
Although water depth itself is not a problem for formation evaluation, the dramatic change in geological environment and the physical attributes of that environment are demanding. Unconsolidated sands, thinly laminated sands, and heavy oil in deepwater plays can create significant evaluation challenges. Other considerations are
correlation with 3D seismic data to better determine reservoir size, time depth modeling to improve the drilling process and event recognition, and the critical evaluation of type and quality of hydrocarbons in place.
The determination of reservoir quality, hydrocarbon volumes and producibility in potentially macro-scale reservoirs are important parameters for a successful drilling program. Information value and operational efficiency are paramount because rig costs can exceed $300,000 per day.
3.3 Earth model integrated to measurement while drilling and completion
Reservoir management teams are faced with an increasing number of data sources and an increasing amount of data from those sources. These data sources are also becoming more sophisticated, so that it is becoming increasingly difficult to interpret the available data. The data sources include improved sensors, higher fidelity reservoir simulators, and wide varieties of company data and international market data.
Recently developed technologies allow integrated reservoir study teams to assess vast amounts of information, including drilling performance, to decide “at the last minute” about well architecture, completion and value creation. This poorly defined decision-making process usually consumes daily rig-time and might not be quite accurate and extensive.
Sensor data, whether from existing sensors or novel sensors of the future, are needed by many of the physical processes of the oil and gas industry. Each of these processes may differ in the detail and timing of the information they require. The development of multiple interfaces to the information system to access all appropriate detail and timing of sensor data required by the users. These users require focused subsets of data specific to their applications. The operational concentrators will be used to provide detailed sensor data for existing point data sources. Novel sensors, such as the fiber optic distributed temperature sensor, may require the development of direct interfaces over the SCADA system.
On the other hand, the oil industry is adopting visualization as an important tool for interpreting large data sets and the results of large-scale simulations. Many companies in the industry are installing large display systems. Most of these systems are focused on interpretation and are part of a reservoir control system.
3.4 Drilling performance
For many year operators and drilling contractors have concentrated efforts to eliminate non-productive time. In most cases, “non-productive-time” has been defined as “no-making-hole” time. Although this can actually save a
8 L. SAPUTELLI, M. ECONOMIDES, M. NIKOLAOU, A. DEMARCHOS, AADE-03-NTCE-12
lot of time and cost during drilling and workover, they are usually solved at the expense of increasing the expectation over the crew efficiency and the of the rig equipment availability. This simply does not solve all the problems since the drilling contractor does not have enough incentive for reducing the non-productive time.
In other instances, “non-productive-time” has been defined as “unscheduled events” or “unplanned events”. These definitions do not account for how efficient the drilling process is. That is why, it is more clever to focus in the improvement of the productive time, which may contribute more on the well’s economy.
A well’s mechanical performance can be measured by examining different factors
- Mechanical completion of the well, on geological target, on time and cost target.
- Average and instantaneous rate of penetration
- Hole conditions (pressure control, integrity, fluid control)
- Frequency of bit trips and round trip time
- Total drilling time and completion time vs. total number of days in location
- Time and cost benchmarking with offset wells
Factors affecting “productive time” of drilling performance:
- Bit design and selection (depth of cut, insert array)
- Rig operating parameters (weight on bit, rotation speed, pump pressure)
- Mud properties (pressure control, solid transport, lubrication)
- Bottom hole assembly design for proper vibration, stability, drag and torque control
- Knowledge on fracture gradient, pore pressure profiles and grain size distribution
On the other hand, dynamic behavior of the drill bit is a critical factor in drilling efficiency. It affects rate of penetration, hole conditions and the frequency of bit trips. Improved understanding of this behavior can result in significant performance improvements in all of these areas.
4. Real time decision making while drilling
Our objective is to propose a real time optimal control strategy able to identify, diagnose and predict drilling events in real time so that proper decisions related to (a) operational drilling performance, (b) initial well completion
design, (c) well productivity and (d) optimal value creation, are combined and orchestrated in a smart fashion.
4.1 Real time drilling and completion modeling aspects
The real time drilling modeling strategy is able to simulate the drilling environment and reservoir conditions in order to dynamically improve drilling performance, detect abnormal situations, re-design the well architecture (casing setting, number of branches, length of horizontal section, navigation, etc), well completion (perforations, packing, stimulation, monitoring and artificial lift) and well dynamics (deliverability, production profiles, hydrocarbon recovery, etc).
4.1.1 Operational drilling performance
Automatic drillers have been around for almost two decade. Boyadjieff (2003) posed the following questions:
- What is required to optimize drilling parameters? - How can control improve field performance results?
Drilling performance can be predicted using simple input-output modeling such as linear time series considering past information of input and output values. Noble (2003) has developed a mathematical algorithm that optimizes the rate of penetration by giving the driller a target optimum weight on bit for a given downhole environment. Surface parameter measurements such as hook load, torque, pump pressure and block position are used to perform a continuous drill off and calculate a target WOB. The computer program performs the calculation and displays the target on a drill floor monitor for the driller to follow.
An expert system by Mansure et al., 1999 was developed to automatically detect and diagnose several important circulation system problems in geothermal drilling. The system is used for detecting, characterizing, and quantifying lost circulation, fluid influx, gas/steam kicks, loss of mud pump efficiency, washouts, plugged nozzles, and sensor problems. Data from the outflow meter, pump-stroke counter, inflow meter, pit volume indicator, standpipe pressure sensor, and other sensors are processed by a Kalman filter and examined for deviations from expected patterns. The deviations are transformed into evidence for a Bayesian Network, which estimates the probability of each fault. The results are displayed by a Graphical User Interface, which also allows the user to see data related to a specific fault. A prototype has been field-tested and has successfully detected and diagnosed a variety of faults.
4.1.2 Abnormal situation detection and management
The objective of abnormal situation diagnosis or event detection is to pinpoint and correct problems that occur in the drilling process (Finch et al., 1991). The objective of

AADE-03-NTC-12 REAL TIME DECISION MAKING FOR VALUE CREATION WHILE DRILLING AND WELL INTERVENTION 9
real-time abnormal situation diagnosis is to perform these tasks within a time frame that allows continued, safe operation of the system.
Economic incentives for real-time abnormal situation management include well quality, rig equipment protection, non-productive time reduction and environmental protection. The time frame for real-time abnormal situation management can vary dramatically depending on the system being diagnosed. For many drilling operations, this time frame may be one second or more. For some other rigsite processes, the time may be several minutes or hours.
Automated computer systems have many advantages for real-time abnormal situation detection. Automated systems are capable of continuously monitoring more variables with greater accuracy and faster response time than human beings. To fully realize the advantages, however, an automated diagnosis system must be able to:
1. Access real-time data,
2. Intelligently interpret data,
3. Communicate with human decision makers, and
4. Initiate corrective actions.
Items 1 and 4 can usually be accomplished by integrating the diagnosis system with existing automation systems. Data are usually available from a real-time database that serves as a repository for data collected from remote sensors. Corrective actions can usually be initiated by accessing the same supervisory control systems used by human operators. This integration can be accomplished by existing network technologies. Items 2 and 3 are the key features that need to be addressed by advanced software development environments.
There has been an increasing interest in the use of “artificial intelligence” or data driven identification models, used for clustering, fuzzy clustering or multilinear regression. For example, neural networks may be considered for non-supervised clustering of information or supervised training of abnormal situation operations.
Neural networks can represent arbitrary, multivariable functions to any degree of accuracy, for use in functional approximation and in classification. This might make any preprocessing of data seem superfluous. However, in practice, there are various problems associated with selecting the best network architecture, and with training. People have commonly found it necessary to "help" the network by carefully choosing their feature set, and doing some preprocessing to better extract the features they are really looking for.
Rule-based expert system shells provide a convenient mechanism for representing conditional knowledge. Rules
are typically of the form:
IF <a set of conditions> THEN <a set of conclusions>
A crucial aspect of real-time abnormal situation diagnosis is the ability to handle uncertainty. Abnormal situation diagnosis always involves uncertainty because events typically cannot be observed directly and must be deduced from indirect measurements. Allowing “unknown” as a logical status is one way to expresses uncertainty.
Ultimately, we could use the knowledge acquired in the identification stage to produce some intelligent decisions about the equipment operating points, i.e., the use optimization algorithm to calculate “drill-ahead” parameters that mitigate problems.
There exists available public literature about the development of a computer automated trend recognition system (Noble, 2003).
4.1.3 Well architecture (casing, location, branches, length of horizontal section, navigation, etc)
Proper real-time re-characterization of the earth model while drilling is possible with suitable data capture of formation measurement such as: seismic, resistivity at the bit, resistivity beyond the bit, reservoir permeability and formation pressure.
For a vertical well, the initial pseudosteady state flow performance will depend on those parameters encountered at the drilling conditions:
( )
141.2 [ln(0.472 / ) ]wf
e w
kh p pq
B r r s��
��
........................................ (1)
where q is oil flow rate in STB/d, k is permeability in md, h is formation thickness in ft, p is the reservoir static pressure, pwf is the well flowing pressure, B is the formation volume factor, re is the drainage radius in ft, rw is the wellbore radius in ft, and s is the skin factor, dimensionless.
Reservoir permeability, reservoir pressure and formation thickness are uncertain prior to the drilling of the well. It is only after the well has been drilled and the proper logs ran that the actual flow can be estimated. Despite this new acquired knowledge, Eq. 1 will not predict actual well rates because of the unknowns involved in the interaction with the vertical lift system.
For a horizontal well, the flow performance is given by:
2 2
( )
( / 2)141.2 ln ln
/ 2 ( 1)
H wf
ani ani
w ani
k h p pq
a a L I h I hB
L L r I�
��
� � � �� � � � �� � � � � � ���
.... (2)
10 L. SAPUTELLI, M. ECONOMIDES, M. NIKOLAOU, A. DEMARCHOS, AADE-03-NTCE-12
Hani
V
kI
k� ......................................................................(3)
0.50.54
0.5 0.252 / 2
eHrLa
L
½ª º° °§ · � �« »® ¾¨ ¸
© ¹« »° °¬ ¼¯ ¿
.........................................(4)
where q is oil flow rate in STB/d, kH is the horizontal
permeability in md, kV is the vertical permeability in md, reH is the equivalent drainage radius in ft, L is the length of the well, Iani is the anisotropy index and a is the ellipsoid long half axis. The other variables are as in Eq. 1.
For a given field development, the information acquired while drilling may be crucial for changing the well’s architecture in real time. Depending on the anisotropy index, one may chose to select an appropriate well length or not drill the horizontal well at all if a vertical pilot hole has been drilled. On the other hand additional multilateral branches may also become appropriate to enhance the well’s economy.
4.1.4 Initial well completion design (perforations, packing, and stimulation)
The assessed values at the time of drilling have an immediate impact in the selection of the well completion (perforation density, acid treatment and fracturing needs, gravel packing, tubing diameter, artificial lift design, etc).
From Eq. 1, one can see that given the formation pay, damage characteristics and fluid deliverability conditions we can redesign the completion in real time.
Assessing well damage: Hawkins formula establishes a relationship between formation permeability, k, the impaired zone radius, rs, and damage permeability ks. Only rw is known with certainty.
1 ln s
s w
rks
k r
� �� � � �
...........................................................(5)
To solve Eq. 5, given some initial values for k and s
from an available well test interpretation, one should continuously iterate between ks and rs. Other techniques exist for the rigorous estimation of the radius of the fluid invasion and impaired permeability. The result should definitely help to understand and design the damage removal strategy.
Total damage: Initial values for s from an available WellTest interpretation by embrace several wellbore effects related to wellbore’s chemical and geometric interaction with the formation:
d c p pseudos s s s sT�
� � � �� .......................................(6)
where sd is the damage due to drill-mud formation
impairment, sF� �� is the one caused by partial penetration and slant effects, sp is the one caused by perforations.
Understanding each one of these effects while drilling should also understand and design the damage removal strategy.
Sand Control: Many of the world’s oil and gas wells produce from unconsolidated sandstones that produce formation sand with reservoir fluids. Problems that are associated with sand production include: plugging of perforation tunnels, sanding up of the production interval, accumulation in surface separators, and potential failure of downhole and surface equipment from erosion.
These problems can pose serious economic and safety risks on an operation. These wells require specialized sand control completion practices to allow hydrocarbons to be produced without formation sand. While it is important to effectively prevent sand production, it is equally important to do so in a way that does not hinder a wells’ productivity.
Some of the most popular techniques for sand exclusion include gravel packing, resin consolidation, slotted or pre-drilled liners and screens. Techniques for sand deconsolidation control include flux reduction, horizontal wells and high-permeability fracturing, all of those based on the reduction of the reservoir drawdown.
4.1.5 Well productivity (monitoring and artificial lift)
Well productivity will depend on how many volume units can be withdrawn with the minimum amount of effort, i.e. drawdown pressure difference in equation 1. Assuming that there have been solved all reservoir impairment problems (i.e. damage, perforations, and sand control), and then the next step is to convey these fluids to the surface in the most efficient manner, i.e. minimum bottomhole flowing pressure and minimum cost.
4.1.6 Optimal value creation (deliverability, production profiles, hydrocarbon recovery, etc)
By combining the well deliverability equation and the necessary operating expenses, one could easily envision the net present value of a well that is being drilled can actually be assessed in real time:
� � � �� �
$
1
, , , ,
1
Nn n n
nn
q k h p s t p C q sNPV
i
�� � ��
�� ........................ (7)
. � �$, , ,n n nt p C q s� are the time period in days, the selling
price and the operating costs, respectively based on current field deliverability conditions and well damage.
Given the formation pay, damage characteristics and fluid deliverability conditions we can update the reservoir
AADE-03-NTC-12 REAL TIME DECISION MAKING FOR VALUE CREATION WHILE DRILLING AND WELL INTERVENTION 11
model or near wellbore area model, redesign the completion in real time, calculate the ultimate recovery and study the production profiles in real time.
The NPV value calculated with Eq. 7 needs to be adjusted with proper decline models, which ultimately affect the future returns in the equation.
4.1.7 Real-time Hydraulic Fracturing Job Monitoring
There is perhaps no other well intervention operation where real time data gathering and monitoring is as critical as that of Hydraulic Fracturing. Not only the success or failure of the treatment depends on real time data monitoring, but the integrity of the well as well as the safety of the personnel and equipment on location.
To initiate a hydraulic fracture in the formation there are two basic requirements:
(a) Pump a fluid at a rate that exceeds the reservoir leak off rate, and
(b) Pump the fluid at a pressure that exceeds the fracturing pressure of the formation.
A successful hydraulic fracture treatment however, requires that a conductive fracture of a given length and width is left behind once the pumping is seized.
Performing a hydraulic fracture is a very complex operation. The fracturing fluid is either batched mixed in holding tanks, or mixed on the fly (modern equipment) according to very precise recipe. Chemicals are added to kill bacteria in the water, reduce friction, control leak off, give it the ability to carry large amounts of propant, and once the job is completed, to break down the fracturing fluid and leave behind a clean and conductive fracture. All surface operations are precisely measured and monitored from the control van. The most important of these are the rate and pressure. Figure 9. below shows a typical pressure response during a minifrac.
The pressure response, which is currently measured at the wellhead, is the only way of interpreting of what is happening in the reservoir. Measured pressure includes pressure due to friction in the tubulars and pressure due to friction at the perforations. These two pressures are estimated and subtracted to give the pressure in the reservoir. As pressure is the only indication of what is happening in the reservoir, and it is the only guide as to how to adjust the fracturing fluid recipe to control leak off, propagate or arrest the length of pressure growth, inflate it and pack it with propant, it becomes very critical. The ability to measure this closer to the reservoir would improve the execution of fracturing treatments.
One other tool, which is occasionally used to interpret the dimensions and direction of the hydraulic fracture, is tilt meters. Tilt meters are placed in offset wells and on
the surface far from the well. As the hydraulic fracture treatment is performed, they measure the effect of the fracture to the reservoir by measuring the minute changes in “tilt” and elevation on the surface above the reservoir. These measurements are processed and interpreted to create a 3-D diagram of the fracture. Real time monitoring and interpretation could improve in the execution of a successful hydraulic fracture treatment.
4.1.8 Real-time Team Effort
Technology benefits described in this paper will be only obtainable under efficient team integration efforts such as the ones described in Maliverno et al., 2002, Branch et al., 2001 and Zin Che Lah et al., 2000.
In many cases, especially in complex well jobs, it is necessary to draw upon all available expertise not only in the planning stage but also during the drilling itself. This can be a key capability for geosteering, especially in remote locations or when staffing is constrained.
It is often necessary to set up a reliable broadband link between offsite facilities where most of the operator multidisciplinary geoscience and engineering team of experts are located with the rig site control room where drilling contractors and service company engineers are performing the operational job.
Both parties should have access to the same amount and quality of data (logging data, directional well trajectories, operational parameters, etc.). Drilling data can also be displayed and downloaded for further analysis in real time and 24 hour coverage to ensure continuous monitoring of the progress, detect abnormal events, characterize and correct lithology model, adjust well trajectory and submit steering or operational guidelines.
The e-drill service center (Varco, 2003) provides quick response, real-time monitoring and remote diagnostics of Rig Automation and Control systems by experts in order to achieve maximum rig performance.
4.2 Integrated Real Time Optimal Control Strategy
Monitoring and controlling the drilling system, as in any other process plant, requires different time-scale hierarchy, as explained in Section 2.4.1.
Figure 10 presents an integrated real-time decision driven optimal control strategy that incorporates all the elements for an efficient drilling process tied to earth model:
- At the lower level we have data acquisition of key variables grouped in two, rig surface sensors and downhole measurement and logging while drilling.
- At the control level, basic control function and machine interfaces are implemented. This level is autonomous since it can operate only with data provide from the

12 L. SAPUTELLI, M. ECONOMIDES, M. NIKOLAOU, A. DEMARCHOS, AADE-03-NTCE-12
lower level, but it receives updating commands for new set points and new variables constraints.
- The monitoring level is a pre-processing and calculation of variables previously obtained. This level itself is also self-sufficient to make important decision about drilling operations, for example, modifying tripping time in order to avoid swabbing the well. Rig data and trends are visualized in order to predict future performance.
- In the control and diagnosis level, proper abnormal situation management is addressed to create necessary actions to avoid them, and instruct the lower levels for such actions. At this level also, formation related information is used to update the reservoir geological model, well productivity and deliverability expectations.
- In the optimization layer well architecture design and well completion needs are optimized based on lower levels on information and the optimization of an economic model. Also, proper decisions are made in order to optimize overall drilling efficiency by reviewing the parameters for wellbore hydraulics, rate of penetration, fluid properties, etc.
- The upper management level is the highest level of hierarchy and reflects the bottom line objectives of the business: maximum well economic value, minimum safety health and environment impacts, 100% volumetric success rate, and minimum non productive time.
4.2.1 Hydraulic Management Example
We present in Figure 11 real-time multilevel management approach (modified after Vivas et al., 2002). This is the industrial automation standard pyramid used in process control but modified for the drilling environment.
- The lower level automation in the pyramid is the basic instrumentation, which is done at the process level, usually is at a high-frequency rate (time-scale is usually seconds or milliseconds). At this level we may also find some secondary calculated or inferred measurements such as flow rates and circulation losses.
- Flowing information upwards we find the “monitoring” or “supervisory” layer. At this layer, further complex calculations are done to estimate wellbore integrity, fracture gradient, pore pressure, swab and surge, and equivalent circulating density.
- The next level is “control and diagnosis”, where some decisions are made towards equivalent circulating density management, circulation losses, inflow kicks, pipeline breaks and wellbore cleaning. This level is also called “model predictive control”, usually close-loop. It is based on the open loop identification and optimum control to search the minimum cost path to reach the next desired state.
- At the real-time optimization level, certain techniques and applications are used to search an optimum solution to determine the best operating point that maximizes value subject to some restrictions. Currently, it is usually a one-time process or an off-line process. We optimize fluid properties and fluid hydraulics for optimizing drilling time.
- The upper level of the pyramid shall exhibit a high hierarchy dynamic goal, in this case, reduction of non-productive time based on proper real-time hydraulics management.
4.2.2 Integrated productivity analysis for well intervention decision making
We present in Figure 12 integrated productivity analyses for well intervention decision making. The integration is based on the proper orchestration of integral reservoir analysis, well and nodal analysis, well and drainage area analysis, economic analysis, execution and monitoring.
5. Applications and case histories
In this section we discuss several field cases for the use of real time data collection for decision making processes.
5.1 Predictive control of drilling dynamics
Real-time monitoring of BHA and drill bit dynamic behavior is a critical factor in improving drilling efficiency. It allows the driller to avoid detrimental drill string vibrations and maintain optimum drilling conditions through periodic adjustments to various surface control parameters (such as hook load, RPM, flow rate and mud properties).
However, selection of the correct control parameters is not a trivial task. A few iterations in parameter modification may be required before the desired effect is achieved and, even then, the result may not be optimal. For this reason, the development of efficient methods to predict the dynamic behavior of the BHA, and methods to select the appropriate control parameters, is important for drilling optimization.
Dashevskiy et al., 1991 use neural networks to model the dynamic behavior of the non-linear, multi- input/output drilling system. Such a model, along with an optimizing controller, provides the driller with a quantified recommendation on the appropriate corrective action(s) required to bring the system to an optimal drilling condition. Development of the neural network model used drilling dynamics data from a field test. This field test involved various drilling scenarios in different lithology units. The training and fine-tuning of the basic model utilized both surface and downhole dynamics data recorded in real-time while drilling. Measurement of the
AADE-03-NTC-12 REAL TIME DECISION MAKING FOR VALUE CREATION WHILE DRILLING AND WELL INTERVENTION 13
dynamic state of the BHA was achieved using data from downhole vibration sensors. This information, which represents the effects of modifying the surface control parameters, was recorded in the memory of the downhole tool. Representative portions of this test data set, along with the corresponding set of input-output control parameters, were used in developing and training the model.
Discussion:
- Good agreement between the dynamic behavior of the BHA predicted by the NN model and the actual measured BHA response.
- The test established criteria for selecting input-output parameters and for selecting representative data sets for building and training the model.
- This analysis has demonstrated an approach to simulation and prediction of the dynamic behavior of the complex multi-parameter drilling system.
- This method could become a powerful alternative to traditional analytic or direct numerical modeling and its utilization could be extended beyond drilling dynamics to the field of drilling control and optimization.
5.2 Real time well planning and construction monitoring
There have been many reported case histories of real-time remote collaboration, monitoring and control of drilling operations (Maliverno et al., 2002, Branch et al., 2001, Zin Che Lah et al., 2000)
The objective of the real-time well planning and construction project reported by Branch et al., 2001 was to monitor horizontal well drilling and make geoscience and drilling engineering decisions to optimize well placement and well construction both in real time and for subsequent wells (Figure 13). The expected functionality of real-time monitoring included:
- To provide a common earth model visualization and/or interpretation capabilities at the office and rig.
- Provide the means to communicate complex ideas across the network to different sites
- Provide immediate feedback to the directional drilling engineers and influence bit steering / drilling optimization (Figure 14).
- To use the results from prior drilling to re-interpret earth model and impact future well design
Branch et al., 2001 tested direct and automatic loading of survey information (inclination and azimuth) with gamma ray and resistivity while drilling into the geological model database. This permitted the viewing of the well
trajectory and lithology logs on the seismic profile, and the ultimate broadcast of the data across the company’s intranet.
5.3 Well construction risk management for structural, sedimentology and petrophysical uncertainties.
Malinverno et al., 2002 described a field case for successful drilling of horizontal wells in thin oil columns. They constructed a 3D earth model of the overburden and target reservoir zone on the basis of periling data and updated this model in real time on the basis of LWD. The strategy permitted them to check and update the planned drilling trajectory continuously with real time acquired data.
They have quantified the uncertainty in the layer thickness of the “best-estimate” prognosed earth model with the uncertainties in the depth of the markers observed in offset wells. Then they drilled a pilot hole and transmitted to a prototype application across the network. Predicted log response was compared to real-time measured logs, however manual interpretation was required to update the marker locations as the well was drilled.
Zin Che Lah et al., 2000, demonstrates how the use of real time data while drilling technology optimized production and drainage efficiency through the successful drilling of several horizontal wells within complex objectives, increasing the value of a marginal economics field.
- A 40 ft oil column is overlain by a large gas cap and has a moderately active aquifer. Exploration wells analyses confirm that gas coning will result in rapidly decreasing oil production and that a conventional field development would exhibit marginal economics. Multilateral horizontal well architecture was planned to drain the reservoir in order to improve field economics.
- Reservoir simulation defined the optimal horizontal well placement as 6 ft above the OWC, within a ±2 ft tolerance of TVD. Industry survey error models clearly show that this tight geometric control is not achievable using MWD survey data alone and additional techniques are required to control the geometric TVD error.
- An empirical model was developed from offset well data, allowing LWD data to be used to position the wellbore within the oil column. The TVD could then be determined in real time and the well trajectory refined.
- By aid of real time data while drilling technology and the use of a formation model, three laterals of one of the horizontal wells were drilled within ±0.5 ft TVD tolerance and production tests proved the validity of the model.
- The preparation and use of the geological model, as well as the challenges of landing and drilling the horizontal section, were addressed, with particular
14 L. SAPUTELLI, M. ECONOMIDES, M. NIKOLAOU, A. DEMARCHOS, AADE-03-NTCE-12
emphasis on survey error management and steering decision-making.
Discussion
The case histories clearly have significant relevance in field development planning, well construction and reservoir simulation studies:
- Initiatives of real time data collection while drilling have been shown to improve field economics.
- Well construction and trajectory can be met on target despite current MWD and directional drilling limitations. When tight geometric control is not achievable using MWD survey data alone, additional real time techniques are required to control the geometric TVD error.
- To aid the interpretation while drilling and ensure correct positioning of the wellbore, several numerical models had to be built. One formation model was built in order to calculate expected log responses through the formation. A second one was built to calculate the responses due to the fluid column responses.
5.4 Synthetic log response for geometric control
Every project has its own justification for building a synthetic log response model (Zin Che Lah et al., 2000). In general the objectives for geometric control may include:
- To provide synthetic log response as an aid to identify certain markers during the landing of the well, as well as for the drilling of the horizontal section.
- To be able to distinguish fluid from lithology effects on the logs.
- To identify the changes in log character as the wellbore travels through reservoir sands and thereby recognizes the geological position of the wellbore in real-time.
- To identify the log characteristics as the wellbore approaches certain sedimentary streaks (i.e. dolomitic tight streaks in the lower part of a sequence) and then capture this scenario in real time.
- To interpret the final log to obtain a revised geological section with updated formation dip, layer thickness, rock quality and distribution.
- To understand the effects of relative angles between the sensors and the formation boundary and log response.
- To identify and understand the effects of reservoir anisotropy, which are often, encountered in high angle wells, in order not to misinterpret the resistivity curves. Once identified this effects can be remodeled while drilling.
Previous to the drilling of a deviated branch, the
synthetic log response may be calibrated with pilot hole data collection. From a pilot hole lithology model one can construct a very good layer columns model, where the next step is to run a synthetic log response of a tool navigating through those layers. This technique has become fairly standard for geosteering applications and it accounts for the variation of the tool response depending on the relative angle between the sensors and the formation boundary.
For each pair of data of the modeled layer column (vertical depth and relative angle) a modeled log response can be assigned and created to any well trajectory, described as a series of vertical depth and deviation angles. A change in the formation dip alters both the TVD depth within the set of resistivity and the angle between the logging tool and the layer boundary.
6. Next Generation Drilling Process
We present a vision for the next generation drilling process in Figure 15. By combining control theory and continuous oilfield optimization described before in this paper. One can visualize what could happen for example with the daily report, which would only be a “report by exemption” report, and where the drilling engineer will be able to visualize a 24 hrs picture of the daily operations instead of the traditional two pictures taken at 6:00 a.m. and 1:00 p.m.
6.1 Novel reservoir drainage architectures
There have been many visionary proposals about novel reservoir drainage architectures. The most recent one that has been almost fully massified is multilateral well technology. The next step challenges will be to guarantee better wellbore and junction stability, better well accessibility for minimum cost without production sacrificing, downhole separation and minimum footprint.
6.1.1 Multibranched segmented wells
The completion along the production or injection interval should be segmented. Each segment is instrumented to indicate the produced liquid volume from the segment and to detect water production. Hydraulically or electrically powered controls enable production from or injection into the segment to be shut off at any time.
Figure 16 shows branch completion features that provide sufficient reservoir management flexibility.
With sufficient pressure maintenance, the need for artificial lift is minimized or eliminated. Flow from the branches into a common mother bore can be commingled, and a downhole oil-water separator can remove water from the production stream. Produced water could then be pumped back into the same formation in a strategic location.
AADE-03-NTC-12 REAL TIME DECISION MAKING FOR VALUE CREATION WHILE DRILLING AND WELL INTERVENTION 15
6.2 Well completions of the future
Completions will have the same purpose, however they will be capable of delivering the fuel of choice (gas or liquid), or the form of energy of choice (i.e. molecules or electrons).
Some of the aspects on why real-time decision making will play an important role in the well completions of the future, is because they will try to address the following uncertainties:
� Simple vs. complex completions � Fixed completion vs. self adjustable � Disposable vs. reusable � Super completions vs. “fit-for-purposes” � Rig, coiled tubing, wireline or Robotized? � Easy vs. extreme environment � Single well reservoir management � One-trip completions…
6.3 Single-well reservoir management
A multibranch well provides an underground gathering system. When the design includes downhole separation that provides for the production at the surface of desired fluids with reinjection of unwanted ones, the well incorporates an underground production facility.
To achieve these sorts of objectives, the entire system of branches, completions, manifolds, separators, etc., must be in place and operational before the well can begin to produce (Figure 17). The design considerations that would enable this result rely on a modular approach to the problem and provision for contingencies for uncertainties in the reservoir description and in the reliability of the underground system. Ehlig-Economides et al., 2000 outlines the issues that must be considered and provides a framework for the well design process. Conclusions
� Real-time decision-making has traditionally played a fundamental role in well construction and maintenance. Although improvising at the rig site has been the mainstay of the past, the results were not always optimum. This paper lays out an optimal decision-making control strategy that considers the interconnection of reservoir prediction model and real-time data acquisition.
� Poor prediction of project performance is largely due to the lack of opportune information on geological features. This is one of the main reasons for integrating logging while drilling and drilling dynamics into a common 3D earth model space.
� Real-time integration can improve MWD/LDW resolution capabilities, reduce occurrence of major drilling dysfunctions, and improve the overall
efficiency of the well design.
� A model for calculating the project real-time NPV including the information obtained while drilling was presented. This is a crucial task for selecting new well branches, optimum completion configurations, and designing the reservoir stimulation strategy.
� Drilling operation is one-of-a-kind process that can be mapped in the industrial field operations hierarchy. Organizing the drilling operation in a hierarchical way permits optimization of the overall system in a systematic multiplayer/multiscale fashion, which may lead to results that are superior to the aggregate of optimal solutions developed for individual unstructured elements of the system.
� Real-time data update of the geologic model becomes more efficient whenever a previously generated lithological model exists. This permits rapid generation of synthetic log responses, which then, can be “looked-up” while drilling, reducing the interpretation time and affording proper trajectory adjustments while drilling.
� Well completions of the future will require more demanding real-time data assimilation strategies, such as those that may actually learn from ongoing experience and thus self-adjust their actions.
Acknowledgements
We thank Noble Engineering and Development for supporting research in this area.
Nomenclature BHA = Bottomhole assembly BOP = Blowout preventer ECD = Equivalent circulation density EMW = Equivalent mud weight H = Hook Load, [lbs] Ho = Average Hook Load, [lbs] LWD = Logging while drilling NPV = Net present value MWD = Measurement while drilling OWC = Oil Water Contact SCADA = Supervisory Control and Data Acquisition RKB = Rig floor Kelly bushing elevation ROP = Drilling rate of penetration rpm = Revolutions per minute TD = Total depth TVD = True Vertical Depth W = Vertical Force, [lbs] Wo = Force on Bit, [lbs] WOB = Weight on bit � = Downhole total angular velocity, [RPM] �o = Surface angular velocity, [RPM]
16 L. SAPUTELLI, M. ECONOMIDES, M. NIKOLAOU, A. DEMARCHOS, AADE-03-NTCE-12
References 1. Aspen Technology, http://www.aspentech.com.
2. Baker Hughes, http://www.bakerhughes.com.
3. Bequette, B. W., Process Control: Modeling, design and simulation, Prentice Hall, New Jersey (2003).
4. Boyadjieff G., Murray D., Orr A., Porche M., Thompson P., “Design Considerations and Field Performance of an Advanced Automatic Driller”. SPE79827 (2003).
5. Branch J., Andersen K., Lavillonniere J. L., Larsen T., Kremer Y., Capacho G. A.. “Real time well construction monitoring – A case history of Sincor’s Heavy Oil Project”. SPE/IADC 67757. The Netherlands, 2001
6. Dashevskiy D., Dubinsky V., and Macpherson J.D., “Application of Neural Networks for Predictive Control in Drilling Dynamics”. SPE56442. USA, 1999.
7. Ehlig-Economides C. A. and Economides M. J. “Single Well Reservoir Management - the Ultimate Multibranch Well Challenge” SPE59447. Japan, 2000
8. Finch F. E., Stanley G. M. and Fraleigh S. P., “Using the G2 diagnostic assistant for real-time fault diagnosis”. European Conference on Industrial Applications of Knowledge-Based Diagnosis, Italy, 1991.
9. Malinverno A., Andrews B., Bennet N., Bryant I., Prange M., Savundararaj P., Bornemann T., Raw I., Briton D., Peters G., “ Real-Time 3D Earth Model Updating while drilling a Horizontal Well”. SPE77525. USA 2002.
10. Mansure A.J., and Whitlow G.L., Corser G.P., Harmse J., and Wallace R.D., “A Probabilistic Reasoning Tool for Circulation Monitoring Based on Flow Measurements” SPE56634. October 1999
11. Murphy J. “Matching Elegance & Brawn: The Challenges of Smart Well Technology”. April 1999. http://www.oilandgasonline.com/content/news/
12. Nikolaou, M., "Model Predictive Controllers: A Critical
Synthesis of Theory and Industrial Needs", Advances in Chemical Engineering Series, Academic Press (2001).
13. Noble Engineering. http://www.noblened.com.
14. Pollitte, M. D. and Scoble, J. J. “Lithological Interpretation Based on Monitored Drilling Performance Parameters,” The Metal Division of CIML, 1991.
15. Richard T., “Self-Excited Stick-Slip Oscillations of Drag Bits”. PhD Dissertation. University of Minnesota, 2001
16. Saputelli L, Malki H, Canelon J., Nikolaou M. “A critical overview of artificial neural network applications in the context of continuous oil field optimization”. SPE-77703. 2002.
17. Saputelli L., “Front-end-loading metrics on well construction projects”. PDVSA Internal Report. 1999.
18. Saputelli L., Cherian B, Gregoriadis K., Nikolaou M., Oudinot C., Reddy G., Economides M., and Ehlig-Economides C., “Integration of Computer-Aided High-Intensity Design with Reservoir Exploitation of Remote and Offshore Locations”. SPE-64621. 2000.
19. Stanley G.M. “Neural Networks for Fault Diagnosis Based On Model Errors or Data Reconciliation Instrument Society of America, USA, 1993.
20. Varco. http://www.varco.com/
21. Vivas A., Ramírez J., Sánchez M., Lagreca A., Ranson A., Hernández K., Matheus J., Acuña P., De Santana D., “Oportunidades en el uso de datos, información y conocimiento para Optimizar los procesos de Construcción y Rehabilitación de Pozos”. Intevep Internal Report, 2002.
22. Zin Che Lah, Sering L., Abu Bakar A., Sundal E. and Daudey J.. “Real-Time Data Analysis While Drilling Provides Risk Management for Both Geological and Geometric Uncertainties in the Sotong K2.0 Reservoir”. SPE-64477. Australia 2000.
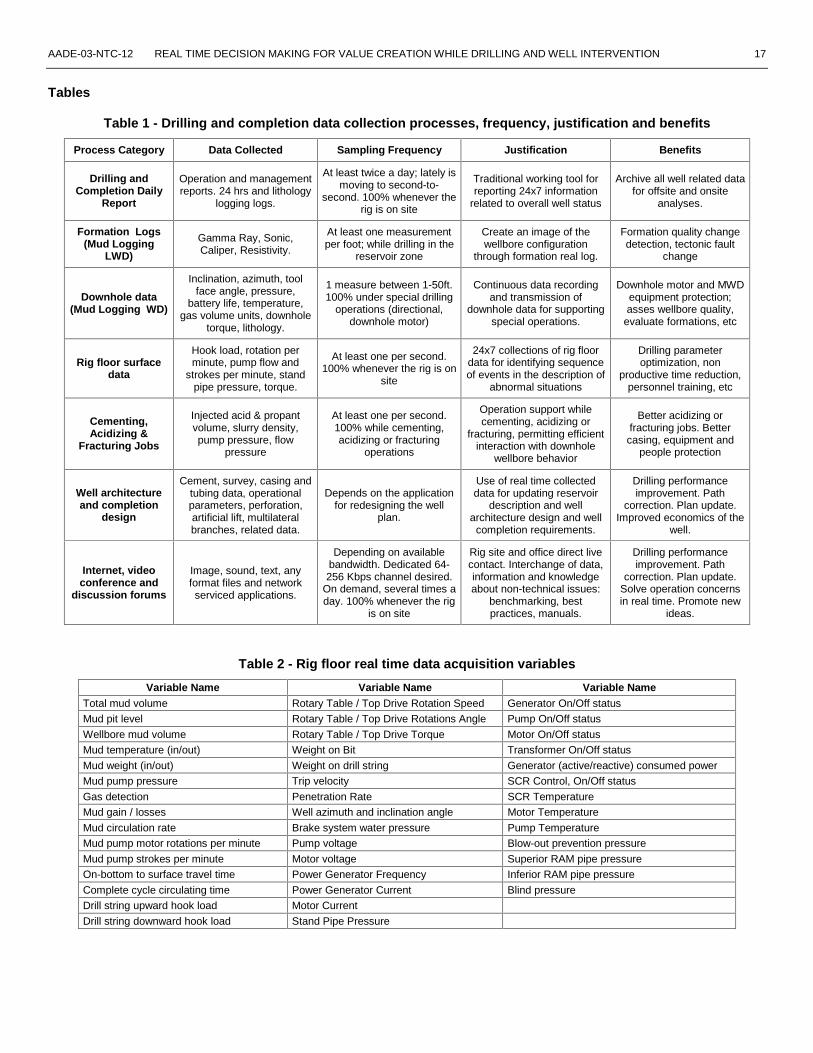
AADE-03-NTC-12 REAL TIME DECISION MAKING FOR VALUE CREATION WHILE DRILLING AND WELL INTERVENTION 17
Tables
Table 1 - Drilling and completion data collection processes, frequency, justification and benefits
Process Category Data Collected Sampling Frequency Justification Benefits
Drilling and Completion Daily
Report
Operation and management reports. 24 hrs and lithology
logging logs.
At least twice a day; lately is moving to second-to-
second. 100% whenever the rig is on site
Traditional working tool for reporting 24x7 information
related to overall well status
Archive all well related data for offsite and onsite
analyses.
Formation Logs (Mud Logging
LWD)
Gamma Ray, Sonic, Caliper, Resistivity.
At least one measurement per foot; while drilling in the
reservoir zone
Create an image of the wellbore configuration
through formation real log.
Formation quality change detection, tectonic fault
change
Downhole data (Mud Logging WD)
Inclination, azimuth, tool face angle, pressure,
battery life, temperature, gas volume units, downhole
torque, lithology.
1 measure between 1-50ft. 100% under special drilling
operations (directional, downhole motor)
Continuous data recording and transmission of
downhole data for supporting special operations.
Downhole motor and MWD equipment protection; asses wellbore quality,
evaluate formations, etc
Rig floor surface data
Hook load, rotation per minute, pump flow and
strokes per minute, stand pipe pressure, torque.
At least one per second. 100% whenever the rig is on
site
24x7 collections of rig floor data for identifying sequence of events in the description of
abnormal situations
Drilling parameter optimization, non
productive time reduction, personnel training, etc
Cementing, Acidizing &
Fracturing Jobs
Injected acid & propant volume, slurry density, pump pressure, flow
pressure
At least one per second. 100% while cementing, acidizing or fracturing
operations
Operation support while cementing, acidizing or
fracturing, permitting efficient interaction with downhole
wellbore behavior
Better acidizing or fracturing jobs. Better casing, equipment and
people protection
Well architecture and completion
design
Cement, survey, casing and tubing data, operational parameters, perforation, artificial lift, multilateral branches, related data.
Depends on the application for redesigning the well
plan.
Use of real time collected data for updating reservoir
description and well architecture design and well
completion requirements.
Drilling performance improvement. Path
correction. Plan update. Improved economics of the
well.
Internet, video conference and
discussion forums
Image, sound, text, any format files and network serviced applications.
Depending on available bandwidth. Dedicated 64-256 Kbps channel desired.
On demand, several times a day. 100% whenever the rig
is on site
Rig site and office direct live contact. Interchange of data, information and knowledge about non-technical issues:
benchmarking, best practices, manuals.
Drilling performance improvement. Path
correction. Plan update. Solve operation concerns in real time. Promote new
ideas.
Table 2 - Rig floor real time data acquisition variables
Variable Name Variable Name Variable Name Total mud volume Rotary Table / Top Drive Rotation Speed Generator On/Off status
Mud pit level Rotary Table / Top Drive Rotations Angle Pump On/Off status
Wellbore mud volume Rotary Table / Top Drive Torque Motor On/Off status
Mud temperature (in/out) Weight on Bit Transformer On/Off status
Mud weight (in/out) Weight on drill string Generator (active/reactive) consumed power
Mud pump pressure Trip velocity SCR Control, On/Off status
Gas detection Penetration Rate SCR Temperature
Mud gain / losses Well azimuth and inclination angle Motor Temperature
Mud circulation rate Brake system water pressure Pump Temperature
Mud pump motor rotations per minute Pump voltage Blow-out prevention pressure
Mud pump strokes per minute Motor voltage Superior RAM pipe pressure
On-bottom to surface travel time Power Generator Frequency Inferior RAM pipe pressure
Complete cycle circulating time Power Generator Current Blind pressure
Drill string upward hook load Motor Current
Drill string downward hook load Stand Pipe Pressure
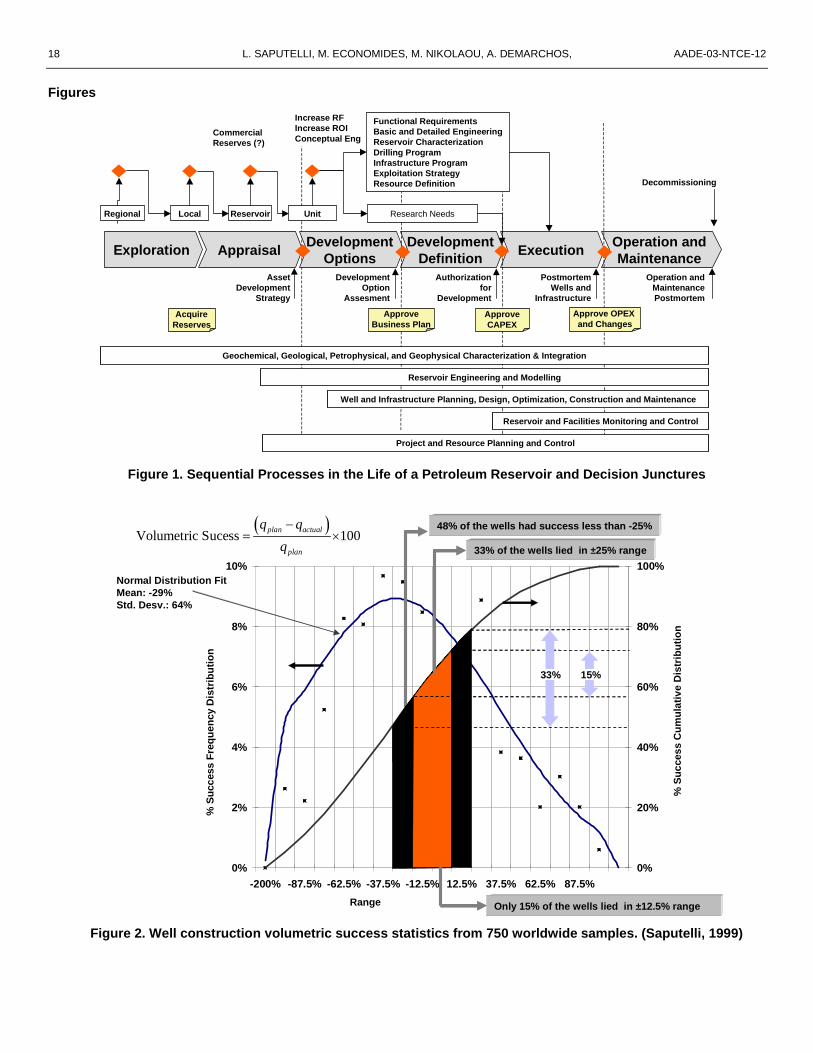
18 L. SAPUTELLI, M. ECONOMIDES, M. NIKOLAOU, A. DEMARCHOS, AADE-03-NTCE-12
Figures
AssetDevelopment
Strategy
DevelopmentOption
Assesment
Operation andMaintenancePostmortem
Authorizationfor
Development
PostmortemWells and
Infrastructure
AppraisalDevelopment
OptionsDevelopment
DefinitionExecution
Operation andMaintenance
Exploration
Local Reservoir UnitRegional
CommercialReserves (?)
Increase RFIncrease ROIConceptual Eng
AcquireReserves
ApproveBusiness Plan
ApproveCAPEX
Approve OPEX and Changes
Decommissioning
Research Needs
Functional RequirementsBasic and Detailed EngineeringReservoir CharacterizationDrilling ProgramInfrastructure ProgramExploitation StrategyResource Definition
Geochemical, Geological, Petrophysical, and Geophysical Characterization & Integration
Reservoir Engineering and Modelling
Well and Infrastructure Planning, Design, Optimization, Construction and Maintenance
Reservoir and Facilities Monitoring and Control
Project and Resource Planning and Control
Figure 1. Sequential Processes in the Life of a Petroleum Reservoir and Decision Junctures
0%
2%
4%
6%
8%
10%
-200% -87.5% -62.5% -37.5% -12.5% 12.5% 37.5% 62.5% 87.5%0%
20%
40%
60%
80%
100%
48% of the wells had success less than -25%
Only 15% of the wells lied in ±12.5% range
33% of the wells lied in ±25% range
Normal Distribution FitMean: -29%Std. Desv.: 64%
Range
% S
ucc
ess
Cu
mu
lati
ve D
istr
ibu
tio
n
% S
ucc
ess
Fre
qu
ency
Dis
trib
uti
on
33% 15%
� �Volumetric Sucess 100
plan actual
plan
q q
q
�� �
Figure 2. Well construction volumetric success statistics from 750 worldwide samples. (Saputelli, 1999)

AADE-03-NTC-12 REAL TIME DECISION MAKING FOR VALUE CREATION WHILE DRILLING AND WELL INTERVENTION 19
33%
12% 12%9% 9% 7% 7% 7% 5%
WellInstability
Circulation Losses
Cementing OperationalProblems
InadequateCompletion
StimulationRock& Fluid
Characterization
SandingFormationDamage
Fracturing
0% 10% 20% 30% 40% 50% 60%
Operational DrillingDisfunction
ReservoirUncertainty 57%
43%
Figure 3 – Volumetric success deviation causes grouped by individual jobs and by class type.
Well
Solid Control Equipment
MudPump
RotatingHeadBOP
StandPipe
Hoist
TopDrive
Figure 4 – Rotary Drilling Process Overview

20 L. SAPUTELLI, M. ECONOMIDES, M. NIKOLAOU, A. DEMARCHOS, AADE-03-NTCE-12
Figure 5 – Process Control Diagram Feedback path signals
System:Reservoir, Wells &Surface Facilities
DatabaseParameters
Check ConditionApplications
Implementation
Well Model
Reservoir Model
BusinessModel
SurfaceModel
DataCollection
ExploitationOptions
Business Constraints
DecisionMaking
Optimization
12
3
4
5
6
7
8
9
Figure 6 - Ideal cycle of optimization of the hydrocarbon producing system.

AADE-03-NTC-12 REAL TIME DECISION MAKING FOR VALUE CREATION WHILE DRILLING AND WELL INTERVENTION 21
(a)
Business Headquarters
Capacity Planning Design [months/years]
Operational Planning [months/years]
Scheduling [days/months]
Supervisory Control [minutes/hours]
Regulatory Control [sec/minutes]
Well & Surface facilities
-Flow, pressure and temperature in wells and separator-Fuel injection to produce heat out of a boiler
-SCADA systems for coordinating flow stations and pipelines-Gas distribution/optimization on a pipeline network-Monitoring wellheads, multiples and flow stations
-Scheduling of injection/production plan and resources-Opening and closing wells or partial completions-Adjusting well operating parameters
-Planning of injection/production plan and resources-Planning drilling and workover resources-Supply Chain Management & Market and customer demands
-Asset life cycle and installed based maintenance or growth-Supply Chain Management & Market and customer demands
b)
Regulatory Control
Supervisory Control
Planning & Scheduling
Rotary Position ControlHoist & Brake ControlTorque ControlAutomatic Choke Control
Rotary Optimization & Control Rate of Penetration OptimizationLoss of Circulation Optimization & Control
Well Location PlanMud Weight PlanBit Plan
Lithology while DrillingDownhole SurveysTorque, WOB, ROP, Pressures
Rig Floor Set pointsRotary LimitsHoist Break Limits
Well Plan
Figure 7 – (a) Oilfield Field Operations Hierarchy and (b) Drilling Operations Hierarchy
DrillingEquipment &
Wellbore Dynamics
Rig SiteController
Disturbances
+
+
WOBRPMSPP
Lithology & Top Markers / Well Data
-
+Drilled Hole
Downhole Data, WOB, RPM, Torque, Pressure
Architecture & Completion
Requirements
Reservoir& Geologic
Model Update
Functional Requirements & Production
Targets
Create or Review Well
Design
Set Environmental
Variables
Initial Static & Dynamic Reservoir
Model
Start
After Boyadjieff 2003
Figure 8 – Rig floor process interaction close-loops hoist, pump, rotary control and earth model.

22 L. SAPUTELLI, M. ECONOMIDES, M. NIKOLAOU, A. DEMARCHOS, AADE-03-NTCE-12
8
Inje
ctio
n R
ate
Bo
tto
mh
ole
Pre
ssu
re
Shut-inFlowback
Pressure
Sec
on
dIn
ject
ion
Cyc
le
Fir
stIn
ject
ion
Cyc
le
12
34
5
6
7
1- Formation Breakdown
2- Propagation
3- Instantaneous Shut-In
4- Closure Pressure From Fall-Off
5- Reopening
6- Closure PressureFrom Flowback
7- Asymptotic Reservoir Pressure
8- Closure Pressure From Rebound
Clock Time
Figure 9 – Hydraulic Fracturing Characteristic Pressure Response Curve
Non productiveTime reduction
OptimizeFluid
Properties
Optimize WellboreHydraulic
Abnormal Situations:Circulation LossesPipeline BreaksInflow KicksWellbore Cleaning
Optimization
Management
Control and Diagnosis
Monitoring
Instrumentation
ECDManagement
WellboreIntegrity
FractureGradient
Swab and Surge
PorePressure
PressureWhile drilling
Stand PipePressure
Mud PitVolume
DirectionalSurvey
TemperatureWhile drilling
Temperature
DownholeFluid Rheology
Tripping Time
ViscosityDensity
FlowIn and Out
100% Volumetric Success Rate
Safety, HealthEnvironmentalPerformance
OptimizePenetration
Rate
Optimize WellEconomic
Value
Control
LithologyWhile Drilling
SeismicWhile Drilling
Low LevelController
OperationalData Base
Rig DataVisualization
AbnormalSituation
Management
Rig Equipment
ECD Estimation
Trajectory Calculation
3D GeologyVisualization
UpdateGeologicalChanges
Update WellProductivity
Changes
Update WellCompletionChanges
Optimize Well
Design
Optimize Well
Economics
Optimize Well
Trajectory
Near WellboreModeling
NodalAnalysis
Measurement & Logging while DrillingRig Surface Sensors
RotaryDrive
MudPumps
Hoist &Break
BOP’s VariableChokes
SteeringBHA
Figure 10 - Integrated real-time decision driven optimal control strategy

AADE-03-NTC-12 REAL TIME DECISION MAKING FOR VALUE CREATION WHILE DRILLING AND WELL INTERVENTION 23
Non productiveTime reduction
Drilling Time
FluidProperties
FluidHydraulic
CirculationLoss
Optimization
Management
Control and Diagnosis
Monitoring
Instrumentation
State-of-the-Art
InflowKicks
PipelineBreaks
ECDManagement
WellboreCleaning
WellboreIntegrity
LOT BallooningBreathing
FractureGradient
Swab and SurgeECD Estimation
FlowRates
PorePressure
HydraulicMaps
CirculationLoss
PressureWhile drilling
Stand PipePressure
Mud PitVolume
DirectionalSurvey
TemperatureWhile drilling TemperatureDownhole
Fluid RheologyTripping
TimeViscosityDensity
FlowIn and Out
Currentlyavailable
for downhole conditions
Currentlyavailable
for surface conditions
Currently planned for development
Opportunityfor
development
Figure 11 – Real-time hydraulics management (automation pyramid) multilevel approach (after Vivas et al., 2002)
Rock and FluidProperty Maps
2- Well Analysis and Nodal Analysis
Production Graphs
Surface CapacityAnalysis
CrossSections
Reserves and Decline Curves
Preliminary OpportunityIdentification
Operational Automation &
Reliability Analysis
PreliminaryCandidate
Selection Plan
1- Integral Reservoir Analysis
WellFile
BuildupTests
WellLogs
ProductionLogging
ReserveRevision
InjectionProduction
WellCompletion
3- Well and Drainage Area Analysis
ReservoirPerformance
Drainage Area& Completion
TubingPerform.
ArtificialLift
q (STB/D)
-
Pr
Water & Gas Control Injection/Production
SurfaceNetwork
Optimal ConditionsFor Well and Completion
Pressure Maintenance
&Conformance
Project
Open n-zoneStimulation
Re-perforationFrac & Pack
RemoveSolids,ChangeTubing
ChangeMethod,Optimize
&Combine
Polymer, Gels, Emulsions, Silicates,Particls, Horz. wells,
Change Zones,Squeeze Jobs.
ChangeLines,Bottle-
necking,Optimize
Select Integral solution to optimize productivity
4- Integral Solution Portfolio Economic Analysis Tied to Reservoir Exploitation Plan
ProjectManagement
CostManagement
Action PlanRecommendation
RiskAnalysis
EconomicAnalysis
5- Execute Action Plan
Gas Control
Water Control
Sand Control
Solid Control
ArtificialLift
SurfaceNetwork
Fracturing Acid Stimulation
Re-Perforating
6- Monitoring and Review Plan
ReviewObjectives
ReviewPortfolio
Revised Action PlanRecommendation
AcquireData
OptimizePlan
Figure 12 – Integrated productivity analysis for well intervention decision making

24 L. SAPUTELLI, M. ECONOMIDES, M. NIKOLAOU, A. DEMARCHOS, AADE-03-NTCE-12
Figure 13 – Collaborative Well Planning and Construction (After Branch et al., 2001)
Drilling Engineer creates well & defines general data- Rig & Well Type- Estimated Times- AFE
Drilling Engineer creates well & defines general data- Rig & Well Type- Estimated Times- AFE
Geoscience enters data for:-Formation tops-Targets-Log/Survey program
Geoscience enters data for:-Formation tops-Targets-Log/Survey program
Drilling Engineer defines:- Casing points- Centralization programs- General drilling procedures
Drilling Engineer defines:- Casing points- Centralization programs- General drilling procedures
Directional Engineer enters data:- Build Rates, Landing point, TD- Casing & formations MD’s- BHA’s & drilling parameters
Directional Engineer enters data:- Build Rates, Landing point, TD- Casing & formations MD’s- BHA’s & drilling parameters
Mud & Cementing Eng. define:- Mud properties, rheology & volumes- Mud procedures- Cement plugs volumes & procedures
Mud & Cementing Eng. define:- Mud properties, rheology & volumes- Mud procedures- Cement plugs volumes & procedures
Any changes
in Program ?
Any changes
in Program ?
Drilling Programready for approvalDrilling Program
ready for approvalNo
Yes
StartStart
Figure 14 – Information Flow for Collaborative Well Planning (After Branch et al., 2001)

AADE-03-NTC-12 REAL TIME DECISION MAKING FOR VALUE CREATION WHILE DRILLING AND WELL INTERVENTION 25
Weight on BitOptimization
Weight on BitOptimization Trend AnalysisTrend Analysis
OperationalDatabase
OperationalDatabase
Sensors & 3rd Party Systems
AbnormalSituation
Management
AbnormalSituation
Management
Well TrajectoryControl
Well TrajectoryControl
Well Control
Daily Report
Smart Drilling
DiagnosticMud LoggingMud Logging
AutomatedOperations
Expandable Tubular
Expandable Tubular
E-wellbore& RoboticsE-wellbore& Robotics
ECD Control& Multigradient
Next Generation
Support
DIMS
MWD, LWD, Open hole Logs
Finder
DataAnalyzer
AdvancedDesign
DynamicModel Physical
Model
Well Design
Wireless GUI Online
Driller’s Planning
StaticModel
BusinessRequirements
Drilling Operations
Well Plan
WellDesigned
Front-End-Loading
Rig site
PathCorrected
EventsDetected
Figure 15 – Next Generation Drilling Process showing close loop interactions. (This work, 2003)
Crossover Valve
Sliding Sleeve
Gradioventuri Flowmeter
Crossover Valve
Sliding Sleeve
Gradioventuri Flowmeter
PositionController
FlowControlVales
V3
V2
V1
V4
$
7
$
7
$
7
$
7
6�
6�
6�
6�
6�
6�
6�
6�
PilotLine
ReturnLines
9S�
9S�
9S�
9S�
6��
6� 6��
6��
PositionController
FlowControlVales
V3
V2
V1
V4
$
7
$
7
$
7
$
7
6�
6�
6�
6�
6�
6�
6�
6�
PilotLine
ReturnLines
9S�
9S�
9S�
9S�
6��
6� 6��
6��
PositionController
FlowControlVales
V3
V2
V1
V4
$
7
$
7
$
7
$
7
$
7
$
7
$
7
$
7
6�
6�
6�
6�
6�
6�
6�
6�
PilotLine
ReturnLines
9S�
9S�
9S�
9S�
6��
6� 6��
6��
Figure 16. Features of the branch completion
Downhole Separator with Injection Branch
Mother Bores7 Branches
Sea Bed
Downhole Separator with Injection Branch
Mother Bores7 Branches
Sea Bed
Nested Level 6 Junctions
Figure 17. Single well reservoir management. (Economides, 2002)