aade-05-ntce-76 hydrostatic and water hammer …-+williamson...aade-05-ntce-76 hydrostatic and water...
TRANSCRIPT
This paper was prepared for presentation at the AADE 2005 National Technical Conference and Exhibition, held at the Wyndam Greenspoint in Houston, Texas, April 5-7, 2005. This conference was sponsored by the Houston Chapter of the American Association of Drilling Engineers. The information presented in this paper does not reflect any position, claim or endorsement made or implied by the American Association of Drilling Engineers, their officers or members. Questions concerning the content of this paper should be directed to the individuals listed as author/s of this work.
Abstract
The development of 5th generation offshore drilling rigs required increasing the supply pressure to subsea pods from the traditional 3,000 psi to 5,000 psi. This 2,000 psi pressure increase improved pressure as required, but also imparted greater stress factors to the components of the control systems and BOP stack. One example of the problems associated with these stress factors has been the failure of hoses and piping due to the effect of water hammer.
The problems associated with the 2,000 psi increase in supply pressure were compounded as drilling operations moved to increasingly deeper waters. One component of water hammer often overlooked by designers is negative pressure spikes, which in effect forces components to contend with a negative pressure. The effects of negative pressure spikes are more profound in deeper water depths, so some of these potential problems were obscured if the deepwater rig was restricted to operations in shallow water.
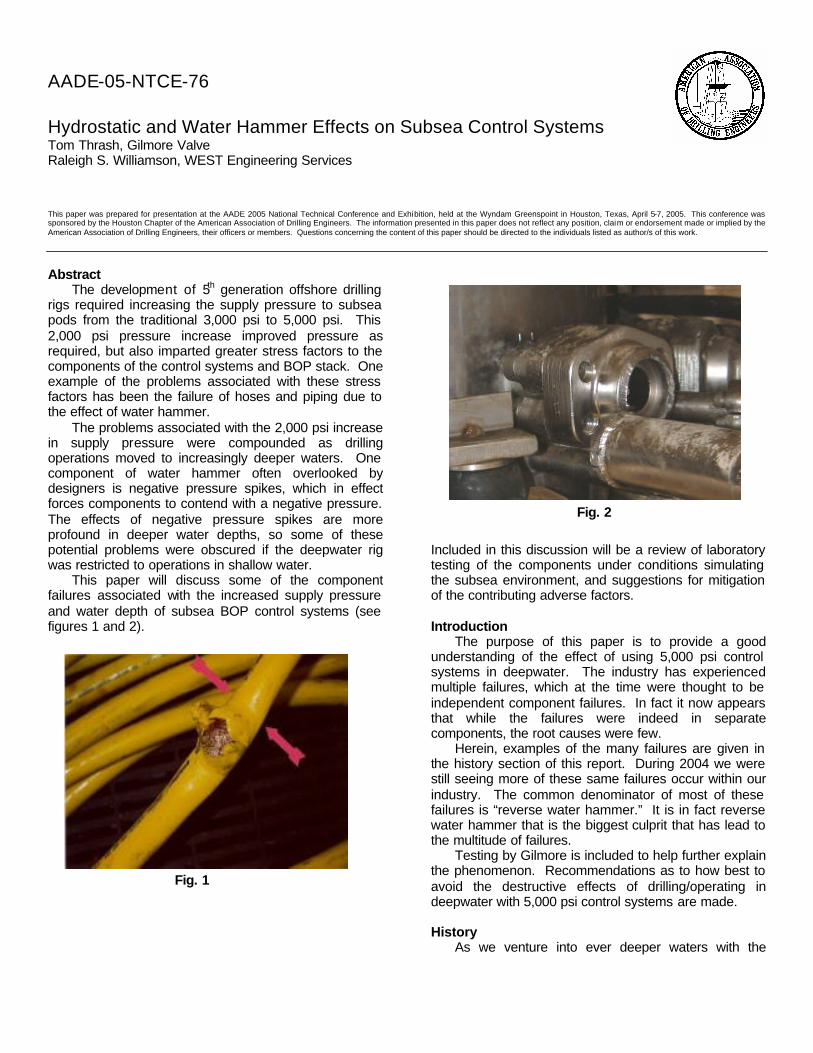
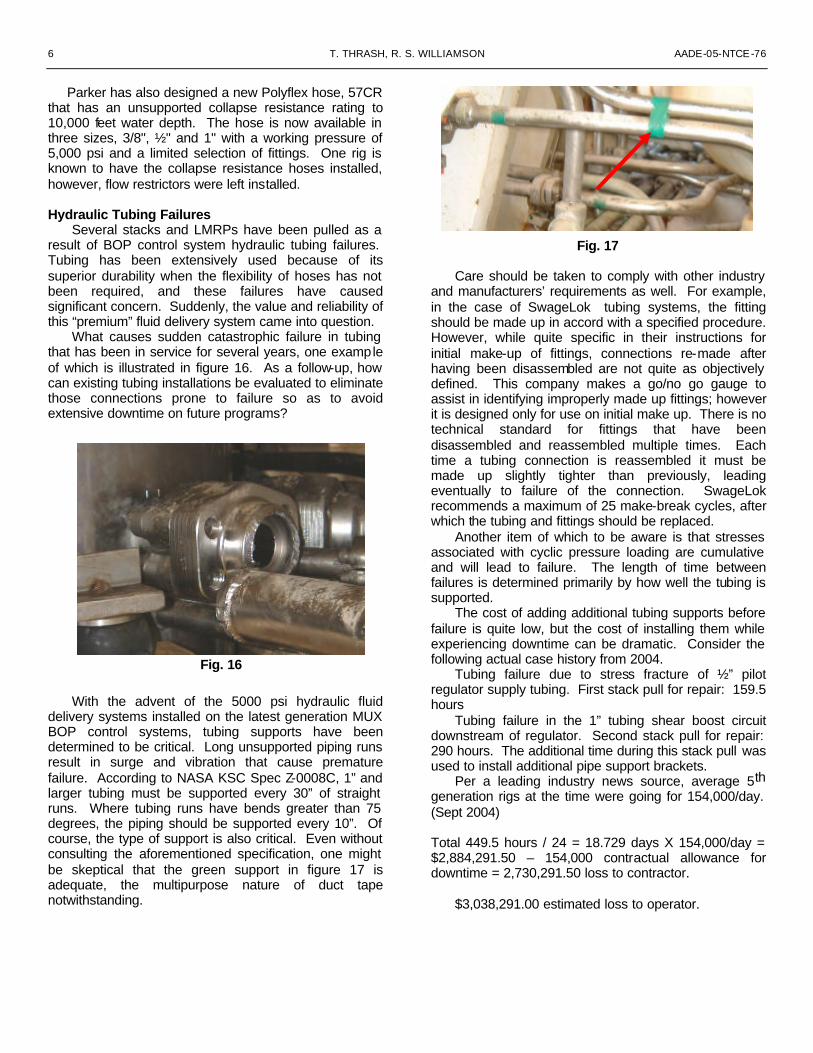
This paper will discuss some of the component failures associated with the increased supply pressure and water depth of subsea BOP control systems (see figures 1 and 2).
Included in this discussion will be a review of laboratory testing of the components under conditions simulating the subsea environment, and suggestions for mitigation of the contributing adverse factors. Introduction
The purpose of this paper is to provide a good understanding of the effect of using 5,000 psi control systems in deepwater. The industry has experienced multiple failures, which at the time were thought to be independent component failures. In fact it now appears that while the failures were indeed in separate components, the root causes were few.
Herein, examples of the many failures are given in the history section of this report. During 2004 we were still seeing more of these same failures occur within our industry. The common denominator of most of these failures is “reverse water hammer.” It is in fact reverse water hammer that is the biggest culprit that has lead to the multitude of failures.
Testing by Gilmore is included to help further explain the phenomenon. Recommendations as to how best to avoid the destructive effects of drilling/operating in deepwater with 5,000 psi control systems are made.
History
As we venture into ever deeper waters with the
AADE-05-NTCE-76
Hydrostatic and Water Hammer Effects on Subsea Control Systems Tom Thrash, Gilmore Valve Raleigh S. Williamson, WEST Engineering Services
Fig. 1
Fig. 2

2 T. THRASH, R. S. WILLIAMSON AADE-05-NTCE-76
5,000 psi control systems, there are two things that are different. The deeper water imparts as much as 5,000 psi external pressure upon the BOP equipment and controls, while the increased velocity of the control fluid results in water hammer. Together they work to create situations that result in reverse water hammer. For every positive pressure spike there is a corresponding negative pressure spike, which can be most destructive to controls equipment and materials.
WEST has witnessed a series of control related
problems that has detrimentally affected reliability of 5,000 psi control systems in deepwater. Areas where WEST has documented problems include:
• Severe vibration in Cameron MUX control circuit • Failure of Shaffer 5K to 3K regulators • Failure of Shaffer Shear Ram SPM Valves • Failure of Shaffer DDVs • Gilmore shuttle valve oscillating • Function Hose failures • Hydraulic tubing failures • Backed Out Fasteners
Severe Vibration in Cameron MUX Control Circuit for Riser Connector Secondary Unlock
During BOP control pod function tests, abnormally severe vibration in the riser connector secondary control circuit occurred. With secondary unlock pressure applied to mini collets and riser connector, abnormally severe vibration in the control circuit prompted termination of the function test until the problem could be located and corrected.
No clear solution was found for this problem, although the circuit was modified due to slow operation when using the secondary unlatch. The modification included replacing the ¼" secondary unlatch circuit with
a ¾" circuit. The mini collet connectors were also removed from the circuit and provided with a separate circuit. The modifications alleviated the problem, as there have been no additional reports of vibration. Failure of Shaffer 5K to 3K regulators
Other issues involved damage to the step down regulator. Reference Shaffer® Customer Product Notification CN-018 Recommended System Operation: "Soft Pod Shift".
Both the yellow and blue pod 5K to 3K regulators for the high-pressure shear ram circuit failed. Damaged seal carriers were the cause. An upgrade kit was developed that consisted of changes in the design of the vent assembly from the poppet style to a metal sliding seal. Reference Shaffer® CS01-001fs - Main Supply Regulator.
Failure of Shaffer® Shear Ram SPM Valve
Shaffer® uses a 3,500 psi boost circuit on the shear ram close function when the intention is to shear pipe. On several occasions, it was found that failures occurred in the high-pressure shear circuit. The failures ranged from tubing connection separation to SPM cage compression and seal destruction and appeared to occur mostly during surface testing. A soft pod shift procedure was developed that consisted of isolating the stack-mounted bottles, closing the supply valve at the manifold and then selecting the alternate pod. Additionally, the high-pressure shear SPM valve was moved to a different location within the pod and a surge accumulator added to the circuit.
Fig. 3 - The secondary unlock piston is shown.
Fig. 4 - Damaged seal carrier from the 5K to 3K manual regulators. The regulator is from the HP
shear ram circuit.

AADE-05-NTCE-76 Hydrostatic and Water Hammer Effects on Subsea Control Systems 3
Shaffer® released a Customer Product Notification to
address the SPM problem. Reference Shaffer CN-003 4th Generation Multiplex Pod.
The soft shift procedure alleviated many of the water hammer problems, and has been adopted to some degree by many rigs, regardless of the control system manufacturer.
Gilmore Shuttle Valves Oscillating Gilmore Mark III shuttle valves (Figure 8) have been
subject to severe high frequency oscillation on the vent side of the function. This can be controlled with proper valve selection and other techniques.
Oscillation and/or switchback of the "venting" shuttle
have been observed on several rigs. While oscillation (if severe) may lead to the destruction of equipment, switchback merely changes the position of the shuttle near the end of flow.
Switchback can create significant problems if it occurs on a function that has ROV intervention. Depending on the circuit design, if the valve shifts to the wrong position exhaust fluid would either be completely blocked, preventing operation of the function, or have to vent through the reduced flow path of the ROV port. On one rig, almost five minutes was required to open a ram after a function test. It is recommended to install a Pressure Biased Shuttle (figure 9) on all ROV connections to eliminate this hazard.
An interesting phenomenon was found to occur in
the Mark III shuttle valve and could occur in valves by other manufacturers as well. During high flow rate venting the flow path through the valve creates a low-pressure area on one side of the shuttle, causing the shuttle to jump to that position. A low-pressure area
Fig. 5 - 1” SPM Valve
Fig. 6 - SPM valve cages
Fig. 7 - Damaged seals
Fig. 8 – Gilmore Mark III Shuttle Valve
Fig. 9 – Pressure Bias Shuttle Valve

4 T. THRASH, R. S. WILLIAMSON AADE-05-NTCE-76
then forms on the opposite side of the shuttle. The shuttle can hammer back and forth (oscillate) many times per second during high flow. The result of the oscillation is broken piping, burst hoses, loosened fasteners and damage to the valve. The phenomenon has been known to occur only on the vent side of the function and can occur on all size shuttle valves. This problem has been duplicated in a hyperbaric chamber for the 1" valve.
Gilmore released a product bulletin on December 15, 2000 entitled Gilmore "HD" Style Shuttle Valves to introduce the Mark III High Drag (HD). The HD (figure 10) is designed with an O-ring on only one side to provide frictional resistance to the change in direction. The O-ring is positioned out of the flow path and is always "fully contained between the shuttle and the adapter" so that fluid flow does not wash out the O-ring. The HD shuttle valve resisted, but did not completely stop, oscillation.
Gilmore Valve Co. released a new MK III “Dampened Shuttle” in early 2003. This shuttle (figure 11) is recommended on functions that are known, or suspected to have sudden starts or stops, or circuits with high risk of water-hammer. The “dampened” shuttle has been thoroughly tested and will resist oscillation from water-hammer pressure waves. These shuttles also resist switchback. A close tolerance sleeve that encompasses the body of the shuttle creates the dampening. As the shuttle moves into position, fluid must be expelled between the body and the sleeve, which causes the shuttle to slow down dramatically. When the shuttle starts to move to the other position, fluid must be drawn through the same restricted area, again causing the shuttle to move slowly. See figure 11 to right.
Function Hose Failures
Premature failures have been experienced on function hoses of all manufacture, including Parker Polyflex and Hydrasun. High flow rates associated with 5,000 psi control systems were believed to be the primary cause of the failures and was partially to blame, but reverse water hammer also played a key role. The problems have largely been resolved by the installation of flow restrictors and dampened shuttle valves.
One rig, drilling in 6,400 feet of water, suffered downtime due to premature hose failures on various functions. Manufacturer representatives came to the rig, and the entire stack was re-hosed with new hose using the correct fittings and ensuring that minimum bend radius restrictions were not exceeded. This did not solve the problem as failures were again experienced on the first test after running the stack. When the stack was landed, a good well-bore test from the yellow pod was achieved. A function test from the blue pod was then attempted, but the hoses on the first three functions ruptured. The yellow pod was again selected and the hose blew out on the first function operated, even though that function had been successfully operated shortly before. The stack was pulled and the hoses were inspected. Several hoses that had not ruptured had a
Fig. 10 - The piston of the new Gilmore HDHI shuttle valve. The arrow points to the O-ring that provides the drag when
the valve changes direction.
Fig. 11 – Mark III “Dampened Shuttle”
Close Tolerance Sleeve
Shroud creates a hydraulic dampening chamber

AADE-05-NTCE-76 Hydrostatic and Water Hammer Effects on Subsea Control Systems 5
flattened appearance as though crushed by hydrostatic pressure. The stack was re-plumbed with hard pipe and 1" tubing in an unsuccessful attempt to eliminate downtime. The piping also failed.
There are several explanations why the hoses collapse:
1. High Flow rates and sudden starts & stops 2. Pressure spikes shifting shuttle valves 3. Negative water hammer spikes (affected by
deepwater hydrostatic pressure). The failures usually occur in a turn or close to a
fitting. In those cases where the hose failed near the fitting, the pressure drop may be due to an increase in the internal diameter where the fitting ends inside the hose, see figure 12 below. When high flow travels through the fitting and into the larger diameter hose, the sudden and substantial increase in diameter causes a local pressure drop that may be sufficient to flatten the hose.
Upon further testing, the collapse of the hose along
its length was theorized to occur when the function associated with the hose was vented. As the function reaches full stroke it abruptly stops, the fluid continues to move which creates a brief drop in pressure inside the hose during which time the external hydrostatic pressure can then crush the hose.
Tests conducted in October 2000 revealed that hydraulic hoses might collapse at approximately 50% of the manufacturer's claims.
Hose failures have also occurred in smaller hoses. The ½" jumper hose for the yellow pod upper outer kill valve open function between the pod wedge and shuttle valve failed in the same means as the larger diameter hose. Most problems are associated with high-pressure control systems with 5,000 psi supply pressure.
Frequent inspection of the BOP hoses should be
performed and damaged hoses removed from service. In order to lessen the high flow rate problem, ½" and 1" hose adapters were replaced with adapters having restricted bores. The standard bores and restricted bores are: ½" hose adapter - 0.391" / 0.188" (figure 15); 1" hose adapter - 0.844" / 0.375". These restrictors do not appear to have a recordable effect on response time. Reference WEST ITP #1 BOP Stack Hoses.
Fig. 12 - As the fluid rushes out of the fitting and the internal diameter suddenly increases, the
velocity of the moving fluid is too great for it to fill the larger diameter directly after the fitting. This creates a localized pressure drop. High external hydrostatic pressure can then act to
crush the hose.
Fig. 13 – Parker hose collapsed.
Fig. 14 - Parker hose ruptured.
Fig. 15 - ½” hose adapters. The 0.188” restricted bore adapter is on the left and the
standard bore adapter of 0.391” is on the right.
6 T. THRASH, R. S. WILLIAMSON AADE-05-NTCE-76
Parker has also designed a new Polyflex hose, 57CR that has an unsupported collapse resistance rating to 10,000 feet water depth. The hose is now available in three sizes, 3/8", ½" and 1" with a working pressure of 5,000 psi and a limited selection of fittings. One rig is known to have the collapse resistance hoses installed, however, flow restrictors were left installed.
Hydraulic Tubing Failures
Several stacks and LMRPs have been pulled as a result of BOP control system hydraulic tubing failures. Tubing has been extensively used because of its superior durability when the flexibility of hoses has not been required, and these failures have caused significant concern. Suddenly, the value and reliability of this “premium” fluid delivery system came into question.
What causes sudden catastrophic failure in tubing that has been in service for several years, one example of which is illustrated in figure 16. As a follow-up, how can existing tubing installations be evaluated to eliminate those connections prone to failure so as to avoid extensive downtime on future programs?
With the advent of the 5000 psi hydraulic fluid
delivery systems installed on the latest generation MUX BOP control systems, tubing supports have been determined to be critical. Long unsupported piping runs result in surge and vibration that cause premature failure. According to NASA KSC Spec Z-0008C, 1” and larger tubing must be supported every 30” of straight runs. Where tubing runs have bends greater than 75 degrees, the piping should be supported every 10”. Of course, the type of support is also critical. Even without consulting the aforementioned specification, one might be skeptical that the green support in figure 17 is adequate, the multipurpose nature of duct tape notwithstanding.
Care should be taken to comply with other industry and manufacturers’ requirements as well. For example, in the case of SwageLok tubing systems, the fitting should be made up in accord with a specified procedure. However, while quite specific in their instructions for initial make-up of fittings, connections re-made after having been disassembled are not quite as objectively defined. This company makes a go/no go gauge to assist in identifying improperly made up fittings; however it is designed only for use on initial make up. There is no technical standard for fittings that have been disassembled and reassembled multiple times. Each time a tubing connection is reassembled it must be made up slightly tighter than previously, leading eventually to failure of the connection. SwageLok recommends a maximum of 25 make-break cycles, after which the tubing and fittings should be replaced.
Another item of which to be aware is that stresses associated with cyclic pressure loading are cumulative and will lead to failure. The length of time between failures is determined primarily by how well the tubing is supported.
The cost of adding additional tubing supports before failure is quite low, but the cost of installing them while experiencing downtime can be dramatic. Consider the following actual case history from 2004.
Tubing failure due to stress fracture of ½” pilot regulator supply tubing. First stack pull for repair: 159.5 hours
Tubing failure in the 1” tubing shear boost circuit downstream of regulator. Second stack pull for repair: 290 hours. The additional time during this stack pull was used to install additional pipe support brackets.
Per a leading industry news source, average 5th generation rigs at the time were going for 154,000/day. (Sept 2004) Total 449.5 hours / 24 = 18.729 days X 154,000/day = $2,884,291.50 – 154,000 contractual allowance for downtime = 2,730,291.50 loss to contractor.
$3,038,291.00 estimated loss to operator.
Fig. 16
Fig. 17

AADE-05-NTCE-76 Hydrostatic and Water Hammer Effects on Subsea Control Systems 7
Backed-Out Fasteners The bolts holding SAE flanges on the annular close
port 1½” shuttle valves backed out repeatedly on one rig due to extreme vibration. Vibration caused the failures, but what caused the vibration? Contributing factors included flow rates, reverse water hammer, and differential pressures. Total failure would occur approximately 20 seconds after the beginning of flow when opening the annular. This phenomena was observed both subsea and on the surface, but only when the surge bottle precharge pressure was lower than the operating pressure thereby allowing the surge bottle to “charge”.
It occurred during the rapid discharge of fluid from the close surge bottle while opening the annular. Back pressure or negative water hammer caused the poppet in the surge bottle to cycle violently open/close/open. The resulting vibration was transferred to the piping by the clamp arrangement and resulted in the bolts backing out of the SAE flanges on the shuttle valves (figure 18).
Replacing a section of the existing 1½” pipe with smaller ½” diameter tubing restricted the flow out of the surge bottle, which stopped the poppet vibration (figure 19). This modification was tested on the surface and again subsea prior to pulling the BOP on the last well. The ROV witnessed the test subsea and did not observe any vibration of the hard piping. The operation of the surge bottle was unaffected.
As illustrated elsewhere herein, deepwater (in excess of 5,000 feet) control systems with pressures of 5,000 psi and high flow rates have resulted in damaged valves, hoses, tubing, ram locking systems and other components due to excessive shock and vibration. The high pressure, high flow rate control systems were designed to compensate for the length of the hydraulic conduit lines in deep water and reduce the Emergency Disconnect Sequence (EDS) completion and shearing times. These high flow rates coupled with the greater hydrostatic pressure in deepwater creates a situation, which leads to reverse water hammer resulting in shocks and vibrations in the control system that cause component failures.
Fig. 18 - The picture is taken from the ROV recording during the blowing off of the end cap.
Fig. 19

8 T. THRASH, R. S. WILLIAMSON AADE-05-NTCE-76
What is Water-Hammer? Water hammer is a widely known phenomena, which
is most destructive to piping systems. Most of us have experienced water hammer in home plumbing systems. After suddenly closing a faucet we hear a bump/knock that is followed by a series of knocks spaced evenly and decaying in magnitude. The water hammer takes place when the moving mass of water hits the valve shutter like a train crashing into a wall. A shock wave is created and it bounces back and forth several times until it dissipates. The water hammer intensity depends on different factors (among them, the speed of the water flow, and the speed of the valve closing process). Moving water in a pipe has kinetic energy proportional to the mass of the water in a given volume times the square of the velocity of the water. For this reason, most pipe sizing charts recommend keeping the flow velocity at or below 5fps. In hydraulic oil, designing the system to not exceed critical velocity of fluid flow and/or adding in dampening devices minimizes system water hammer. Typical hydraulic system design limits the fluid velocity to 15fps - 25fps. Keeping the velocity down reduces the water hammer pressure magnitude and reduces inefficiency due to frictional (pressure drop) losses and heat generation.1 However, BOP control systems are not designed for maximum efficiency and focus on powering large functions as fast as possible, usually through plumbing that is small for the fluid flow. The plumbing is sized based on its maximum flow capability rather than it’s efficiency. Thus water hammer is prevalent in BOP control systems. Fluid velocities in excess of 80fps are typical in current 5,000 psi BOP control systems. These flow velocities are greater than 4 times the velocity of industrial hydraulic oil systems. To further compound the problem water based hydraulic fluids are less compressible. As a system is deployed subsea the ambient pressure will increase which will also increase (compress) the fluids bulk modulus. Therefore, the shock in the system is magnified even more than their land based hydraulic oil counter parts.
Over the past thirty years, BOP control systems have evolved into higher pressures at higher volumes, with valves that are faster acting, in ever deeper water depth, with a control fluid that is less compressible, and flowing through piping that is more rigid. All of these incremental changes have increased water hammer magnitude and increased the risk of damage to the control system. The sudden start and stopping of the fluid momentum in these high velocity BOP control systems have increased the occurrence of catastrophic failures subsea. The sudden stopping of the fluid flow will also create a new type of water hammer unnoticeable on surface controls, but present subsea,
called reverse water hammer. For the land-lubber a suddenly closed valve will create a high-pressure spike on the upstream side of the valve, and no concern is given to the down stream side of the valve. But there is a reversed pressure occurrence down stream of the valve ignored in engineering and system design because it is insignificant. Maximum reverse water hammer pressure topside is atmospheric, 14.7 psi. However, in subsea conditions the ambient conditions are extreme with hydrostatic pressures reaching 5,000 psi. Therefore the pressure on the down-stream side of a suddenly closed valve could reach “0 psi absolute” or “negative (–) 5,000 psi Gauge”.
Water hammer and reverse water hammer are the result of a fluid column momentum (figure 20) suddenly changing due to an obstruction and resulting in a pressure rise on the upstream side of the obstruction and a pressure loss immediately down stream of the obstruction (figure 21). The obstruction can be a suddenly closed valve, or even a cylinder that has reached the end of its stroke and suddenly stops.
Reverse water hammer (reverse pressure spike) is the result of the column of fluid moving away from the obstruction. In top side atmospheric conditions this drop in pressure below ambient is restricted to 14.7 psi (absolute). However in sub sea conditions it is the hydrostatic head of the water depth plus the atmospheric 14.7 psi. A 5,000 psi BOP control system at 11,000 ft water depth has an ambient pressure of 5,000 psi absolute and an operating pressure of 10,000 psi absolute (figure 22). If a column of fluid was suddenly stopped and the reverse water hammer pressure was 3,000 psi, the piping system would have 5,000 psi external pressure and 2,000 psi internal pressure (figure 23).
Fig. 20 - Fluid flow through an unobstructed conduit has relatively uniform pressure in the line.
Fig. 21 – Sudden Valve Closure

AADE-05-NTCE-76 Hydrostatic and Water Hammer Effects on Subsea Control Systems 9
This is the condition that would collapse most hoses,
as shown in figure 24.
Water hammer isn’t the only damaging side affect to
sudden changes in momentum. When a fluid column is stopped the conduit is reacting to the forces decelerating the fluid column. This sudden change in momentum translates into piping shifting axially in response to the change in momentum. Without proper piping support severe damage can occur to the piping, especially in 90-degree elbows.
This shock loading has damaged many connections
in hydraulic systems. The force, or inertia, of this water is transferred instantly from the fluid to the pipe. If the pipes are inadequately supported, they may move. Repeated shock loading of the system may result in fatigue failure of rigid connections.
As BOP control system pressures increase, and are deployed in even deeper water, failures due to water hammer will increase. The control fluid gets less compressible, the piping systems become more rigid, fluid velocities increase, and accumulators become less efficient at depth. All are factors increasing the risk of system failure due to water hammer.
Testing to simulate the effects of Water hammer
Water hammer is a pressure surge or wave caused by the kinetic energy of water in motion when it is forced to stop or change direction suddenly. Moving water in a pipe has kinetic energy proportional to the mass of the water in a given volume times the square of the velocity of the water. The water hammer intensity depends on different factors (among them, the speed of the water flow, length of piping, fluid bulk modulus and piping
Fig. 24 – On left collapsed hose and on right is a good hose.
Fig. 25 - Without proper piping support severe damage can occur to the piping,
especially in 90-degree elbows.
Fig. 26 - The momentum of the fluid column upstream of an elbow can create enormous bending moment loads on fixed ends of piping.
Fig. 22 – Hose Operating at 5,000 psi in 11,000 ft of water.
Fig. 23 – Hose with 3,000 psi Reverse Water hammer Event in 11,000 ft of water.

10 T. THRASH, R. S. WILLIAMSON AADE-05-NTCE-76
modulus, and the speed of the valve closing process). The maximum pressure spike (water hammer) is described by the following equation.2 Pw h = VwV/[32.2(2.31)] Vw = 4720/(1+Kd/Et)0.5 V = 0.4085(GPM)/d2 Where: Pw h = Pressure spike (maximum water hammer) (psi) Vw = Velocity of the pressure wave in the pipe (fps) V = Velocity of the fluid (fps) K = Bulk modulus of the fluid E = Modulus of elasticity of the conduit (psi) t = Thickness of the pipe (in.) GPM = Gallons per minute of flow d = Inside diameter of the pipe (in.)
Chart 1 illustrates the change in water hammer from
the same 200 GPM flow in different sized pipes. As can be seen, the maximum pressure spike is inversely related to the size of the pipe ID.
In addition to the size of piping having a significant effect on water hammer pressure, the type of piping (rigidity) will also affect the water hammer pressure. Steel piping (30,000,000 modulus) could generate a maximum water hammer pressure of 5,083 psi where a rubber hose (200,000 modulus) would only generate a maximum of 1,959 psi (chart 2). The more rigid the piping the higher the water hammer potential will be and the better it has to be supported.
Pipe ID Pipe Wall E, mod of elast GPM Vw V Pwhin in psi ft/s ft/s psi
0.75 0.25 30,000,000 200 4651 145.24 9081.41 0.25 30,000,000 200 4628 81.70 5083.7
1.25 0.25 30,000,000 200 4606 52.29 3238.01.5 0.25 30,000,000 200 4584 36.31 2238.01.75 0.25 30,000,000 200 4563 26.68 1636.5
2 0.25 30,000,000 200 4542 20.43 1247.22.25 0.25 30,000,000 200 4521 16.14 980.92.5 0.25 30,000,000 200 4500 13.07 790.92.75 0.25 30,000,000 200 4480 10.80 650.7
3 0.25 30,000,000 200 4460 9.08 544.33.25 0.25 30,000,000 200 4440 7.73 461.73.5 0.25 30,000,000 200 4421 6.67 396.43.75 0.25 30,000,000 200 4401 5.81 343.8
4 0.25 30,000,000 200 4382 5.11 300.8
Chart 1 - Sensitivity of Piping size to Water Hammer – Hammer Pressure.
AADE-05-NTCE-76 Hydrostatic and Water Hammer Effects on Subsea Control Systems 11
Pipe ID Pipe Wall E, mod of elast GPM Vw V Pwhin in psi ft/s ft/s psi1 0.25 30,000,000 200 4628 81.70 5083.71 0.25 20,000,000 200 4584 81.70 5035.51 0.25 10,000,000 200 4460 81.70 4898.81 0.25 5,000,000 200 4239 81.70 4655.71 0.25 2,500,000 200 3880 81.70 4261.51 0.25 1,500,000 200 3518 81.70 3864.21 0.25 750,000 200 2927 81.70 3215.21 0.25 400,000 200 2360 81.70 2592.21 0.25 200,000 200 1784 81.70 1959.51 0.25 100,000 200 1309 81.70 1437.91 0.25 50,000 200 944 81.70 1036.91 0.25 25,000 200 674 81.70 740.61 0.25 12,000 200 470 81.70 515.91 0.25 6,000 200 333 81.70 365.71 0.25 3,000 200 236 81.70 258.91 0.25 1,500 200 167 81.70 183.21 0.25 800 200 122 81.70 133.81 0.25 400 200 86 81.70 94.6
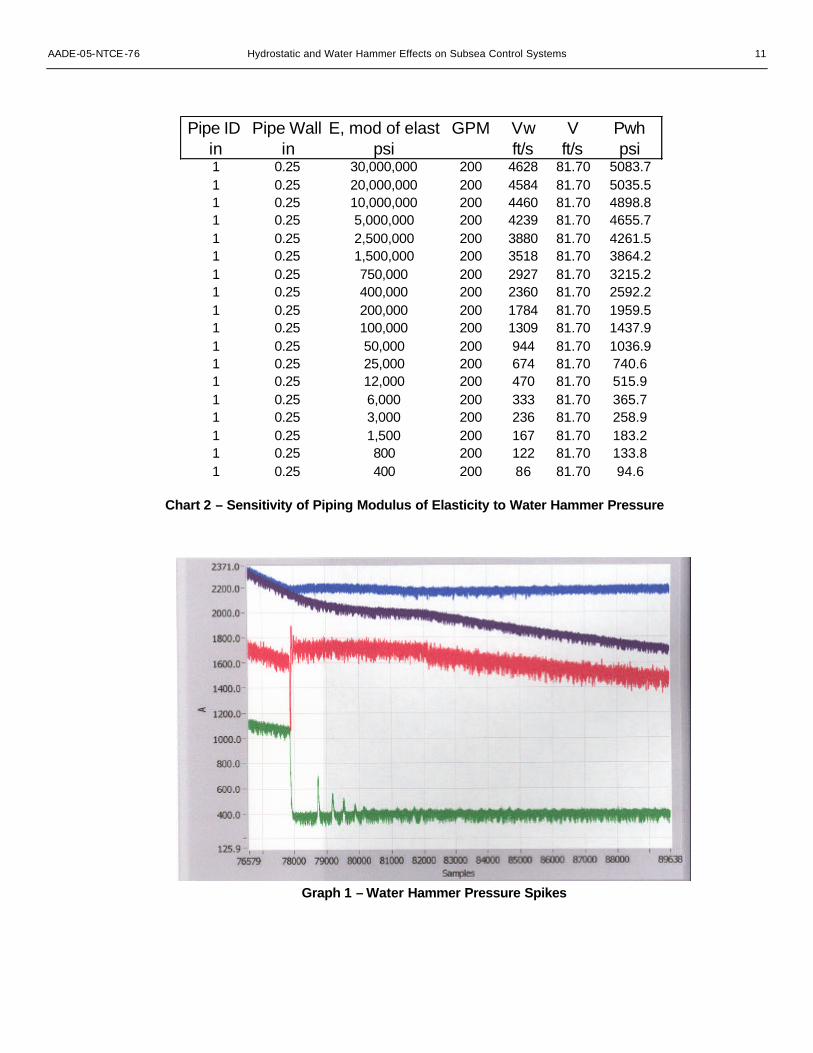
Chart 2 – Sensitivity of Piping Modulus of Elasticity to Water Hammer Pressure
Graph 1 – Water Hammer Pressure Spikes
12 T. THRASH, R. S. WILLIAMSON AADE-05-NTCE-76
Water hammer pressure waves travel through the
control system and reflect back and forth until they dissipate. Graph 1 shows a reverberating water hammer pressure wave. The scale on the left is psi, while the scale on the bottom is sample points (5,000 points = 1 second). The blue line plots a flow that stopped instantaneously—hence the flat line. The purple line illustrates the pressure change for a reduced flow.
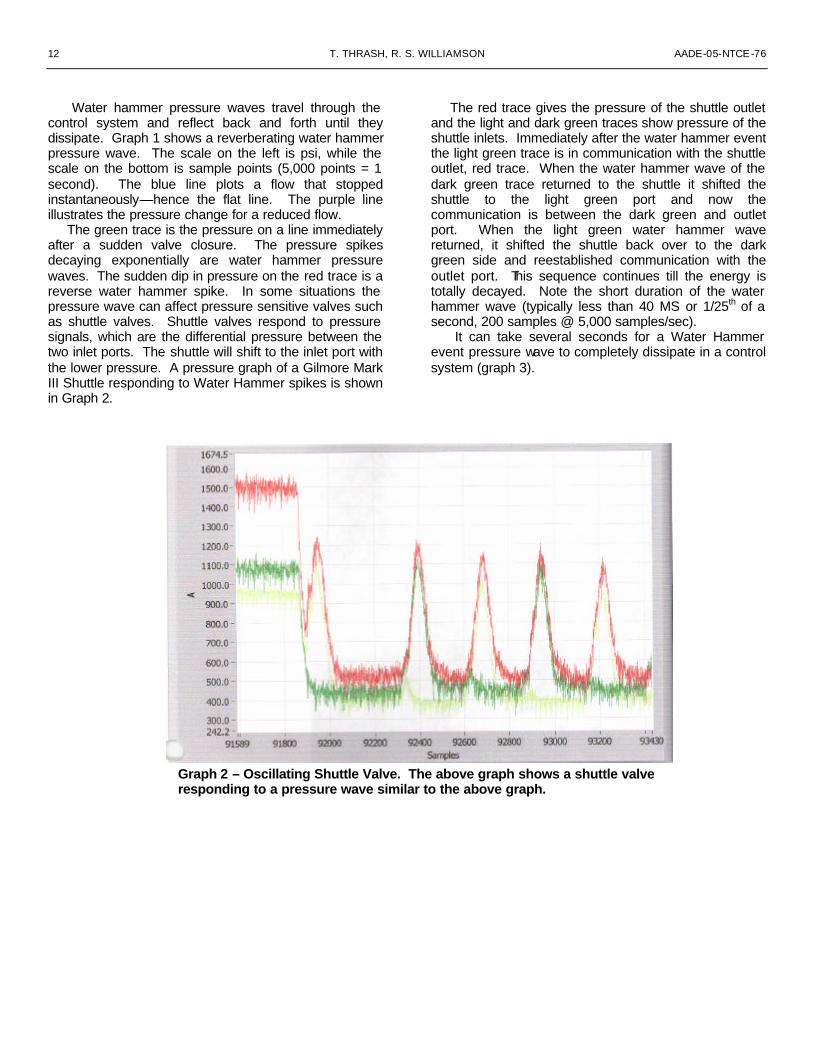
The green trace is the pressure on a line immediately after a sudden valve closure. The pressure spikes decaying exponentially are water hammer pressure waves. The sudden dip in pressure on the red trace is a reverse water hammer spike. In some situations the pressure wave can affect pressure sensitive valves such as shuttle valves. Shuttle valves respond to pressure signals, which are the differential pressure between the two inlet ports. The shuttle will shift to the inlet port with the lower pressure. A pressure graph of a Gilmore Mark III Shuttle responding to Water Hammer spikes is shown in Graph 2.
The red trace gives the pressure of the shuttle outlet and the light and dark green traces show pressure of the shuttle inlets. Immediately after the water hammer event the light green trace is in communication with the shuttle outlet, red trace. When the water hammer wave of the dark green trace returned to the shuttle it shifted the shuttle to the light green port and now the communication is between the dark green and outlet port. When the light green water hammer wave returned, it shifted the shuttle back over to the dark green side and reestablished communication with the outlet port. This sequence continues till the energy is totally decayed. Note the short duration of the water hammer wave (typically less than 40 MS or 1/25th of a second, 200 samples @ 5,000 samples/sec).
It can take several seconds for a Water Hammer event pressure wave to completely dissipate in a control system (graph 3).
Graph 2 – Oscillating Shuttle Valve. The above graph shows a shuttle valve responding to a pressure wave similar to the above graph.

AADE-05-NTCE-76 Hydrostatic and Water Hammer Effects on Subsea Control Systems 13
The energy source in the above test is the red trace,
an accumulator. The blue trace is the shuttle outlet and the two shuttle inlets are green and light green. This was a shuttle oscillation that was started by a water hammer event when a cylinder hit the end of its stroke. This shuttle is on the exhaust side of the cylinder and is in reverse flow. This wave-form lasted 3.4 seconds and had a magnitude of 2,000 psi and the shuttle cycled 31 times. On a BOP control system this water hammer event would potentially collapse hoses, and if the shuttle responds to the water hammer pressure wave, the pressure reversal on the hoses could happen numerous times during one function of the cylinder, and the hose may collapse several times. Depending on the severity of the damage to the hose, it may blowout the next time the function is operated. To prevent oscillation from a water hammer event, shuttles that have reverse flow (venting flow) should use dampened shuttles similar to the one in figure 11. In all test conditions that caused oscillation on undamped shuttles, dampened shuttles were installed & oscillation was elimated.
Conclusion--How can the effects of water
hammer be mitigated? While it is impracticable to resize all BOP piping to
reduce the velocity of the fluid flow there are a few field friendly changes that can be made to reduce the effects of water hammer events. One drilling contractor found that installing restrictors (figure 27) on function lines at the pod outlet reduced damage by maintaining some back pressure on venting circuits, reducing the reverse
pressure dip below ambient, which in turn reduces hose collapse and shuttle shifting.
Graph 3 – Water Hammer event that took 3 – 4 seconds to disapate.
Fig. 27 - Flow restrictors as installed on a rig
14 T. THRASH, R. S. WILLIAMSON AADE-05-NTCE-76
Another method is to change the shuttles to those that are hydraulically dampened. The hydraulic dampening slows the shuttles response to the water hammer pressure spikes, reducing the chance that the shuttle will respond to the water hammer wave. Neither of these options serves to eliminate the water hammer event itself, but instead help to control its effects. Control systems will always have water hammer issues until the systems are implemented with “soft start” and “soft stop” features.
By changing the connection between the pod and the 1" function shuttle valves from tubing to hose, the water hammer effect can be reduced. Evidence of increased water hammer effect and shock loading has been documented when using tubing. Replacing the 1" tubing with 1" hose has a dampening effect on pressure spikes and surges; i.e., the hose lowers the modulus of elasticity. However, the wire-braided hoses currently favored by the industry have a chance of failing in collapse during negative water hammer, where tubing will fail through positive water hammer. There are hoses available that can resist external hydrostatic to a depth equivalent of 10,000 feet of water, however these are very bulky and difficult to work with.
The way forward between hose and tubing is not obvious, but hoses that can withstand repeated collapse cycles without failure would appear to be a better option than wire braid hoses which are damaged when subjected to external pressure after having collapsed. The use of larger ID hoses as opposed to smaller should also be considered to reduce water hammer. Minimum bend radii specified by the hose manufacturer should not be exceeded.
The most effective deterrent to damage caused by water hammer currently in use is flow restrictors installed in the function lines from the pods combined with the use of dampened shuttle valves. Additionally, inspect and verify that all piping on the BOP stack is properly secured. Pipe clamps or brackets should be added as
necessary. In severe cases it may be necessary to secure the fasteners of all pipe clamp brackets with thread locking compound and/or locking wires. The fasteners on the flanges of shuttle valves may also have to be cleaned and reinstalled with thread locking compound.
By having a better understanding of the dynamics of reverse water hammer, the industry should be able to mitigate its affect and avoid costly BOP stack pulls. Hopefully this paper will help to that end.
Acknowledgments
WEST Engineering pictures from multiple surveys of Cameron, Gilmore, Shaffer, Transocean and SwageLok equipment.
Nomenclature fps = feet per second psi = pounds per square inch References Miller, Jack E. and Stidston, Edward, “Improvements to
Ultra-deepwater Controls Reliability through State-of-the-Art Analytical Techniques”, OTC Paper # 15232.
1 Parker Hannifin Corporation, Section title of info used,
Design Engineers Handbook. Parker-Hannifin Corporation 1977. j (c-7).
2 Hicks TG, SD Hicks, J Leto, ed, “Water-Hammer Effects in
Liquid Pipelines,” Standard Handbook of Engineering Calculation, 3rd ed., 1994
N:\Consult\A A D E\Paper -- Reverse Water Hammer\2005 AADE
WEST Conference Paper.doc