1997 executive summary - home - ipswich river...
TRANSCRIPT

RiverWatch Volunteer Monitoring Program
1997 Executive Summary
Ipswich River Watershed Association 51 S. Main Street, Box 576 Ipswich, MA 01938
978.356.8939 978.356.8958 (f) [email protected]
March 1998

The RiverWatch volunteer monitoring program of the Ipswich River Watershed Association was overhauled and expanded in 1997 to include 19 main stem sites and 5 tributary sites. Volunteers monitored their river stations once per month for Air and Water Temperature, Dissolved Oxygen, pH, depth, velocity, and flow. Data trends, data points in violation of Class B standards, points of interest, and conclusions are discussed within this executive summary. For a more complete and detailed report, please refer to the next section. For all of the years data at a particular site please refer to Appendix A, or contact the Monitoring Coordinator at the Ipswich River Watershed Association at 978.356.8939 or [email protected]. One of the most noticeable data trends is consistent low Dissolved Oxygen in the Upper Basin. Following is a graph of the lowest Dissolved Oxygen reading for each site over the year:
Lowest DO at Each Site, 1997
0
1
2
3
4
5
6
7
8
9
10
IP00
IP01
IP02
IP03
IP04
IP06
IP10
IP11
IP12
IP13
IP14
IP16
IP18
IP19
IP20
IP22
IP24
IP25
IP26
Site
DO
- m
g/L
As you can see, the sites in the Upper Basin are significantly below the Class B standard of 5.0 mg/L. It is not until after the Bostik Dam at IP06 that DO levels are high enough to support fish life. This low DO trend was also noted by the Division of Water Pollution Control in their Ipswich River Studies of 1973 and 1988. The Division of Water Pollution Control attributes low DO to “swampy terrain” and rainfall sweeping decaying organic material into the river. It is worthwhile to note, however, that low flow / no flow situations will only exacerbate this natural tendency. As water levels decrease, there is 1) less oxygen entering water through the air-water interface as there is less flow and turbulence and 2) Water Temperature will increase, and the amount of dissolved oxygen that can be absorbed into the water will decrease.
IRWA RiverWatch Volunteer Monitoring Program: 1997 Final Report
2

Another noticeable trend in the data was a statistically significant number of pH samples that were below the Class B standard of 6.5. Not all sites monitored pH, but here is a graph of the lowest values for the year of those sites that did:
Low pH at site, 1997
66.16.26.36.46.56.66.76.86.9
IP00 IP06 IP14 IP18 IP19 IP22 IP24
Low
pH
As you can see, the pH is below the standard at three of the seven sites. Given the few pH samples that were collected this year, we feel this is something that should be looked at more strongly next year by distributing more pH meters. Fecal Coliform was sampled once at all but three of the monitoring sites: The graph below shows the results of this test.
Dissolved Oxygen, Single Sample, 1997
0
50
100
150
200
250
IP00
IP01
IP02
IP03
IP04
IP06
IP10
IP11
IP12
IP13
IP14
IP16
IP18
IP19
IP20
IP22
IP24
IP25
IP26
Feca
l Col
iform
(co
l / 1
00 m
L)
As can be seen, only one site was outside the Primary Contact Standard of 200 col / 100 mL. One sampling can not be seen as conclusive, however.
IRWA RiverWatch Volunteer Monitoring Program: 1997 Final Report
3
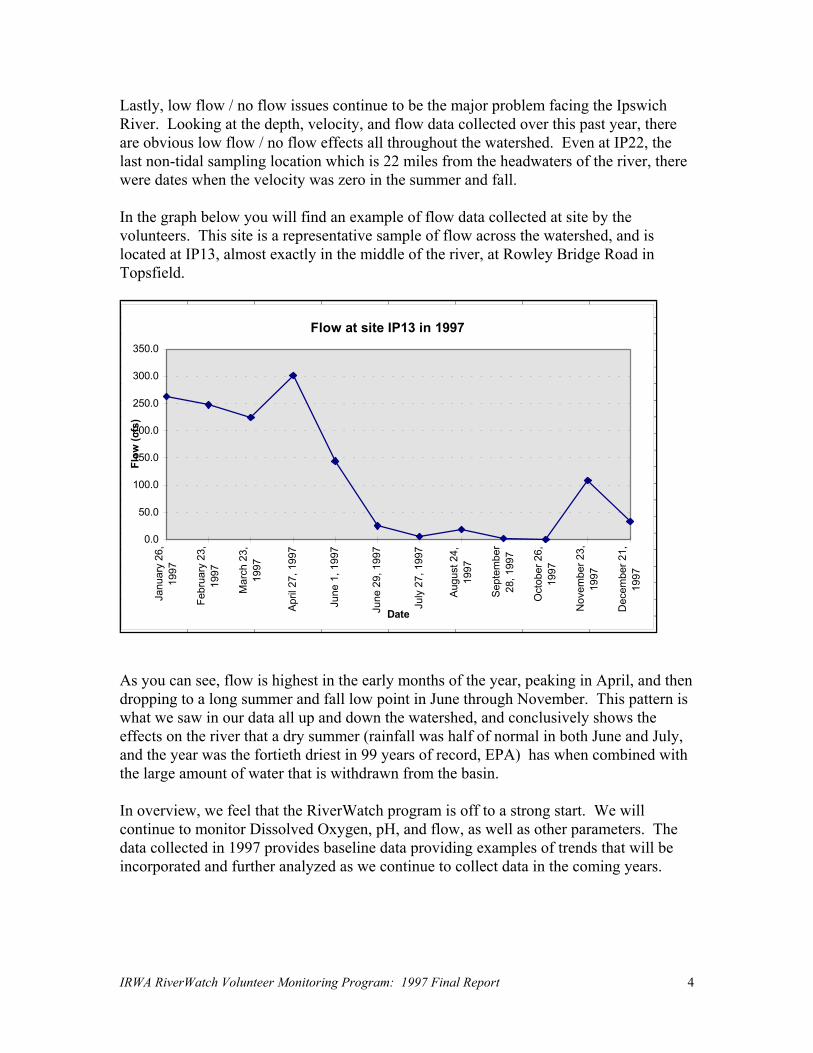
Lastly, low flow / no flow issues continue to be the major problem facing the Ipswich River. Looking at the depth, velocity, and flow data collected over this past year, there are obvious low flow / no flow effects all throughout the watershed. Even at IP22, the last non-tidal sampling location which is 22 miles from the headwaters of the river, there were dates when the velocity was zero in the summer and fall. In the graph below you will find an example of flow data collected at site by the volunteers. This site is a representative sample of flow across the watershed, and is located at IP13, almost exactly in the middle of the river, at Rowley Bridge Road in Topsfield.
Flow at site IP13 in 1997
0.0
50.0
100.0
150.0
200.0
250.0
300.0
350.0
Janu
ary
26,
1997
Febr
uary
23,
1997
Mar
ch 2
3,19
97
April
27,
199
7
June
1, 1
997
June
29,
199
7
July
27,
199
7
Augu
st 2
4,19
97
Sept
embe
r28
, 199
7
Oct
ober
26,
1997
Nov
embe
r 23,
1997
Dec
embe
r 21,
1997
Date
Flow
(cfs
)
As you can see, flow is highest in the early months of the year, peaking in April, and then dropping to a long summer and fall low point in June through November. This pattern is what we saw in our data all up and down the watershed, and conclusively shows the effects on the river that a dry summer (rainfall was half of normal in both June and July, and the year was the fortieth driest in 99 years of record, EPA) has when combined with the large amount of water that is withdrawn from the basin. In overview, we feel that the RiverWatch program is off to a strong start. We will continue to monitor Dissolved Oxygen, pH, and flow, as well as other parameters. The data collected in 1997 provides baseline data providing examples of trends that will be incorporated and further analyzed as we continue to collect data in the coming years.
IRWA RiverWatch Volunteer Monitoring Program: 1997 Final Report
4

RiverWatch Volunteer Monitoring Program
1997 Data Report
Ipswich River Watershed Association 51 S. Main Street, Box 576 Ipswich, MA 01938
978.356.8939 978.356.8958 (f) [email protected]
March 1998

ACKNOWLEDGMENTS The Ipswich River Watershed Association and the RiverWatch program would like to thank: The people and organizations who supported our program monetarily:
Gulf of Maine Council, and USEPA Jennie Bridge Massachusetts Coastal Zone Management Massachusetts Watershed Initiative Sweet Water Trust
The people and organizations who supported our program with field and laboratory support, technical advice, program oversight, and general helpfulness.
Indira Balkissoon, EPA Kirk Barrett, Consultant Terry Bastian, Waterflowers Jennie Bridge, EPA Robert Buchsbaum, Mass Audobon Wayne Castonguay, DFW Cindy DelPapa, SRWC John Felix, DEP Jim Fitzgerald, CRWA
Rita Gallant, Volunteer Chuck Hopkinson, MBL Christian Krahforst, CZM Anne Monnelly, CDM Jim MacDougall, Greenbelt Jerry Schoen, MWWP Gina Snyder, EPA
Daniel Welch, Bostik
And of course, the volunteers: Suzanne Sullivan Martha Stevenson Scott Stimpson Jim Twohig Mike Abell Gina Snyder Indira Balkissoon Todd Patch Bob Duncan Ed Packard Kathryn Brown Elizabeth Cameron Nathaniel Cameron Rich Nagle John Monroe Stuart Saginor Holly LeBlanc
Pike Messenger Frank Masse Crystal Masse Deb Hayes Eva Ritter-Walker Melodie Thibodeau Bob Barry Marie Barry Calie Soderland Carl Soderland Matt Steen Deborah Nelson Ingrid Johnson Peg Lawrence Katrina Hart Marcie Stevenson Rick Silverman
Jim Dempsey Martha Campbell Marcie Armstrong Bob Tragert Larry Eliot Peter Moore Alicia Moore Eric Johnson Lucy Helvenston Scott Lepanon Kate Morkesky Meegan Best Sandra Hamilton Dave Williams Kathy Joyce
CONTENTS
IRWA RiverWatch Volunteer Monitoring Program: 1997 Final Report
6

PURPOSE AND GOALS . . . . . . . . . . . . . . . . . . . . . . . . 8 THE IPSWICH RIVER . . . . . . . . . . . . . . . . . . . . . . . . . . 8 THE RIVERWATCH MONITORING PROGRAM . . . . . . . . . 10 TRAINING . . . . . . . . . . . . . . . . . . . . . . . . . . . . . . . . . 10 PARAMETERS . . . . . . . . . . . . . . . . . . . . . . . . . . . . . . 10 SITES . . . . . . . . . . . . . . . . . . . . . . . . . . . . . . . . . . . 12 RESULTS: SITE SUMMARIES . . . . . . . . . . . . . . . . . . . 14 EXECUTIVE SUMMARY . . . . . . . . . . . . . . . . . . . . . . . . 1
ACKNOWLEDGMENTS . . . . . . . . . . . . . . . . . . . . . . . . 6
APPENDICES DATA: ORGANIZED BY SITE . . . . . . . . . . . . . . . . . . . A DISSOLVED OXYGEN AND FECAL COLIFORM DATA . . . . B
IRWA RiverWatch Volunteer Monitoring Program: 1997 Final Report
7

PURPOSE AND GOALS The purpose of the RiverWatch program is to establish baseline data throughout the watershed in order to identify and begin to remediate water quality and quantity impairments.
The RiverWatch program also promotes awareness of how activities throughout the watershed affect the Ipswich River. The goals of the RiverWatch program in 1997 were:
• To identify pollution sources and effects • To identify water quality trends particularly relating to the flow issue • To incorporate the “Stream Teams” into the RiverWatch program • To compile an accurate, precise and complete record • To educate watershed residents about the river • To promote stewardship of the river • To establish a program the will become more comprehensive in 1998
THE IPSWICH RIVER The Ipswich River originates at the confluence of Maple Meadow Brook and Lubbers Brook in eastern Wilmington, and then meanders for approximately 26 miles before emptying into the southern end of Plum Island sound. Part of all of 21 communities in Northeastern Massachusetts form the 155 square mile drainage area of the river. There are eight major tributaries, most of which drain the less developed northern regions of the watershed. The freshwater section of the Ipswich River is classified by the Department of Environmental Protection as a Class B waterbody. The tidal section of the river is classified as a SA waterbody. The following table details the water quality standards associated with this classification:
Class B Standards
Class SA Standards
AQUATIC LIFE
Dissolved Oxygen 5.0 mg/L * 6.0 mg/L
Temperature 83 F Max * (28.3 C)
85 F Max 80 F Average
pH 6.5 - 8.3 6.5 - 8.5
Class B Standards
Class SA Standards
PRIMARY CONTACT
IRWA RiverWatch Volunteer Monitoring Program: 1997 Final Report
8

RECREATION
Fecal Coliform 200 / 100 mL geo. mean 10% >= 400 / 100 mL
200 / 100 mL geo. mean 10% >= 400 / 100 mL
SECONDARY CONTACT RECREATION
Fecal Coliform 1000 / 100 mL geo. mean
10% >= 2000 / 100 mL 1000 / 100 mL geo. mean 10% >= 2000 / 100 mL
SHELLFISHERY
Fecal Coliform 14 / 100 mL geo. mean
10% >= 43 / 100 mL
AESTHETICS
Taste and Odor None Objectionable None other than natural
* Warm water fishery. One major aspect that can not be overlooked in a discussion of the Ipswich River is the human use for drinking water. Fourteen communities, including 2 located completely out of the watershed and four communities with only a small area within the watershed, withdraw approximately 30 million gallons per day of water from the river, tributaries and groundwater. This provides drinking water for well over 300,000 people, and the combined impact of these withdrawals and the naturally occurring seasonal fluctuations have led to severe low-flow/no-flow situations in both 1995 and 1997. In 1997, the river was either dry or ponded from its headwaters in Wilmington to past the Middleton Gauge in Middleton, which is more than 10 miles of river length. Another serious issue surrounding the Ipswich River is the closure of all of the shellfishing areas in the Ipswich River estuary due to fecal coliform contamination, and its potential impact on the adjacent open area in Plum Island Sound.
IRWA RiverWatch Volunteer Monitoring Program: 1997 Final Report
9

THE RIVERWATCH MONITORING PROGRAM
IRWA began a volunteer monitoring program in 1988 under the direction of Jim MacDougall. Initially, there were 8 mainstem sites monitored on a semi-monthly basis. In 1997, under a Massachusetts Watershed Initiative Capacity Building Grant and a Coastal Zone Management Equipment Purchase Grant, the program was overhauled, expanded, and formalized. At the beginning of 1997, 19 mainstem sites were chosen to begin testing. The monitoring time was selected as between 10 am and 12 noon on the last Sunday of every month, barring interference with a holiday when it is scheduled for the Sunday previous. Parameters initially sampled were Air Temperature, Water Temperature, Color (visual inspection), Odor, Depth, and Velocity. As the program developed over the year, one new mainstem site and four new tributary sites were added in the areas covered by our Stream Teams. Additionally, new parameters added throughout the year were: Dissolved Oxygen, pH, and Cross Section data. Fecal Coliform was tested on two separate occasions at various points in the watershed. TRAINING One training for all monitors past and new was held to hand out new equipment and assign sites on January 11, 1997. On April 7, 1997 and June 26, 1997 additional new monitor training’s were held to fill in new tributary sites and gaps in the existing program. In July, on four separate training dates, all of the monitors were trained on the new pH meters and Dissolved Oxygen test kits. In addition, a four to six page monthly newsletter providing information, data results, suggestions, and responses to issues within the data was mailed to each monitor. A Quality Assurance Project Plan to assure quality control of our data has not yet been filed through the EPA, but we are intending to file one by Summer 1998. A monitor year-end meeting and retraining has been scheduled for March 1998, as well. Monitors follow procedures outlined in the IRWA’s Water Monitoring Manual, written and updated by the Stream Team / Monitoring Coordinator. All trainings were led by the Stream Team / Monitoring Coordinator. PARAMETERS The parameters tested for in the RiverWatch program include:
• Air Temperature • Water Temperature • Dissolved Oxygen • pH • Depth • Velocity
• Color • Odor • Cross Sections • Wildlife Observations • Fecal Coliform
IRWA RiverWatch Volunteer Monitoring Program: 1997 Final Report
10

Air and Water Temperature: Is measured with H-B Enviro-Safe Thermometers. Monitors are asked to round to the nearest 0.5 degree Celsius. A few sites are measured in Fahrenheit, and the data is then converted to Celsius. Dissolved Oxygen: Is measured with a LaMotte Modified Winkler Method Test kit. Most sites began DO testing after they received their kit in July 1997. The original eight sites of the 1988 monitoring program used Hach Model OX-2P DO test kits. Sites that were part of the original monitoring program used their Hach kits from January to June, and the LaMotte kits from July to December. pH: Is measured with Orion QuiKcheK pH meters with automatic temperature compensation. Due to monetary constraints, not all sites have pH meters. pH meters were distributed in November and sites began using them for the November sampling. Sites that were part of the original 1988 monitoring program used their original pH test kits. Depth: Is measured with a weight attached to a rope marked off every six inches with alternating red and black ink. Velocity: Is measured by dividing the average of three times that it takes an orange peel to travel a known distance (often the width of the bridge). Color and Odor: Are measured visually and odorly while the water is contained in the sampling bucket. Cross Sections: Were measured once at most sites in 1997. The monitors use a measuring tape and their depth line to record depth readings at two to five foot intervals across their bridge. Sites that are not located at a bridge do not do cross section. Wildlife Observations: Varied greatly due to the knowledge of monitor. Many sites looked at plant life, birds, macroinvertebrates, and animal tracks. Fecal Coliform: Was measured on two separate sampling dates at half of the sites on each date. Monitors rinsed their bucket in Liquinox solution, and then triple-rinsed their bucket in tap water to nullify the toxicity of Liquinox. Then monitors sampled for fecal after triple-rinsing their bucket in the river water, and dropped their sample off at a collection site where a cooler was waiting. The monitoring coordinator drove samples to the CRWA lab. A map with site locations is included as the next page.
IRWA RiverWatch Volunteer Monitoring Program: 1997 Final Report
11

IRWA RiverWatch Volunteer Monitoring Program: 1997 Final Report
12
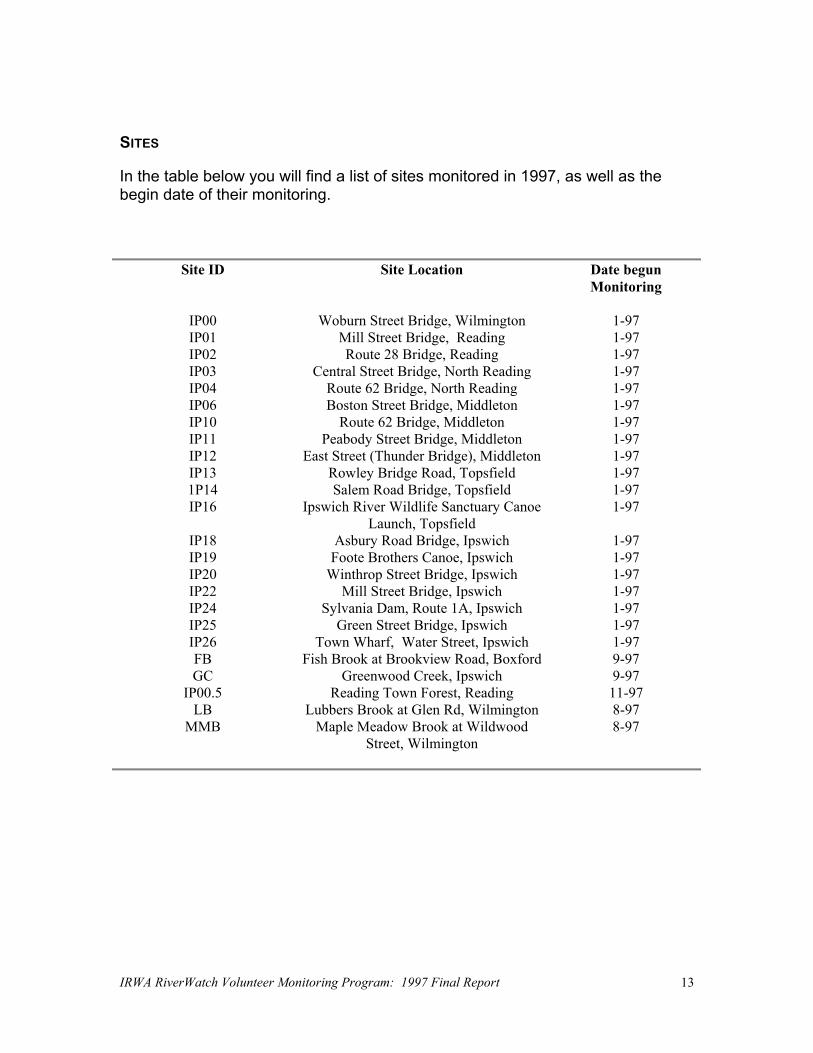
SITES In the table below you will find a list of sites monitored in 1997, as well as the begin date of their monitoring.
Site ID Site Location Date begun Monitoring
IP00 Woburn Street Bridge, Wilmington 1-97 IP01 Mill Street Bridge, Reading 1-97 IP02 Route 28 Bridge, Reading 1-97 IP03 Central Street Bridge, North Reading 1-97 IP04 Route 62 Bridge, North Reading 1-97 IP06 Boston Street Bridge, Middleton 1-97 IP10 Route 62 Bridge, Middleton 1-97 IP11 Peabody Street Bridge, Middleton 1-97 IP12 East Street (Thunder Bridge), Middleton 1-97 IP13 Rowley Bridge Road, Topsfield 1-97 1P14 Salem Road Bridge, Topsfield 1-97 IP16 Ipswich River Wildlife Sanctuary Canoe
Launch, Topsfield 1-97
IP18 Asbury Road Bridge, Ipswich 1-97 IP19 Foote Brothers Canoe, Ipswich 1-97 IP20 Winthrop Street Bridge, Ipswich 1-97 IP22 Mill Street Bridge, Ipswich 1-97 IP24 Sylvania Dam, Route 1A, Ipswich 1-97 IP25 Green Street Bridge, Ipswich 1-97 IP26 Town Wharf, Water Street, Ipswich 1-97 FB Fish Brook at Brookview Road, Boxford 9-97 GC Greenwood Creek, Ipswich 9-97
IP00.5 Reading Town Forest, Reading 11-97 LB Lubbers Brook at Glen Rd, Wilmington 8-97
MMB Maple Meadow Brook at Wildwood Street, Wilmington
8-97
IRWA RiverWatch Volunteer Monitoring Program: 1997 Final Report
13

RESULTS: SITE SUMMARIES Although a full listing of all data collected at each site is included in the Appendix, this summary section highlights average data, compliance with Class B and SA water quality standards, and points of note in the individual sites. Sites monitored by the Stream Teams, which were added in August, September, and November, are not included in this section. The data for those sites can be found in the Appendix. The units used for the data are:
DO: mg/L Air Temperature: C Water Temperature: C Velocity: feet per second Depth: feet Flow: feet cubed per second Fecal Coliform: colonies / 100 mL
IP00 - Woburn Street, Wilmington Sample Completion Rate: 12 of 12
Parameter Average High Month
High Low Month
Low Out of
Standard Comments
DO 5.6 8.8 Nov 3.2 Aug Yes Below standard Jul,
Aug, Sep. Began sampling Jul.
pH 7.05 7.2 Nov 6.9 Dec No Began sampling Nov.
Air Temperature
12.1 30 Jun -5 Jan -
Water Temperature
8.5 21 Jul 0 Jan Feb Mar Nov
Dec
No
Fecal Coliform
120 June 29 sampling.
Velocity 0.332 0.693 Apr 0.0 Jul Sep -
Depth (U/S) 1.92 3.25 Feb 0.33 Jul -
Depth (D/S) 2.65 4.42 Nov 1.5 Jun Sep -
Flow 27.57 68.32 Apr 0 Jul Sep -
Issues within this site include:
• Dissolved oxygen below standard in 3 of 6 samples. • Low flow / no flow situation in summer and fall months.
IRWA RiverWatch Volunteer Monitoring Program: 1997 Final Report
14
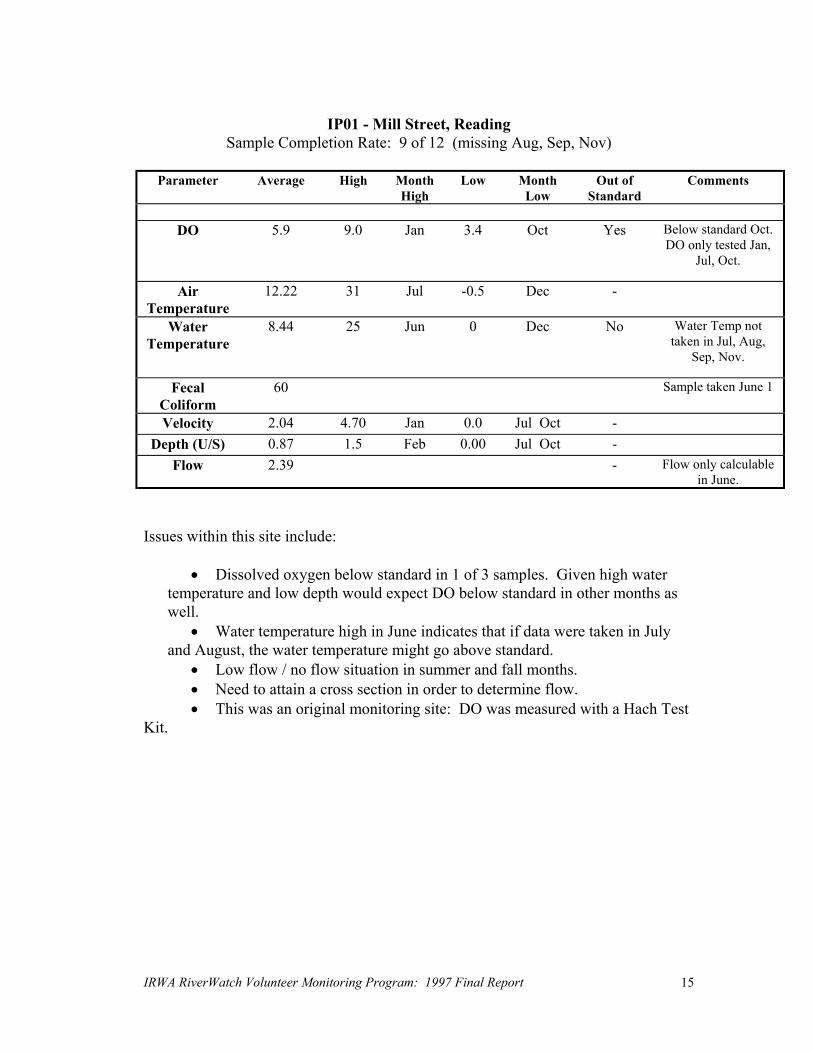
IP01 - Mill Street, Reading
Sample Completion Rate: 9 of 12 (missing Aug, Sep, Nov)
Parameter Average High Month High
Low Month Low
Out of Standard
Comments
DO 5.9 9.0 Jan 3.4 Oct Yes Below standard Oct.
DO only tested Jan, Jul, Oct.
Air Temperature
12.22 31 Jul -0.5 Dec -
Water Temperature
8.44 25 Jun 0 Dec No Water Temp not taken in Jul, Aug,
Sep, Nov.
Fecal Coliform
60 Sample taken June 1
Velocity 2.04 4.70 Jan 0.0 Jul Oct -
Depth (U/S) 0.87 1.5 Feb 0.00 Jul Oct -
Flow 2.39 - Flow only calculable in June.
Issues within this site include:
• Dissolved oxygen below standard in 1 of 3 samples. Given high water temperature and low depth would expect DO below standard in other months as well.
• Water temperature high in June indicates that if data were taken in July and August, the water temperature might go above standard.
• Low flow / no flow situation in summer and fall months. • Need to attain a cross section in order to determine flow. • This was an original monitoring site: DO was measured with a Hach Test
Kit.
IRWA RiverWatch Volunteer Monitoring Program: 1997 Final Report
15

IP02 - Route 28, Reading Sample Completion Rate: 12 of 12
Parameter Average High Month
High Low Month
Low Out of
Standard Comments
DO 4.2 9.0 Dec 1.0 Oct Yes Below standard Jul,
Aug, Sep, Oct. Began sampling Jul.
Air Temperature
12 33 Jun -2.5 Mar -
Water Temperature
9.1 23 Jun 0 Dec No
Fecal Coliform
70 Sample taken June 29
Velocity 0.422 0.970 Apr 0.0 Jul, Aug, Sep, Oct
-
Depth (U/S) 1.66 3.83 Feb 0.33 Sep, Oct -
Flow 19.39 35.0 May 3.78 Jun - Flow only calculable in May, Jun.
Issues within this site include:
• Dissolved oxygen below standard in 4 of 6 samples. • Low flow / no flow situation in summer and fall months. • Need to attain a cross section in order to determine flow.
IRWA RiverWatch Volunteer Monitoring Program: 1997 Final Report
16

IP03 - Central Street, Reading Sample Completion Rate: 8 of 12 (missing March, April, August and September)
Parameter Average High Month
High Low Month
Low Out of
Standard Comments
DO 5.2 12.34 Feb 5.2 Oct No Not sampled Mar,
Apr, May, Jun, Aug, Sep
Air Temperature
15.4 31 Jul 0 Jan, Dec -
Water Temperature
9.0 23 Jun 2 Jan, Dec No
Fecal Coliform
60 Sample taken June 1
Velocity 2.71 6.019 Jan 0.0 Jul -
Flow 3.59 - Flow only calculable in June.
Issues within this site include:
• Low flow / no flow situation in summer and fall months. • Missing summer months in DO data might not show DO dropping below
standard. • Depth readings at this site are inconsistent and in different locations due to
change of monitor in October. Therefore depth is not included here. • Need to attain a cross section in order to determine flow. • This was an original monitoring site: DO was measured with a Hach Test
Kit until October, when a new monitor began testing the site.
IRWA RiverWatch Volunteer Monitoring Program: 1997 Final Report
17

IP04 - Route 62, Reading Sample Completion Rate: 12 of 12
Parameter Average High Month
High Low Month
Low Out of
Standard Comments
DO 6.0 8.4 Dec 4 Aug, Sep Yes Below standard
Aug, Sep. Began sampling Aug
Air Temperature
12.1 26 Jul -3 Dec -
Water Temperature
10.3 20.5 Aug 0 Dec No
Fecal Coliform
160 Sample taken June 29
Velocity 0.350 0.894 Feb 0.0 Oct -
Depth (U/S) 4.53 6.33 Feb 2.43 Jul -
Flow 47.01 Flow only calculable in May.
Issues within this site include:
• Dissolved oxygen below standard in 2 out of 5 samples. • Low flow / no flow situation in summer and fall months. • Fecal level near, but not over, swimming standard. • Need to attain cross section in order to determine flow.
IRWA RiverWatch Volunteer Monitoring Program: 1997 Final Report
18
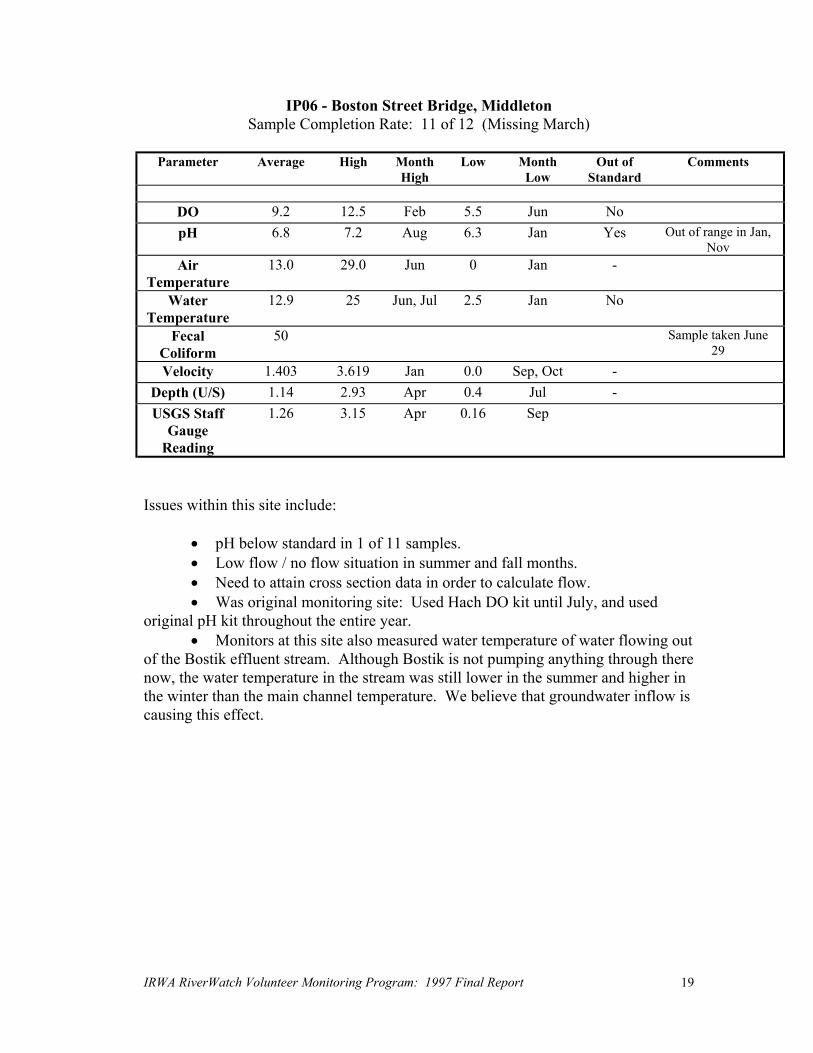
IP06 - Boston Street Bridge, Middleton Sample Completion Rate: 11 of 12 (Missing March)
Parameter Average High Month
High Low Month
Low Out of
Standard Comments
DO 9.2 12.5 Feb 5.5 Jun No
pH 6.8 7.2 Aug 6.3 Jan Yes Out of range in Jan, Nov
Air Temperature
13.0 29.0 Jun 0 Jan -
Water Temperature
12.9 25 Jun, Jul 2.5 Jan No
Fecal Coliform
50 Sample taken June 29
Velocity 1.403 3.619 Jan 0.0 Sep, Oct -
Depth (U/S) 1.14 2.93 Apr 0.4 Jul -
USGS Staff Gauge
Reading
1.26 3.15 Apr 0.16 Sep
Issues within this site include:
• pH below standard in 1 of 11 samples. • Low flow / no flow situation in summer and fall months. • Need to attain cross section data in order to calculate flow. • Was original monitoring site: Used Hach DO kit until July, and used
original pH kit throughout the entire year. • Monitors at this site also measured water temperature of water flowing out
of the Bostik effluent stream. Although Bostik is not pumping anything through there now, the water temperature in the stream was still lower in the summer and higher in the winter than the main channel temperature. We believe that groundwater inflow is causing this effect.
IRWA RiverWatch Volunteer Monitoring Program: 1997 Final Report
19

IP10 - Route 62, Middleton Sample Completion Rate: 12 of 12
Parameter Average High Month
High Low Month
Low Out of
Standard Comments
DO 8.0 10.05 Oct 6.7 Sep No DO sampled in Sep,
Oct, Nov. Air
Temperature 6.2 19 Aug -5 Dec -
Water Temperature
9.0 22 Jun -0.5 Dec No
Velocity 2.34 3.872 Nov 0.769 Sep -
Depth (U/S) 2.35 5 Apr 0.92 Sep -
Flow 43.07 Flow only calculable in June.
Issues within this site include:
• Effects of construction near bridge that is mentioned in comments on data
report. • Need to attain a cross section in order to calculate flow.
IRWA RiverWatch Volunteer Monitoring Program: 1997 Final Report
20

IP11: Peabody Street, Middleton
Sample Completion Rate: 11 of 12 (Missing August)
Parameter Average High Month High
Low Month Low
Out of Standard
Comments
DO 9.2 13.2 Dec 7.25 Jul No DO sampled in Jul,
Sep, Oct, Dec. Air
Temperature 11.5 32.5 Jun -3.5 Dec -
Water Temperature
9.1 23 Jun 0 Jan, Dec No
Fecal Coliform
90 Sampled June 1.
Velocity 1.44 2.214 Apr 0.394 Sep -
Depth (U/S) 2.41 5.5 Apr 0.42 Oct -
Flow 157.07 427.50 Apr 6.04 Sep
Issues within this site include:
• Low flow episode in the summer/fall.
IRWA RiverWatch Volunteer Monitoring Program: 1997 Final Report
21

IP12: East Street (Thunder Bridge), Middleton Sample Completion Rate: 12 of 12
Parameter Average High Month
High Low Month
Low Out of
Standard Comments
DO 8.0 12.2 Dec 4.4 Aug Yes August out of range.
Began sampling in July.
Air Temperature
9.1 29.5 Jun -4.5 Dec -
Water Temperature
8.8 21 Jun -1 Dec No
Fecal Coliform
40 Sample taken June 29
Velocity 0.7 1.8 Apr 0.0 Jul, Sep, Oct
-
Depth (U/S) 5.4 7.4 Apr 3.875 Sep -
Flow 162.7 464.0 Apr 0 Jul, Sep, Oct
Issues within this site include:
• Low flow episode in July, September, and October. • DO below standard in August. • Monitors measure flow each month by estimating cross section.
IRWA RiverWatch Volunteer Monitoring Program: 1997 Final Report
22
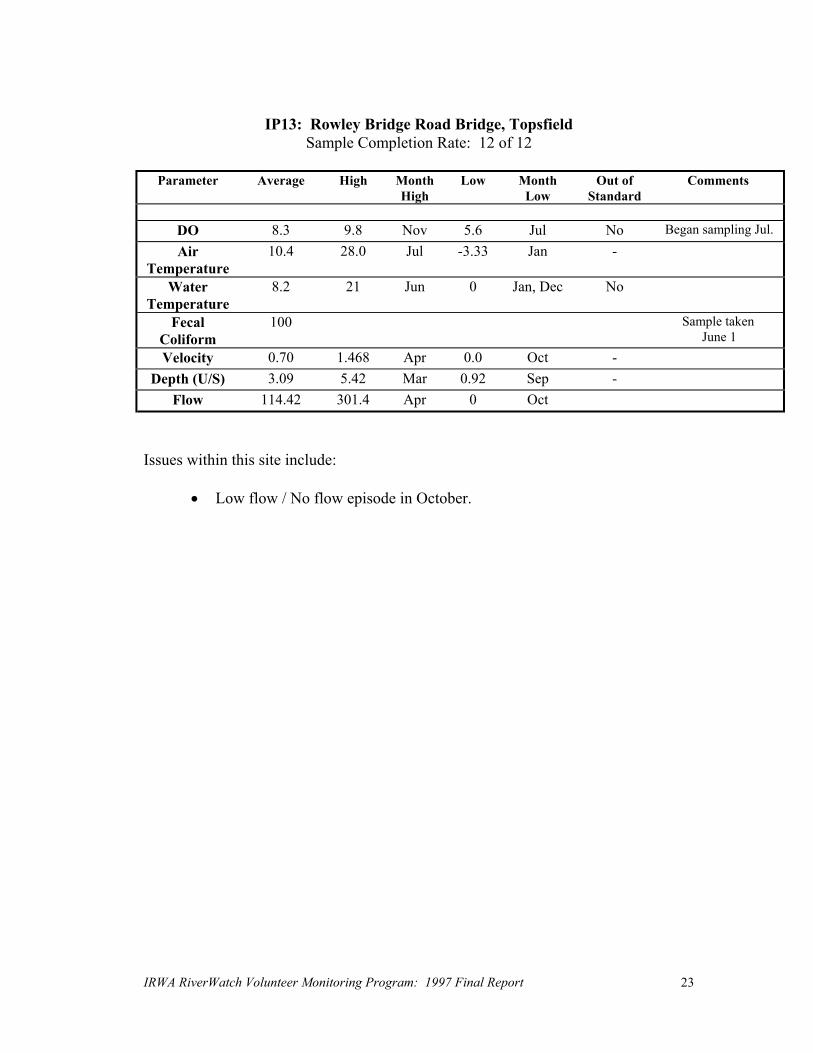
IP13: Rowley Bridge Road Bridge, Topsfield
Sample Completion Rate: 12 of 12
Parameter Average High Month High
Low Month Low
Out of Standard
Comments
DO 8.3 9.8 Nov 5.6 Jul No Began sampling Jul.
Air Temperature
10.4 28.0 Jul -3.33 Jan -
Water Temperature
8.2 21 Jun 0 Jan, Dec No
Fecal Coliform
100 Sample taken June 1
Velocity 0.70 1.468 Apr 0.0 Oct -
Depth (U/S) 3.09 5.42 Mar 0.92 Sep -
Flow 114.42 301.4 Apr 0 Oct
Issues within this site include:
• Low flow / No flow episode in October.
IRWA RiverWatch Volunteer Monitoring Program: 1997 Final Report
23

IP14: Salem Street Bridge, Topsfield
Sample Completion Rate: 12 of 12
Parameter Average High Month High
Low Month Low
Out of Standard
Comments
DO 8.5 12.1 Dec 6.1 Jul No Began sampling Jul.
pH 6.75 6.9 Dec 6.6 Nov No Began sampling Nov
Air Temperature
11.4 27.0 Jun -2.5 Mar, Dec -
Water Temperature
9.4 22 Jun 0 Jan, Dec No
Fecal Coliform
50 Sample taken June 29
Velocity 1.228 2.285 Apr 0.399 Sep -
Depth (U/S) 2.36 5.25 Apr 0.35 Jul -
Flow 163.81 Flow only taken in June.
Issues within this site include:
• pH close to low end of standard. • Need to attain cross section in order to calculate flow.
IRWA RiverWatch Volunteer Monitoring Program: 1997 Final Report
24

IP16: Ipswich River Wildlife Sanctuary Canoe Launch, Topsfield Sample Completion Rate: 9 of 12 (Missing March, August, December)
Parameter Average High Month
High Low Month
Low Out of
Standard Comments
DO 7.7 10.5 Nov 6.2 Jul Yes Began sampling Jul.
Air Temperature
13.8 32 Jul -1.5 Jan -
Water Temperature
11.9 24 Jun, Jul 0 Jan No
Fecal Coliform
30 Sample taken June 1
Velocity 0.351 0.732 Nov 0.000 Jul, Sep, Oct
-
Depth (U/S) 2.36 5.25 Apr 0.35 Jul -
Flow 163.81 Flow only taken in June.
Issues within this site include:
• Low flow / no flow episodes in July through October. • This is not a bridge site, so flow can not be calculated. • Depth was measured from a consistent location near the waters edge.
IRWA RiverWatch Volunteer Monitoring Program: 1997 Final Report
25

IP18: Asbury Road Bridge, Ipswich
Sample Completion Rate: 12 of 12
Parameter Average High Month High
Low Month Low
Out of Standard
Comments
DO 8.0 11.0 Jan 5.8 Oct No Sampled in Jan with
office meter. Then from July on with
LaMotte kit. pH 6.85 6.9 Nov 6.8 Jan No Only sampled in Jan
and Nov Air
Temperature 12.3 32 Jun -1 Mar -
Water Temperature
11.1 26 Jun 0.5 Dec No
Velocity 0.584 1.75 Apr 0.00 Oct -
Depth (U/S) 7.458 9.83 Mar 6.080 Oct -
Issues within this site include:
• Low flow / no flow episodes in October. • Need to attain a cross section in order to calculate flow.
IRWA RiverWatch Volunteer Monitoring Program: 1997 Final Report
26

IP19: Foote Brother’s Canoe, Ipswich Sample Completion Rate: 10 of 12 (missing March and August)
Parameter Average High Month
High Low Month
Low Out of
Standard Comments
DO 7.6 9.5 Apr 5.2 Nov No Sampled in Apr with
old kit. From Oct on with new kit.
pH 6.3 Yes Only sampled in April with old kits.
Air Temperature
13.1 33 Jun 2 Nov -
Water Temperature
11.3 26 Jun 0 Dec No
Velocity 3.246 10.239 Nov 0.258 Feb -
Depth (U/S) 1.5 2 Nov, Dec
1 Sep, Oct - Using data from September on only.
Issues within this site include:
• Need to determine how to monitor for cross section and flow. • pH below standard during only (April) testing. • There is no bridge here, and this was one of the original sites. New monitors were placed on this site in September. They are monitoring downstream of the main dam behind Foote Brother’s Canoe.
IRWA RiverWatch Volunteer Monitoring Program: 1997 Final Report
27
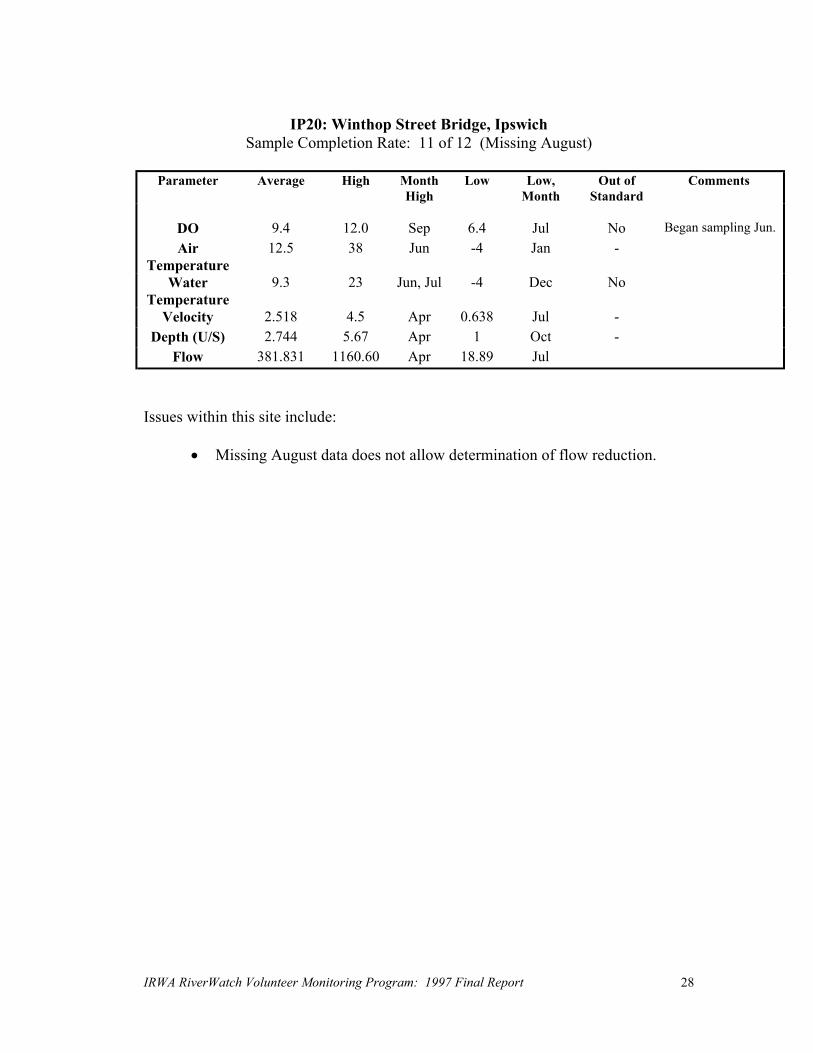
IP20: Winthop Street Bridge, Ipswich
Sample Completion Rate: 11 of 12 (Missing August)
Parameter Average High Month High
Low Low, Month
Out of Standard
Comments
DO 9.4 12.0 Sep 6.4 Jul No Began sampling Jun. Air
Temperature 12.5 38 Jun -4 Jan -
Water Temperature
9.3 23 Jun, Jul -4 Dec No
Velocity 2.518 4.5 Apr 0.638 Jul - Depth (U/S) 2.744 5.67 Apr 1 Oct -
Flow 381.831 1160.60 Apr 18.89 Jul
Issues within this site include:
• Missing August data does not allow determination of flow reduction.
IRWA RiverWatch Volunteer Monitoring Program: 1997 Final Report
28

IP22: Mill Street Bridge, Ipswich Sample Completion Rate: 12 of 12
Parameter Average High Month
High Low Month
Low Out of
Standard Comments
DO 8.4 11.2 Nov 6.6 Sep No Began sampling Jul.
pH 7.0 7.5 Nov 6.4 Dec Yes Out of range in November.
Air Temperature
15 28 Jun, Jul 0 Dec -
Water Temperature
12.6 24 Jun, Jul 0 Nov, Dec No
Fecal Coliform
10 Sample taken June 1.
Velocity 1.062 2.956 Apr 0 Jul, Sep -
Depth (U/S) 3.51 4.4 Apr 2.46 Sep -
Flow 51.01 Flow only taken in June.
Issues within this site include:
• Low flow / no flow in July and September. • Need to attain cross section in order to calculate flow. • pH below standard in December.
IRWA RiverWatch Volunteer Monitoring Program: 1997 Final Report
29

IP24: Sylvania Dam, Route 1A, Ipswich (Tidal) Sample Completion Rate: 8 of 12 (Missing Aug, Oct, Nov, Dec)
Parameter Average High Month
High Low Month
Low Out of
Standard Comments
DO 9.2 13.5 Jan 5.5 Jun No Used Hach kit
pH 7.0 7.5 Jul, Sep 6.5 Jan, Apr
Air Temperature
13.1 27.5 Jun -1 Mar -
Water Temperature
12.2 24 Jun 1 Jan No
Fecal Coliform
40 Sample taken June 29
Issues within this site include:
• Need to determine how to measure cross section and flow and depth at this non bridge site.
• In order to obtain consistent data despite this being a tidal site, this site was moved upstream of the dam to a non - tidal area in 1998.
• This was an original monitoring site. DO and pH were measured with the original monitoring equipment.
IRWA RiverWatch Volunteer Monitoring Program: 1997 Final Report
30

IP25: Green Street Bridge, Ipswich (Tidal)
Sample Completion Rate: 9 of 12 (Sampled each day 3 hours after low tide). (Missing May, September and December)
Parameter Average High Month
High Low Low,
Month Out of
Standard Comments
DO 10.5 11.35 Nov 9.6 Jul No Only Jul, Nov
sampled. Air
Temperature 12.7 38 Jul -2 Mar, Nov -
Water Temperature
10.4 28 Jun, Jul 0 Jan, Nov No
Fecal Coliform
210 Sample taken June 29
Velocity 1.507 3.723 Apr 0 Jul -
Depth (U/S) 2.96 3.92 Nov 2.00 Jul -
Flow 234.2 752.1 Apr 0 Jul
Issues within this site include:
• The sampling methodology of this site is to measure on the sampling weekend 3 hours after Boston low tide. This gives consistency to the data despite being a tidal site.
• Monitors measure flow each month by estimating cross section. • Monitors also measured this site at the normal monitoring time to provide
consistency with the RiverWatch program. That data is not included here, although it is included in the Appendix.
IRWA RiverWatch Volunteer Monitoring Program: 1997 Final Report
31

IP26: Town Wharf, Ipswich (Tidal) Sample Completion Rate: 5 of 12 (Missing January through June, November)
Parameter Average High Month
High Low Month
Low Out of
Standard Comments
DO 7.7 13.0 Dec 5.3 Jul No
Air Temperature
15.3 30.1 Aug 0 Dec -
Water Temperature
9.7 22.5 Aug 0 Dec No
Issues within this site include: • The sampling methodology of this site needs to be reassessed so that consistent
data can be obtained. This is a tidal site where samples are taken from the town wharf on the edge of the river.
CONCLUSIONS Please see the enclosed executive summary for the conclusions from the monitoring program.
IRWA RiverWatch Volunteer Monitoring Program: 1997 Final Report
32

APPENDIX A
All data collected in 1997, organized and graphed by sampling location.
IRWA RiverWatch Volunteer Monitoring Program: 1997 Final Report
33
APPENDIX B
From January to July of 1997, the monitoring coordinator went to each sampling site and took DO, pH, and Temperature readings with a YSI 55 DO meter, and a pH
meter. This program was discontinued after July because each monitoring site had its own kits to test with, and because the six hour difference between the first and last
monitoring times was judged to be too long. The data obtained however, is useful to graph, and shows the correlation between DO and Water Temp, and also shows how Dissolved Oxygen tends be low in the Upper Basin, and higher in the Lower Basin.
IRWA RiverWatch Volunteer Monitoring Program: 1997 Final Report
34