pdf version - netc
TRANSCRIPT

USE OF WOOD WASTE MATERIALS FOR EROSION CONTROL
By Kenneth R. Demars, Richard P. Long and Jonathan R. Ives
Prepared for
The New England Transportation Consortium
April, 2000 NETCR 20 Project No. 97-3
This report, prepared in cooperation with the New England Transportation Consortium, does not constitute a standard, specification, or regulation. The contents of this report reflect the views of the authors who are responsible for the facts and the accuracy of the data presented herein. The contents do not necessarily reflect the views of the New England Transportation Consortium or the Federal Highway Administration.

Technical Report Documentation Page
1. Report No. NETCR 20
2. Government Accession No.
N/A 3. Recepient’s Catalog No.
N/A
4. Title and Subtitle 5. Report Date
APRIL, 2000 6. Performing Organization Code
USE OF WOOD WASTE MATERIALS FOR EROSION CONTROL N/A
7. Author(s) 8. Performing Organization Report No.
Kenneth R. Demars, Richard P. Long and Jonathan Ives
NETCR 20
9. Performing Organization Name and Address 10 Work Unit No. (TRAIS)
University of Connecticut Dept of Civil and Environmental Engineering
N/A
11. Contract or Grant No.
N/A 13. Type of Report and Period Covered
12. Sponsoring Agency Name and Address
New England Transportation Consortium 179 Middle Turnpike University of Connecticut, U-202 Storrs, CT 06269-5202
FINAL
14. Sponsoring Agency Code
(NETC 97-3) a study conducted in cooperation with the USDOT
15 Supplementary Notes
N/A
16. Abstract
Three wood waste materials were evaluated for use as an erosion control mulch and one of the materials was used as an erosion control filter berm. Samples of the three materials were subjected to laboratory tests to determine their physical and chemical properties for comparison with the CONEG specifications for these erosion control applications. Each of the materials was subjected to large scale erosion control testing at a field site with a slope of 1 vertical to 2 horizontal. Fourteen test cells (5’ W x 30’ L each) were prepared with different wood waste treatments; nine contained erosion control mulch applications at thicknesses of ¾ to 3 inch. Two cells were left untreated as reference cells and three other cells were untreated but contained erosion control structures including wood waste filter berm, geosynthetic silt fence and hay bale silt barrier. The erosion control performance of each cell treatment was evaluated for eleven storm events of varying rainfall magnitude and intensity. Calibrated tipper buckets were used to measure the runoff from each cell and collection buckets were used to sample runoff and determine the mass of sediment eroded from each cell. Total rainfall and intensity of each storm was measured with an electronic rain gauge. The results show that wood waste material is very effective at reducing erosion when used as an erosion control mulch at a thickness of ¾ inch or greater. Additionally, the woos waste materials, used for an erosion control berm, were more effective at controlling erosion than a geosynthetic silt fence or hay bale berm.
17. Key Words
wood waste, erosion control, mulch, filter berm, field tests, properties
18. Distribution Statement
No restrictions. This document is available to the public through the National Technical Information Service, Springfield, Virginia 22161.
19. Security Classif. (of this report) Unclassified
20. Security Classif. (of this page) Unclassified
21. No. of Pages
63 21. Price
N/A Form DOT F 1700.7 (8-72) Reproduction of completed page authorized
iii

Table of Contents
Chapter Page
Technical Report Documentation………………………………………………………… ii
Metric Conversion Chart………………………………………………………………… iii
Table of Contents………………………………………………………………………… iv
1. Introduction………………………………………………………………………….. 1
2. Literature Review……………………………………………………………………. 2
2.1 Composting of Natural Materials……………………………………………….. 2
2.2 Surface Erosion…………………………………………………………………. 3
2.3 Natural Materials for Controlling Erosion……………………………………… 4
3. Laboratory Testing of Properties……………………………………………………. 6
3.1 Physical Properties…………………………………………………………….. 6
3.2 Chemical Properties…………………………………………………………… 8
4. Field Testing of Wood Waste Materials……………………………………………. 11
4.1 Purpose of Field Test Site……………………………………………………… 11
4.2 Field Testing Program………………………………………………………… 12
4.2.1 Design of Test Facility…………………………………………………. 12
4.2.2 Construction of Test Installation……………………………………….. 16
4.2.3 Behavior of Field Installation During Storms…………………………. 16
4.3 Testing Program…………………………………………………………………. 17
5. Typical Field Test Data………………………………………………………………. 19
5.1 Storm Event Sampling…………………………………………………………. 19
5.2 Surface Runoff Volumes……………………………………………………….. 21
5.3 Suspended Solids in Surface Runoff………………………………………….. 21
6. Analysis and Discussion of Field Results………………………………………….. 23
6.1 Runoff…………………………………………………………………………. 23
6.2 Amount Eroded………………………………………………………………. 25
6.2.1 Erosion Control Structures……………………………………………… 27
6.2.2 “C” Factors ……………………………………………………………. 28
6.3 Variation of Soil Erodability with Time……………………………………….. 29
7. Summary and Conclusions………………………………………………………….. 31
8. Glossary of Terms………………………………………………………………….. 32
9. References…………………………………………………………………………… 34
iv

Appendices
Appendix A: Photographs of the Field Test Site………………………………… 37
Appendix B: Rainfall- Time Plots at Maximum Storm Intensity ………………. 40
Appendix C: Total Runoff from Test Cells by Storm Events………………….. 47
Appendix D: Sediment Eroded from Test Cells by Storm Event………………. 53
v

1.0 Introduction
Wood Waste Materials have been successfully used in the field by Maine Department of
Transportation to control erosion on slopes and exposed soil surfaces (LaRoche, 1998). The material can
consist of a mixture of bark, wood shavings, wood chips, wood scraps and mineral grit that is a by-
product of the lumber, paper, construction or other industries. Use of this material requires that its
physical and chemical characteristics be tested with accuracy and that its performance be documented
quantitatively. Specifications for source separated composts have been developed by the Coalition of
Northeastern Governors Source Reduction Task Force (CONEG), February 1996. This set of
specifications contains such things as the desired particle size distribution or pH of the compost but does
not contain testing protocols for the various properties. As a result, some wood waste materials that show
the desired result of controlling erosion in the field do not have laboratory testing protocols that predict
this behavior. Research relating laboratory test results to field behavior will allow Wood Waste Materials
to be more widely used.
While CONEG has identified six applications for composts and mulches that are derived from
source separated materials, only the applications as an erosion control mulch and an erosion control filter
berm are being considered for wood waste materials. It is possible that wood waste materials may find use
in the four other CONEG applications including 1) general use compost, 2) compost manufactured loam,
3) compost amended loam (topsoil), and 4) horticultural mulch. These applications would also depend on
the physical and chemical characteristics of wood waste materials; properties which are known to vary
from producer to producer depending upon the feedstock and processing. These applications are the topic
of another study.
A previous project evaluated the effectiveness of source-separated compost for controlling
erosion on slopes (Demars and Long, 1998). That study showed that source-separated compost controlled
erosion at thinner applications than considered by the CONEG (1996) Specifications. This research looks
at the effectiveness of using wood-waste material with various thicknesses to control erosion on soil
slopes and as an erosion control filter berm.
The overall objective is to quantify the properties and behavior of wood waste materials for use as
a medium to control erosion. Specific objectives of this study are to examine the effects of different wood
waste materials as erosion control mulch when applied to slopes at a thickness of ¾ -inch up to 3 inches.
Also, the limits of stability on a slope and shear strength of each material will be measured and compared
to the soil it is used to protect. A comparison will be made of wood waste material used as filter berms as
an alternative to conventional hay bales and geosynthetic silt fences as erosion control barriers. This
investigation uses a combination of laboratory and field testing methods.
1

2.0 Literature Review
2.1: Composting of Natural Materials During the past twelve years, reuse of material has become an important component in solid waste management in the United States. A popular method has been composting (Composting Council, 1994; Pettigrew, 1996; Hoitink and Keener, 1993; NRAES, 1992). This method has also been used in other parts of the world where resources are limited (van Veldhuijsen, 1974; Oosthnoek and Smit, 1987; Baliff and Herre, 1988; Fricke and Vogtmann, 1993; Fullen et al, 1999). Similarly, the processes of turning timber into lumber or paper as well as the operations of processing tree stumps removed from construction sites, produce voluminous waste products that should be put to some worthwhile use. Wood-waste materials and composted materials have similar functions in preventing soil erosion. The wood chipping, grinding and composting processes convert large portions of the municipal solid waste stream into a versatile substrate that has potential applications in agriculture for soil amendment (Koch, 1965; Knoop et al, 1991: Shiralipour et al, 1992), in environmental industries for trace metal removal from water (Selby, 1986; W & H Pacific, 1992) and in the transportation and construction industries for erosion control (Anderson, 1996; Henry and Bush, 1996; Dunlap, 1997; Haynes, 1997 and Cal Trans, 1999). The US Environmental Protection Agency has published a comprehensive manual on the processing and use of composted material from yard trimmings and municipal solid waste (US E.P.A., 1994). Applications of composted materials for erosion control and as soil amendments are used in many parts of the world (Oosthnoek and Smit, 1987; Ballif and Herre, 1988; Muller and Riccabona, 1984).
Besides wood-waste materials, there are several materials that can be successfully used once composted to prevent erosion: yard trimmings, food waste, biogenic residue, wood waste, and paper waste. The primary products of the composting process are substances that can be used as a soil amendment or a mulch, but there are other advantages of composting including volume reduction, increased recycling, and reduction of organic matter in the landfills and incinerators. These products are finding more and more uses (Shiralipour et al. 1992). Their primary benefits are to enhance the ability of soil to support plant growth by fostering the various activities that plants need from water retention to microbial life. Knoop et al. (1991) published a comprehensive literature review. They approached compost quality from various aspects: chemical, biological, and physical, and organized the information with respect to the source of the organic matter and contaminants. Their report also addressed operational concerns such as leachate, odor, and worker health. The review of the available literature on the use of natural materials to prevent erosion indicated that chemicals from the materials are a concern. The composting process shows that, depending on the
2

source of the compost, the toxicity of the leachate should be checked as well as the pH (for environmental suitability and plant growth). The compost must be stable to insure no deleterious effects on the plantings. In addition, there is always concern about quality of the composted material as well as the health and safety aspects of compost processing and application (Boutin and Moline, 1987; Fricke and Vogtmann, 1993; Hutchins et al., 1985; Inbar et al., 1990). A complete review of the production and quality of composted material is beyond the scope of the present work, since the object of the present work is the use of wood waste materials to prevent erosion on construction sites.
2.2: Surface Erosion Soil erosion has been a concern since farmers and others realized that erosion carries away the layer of soil most important to growing plants and grains (Maass et al. 1988; Schuch and Jordan, 1989). Becoming aware of the effects of environmental damage, measures to prevent erosion were used during highway construction. Use of composted material and mulch has been one of the recognized techniques for reducing or eliminating erosion on the construction site (Israelson et al., 1980 a&b; Sollenberger, 1987). The use of composted material to control erosion is, of course, not limited to construction sites (Henry and Bush, 1996; Haynes, 1997). Recently, the use of composted material by departments of transportation has increased in an attempt to use more environmentally friendly techniques (Mitchell, 1997). The similarities of wood waste material to compost are what prompted this study. Soil erosion is a complicated interaction between rainfall and runoff and is affected by type of soil, local rainfall pattern, slope length, slope steepness, land cover, and management practices (Wischmeier and Smith, 1978). There have been several attempts to combine these factors into an equation for predicting the loss of soil from a site. The Universal Soil Loss Equation (Ellison, 1944) had been the workhorse until 1985 when the US Department of Agriculture and other researchers decided to update the equation with the latest research results (Renard et al., 1994). The Revised Universal Soil Loss Equation (RUSLE) can be written: A = R K L S C P (2.1) where: A = the computed soil loss, R = the rainfall intensity factor, K = soil erodibility factor, L = the slope length factor, S = slope steepness factor, C = the cover-management factor and P = the supporting practices factor. The rainfall-runoff erosivity term, R, is the product of storm kinetic energy times the maximum 30-minute storm depth and summed for all the storms in a year. The "K" factor is a measure of the inherent erodibility of a given soil under the standard conditions and maintained in continuous fallow.
3

Values of K range from about 0.10 to 0.45. The "C" factor can be the most important since it can be manipulated to decrease the erosion. It is not necessarily constant throughout the year. The "P" factor represents surface conditions and how they affect flow paths and flow hydraulics.
2.3: Natural Material to Control Erosion The use of natural material to reduce erosion has been well established in certain applications. Much work has been done with composted material. The similarities of wood waste material suggest that the findings for one will apply to the other. Soil erosion has been controlled with compost materials in the vineyards of Europe (Ballif and Herre, 1988; Banse, 1962; Klaghofer et al., 1990; Koch, 1965) and in general applications ( Bloom, et al., 1984; Horner et al., 1989; van Veldhuijsen, 1974). Ballif and Herre (1988) researched the effect of composted material on preventing the erosion of soil in a vineyard in the Champagne area of France. The experiment compared soil erosion with and without compost and with and without vehicle traffic. The results showed that applying compost to the area caused a decrease of two orders of magnitude in the amount of eroded material on a weight basis. Muller and Riccabona(1984) studied the effect of composted material on the erosion of slopes of 1 vertical to 5 horizontal. The slope was divided into cells and arranged so those erosion products could be collected and measured. They applied the compost in thickness of about 4.5 and 9 cm and tilled each cell to a depth of 10 cm. The original intent was to expose their system to natural rain but not enough occurred. They then decided to use an artificial rainmaker. The effect of the compost was masked by substantial growth of vegetation. The cell in which 4.5 cm of compost was tilled into the soil performed best. Another experiment, similar to the one proposed for the research in the present study, was used by Klaghofer et al. (1990) to study erosion on slopes north of Eisenstadt, Burgenland, Germany. The slopes studied varied between 5o and 11o to the horizontal. The parcels with the most compost showed the most erosion loss, a fact attributed to the handling of weeds by plowing them in instead of treating them with chemicals. Slick and Curtis (1985) indicated that composted MSW is susceptible to erosion under light rainfall because of its lightweight and small particle size. In addition, there is some concern about health risks with the use of MSW and sewage sludge composts (Sollenberger, 1987) In a recent demonstration project (W&H Pacific, 1993), test cells on a slope were used to evaluate several types of compost for erosion protection of the soil. They tested composted materials on slopes as
4

steep as 1 vertical to about 2.5 horizontal. The composted materials showed results equivalent to the hydro-mulch application, which is an approved method of erosion control by many state Departments of Transportation. The literature review indicated that our approach should be successful in comparing the erosion protection of wood waste material to other currently used methods.
5

3.0 Laboratory Testing of Properties
Several samples of materials were acquired from producers prior to and during field installation.
All samples were subjected to laboratory testing for physical properties and some additional chemical
tests for toxicity assessment were completed before these materials were placed at the field test site. The
samples included three wood waste materials consisting of one paper mill wood waste and one pine bark
mulch produced by Cousineau Forest Products of Strong, ME and one ground stump/wood waste mulch
produced by ConnDOT in Enfield, CT. The test procedures that were used are American Society for
Testing and Materials (ASTM, 1999) standard tests for soils, peat, and other natural aggregates. Because
there are some limitations in applying soil test methods, a “Best-fit” of existing standards was tried with
the available wood waste materials.
3.1: Physical Properties Particle size distribution curves are shown in Figures 4.1 for the wood waste materials that were sampled. These results show that there is some variation in the gradation of wood waste materials among producers. In addition, it depends, as expected, on the blend of raw products and the degree of pre- and post-treatments including sorting, shredding, grinding, chipping, composting, and sifting, etc. All of these materials are well-graded with uniformity coefficients (U=d60/d10) greater than about four or five where d60 and d10 are particle diameters at 60 and 10 finer by weight, respectively. They are all comprised of coarse-sized particles with over 70 % by dry weight greater than 1 mm diameter plus a small quantity of fine-sized particles. These gradation curves were obtained from conventional sifting tests (ASTM D-422) used for construction aggregates and at first glance appear appropriate for wood waste material. Yet, wood waste material particles have a lower density than mineral aggregates and many particles in wood waste have an elongated (needle) or chip (plate) shape that may require different test procedures. Also, many of the finer particles would not pass through a fine sieve during vibration because of their light weight so many of the sieve tests were limited to coarser sieves of #20 (0.840 mm) or greater. The paper mill wood waste was observed to have a larger quantity of inorganic gravel and sand particles than the other wood waste materials. Some additional physical properties tests were performed on the available wood waste materials and the results are presented in Table 3.1. These included organic matter content (OMC), dry unit weight and friction angle. The OMC was measured by loss on ignition at 440 C after oven drying at 110 C (ASTM D-2974). Four specimens from each sample were tested because the muffle furnace could only handle a specimen with a mass of about 150 to 200 g and some of the samples (such as paper mill wood waste) had single particles with a weight of 50 g or more. A mechanical splitter was used to select the specimens and the larger oversize particles were divided with prunning pliers. The organic matter
6

contents are shown in Table 3.1. The smallest organic matter contents were for the paper mill wood waste and ground stump mulch which have the highest portion of inorganic gravel particles from processing.
0
10
20
30
40
50
60
70
80
90
100
0.1110100P artic le S ize (m m )
Perc
ent F
iner
by
Wei
ght
G round S tum p M ulchP ine B ark M ulchP aper M ill W ood W aste
Figure 3.1: Gradation Curves for Wood Waste Samples
Table 3.1 Physical Properties of Wood Waste Samples
Material Organic Matter * Content (% dry weight)
Dry Unit Weight** (lbs/cu. ft.)
Friction Angle (degrees)***
Ground Stump Mulch
63.6 (55.9 – 70.5)
11.2, 14.1, 15.0
47.5
Pine Bark Mulch
94.3 (91.4 – 95.6)
9.6, 11.3, 14.4 48.8
Paper Mill Wood Waste
35.6 (28.9 – 43.0)
36.1, 47.7, 48.6 43.1
* - Average of four samples, ( ) - Range ** - Loose, After vibration, After 100 pound load ***- Average of 3 tests
Further, the paper mill wood waste and pine bark mulch have experienced some composting which should
reduce OMC compared to the ground stump mulch which was not composted.
7

The dry unit weights were measured by placing the oven-dried materials into a 6-inch
diameter steel Proctor mold and determining the volume under three different conditions. The material in
the steel mold was initially compressed with a 3-pound plate to obtain a loose condition, followed by
confined vibration on a shake table for 2 minutes to create a medium dense condition and, finally,
compressed with a 100 pound weight to obtain a dense condition. The ground stump and pine bark
mulches each have very low dry unit weights that are less the 15 lbs./cu. ft. In comparison, the paper mill
wood waste has a much higher dry unit weight of up to 50 lbs./cu. ft. because of the significant quantity
of inorganic material it contains.
The friction angle for each material was measured with a tilt table that was built from a pine
board. The board surface was roughened by gluing mulch particles with a diameter up to ¼ inch size to
the surface. A 2 to 3-inch thick layer of material was then placed loosely on the roughened surface and
was contained on the sides by a cardboard box. The board and material was then tilted until mass
movement (sliding) of the material occurred and the slope angle was measured. This process was repeated
three times for each material to assure repeatability. The friction angles were all greater than 43 degrees
and were about the same as the friction angle of 46 degrees measured for base soil (see Figure 4.1) that
these materials were applied on at the field test site. These friction angles are significantly greater than the
slope angle at the field site of 1 vertical to 2 horizontal, which is 26.6 degrees. Thus all of these materials
are expected to be stable under the gravimetric forces that are imposed during the field tests.
3.2 Chemical Properties Some of the chemical properties specified by CONEG for useable composts and mulches
are presented in Table 3.2 for the three wood waste materials tested in this study and for the base soil at
the test site. The stability is a measure of the degree of composting of the raw feedstock. This parameter
was measured using the Solvita test with a numerical system from one (1) for raw non-composted
feedstock to eight (8) for fully composted/ biodegraded and cured materials. This test verified that the
Ground Stump Mulch was fresh raw material and the other two materials are further along in the
composting process as evident from their color and appearance. CONEG recommends that erosion control
materials should be very stable to stable which is not the case for the fresh ground stump material.
The pH and conductivity were measured on a supernatant produced from mixing 50 g of dry
material with 500 g of de-ionized water for 16 hours. The liquid was separated from the material and the
pH and conductivity were measured with a probe according to manufacturer specifications. The CONEG
specifications require the pH to fall within the range of 5.5 – 8.0 and the conductivity should be less than
4.0 mmhos/cm (dS/m). All of the wood waste materials satisfy the conductivity requirement and most
satisfy the pH requirement except for the Pine Bark Mulch which tends to be slightly more acidic than the
specifications allow.
8

Table 3.2 Summary of Chemical Properties for Wood Waste Materials
Material Stability * pH ** Conductivity*** (mmhos/cm)
Ground Stump Mulch Fresh Raw Compost (1) 6.99 3.88
Pine Bark Mulch Finished Mature Compost (6-7)
4.86 3.14
Paper Mill Wood Waste
Past Active Compost Ready to Cure (5)
7.51 1.8
Base Soil N.A. 6.60 0.55
*- based on Solvita Test Number ( ) ranging from 1= raw to 8 = finished
**- based on compost/ de-ionized water ratio = 1/10 by weight
***- based on compost/ de-ionized water ratio = 1/10 by weight,
conductivity = 0.031 mmhos/cm for de-ionized water
Each of the wood waste materials and base soil from the field test site was subjected to chemical
analysis for heavy metals. This step was taken to insure that no undesirable contaminants would be
present in the wood waste material used at the field test site. Representative samples of each material
(including the base soil) were submitted to the University of Connecticut’s Environmental Research
Institute for analysis of 20 metals that are routinely evaluated for characterization of contaminated
materials. The results of the tests are presented in Table 3.3 with units of parts per billion (ppb). The
materials were prepared using the Synthetic Precipitation Leaching Procedure (SPLP) method and the
leachate was analyzed using Environmental Protection Agency (EPA) approved testing protocols. None
of the elements tested are close to the EPA limits specified for hazardous materials.
9

Table 3.3 Summary of Metals Analysis for Wood Waste Materials and Base Soil
PROJECT: Wood Waste CompostDate Samp.Received: 03/11/99 Matrix: SPLPDate Samples Prep.: 03/23/99 Prep. Method: 3010aDate Samples Analyzed: 03/31/99 Analysis Method: 6010aSample Concentration : (ug/L) Sample Sample ICP - AES GFAA CVAAField ID# Lab ID# Al Ba Ca Cd Co Cr Cu Fe K Mg Mn Na Ni Pb Se Sn V Zn As Hg
Base Soil MAR990564 370 15 2628 1 2 3 71 464 1123 458 396 9339 3 7 ND ND ND 14 ND ND
Stump Grindings MAR990565 477 23 11670 ND 2 6 56 643 18500 3951 220 23910 6 17 ND ND 5 64 10 ND
Pine Bark Mulch MAR990566 261 30 5388 ND ND 4 45 355 27550 1937 289 20000 ND 7 ND ND ND 30 91 ND
Paper Mill Wood Waste MAR990567 475 31 8631 ND 3 4 44 490 5481 1978 822 23810 5 ND ND ND ND 55 ND ND
Detection Limit 10 1 5 1 2 3 1 5 10 5 1 10 3 5 10 10 5 5 2 0.2
NOTE: All units are in ppb (ug/L) NOTE: ND is not detected
SPLP is Synthetic Precipitation Leaching Procedure ICP-AES Inductivity Coupled Plasma--- Atomic Emission Spectroscopy GFAA Graphite Furnace Atomic Absorption CVAA Cold Vapor Atomic Absorption
10

4.0 Field Testing of Wood Waste Materials 4.1 Purpose of Field Test Site A field test site was selected at a ConnDOT maintenance facility at the junction of Routes 32 and 74 in Willington, CT. The site is the west slope of the facility near Route 32. It was selected because 1) it is long enough to accommodate a large number of test cells; 2) has a slope of two horizontal to one vertical (26.6 degrees), the steepest soil slope normally used by ConnDOT; and 3) the base soil is an easily eroded silty - sand with some gravel. The particle size distributions for two samples of this base soil (A and B) are shown in Figure 4.1 with silt-size particles comprising about 25 to 40% of the total soil mass. However, at a slope of 1 on 2, particles in the coarse sand to fine gravel size may also be eroded if no erosion protection is provided.
0
10
20
30
40
50
60
70
80
90
100
0.0010.010.1110100
Particle Diameter, mm
Perc
ent F
iner
Soil ASoil B
Figure 4.1: Gradation Curves for Two Base Soil Samples from Field Test Site
Based on the types of wood waste material available, the desired combinations of surface treatments and thickness to study for erosion prevention, it was decided to install fourteen test cells. The cells were arranged as shown in Figure 4.2 and were designed to contain the treatments summarized in Table 4.1.
11

Table 4.1: Surface Treatments Used in the Test Cells.
Cell No. Surface Treatment
1 Paper Mill Wood Waste @ 3.0”
2 Paper Mill Wood Waste @ 1.5”
3 Paper Mill Wood Waste @ 0.75”
4 Control (Untreated)
5 Pine Bark Mulch @ 3.0”
6 Pine Bark Mulch @ 1.5”
7 Pine Bark Mulch @ 0.75”
8 Geotextile Silt Fence
9 Hay Bale Barrier
10 Filter Berm of Paper Mill Wood Waste
11 Control (Untreated)
12 Stump Grindings Mulch @ 3.0”
13 Stump Grindings Mulch @ 1.5”
14 Stump Grindings Mulch @ 0.75”
Note: All wood waste and chip materials were used in this project as a mulch that was placed over the soil and not blended.
4.2: Field Testing Program
4.2.1: Design of Test Facility
Fourteen test cells were prepared on a soil slope at an angle of two horizontal to one vertical. Each cell was 30 feet (9.1 m) long by 5 feet (1.5 m) wide with a 3 foot (0.9 m) long apron to collect runoff as shown in Figure 4.3. Cells were separated from each other and the surrounding area by 1 in. x 6-in. (25 mm x 150 mm) boards recessed into the soil about 1.5 inches (38 mm). In the lower 3-foot (0.9 m) apron of each cell, a polyethylene sheet covered the soil so that runoff and the eroded particles could be more readily conveyed to the tipper boxes where the flow rate could be measured. Each tipper box was calibrated in the laboratory to determine flow volume per tip and the number of tips per storm was recorded with a mechanical digital counter. The flow from the tipper box was released thru 5 discharge holes, each with a 2-inch diameter. The center hole of each tipper box was connected to a covered collection bucket at the bottom of the slope to obtain a representative sample of eroded sediment. Details of covered collection bucket arrangement are shown in Figure 4.4. A one-bucket arrangement for the collection of eroded solids was used and there was no attempt to determine if there was a difference in materials that eroded early in the storm as contrasted with those that were carried away later in the storm.
12

The erosion control filter berm was made from Paper Mill Wood Waste in cell #10. A plywood riser was attached to 1 in. x 6 in. side boards of the cell to develop support for the plywood. A jute mesh was applied at the end to support the berm, which was placed between the plywood risers to form a slope similar to that specified by CONEG. The end of the cell had the same polyethylene covering of the natural soil as the other cells so any of the eroded materials and runoff water passing through the berm could be measured with the tipper boxes, collected and analyzed for suspended solids.
13

14. Ground-Stump Mulch @ 0.75" 13. Ground-Stump Mulch @ 1.5" 12. Ground-Stump Mulch @ 3.0" 11. Control 10. Wood Waste Filter Berm 9. Hay Bale Berm 8. Geosynthetic Silt Fence 7. Pine Bark Mulch @ 0.75" 6. Pine Bark Mulch @ 1.5" 5. Pine Bark Mulch @ 3.0" 4. Control 3. Paper Mill Wood Waste @ 0.75" 2. Paper Mill Wood Waste @ 1.5" 1. Paper Mill Wood Waste @ 3.0"
N
Figure 4.3. Layout of Cells
14

15
NOTE: Boards staked every 5' to prevent flow between cells and surrounding areas.
5'
1" x 6" Boards around each cell
30'
2.5'
PVC Pipe Black Polyethylene Sheet
Tipping Flow-Box
Plastic Collection Bucket
Figure 4.4. Typical Wood Waste Test Cell

1" x 6" Boards
1 Plywood Riser
2 Wood Waste Filter Berm
Jute Mesh
Figure 4.5. Test Cell with Erosion Control Filter Berm
4.2.2: Construction of Test Installation The ConnDOT contractor built the test facility to specification in May 1999. The site was visited during construction to insure proper configurations of the cells. The initial installation was equipped with six tipper boxes to measure flow and eight of the cells contained no flow measuring capability other than the volume collected in the sample bucket. However, the first rainfall after completing the installation showed the importance of flow measurements and tipper boxes were added to all test cells. Also, a need for improved rainfall data resulted in the addition of an electronic rain gage with capability to measure magnitude and intensity. The installation was completed by mid June.
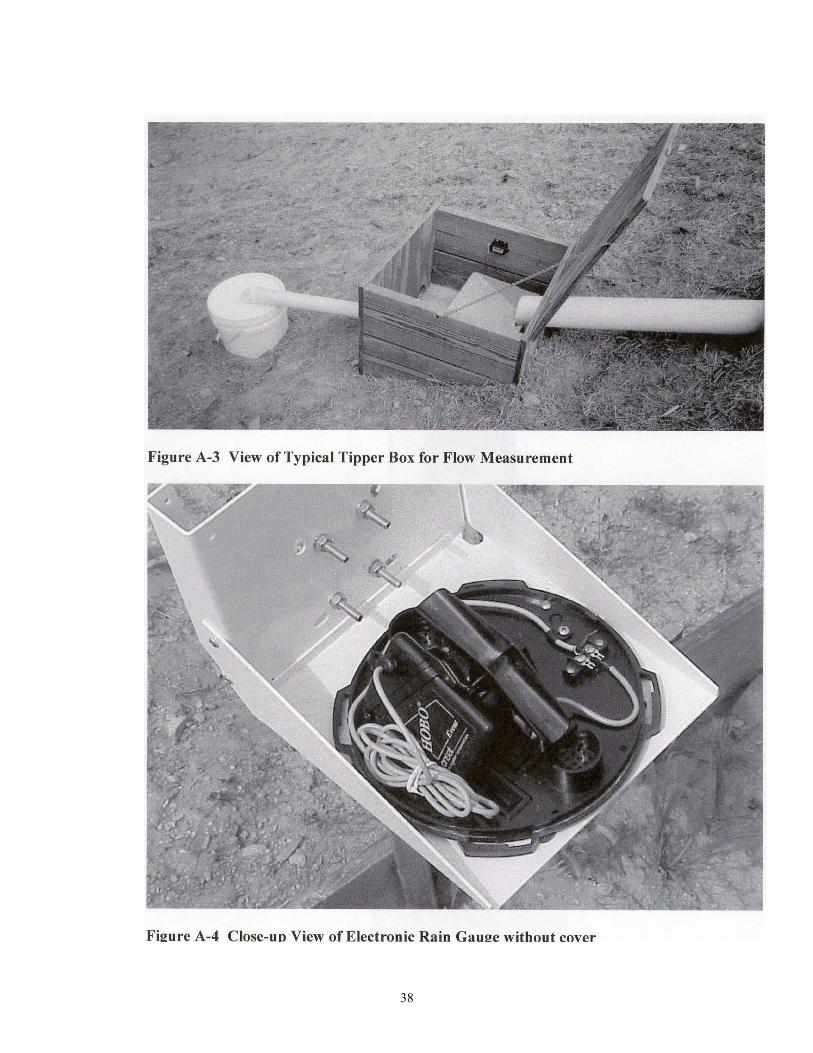
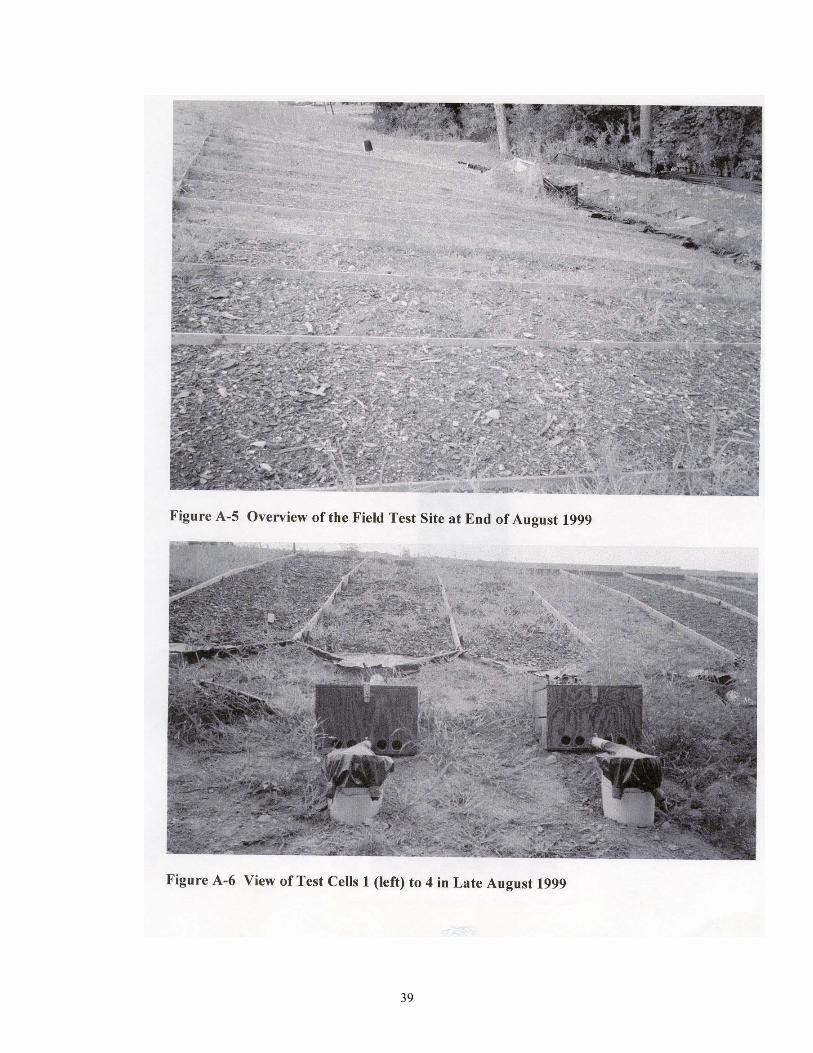
Several photographs from the field test site are presented in Appendix A. Figures A-1 and A-5 show overviews of the site after installation in mid May 1999 and at the end of August 1999, respectively. Some plant growth (volunteers) had established during the summer months. A close-up view of the paper mill wood waste filter berm, hay bale and geosynthetic silt fence treatments is presented in Figure A-2 after installation in May. Figure A-3 shows a view of typical tipper box with entrance pipe, tipper tray and mechanical counter. A view of the electronic rain gauge with cover removed and mounting stand is shown in Figure A-4. A view of the test cells #1 to 4 are shown in Figure A-6 as they appeared in late August 1999 with some plant growth.
4.2.3: Behavior of Field Installation during Storm Events .A number of small leaks in the flow and collection system were detected during the first few storms in May and June. These leaks were corrected and the system began to function as designed. However, during some very heavy or intense storms, the sediment load from the untreated control cells
16

(cells #4 and 11) was more than the tipper flow boxes could handle and the tipper trays remained full of sediment and permanently in the tipped position with flow continuing unmeasured. This condition never happened in any of the other test cells. In late September 1999 at the end of the field test program, some construction grading and asphalt paving of the parking area above the test site lead to increased flow of water across test cell #4 during the last storm event on 9/30 – 10/4. Some rill erosion was observed in this test cell when the rainfall data and water samples for this storm event were collected.
4.3 Testing Program An objective of the testing program was to evaluate the performance of the various surface
treatments when subjected to the expected range of rainfall magnitude and intensity. This was difficult to
achieve because of the random nature of storms but was accomplished by visiting the field site after each
storm for the period of June through mid-October. As noted earlier, an immediate decision was made to
either sample and record data from a storm or to clean up the site, and disregard the data, in anticipation
of the next storm. This decision was made based on the rainfall accumulations measured in two simple
rainfall site gauges and the flow volumes discharged from each cell that was measured by the tipper
boxes. Fewer than 10 tips of the bucket in the control cells indicated that there had not been enough
runoff from the treated cells to make any meaningful measurements.
In addition to the two simple rain gauges placed at the field site, one automated tipping-bucket
rain gauge was used for more precise rainfall data. The two simple rain gages were only used with tipper
box data for screening a storm event to decide if a thorough sampling and analysis of the test cell and
storm data was warranted. They were used to measure the approximate amount of precipitation falling on
the immediate area during each storm but provided no information about storm intensity. The automated
tipping bucket rain gauge was used to determine rainfall magnitudes to an accuracy of 0.01 inches of
rainfall / tip. An electronic data logger was used to record the time for each tip of the bucket; thus, the
rainfall intensity could be determined. The electronic data logger uses a microprocessor chip to store the
data and was purchased with software so that the data could be downloaded to a personal computer.
A typical rainfall-time plot for the July 19, 1999 storm is shown in Figure 4.7. as produced by the
data logger computer software. Each dot on the graph represents 0.01 inch of rainfall at the time of day
that the rainfall occurred. The slope of the curve represents the rainfall intensity. For purposes of
analyzing the flow and solids eroded from each test cell, the total rainfall and maximum intensity of the
most significant part of each storm were determined. In some analyses, an “average” intensity was used
but in all instances, the method of determining intensity is approximate.
17

y = 36.923x - 20.845R2 = 0.9877
0.15
0.2
0.25
0.3
0.35
0.4
0.45
0.5
0.55
0.6
13:25 13:30 13:35 13:40 13:45 13:50 13:55 14:00
Time (24 hour)
Rai
nfal
l (in
)
7/19/99 Rainfall Event ATotal Rainfall = 0.38 in = 9.7 mmIntensity = 1.54 in/hr = 39.1 mm/hr
Figure 4.7 Typical Rainfall – Time Graph for 7/19/99 Storm
The summer, from June through July, was a very dry period with most rainfall occurring from
thunderstorms of short duration and high intensity. It was common to have two or more storms (bursts of
rainfall) in one day or over a weekend period. Multiple rainfall events during a day or over a weekend are
treated as one storm event unless the site was sampled and data obtained between storm events as was
achieved on 7/19/99 where the two storms are designated as “A” and “B”. Storms occurring from August
onward tended to be of higher magnitude and lower intensity.
18
5.0 Typical Field Test Data
5.1 Storm Event Sampling
Preparation of the test site was completed in late April 1999 and all surface treatments were in
place with appropriate thickness and cleaning completed by 6 May 1999. All test cells had tipper boxes
installed by mid June at which time the electronic rain gage was placed at the site. None of the cells were
seeded or stabilized other than by the wood waste surface treatments. Weed control was performed every
month or so with a spray-on weed killer. Occasionally, some weeds were pulled or cut to keep roots from
developing as an erosion retardant. As a result of weed control, the late fall storm events were expected to
test the erosion resistance of these surface treatments before growth could be established.
The storm events sampled along with their total rainfall and intensities are summarized in Figure
5.1. Eleven storm events with rainfalls greater than 6 mm (1/4 inch) were sampled before subfreezing
weather set-in during early November. The rainfalls varied from 6 mm to a maximum of 110 mm (4.35
inches) for Hurricane Floyd on 9/16/99. Some of the storms were very intense and, for brief periods,
exceeded the capacity of the tipping bucket rain gauge. For each storm event, the maximum intensity
level was estimated from the rainfall – time data such as that shown in Figure 4.7. The maximum rainfall
intensities for each storm are also shown in Figure 5.1. Some storms were also accompanied by heavy
winds. The combination of wind and runoff resulted in some disturbance (toppling) of the runoff
collection system. Runoff samples were described by a number system that includes the test cell number,
and storm date, such as, 3-7-6 for cell 3, and the storm on July 6, 1999. Only one test cell (Cell 4)
experienced some rill erosion during the test period and that was a result of uncontrolled drainage from
the parking area above during paving operations in late September.
19

������������������������
�����������������������������������
������������������
������������������
������������
������������������������
������������������������������������������������
������������������������������
�������������������������������������������������
������������������������������������������������������������������������������������������������������������������
������������������������������������������������������
0
20
40
60
80
100
120
7/1/
99
7/2&
4/99
7/6/
997/
19/9
9 A
7/19
/99
B
7/24
/99
8/14
/99
9/6/
99
9/10
/99
9/16
/99
9/30
&10/
4/99
Storm Date
Tota
l Rai
nfal
l (m
m) a
nd In
tens
ity (m
m/h
r)
����
(mm/hr)
(mm)
Figure 5.1 Summary of Storm Events Analyzed
A day or two after a storm event, each runoff collection bucket was sub-sampled with a 50 ml
plastic vial for analysis of suspended solids in the runoff water. Sampling was achieved by stirring the
contents of the bucket to create a homogeneous suspension and submerging the sampling vial to obtain a
representative specimen. In the laboratory, the contents of each vial was oven-dried and weighed on an
analytical balance to determine the suspended solids concentration for each collection bucket in g/l. These
suspended solids measurements are an indicator of average erosion from each cell treatment and storm
event, and are combined with the total runoff measured by the tipper boxes to determine the mass of
sediment particles eroded from a slope. The mass of sediments eroded from each cell had to be corrected
for the mass of coarse particles that tended to collect on the apron at the bottom of a slope and not enter
the collection system. Thus, each apron was cleaned following a storm event and the mass retained on the
apron was added to the mass of solids that flowed through the tipper boxes. All collection buckets and
tipper boxes were washed and flushed with water before reconnecting to the system in anticipation of the
next storm event.
20

����������������������������
���������������������
��������������
������������������������������������������������������������������������������������������������������������������
������������������������������������������
�����������������������������������
�����������������������������������������������������������������������������
��������������������������������������������������������������������������������������������������
������������������������������������������������������������������������������������
��������������������������������������������������������������������������������������������������������������������������������������������
���������������������
���������������������
���������������������
0
20
40
60
80
100
120
140
160
1 2 3 4 5 6 7 8 9 10 11 12 13 14Test Cell
Tota
l Run
off (
L)
7/2&4/99Total Rainfall = 1.06 in = 27 mmIntensity = 0.71 in/hr = 18.0 mm/hr
Figure 5.2. Typical Rainfall Runoff Data from Test Cells (Storm 7/2&4/99)
5.2 Surface Runoff Volumes
The amount of runoff was measured with the tipping buckets at the bottom of each cell. The
volume of water to cause one tip was known from the calibration, and the number of tips was recorded
with a digital counter attached to the tipper. The total runoff was adjusted for the amount that fell on the
plastic sheet at the bottom of each cell, because this amount of rain could not erode any soil. Runoff from
a typical storm event from the summer of 1999 is shown in Figure 5.2. This figure shows that the most
runoff occurs in the control cell areas. These are the results for the storm event(s) of July 2&4, 1999,
which resulted from a total rainfall of 27mm. The wood waste was probably dry at the beginning of this
storm. Cell 10 measured only the amount of rain falling on the plastic apron, thus, there was no flow
recorded. The other runoff water must have percolated into the soil at the berm or been absorbed by the
wood waste. All runoff records of measured storms appear in Appendix C.
5.3 Suspended Solids in Surface Runoff
The performance of various cell surface treatments for a typical storm is displayed in
Figure 5.3. Additional erosion charts are presented in Appendix D and are similar to these test results.
21

Figure 5.2 presents the runoff results from a storm event where a heavy rainfall of 27 mm (1.06 inch)
occurred over a long weekend. The suspended solids concentration in the runoff was very high for the two
untreated test cells where over 10 g/l of solids were measured. These erosion levels are more than an
order of magnitude greater than the erosion for any of the treated test cells (< 1 g/l). There were storm
events, especially when the leaves began to fall, in which the entrance to the pipe became obstructed. In
these cases the measured runoff was accurate and all of the eroded soil was accounted for by carefully
cleaning the plastic apron and adding the resulting solids to that from the plastic bucket
There was a difficulty with the tipper buckets for the control cells during two of the longer, more
intense storms. They received so much sediment that they were held in the down position. In these cases
the amount of sediment was determined by carefully collecting all of the solids from the plastic apron, the
tipper bucket and the plastic collection bucket. The amount of runoff was estimated from the data of the
other cells.
�������������� ������� �������
����������������������������������������������������������������������������������������������������������������
������������ �������
������������
��������������
���������������������
���������������������������������������������������������������������������������������������������������������������������������������������������������� ������� ������� ������0
500
1000
1500
2000
2500
1 2 3 4 5 6 7 8 9 10 11 12 13 14Test Cell
Sedi
men
t Ero
ded
(g)
7/2&4/99Total Rainfall = 1.06 in = 27 mmIntensity = 0.71 in/hr = 18.0 mm/hr
Figure 5.3: Sediment Eroded from the Storm on 7/2&4/99
22

6.0 Analysis and Discussion of Field Results
6.1 Runoff
The runoff volumes varied among the cells with the amount of total rainfall in the storm. Most of
the storms measured were less that one inch in total rainfall, and the total runoff from a typical storm is
shown in Figure 6.1. This data is taken from Storm 7/19/99A. In each plot of total runoff, the bars
represent the measured amount less the amount that fell on the plastic apron at the bottom of each cell.
Figure 6.1 shows that there is much less runoff from the treated cells than from the control cells. This is
probably due to the wood waste coverings becoming dry between summer storms and allowing
absorption and percolation of rainfall during a storm. It is important to note that cells 8,9,and 10 are used
to compare the performance of the wood waste filter berm in cell 10 with the effectiveness of hay bales in
cell 8 and a geosynthetic silt fence in cell 9. These cell surface areas are untreated like the control
�����������������������������������
���������������������
���������������������
���������������������������������������������������������������������������������������������������������������������������������������������������
����������������������������
����������������������������
���������������������
�����������������������������������������������������������������������������
�����������������������������������������������������������������������������
���������������������
���������������������������������������������������������������������������������������������������������������������������������������������������
���������������������
���������������������
���������������������0
10
20
30
40
50
60
70
1 2 3 4 5 6 7 8 9 10 11 12 13 14Test Cell
Tota
l Run
off (
L)
7/19/99 Rainfall Event ATotal Rainfall = 0.38 in = 9.7 mmIntensity = 1.54 in/hr = 39.1 mm/hr
Figure 6.1 Total Runoff for all Cells for the Storm 7/19/99A
Cells. Their retention of the flow allows some of the runoff water to percolate into the soil.
23

The other extreme of runoff events occurred during Hurricane Floyd on 9/16/99. Figure 6.2
shows the runoff for each cell during this very heavy storm that dropped a total of 112 mm of rain. This
storm lasted long enough to saturate the wood waste materials and, as a result, the runoff from the cells
covered with wood waste is substantial, and approaching the amount from the control cells. Runoffs for
all storms fell between these two patterns in Figures 6.1 and 6.2.
�����������������������������������������������������������������������������������������������������������������������
�����������������������������������������������������������������������������������������������������������������������
������������������������������������������������������������������������������
�������������������������������������������������������������������������������������������
��������������������������������������������������������������������������������������������������
������������������������������������������������������������������������
��������������������������������������������������������������������������������������������������
�������������������������������������������������������������������������������������������������������������������������������������
������������������������������������������������������������������������������������������������
���������������������������������������������������������������������������������������������������������
�������������������������������������������������������������������������������������������
������������������������������������������������������������
������������������������������������������������������������������������������������������������������������������������������
��������������������������������������������������������������������������������������������������0.0
100.0
200.0
300.0
400.0
500.0
600.0
700.0
800.0
900.0
1000.0
1 2 3 4 5 6 7 8 9 10 11 12 13 14Test Cell
Tota
l Run
off (
L)
9/16/99Total Rainfall = 4.4 in = 112 mmIntensity = 1.85 in/hr = 47.1 mm/hr
Figure 6.2 Runoff from the Biggest Storm (Hurricane Floyd)
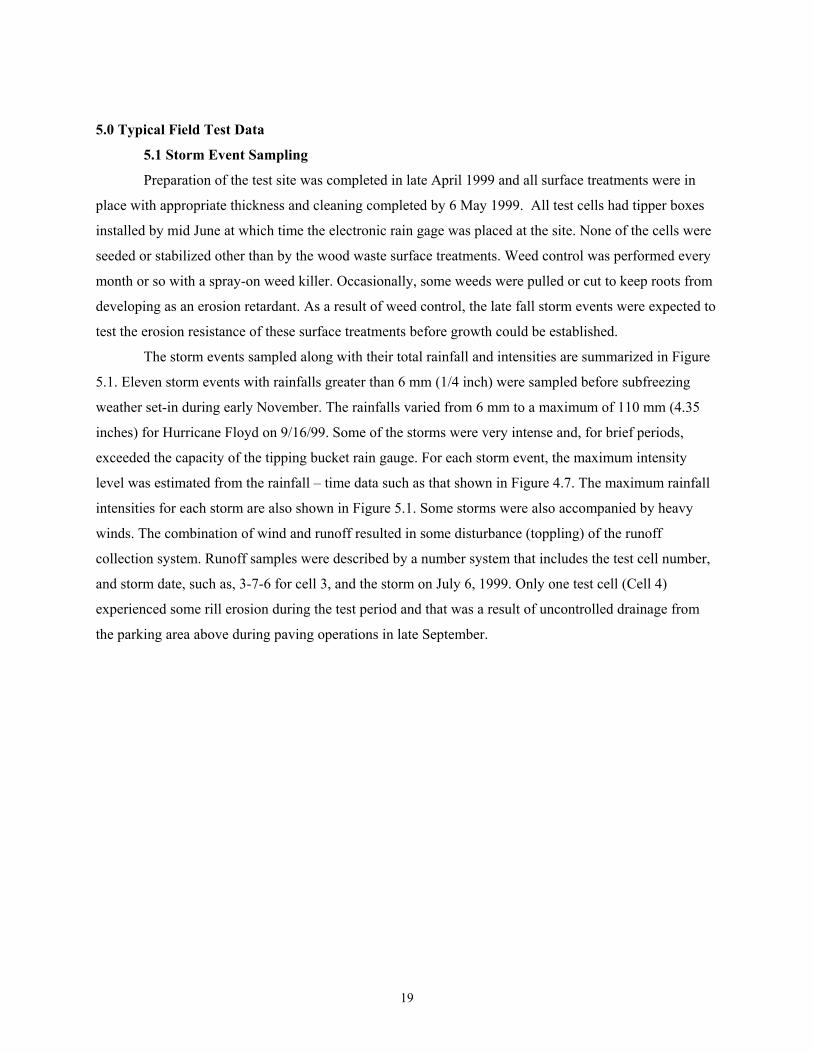
The amount of runoff from the control cells 4 and 11 that resulted from all storms except the one
of greatest intensity (7/24/99) are shown in Figure 6.3. As can be seen from this Figure the amount of
runoff is directly related to the amount of rain in the storm. The data from storm 7/24/99 are omitted
because the tippers in the control cells were overloaded with sediment and tipped in the down position
resulting in poor data for these cells.
24
0
100
200
300
400
500
600
700
0 20 40 60 80 100Total Amount of Rain (mm)
Avg
Run
off f
rom
Cel
ls 4
+11
( l)
120
Figure 6.3 Surface Runoff from Control Cells 4 and 11 with Rainfall
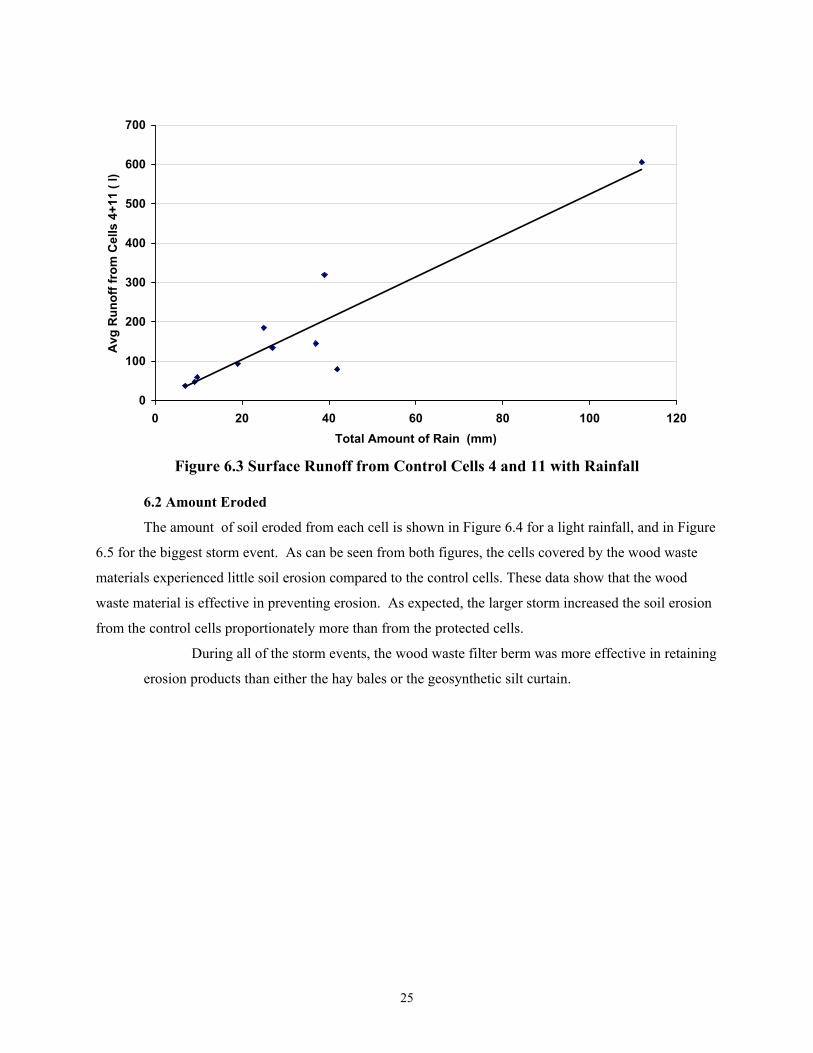
6.2 Amount Eroded
The amount of soil eroded from each cell is shown in Figure 6.4 for a light rainfall, and in Figure
6.5 for the biggest storm event. As can be seen from both figures, the cells covered by the wood waste
materials experienced little soil erosion compared to the control cells. These data show that the wood
waste material is effective in preventing erosion. As expected, the larger storm increased the soil erosion
from the control cells proportionately more than from the protected cells.
During all of the storm events, the wood waste filter berm was more effective in retaining
erosion products than either the hay bales or the geosynthetic silt curtain.
25

��������������
������������
���������������������
���������������������������������������������������������������������������������������������������������������������������������������������������
��������������
��������������
������������
��������������
����������������������������
��������������
��������������������������������������������������������������������������������������������������������������������������������������������
������������
��������������
��������������0
200
400
600
800
1000
1200
1400
1600
1800
2000
1 2 3 4 5 6 7 8 9 10 11 12 13 14Test Cell
Sedi
men
t Ero
ded
(g)
07/01/99Total Rainfall = 0.76 in = 19 mmIntensity = 3.23 in/hr = 82.0 mm/hr
Figure 6.4 Amount of Soil Eroded from Various Cells (Storm 7/1/99)
������������
������������
���������������
������������������������������������������������������������������������������������������������������������������
����������
���������� ������
������������������������������������������������������������
������������������������������������������������������������������
������������
����������������������������������������������������������������������������������������������� ������
������������
���������������
0.0
500.0
1000.0
1500.0
2000.0
2500.0
3000.0
3500.0
4000.0
4500.0
5000.0
1 2 3 4 5 6 7 8 9 10 11 12 13 14Test Cell
Sedi
men
t Ero
ded
(g)
303,319 121,9849/16/99Total Rainfall = 4.4 in = 112 mmIntensity = 1.85 in/hr = 47.1 mm/hr
Figure 6.5: Soil Eroded from Cells during Hurricane Floyd (9/16/99)
26

6.2.1. Erosion Control Structures
The test cells for the erosion control structures including the geotextile silt fence (cell 8), hay
bales (cell9) and wood waste filter berm (cell 10) have an erodable area (bare ground) from the top of the
cell to the soil-retention structure near the bottom. Therefore it can be assumed that the amount eroded in
cell 8,9, or 10 is similar to that eroded in the control cells. The difference in the amount of eroded soil
reaching the measuring system is the effect of the erosion control structure. Figure 6.6 shows the ratio of
the amount of soil reaching the measuring systems below the retention structures to that measured at the
control cells. The results are presented as a percentage. As can be seen from Figure. 6.6 all erosion
control structures are effective in significantly reducing the amount of eroded soil that gets past the
structure. The geosynthetic silt fence is more effective that a hay bale berm, but the wood waste filter
berm reduces the amount passed by nearly an order of magnitude.
��������������������������������������������������������������������������������������������������������������������������������������������������������������������������������������������������������������������������������������������������������������������������������������������������������������������������������������������������������������������������������������������������������������������������������������������������������������������������������
����������������������������������������������������������������������������������������������������������������������������������������������������������������������������������������������������������������������������������������������������������������������������������������������������������������������������������������������������������������������������������������������������������������������������������������������������������������������������������������������������������������������������������������������������������������������������������������������������
���������������������������������������������������������������������������������������
1.62
2.02
0.20
0
0.5
1
1.5
2
2.5
Geosynthetic Silt Fence Hay Bale Berm Wood Waste Filter Berm
Perc
ent P
assi
ng th
e Er
osio
n C
ontr
ol S
truc
ture
Figure 6.6 Comparison of the Effectiveness of the Erosion Control Structures
6.2.2 “C” Factors
The C factors should be calculated on the basis of erosion that occurs under a series of typical
storms for a given region. This research period did not cover a period of typical storms, therefore these C
27

factors must be considered preliminary until more data can be gathered. Nevertheless the factors from the
research reported here appear reasonable. These factors were calculated based on the ratio of the total soil
eroded from the cell divided by the average total amount from the two control cells.
The amount of suspended solids and solids collected from the plastic apron were combined for
each event for each cell, and summed over the storm events. Cells 4 and 11 were considered control cells
since in each the surface of the ground was bare. The Revised Universal Soil Loss Equation (RUSLE) as
cited in the literature can be applied to the field data to determine an approximate cover-management
factor, C. The RUSLE is:
A = R K L S C P (6.1)
For our application the following factors are the same for all cells:
The rainfall intensity factor, R, is the same for all cells, since the area occupied by the cells is
small and it can be assumed that they all received about the same rainfall. The soil in each of the cells is
the same so we can assume that, K, the soil erodibilty factor is the same for all the cells. All cells had the
same length, L, and steepness, S, so this variable is eliminated for these tests, and the supporting practices
factor is assumed equal. We can therefore compare the amounts eroded from each treated cell to the
average amount eroded from the control cells based on the cover management factor C, thus:
Atreat Ctreat
= (6.2)
Acontrol Ccontrol
Taking Ccontrol = 1.0 (Israelson et. al, 1980) we can compute the Ctreat for each treatment as the ratio of the
amount eroded from the treated cell to the average amount eroded from the controls. The results are
shown in Figure 6.7 where the wood waste is effective in minimizing the erosion of soil from the slope.
All of the factors shown in Figure 6.7 are lower than C=0.01 usually assigned to areas covered with
mulch. Figure 6.7 shows that wood waste mulch at a thickness if 0.75 inches ( 19mm) protects the soil
from being eroded as effectively as a thicker coverings. There is no discernable trend involving thickness
of wood waste materials and erosion protection.
28

������������������������������������������������������������������������������������������������������������������������������������������������������������������������������������
��������������������������������������������������������������������������������
��������������������������������������������������������������������������������������������������������������������������������������������������������������������������������������������������������
��������������������������������������������������������������������������������
������������������������������������������������������������
�������������������������������������������������������
������������������������������
��������������������������������������������������
��������������������������������������������������������������������������������������������������������������
0.000
0.001
0.002
0.003
0.004
0.005
0.006
0.007
1 2 3 5 6 7 12 13 14Test Cell
Prel
imin
ary
C F
acto
rs
Figure 6.7 Preliminary C Factors for Wood Waste Coverings
6.3 Variation of Soil Erodability with Time
Soils in New England usually consist of a wide range of particle sizes. The smaller of these
particles are more erodable than the larger sizes. To answer the question of erodability changes over the
course of numerous storm events, the amount of soil eroded during each event was analyzed. The results
are normalized by the amount of rain and the results are shown in Figure 6.8. All storm events except
Hurricane Floyd are plotted in this Figure. As can be seen the erodability of the soil decreases with
successive storms, probably due to the larger, more stable particles that remain behind..
29

0
50
100
150
200
250
0 1 2 3 4 5 6 7 8 9 1Storm Event NO.
Avg
. Ero
ded/
Tota
l Rai
n g/
mm
0
Figure 6.8: Change of Soil Erodability with Storm Event
30

7.0 Summary and Conclusions Summary.
Three wood waste materials were evaluated for use as an erosion control mulch and one of the
materials was used as an erosion control filter berm. Samples of the three materials were subjected to
laboratory tests to determine their physical and chemical properties for comparison with the CONEG
specifications for these erosion control applications. Each of the materials was subjected to large scale
erosion control testing at a field site with a slope of 1 vertical to 2 horizontal. Fourteen test cells (5’ W x
30’ L each) were prepared with different wood waste treatments; nine contained erosion control mulch
applications at thicknesses of ¾ to 3 inch. Two cells were left untreated as reference cells and three other
cells were untreated but contained erosion control structures including wood waste filter berm,
geosynthetic silt fence and hay bale silt barrier. The erosion control performance of each cell treatment
was evaluated for eleven storm events of varying rainfall magnitude and intensity. Calibrated tipper
buckets were used to measure the runoff from each cell and collection buckets were used to sample runoff
and determine the mass of sediment eroded from each cell. Total rainfall and intensity of each storm was
measured with an electronic rain gauge.
Conclusions. 1. Wood waste materials are effective in minimizing erosion when applied to the soil surface as
an erosion control mulch with a thickness of 0.75 inches or more. An untreated soil surface produced over 50 times more sediment than a treated surface.
2. Wood waste materials are particularly effective in reducing runoff during storms under 0.5 inches by absorbing rainwater and by promoting percolation.
3. Layers of wood waste materials of 0.75 inches allow vegetation to root and grow through it. 4. The wood waste erosion control filter berm was more effective than either hay bales or
geosynthetic silt fence at controlling erosion. While all erosion control structures were effective compared to no treatment, hay bales and geosynthetic silt fence released about an order magnitude more sediment than wood waste filter berm.
31
8. Glossary of Terms Agricultural Residues: organic materials produced as by-products from the raising or growing of plants and animals on farms, feedlots, and forests which may include, but not be limited to manure, bedding, plant stalks, culls, hulls, leaves and vegetative matter.
Compost: stable, decomposed, humus-like organic material produced through composting. It is soil-like in appearance.
Composting: a process of accelerated aerobic bio-degradation and stabilization of organic matter under controlled conditions.
Compostable: organic material that can be biologically decomposed under aerobic conditions.
Compostable Material: a material that can undergo physical, chemical, thermal and/or biological degradation under aerobic conditions and result in a humus-like organic material.
Heavy Metals: trace elements whose concentrations are regulated because of the potential for toxicity to humans, animals, or plants, and include arsenic, cadmium, chromium, copper, lead, mercury, molybdenum, nickel, selenium and zinc.
Municipal Solid Waste (MSW): wastes from residential, commercial, and institutional sources, which are not source-separated, and that are commonly disposed in incinerators or landfills.
pH: a number between 0 and 14, and is a measure of the concentration of hydrogen ions in solution; a pH of 7 is considered neutral; a substance that has a pH of 8 has 10 times fewer hydrogen ions than a substance with a pH of 7; the lower the pH, the more hydrogen ions present, and the more acidic the material is; the higher the pH, the fewer the hydrogen ions present, and the more basic (alkaline) it is.
Refuse: municipal solid wastes that may include, but not be limited to, plastics, metal, ceramics, glass, large stones, large pieces of wood, etc.
Recycling: transforming or re-manufacturing waste materials into usable or marketable materials for use other than landfill disposal or incineration.
Soluble Salts Concentration: the concentration of soluble ions in a solution, which is measured by electrical conductivity, that is, the ability to carry an electrical current. Electrical conductivity varies both with the number and type of ions contained in the solution, which can indicate potential for phyto-toxicity. Soluble salts in compost will determine its ultimate end use. Each user group (e.g. vegetable growers, nursery industry, etc.) has its own set of salinity standards for growing specific plants or crops.
32

Source-Separated Compostable Materials (SSCM): organic material that has been separated from non-compostable material at the point of generation and may include, but not be limited to, food scraps, food processing residue, soiled or unrecycled paper, and leaves.
Stability: a state in the decomposition of organic matter during composting and is a function of biologic activity. Unstable compost, when applied to soil, could result in microbial activity which increases soil carbon dioxide and decreases oxygen. If stored, unstable, active compost can become anaerobic if not aerated and give rise to nuisance odors and can create organic phyto-toxins.
Wood Waste Material: a material that can consist of a mixture of bark, wood shavings, wood chips, wood scraps and mineral grit that is a by-product of the lumber, paper, construction and other industries.
Yard Trimmings: vegetative matter resulting from landscaping maintenance or land clearing operations and includes materials such as leaves, tree and shrub trimmings, grass clippings and weeds.
33

9. References Anderson, K.W. (1996), “Advocates and Aggregates”, in From Refuse to Reuse, TR News, Number 184, Washington, DC, pp. 8-13 ASTM (1999), Annual Book of ASTM Standards, Volume 04-08 for Soil and Rock, Philadelphia, PA Ballif, J. L. and C. Herre (1988), Research on the runoff of soil vineyard in Champagne area. Effects of
municipal compost mulching. Comptes Rendus de Academie ï Agriculture de France (France), P. 105-110.
Banse, H.J(1962). "Experience with compost use in viticulture." Proceedings 2nd Intern. Congress of the
Intern. Research Group for Refuse disposal. May 22-25. Essen. Bloom. J. R., T. D. Kaufman, and F. L. Lukezic (Jan/Feb 1984), Reduction of soil erosion by the use of
waste compost. (Verminderung des Bodenabtrages durch Mullkompostinsatz). Oesterr Wasserwirtsch. Wien, Austria: Springer Verlag. P. 22-28.
Boutin, P. and J. Moline. (1987),. Health and safety aspects of compost preparation and use. Cestas and
Tours, France. In Compost: Production, Quality and Use (M. de Bertoldi, M. P. Ferranti, et al. Eds.). London: Elsevier Applied Science. 17-19 April 1986, Udine, Italy. P. 198-209
California Department of Transportation (1999), “How CalTrans Controls Stormwater Runoff.”’ Better
Roads, Vol. 01, 69 (1), 30p. Composting Council (1994), "Suggested Compost Parameters and Compost Use Guidelines," May,
Alexandria, VA, 29p CONEG (1996), “Model Procurement Specifications for Source-Separated Compost”, prepared for the
Northeastern States by The Coalition of Northeastern Governors Source Reduction Task Force, February, 69 p
Demars, K.R. and R.P. Long (1998), “Field Evaluation of Source-Separated Compost and CONEG Model Procurement Specifications for Connecticut DOT Projects” Connecticut Joint Highway Research Report JHR 98-264, Rocky Hill, CT, December, 84p
Dunlap, S. (1997), “Organic Soil Amendments for Enhanced Vegetative Cover”, Land and Water, May/ June, pp. 14-15
Ellison, W.D. (1944), “Studies of Rainfall Erosion”, Agricultural Engineering 25: 131-136, 181-182 Fricke, C. and H.Vogtmann. (1993), "Quality of Source Separated Compost: Research Results from
Germany." BioCycle Vol. 34, October. P.64-70. Fullen MA, Mitchell DJ, Barton AP, Hocking TJ, Liu LG, Zhi WB, Yi Z, Yuan XZ (1999) “Soil erosion
and conservation in Yunnan Province, China”, Ambio 28: (2) 125-129 March, :Royal Swedish Academy Sciences,, Stockholm
Haynes, J. (1997), “Use of Organic Amendments in Erosion Control”, Erosion Control, March/ April,
pp. 24-33
34

Henry, G. and D. Bush (1996), “Applying Yard Trimmings Compost to Highways”, Biocycle, Vol. 37, February, pp. 53- 56
Hoitink, H.A.J. and H.M. Keener, Eds. (1993) Science and Engineering of Composting: Design, Environmental, Microbiological and Utilization Aspects, Renaissance Publications, Worthington, OH 728p Horner, R.R., J. Guedry, and M.H.Kortenhof (1989), "Improving the Cost-Effectiveness of Highway
Construction Site Erosion and Pollution Control". Washington State Transportation Commission. Hutchins, S. R. Tomson, M.B, Bedient, P.B, and Ward, C.H. (1985), "Fate of Trace Organics during Land
Application of Municipal Wastewater." CRC Critical Reviews in Environmental Control, 15 (4): p. 355.
Inbar, Y., Y. Chen., Y. Hadar, and H.A.J. Hoitnik. (1990) "New approaches to compost maturity."
BioCycle. Vol. 31(12): 64-69. Israelsen, C.E., C.G. Clyde, J.E. Fletcher, E.K. Israelsen, F.W. Haws, P.E. Packer and E.E. Farmer
(1980a), “Erosion Control During Highway Construction/ Research Report”, National Cooperative Highway Research Program, Report 220, April, 30 p.
Israelsen, C.E., C.G. Clyde, J.E. Fletcher, E.K. Israelsen, F.W. Haws, P.E. Packer and E.E. Farmer
(1980b), “Erosion Control During Highway Construction Manual on Principles and Practices”, National Cooperative Highway Research Program, Report 221, April, 107 p.
Klaghofer, E., A. Koechl, and H. Spiegel (1990), "Waste compost as a protection against soil erosion in
vineyards." Oesterr Wasserwirtschaft, 42(7-8): p.187-195. Knoop, M., K. Culter-Talbott, and H. Wescott (1991), Technical information on the use of organic
materials as soil amendments. 2nd ed. 1991. Solid Waste Composting Council, Washington, DC. Koch, R. (1965), "Refuse composting observations of the 6 years of application in wine growing and
gardening." Organischer Landbau, 8 (6): p. 131-132. LaRoche, R. (1998) Environmental Services, Maine Department of Transportation, personal
communication Maass, J. M., C. F. Jordon, and J. Sarukhan (1988), "Soil erosion and nutrient losses in seasonal tropical
agroecosystems under various management techniques," Journal of Applied Ecology. p. 595-607. Mitchell, D. (1997), “State Transportation Departments Expand Compost Use”, Biocycle, July, pp 75- 80 Müller, V. H. and S. Riccabona (1984), "Reduction of soil erosion by the use of waste compost (In
German)." Jahrgang, 36 (1/2): p. 22-28. NRAES (1992), "On-Farm Composting Handbook," Northeast Regional Agricultural Engineering Service
Cooperative Extension, Ithaca, NY 186 p Oosthnoek, J. and J.P.N. Smit. (1987), "Future of composting in the Netherlands." BioCycle. Vol. 28 July
28 37-39.
35

Pettigrew, C.A. (1996), “Testing of Degradability of Polymeric Materials in Solid Waste”, ASTM
Standardization News, September, pp. 32-35 Renard, K.G., J.M. Laflen, G.R. Foster, and D.K. McCool (1994), “The Revised Universal Soil Loss
Equation” in Soil Erosion Research Methods, 2nd Ed., R. Lal, Editor, St Lucie Press, Delray Beach, FL, 83-104
Schuch, M. and F. Jordan (1989), "Results of ten years of erosion control experiments in steep sloping
vineyards of Franconia (FRG)." Bayerisches Landwirtschaftliches Jahrbuch, 66 (8): p. 1033-1036.
Selby, M. A. (1986), "Soil Filters at Treatment Plants." BioCycle, Vol. 27: p.33. Shiralipour, A., D. B. McConnell, and W. H. Smith. (1992) "Uses and benefits of MSW compost: a
review and assessment." Biomass and Bioenergy. 3(3-4): 267-279. Great Britain. Slick B.M. and W.R. Curtis (1985), “A Guide for the Use of Organic Materials as Mulches in
Reclamation of Coal Mine Soils in the Eastern U.S.” USDA Forest Service, Final Report, April 25, 156p
Sollenberger, D.A. (1987), “Evaluation of Compost and Co-Compost Materials for Highway
Construction- Phase 1”, California Department of Transportation, Phase 1 Final Report, June, 56p U.S. Environmental Protection Agency (1994), "Composting yard trimmings and municipal solid
waste."U.S. E.P.A. Office of Solid Waste and Emergency Response. EPA530-R-94-003. a. Washington, DC.
U.S. Environmental Protection Agency (1997), "Characterization of Municipal Solid Waste in The United
States: 1996 Update" US EPA Office of Solid Waste and Emergency Response. Publication # EPA 530-R-97-015
Van Veldhuijsen, L. (1974), "Compost against erosion (Dutch)." Land Water (Amst.), 18 (6): p.41. W&H Pacific (1992), "Compost Storm Water Treatment System- Final Report." Portland Metropolitan
Service District (Metro). W&H Pacific (1993), "Demonstration Project Using Yard Debris Compost for Erosion Control," Portland
Metropolitan Service District, June 30. Wischmeier, W.H. and D.D. Smith (1978), "Predicting Rainfall Erosion Losses- A Guide to Conservation
Planning," U.S. Department of Agriculture, Agriculture Handbook No. 537, 142 p
36

37
38
39

Figure A-6 View of Test Cells 1 (left) to 4 in Late August 1999
Appendix B Rainfall- Time Plots at Maximum Storm Intensity
y = 77.524x - 8.5706R2 = 0.9958
0.05
0.1
0.15
0.2
0.25
0.3
0.35
2:35 2:40 2:45 2:50Time (24 hour)
Rai
nfal
l (in
)
7/1/99Total Rainfall = 0.76 in = 19 mmIntensity = 3.23 in/hr = 82.0 mm/hr
40

y = 17.01x - 13.139R2 = 0.9886
1
1.05
1.1
1.15
1.2
1.25
1.3
1.35
1.4
20:00 20:05 20:10 20:15 20:20 20:25 20:30Time (24 hour)
Rai
nfal
l (in
)
7/2/99Total Rainfall = 0.52 in = 13 mmIntensity = 0.71 in/hr = 18.0 mm/hr
y = 7.686x - 1.0741R2 = 0.9951
1.45
1.5
1.55
1.6
1.65
1.7
1.75
1.8
1.85
1.9
8:00 8:10 8:20 8:30 8:40 8:50 9:00 9:10Time (24 hour)
Rai
nfal
l (in
)
7/4/99Total Rainfall = 0.54 in = 14 mmIntensity = 0.32 in/hr = 8.13 mm/hr
41

y = 41.624x - 39.765R2 = 0.9948
0
0.05
0.1
0.15
0.2
0.25
0.3
0.35
0.4
22:55 23:00 23:05 23:10 23:15Time (24 hour)
Rai
nfal
l (in
)
7/6/99Total Rainfall = 0.36 in = 9.1 mmIntensity = 1.73 in/hr = 44.1 mm/hr
y = 36.923x - 20.845R2 = 0.9877
0.15
0.2
0.25
0.3
0.35
0.4
0.45
0.5
0.55
0.6
13:25 13:30 13:35 13:40 13:45 13:50 13:55 14:00Time (24 hour)
Rai
nfal
l (in
)
7/19/99 Rainfall Event ATotal Rainfall = 0.38 in = 9.7 mmIntensity = 1.54 in/hr = 39.1 mm/hr
42

y = 21.068x - 14.437R2 = 0.9902
0.55
0.6
0.65
0.7
0.75
0.8
0.85
17:00 17:05 17:10 17:15 17:20 17:25 17:30 17:35 17:40 17:45Time (24 hour)
Rai
nfal
l (in
)
7/19/99 Rainfall Event BTotal Rainfall = 0.27 in = 6.9 mmMaximum Intensity = 0.878 in/hr = 22.3 mm/hr
y = 86.752x - 62.239R2 = 0.9975
0
0.1
0.2
0.3
0.4
0.5
0.6
0.7
0.8
17:10 17:15 17:20 17:25 17:30Time (24 hour)
Rai
nfal
l (in
)
7/25/99Total Rainfall = 0.68 in = 17 mmIntensity = 3.61 in/hr = 91.8 mm/hr
43
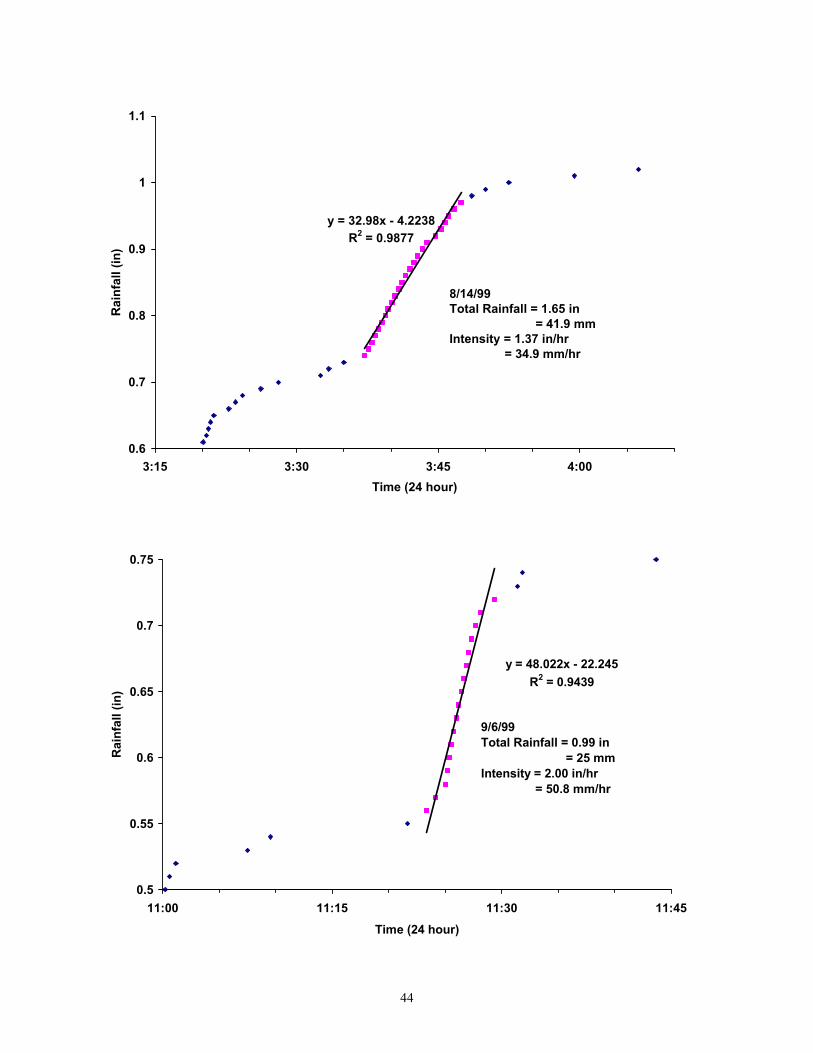
y = 32.98x - 4.2238R2 = 0.9877
0.6
0.7
0.8
0.9
1
1.1
3:15 3:30 3:45 4:00Time (24 hour)
Rai
nfal
l (in
)
8/14/99Total Rainfall = 1.65 in = 41.9 mmIntensity = 1.37 in/hr = 34.9 mm/hr
y = 48.022x - 22.245R2 = 0.9439
0.5
0.55
0.6
0.65
0.7
0.75
11:00 11:15 11:30 11:45Time (24 hour)
Rai
nfal
l (in
)
9/6/99Total Rainfall = 0.99 in = 25 mmIntensity = 2.00 in/hr = 50.8 mm/hr
44

y = 4.3762x - 1.6721R2 = 0.9847
0.9
1
1.1
1.2
1.3
1.4
1.5
1.6
1.7
1.8
14:15 15:15 16:15 17:15 18:15Time (24 hour)
Rai
nfal
l (in
)
9/10/99Total Rainfall = 1.5 in = 37 mmIntensity = 0.182 in/hr
y = 44.496x - 32.243R2 = 0.9964
3.2
3.4
3.6
3.8
4
4.2
4.4
19:00 19:10 19:20 19:30 19:40 19:50 20:00Time (24 hour)
Rai
nfal
l (in
)
9/16/99Total Rainfall = 4.4 in = 112 mmIntensity = 1.85 in/hr = 47.1 mm/hr
45
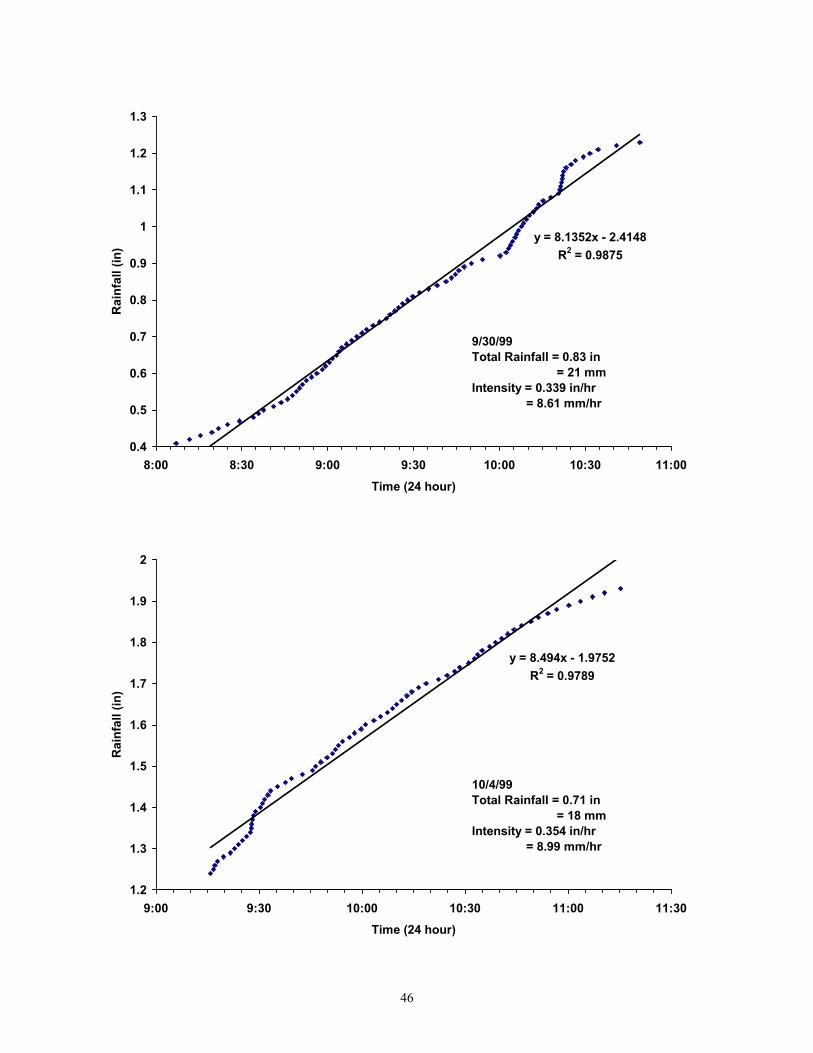
y = 8.1352x - 2.4148R2 = 0.9875
0.4
0.5
0.6
0.7
0.8
0.9
1
1.1
1.2
1.3
8:00 8:30 9:00 9:30 10:00 10:30 11:00Time (24 hour)
Rai
nfal
l (in
)
9/30/99Total Rainfall = 0.83 in = 21 mmIntensity = 0.339 in/hr = 8.61 mm/hr
y = 8.494x - 1.9752R2 = 0.9789
1.2
1.3
1.4
1.5
1.6
1.7
1.8
1.9
2
9:00 9:30 10:00 10:30 11:00 11:30Time (24 hour)
Rai
nfal
l (in
)
10/4/99Total Rainfall = 0.71 in = 18 mmIntensity = 0.354 in/hr = 8.99 mm/hr
46
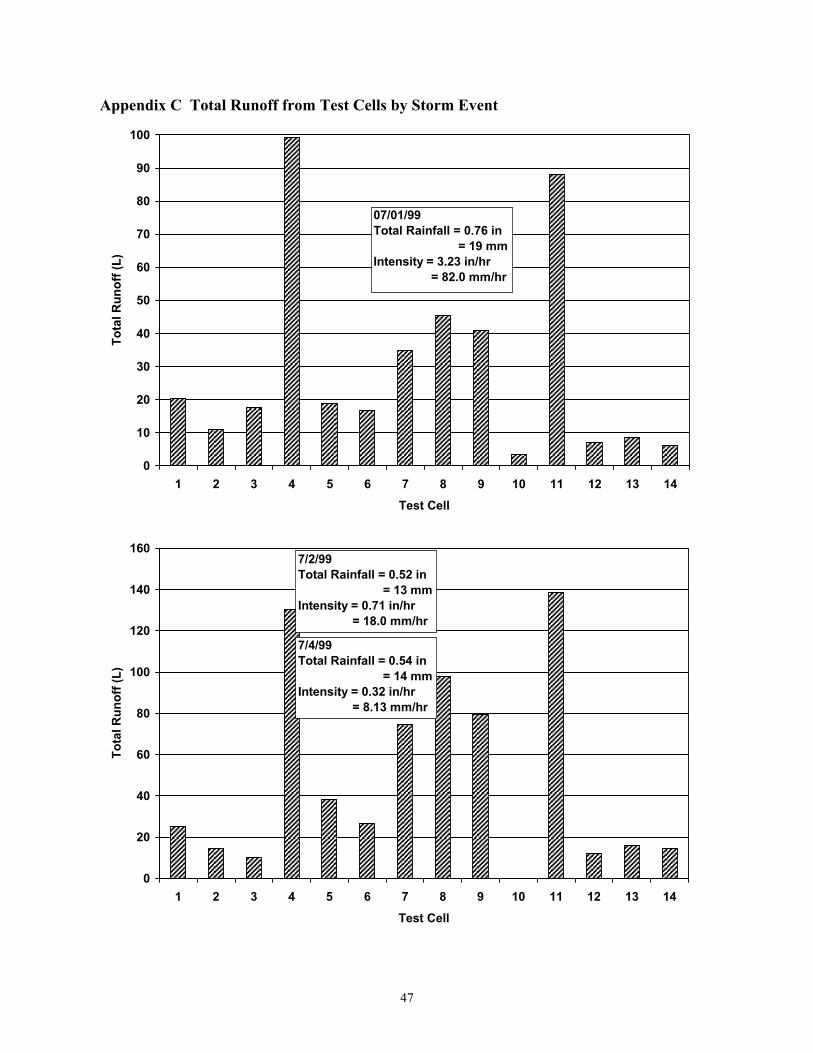
Appendix C Total Runoff from Test Cells by Storm Event
�����������������������������������
���������������������
�����������������������������������
����������������������������������������������������������������������������������������������������������������������������������������������������������
�����������������������������������
����������������������������
��������������������������������������������������������
�����������������������������������������������������������������������������
����������������������������������������������������������������������
��������������
������������������������������������������������������������������������������������������������������������������������
��������������
���������������������
��������������
0
10
20
30
40
50
60
70
80
90
100
1 2 3 4 5 6 7 8 9 10 11 12 13 14Test Cell
Tota
l Run
off (
L)
07/01/99Total Rainfall = 0.76 in = 19 mmIntensity = 3.23 in/hr = 82.0 mm/hr
����������������������������
���������������������
��������������
������������������������������������������������������������������������������������������������������������������������������
������������������������������������
����������������������������
�����������������������������������������������������������������������������
��������������������������������������������������������������������������������������������������
������������������������������������������������������������������������������������
��������������������������������������������������������������������������������������������������������������������������������������������
��������������
���������������������
���������������������
0
20
40
60
80
100
120
140
160
1 2 3 4 5 6 7 8 9 10 11 12 13 14Test Cell
Tota
l Run
off (
L)
7/2/99Total Rainfall = 0.52 in = 13 mmIntensity = 0.71 in/hr = 18.0 mm/hr
7/4/99Total Rainfall = 0.54 in = 14 mmIntensity = 0.32 in/hr = 8.13 mm/hr
47
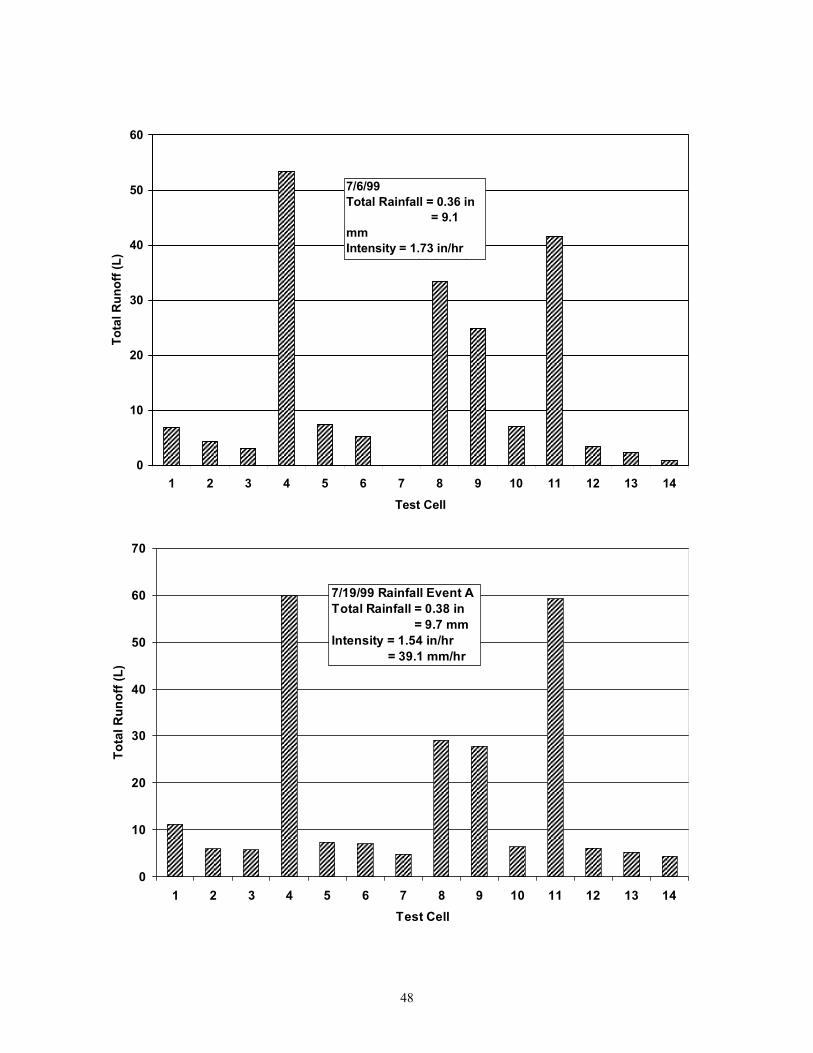
���������������������
��������������
��������������
��������������������������������������������������������������������������������������������������������������������������������������������
����������������������������
���������������������
�������������������������������������������������������������������������������������������
����������������������������������������������������������������������
���������������������
����������������������������������������������������������������������������������������������������������������
��������������
�������������� �������
0
10
20
30
40
50
60
1 2 3 4 5 6 7 8 9 10 11 12 13 14Test Cell
Tota
l Run
off (
L)
7/6/99Total Rainfall = 0.36 in = 9.1 mmIntensity = 1.73 in/hr
44 1 /h
����������������������������
���������������������
���������������������
�������������������������������������������������������������������������������������������������������������������������������������
���������������������
������������������������
������������
����������������������������������������������������������������������
����������������������������������������������������������������������
���������������������
�������������������������������������������������������������������������������������������������������������������������������������
���������������������
���������������������
��������������
0
10
20
30
40
50
60
70
1 2 3 4 5 6 7 8 9 10 11 12 13 14Test Cell
Tota
l Run
off (
L)
7/19/99 Rainfall Event ATotal Rainfall = 0.38 in = 9.7 mmIntensity = 1.54 in/hr = 39.1 mm/hr
48

���������������������
��������������
��������������
������������������������������������������������������������������������������������������������������������������������������
�����������������������������������
����������������������������
����������������������������
�������������������������������������������������������������������������������������������
������������������������������������������������������������������������������������
���������������������
�������������������������������������������������������������������������������������������������������������������������������������
��������������
�������������� �������
0
5
10
15
20
25
30
35
40
45
1 2 3 4 5 6 7 8 9 10 11 12 13 14Test Cell
Tota
l Run
off (
L)
7/19/99 Rainfall Event BTotal Rainfall = 0.27 in = 6.9 mmIntensity = 0.878 in/hr = 22.3 mm/hr
�������������������������������������������������������������������������������������������
����������������������������������������������������������������������
��������������������������������������������������������
�����������������������������������������������������������������������������
�������������������������������������������������
�������������������������������������������������������������������������������������������������������������������������������������
���������������������������������������������������������������������������������������������������������
����������������������������
��������������������������������������������������������
����������������������������������������������������������������������
0
10
20
30
40
50
60
70
1 2 3 4 5 6 7 8 9 10 11 12 13 14Test Cell
Tota
l Run
off (
L)
7/24/99Total Rainfall = 0.68 in = 17 mmIntensity = 3.61 in/hr = 91.8 mm/hr
49

�������
�������������������������������������������������������������������������������������������������������������������������������������
�������������� �������
���������������������
���������������������������������������������������������������
�������������������������������������������������������� �������
��������������������������������������������������������������������������������������������������������������������������������������������
0
10
20
30
40
50
60
70
80
90
1 2 3 4 5 6 7 8 9 10 11 12 13 14Test Cell
Tota
l Run
off (
L)
08/14/99Total Rainfall = 1.65 in = 41.9 mmIntensity = 1.37 in/hr = 34.9 mm/hr
���������������������
���������������������
���������������������
����������������������������������������������������������������������������������������������������������������������������������������������������������
������������������������������������������������������������������������������������
�����������������������������������������������������������������������������
���������������������������������������������������������������
����������������������������������������������������������������������������������������������������������������
������������������������������������������������������������������������������������
������������������������������������������������������������������������
�������������������������������������������������������������������������������������������������������������������������������������
���������������������������������������������������������������
����������������������������������������������������������������������
������������������������������������������
0
20
40
60
80
100
120
140
160
180
200
1 2 3 4 5 6 7 8 9 10 11 12 13 14Test Cell
Tota
l Run
off (
L)
09/06/99Total Rainfall = 0.99 in = 25 mmIntensity = 2.00 in/hr = 50.8 mm/hr
50

��������������������������������������������������������
�����������������������������������
���������������������
���������������������������������������������������������������������������������������������������������������������������������������������������
������������������������������������������������������������������
��������������������������������������������������������
�����������������������������������������������������������������������������������������������������������������������
�������������������������������������������������
���������������������������������������������������������������������������������������������������������
������������������������
��������������������������������������������������������������������������������������������������������������������������������������������
��������������
�������������� �������
0
20
40
60
80
100
120
140
160
1 2 3 4 5 6 7 8 9 10 11 12 13 14Test Cell
Tota
l Run
off (
L)09/10/99Total Rainfall = 1.5 in = 37 mmIntensity = 0.182 in/hr = 4.63 mm/hr
�������������������������������������������������������������������������������������������������������������������������������������
������������������������������������������������������������������������������������������������������������������������������
������������������������������������������������������������������������������������
��������������������������������������������������������������������������������������������������
���������������������������������������������������������������������������������������������������������
�������������������������������������������������������������������������������������������
����������������������������������������������������������������������������������������������������������������
��������������������������������������������������������������������������������������������������������������������������������������������
������������������������������������������������������������������������������������������������������������������������������
����������������������������������������������������������������������������������������������������������������
��������������������������������������������������������������������������������������������������
�����������������������������������������������������������������������������
�������������������������������������������������������������������������������������������������������������������������������������
���������������������������������������������������������������������������������������������������������
0
100
200
300
400
500
600
700
800
900
1000
1 2 3 4 5 6 7 8 9 10 11 12 13 14Test Cell
Tota
l Run
off (
L)
09/16/99 - Hurricane FloydTotal Rainfall = 4.4 in = 112 mmIntensity = 1.85 in/hr = 47.1 mm/hr
51

Total runoff data for two storms on 9/30/99 and 10/4/99.
����������������������������
��������������
��������������
�����������������������������������������������������������������������������������������������������������������������
������������������������������
�����������������������������������
���������������������������������������������������������������
����������������������������������������������������������������������
����������������������������
������������������������������������
������������������������������������������������������������������������������������������������������������������������������������� �������
�������������� �������
0
50
100
150
200
250
300
350
400
1 2 3 4 5 6 7 8 9 10 11 12 13 14Test Cell
Tota
l Run
off (
L)
09/30/99Total Rainfall = 0.83 in = 21 mmIntensity = 0.339 in/hr = 8.61 mm/hr
10/04/99Total Rainfall = 0.71 in = 18 mmIntensity = 0.354 in/hr = 8.99 mm/hr
52
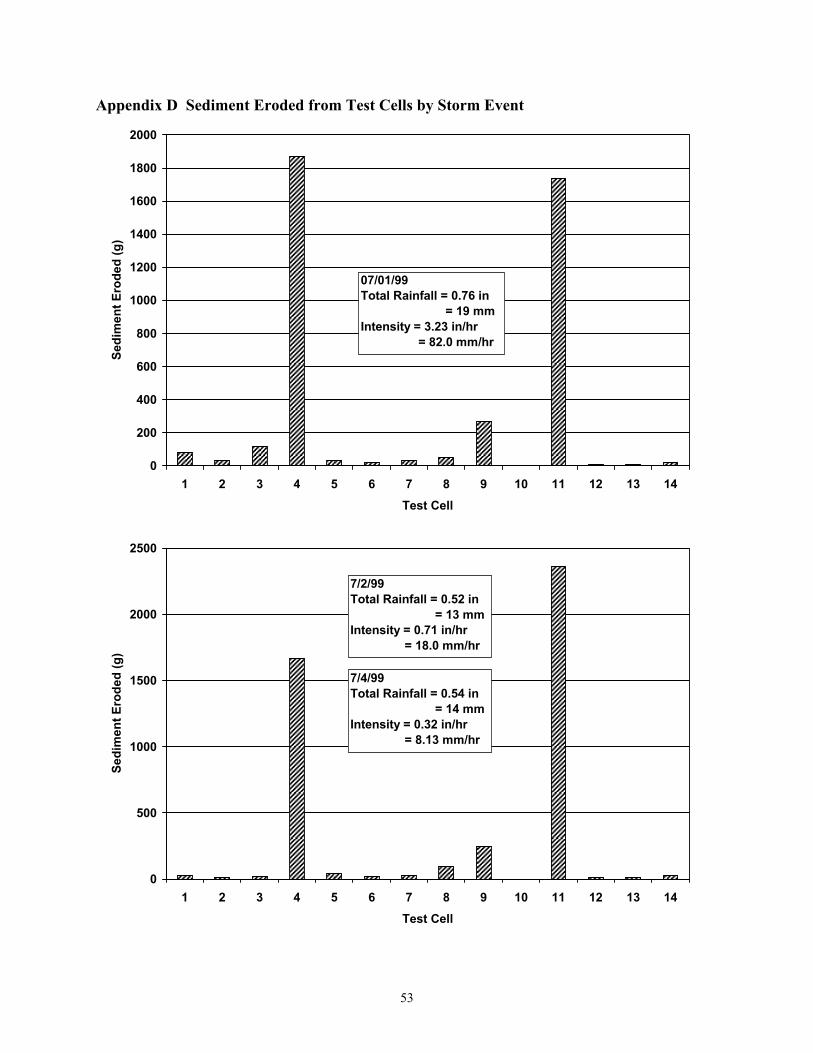
Appendix D Sediment Eroded from Test Cells by Storm Event
�������������� ������
��������������
��������������������������������������������������������������������������������������������������������������������������������������������������� ������� ������� ������� �������
���������������������������� ������
�������������������������������������������������������������������������������������������������������������������������������������������� ������� ������ �������
0
200
400
600
800
1000
1200
1400
1600
1800
2000
1 2 3 4 5 6 7 8 9 10 11 12 13 14Test Cell
Sedi
men
t Ero
ded
(g)
07/01/99Total Rainfall = 0.76 in = 19 mmIntensity = 3.23 in/hr = 82.0 mm/hr
������� ������ �������
��������������������������������������������������������������������������������������������������������� ������� ������� �������
��������������
���������������������
��������������������������������������������������������������������������������������������������������������������������������������������������� ������� ������ �������
0
500
1000
1500
2000
2500
1 2 3 4 5 6 7 8 9 10 11 12 13 14Test Cell
Sedi
men
t Ero
ded
(g)
7/2/99Total Rainfall = 0.52 in = 13 mmIntensity = 0.71 in/hr = 18.0 mm/hr
7/4/99Total Rainfall = 0.54 in = 14 mmIntensity = 0.32 in/hr = 8.13 mm/hr
53

�������������� ������ �������
���������������������������������������������������������������������������������������������������������������������������������������������������������� ������� ������� �������
��������������
�������������� ������
�������������������������������������������������������������������������������������������������������������������������������������������� ������� ������ �������
0
200
400
600
800
1000
1200
1400
1600
1800
2000
1 2 3 4 5 6 7 8 9 10 11 12 13 14Test Cell
Sedi
men
t Ero
ded
(g)
7/6/99Total Rainfall = 0.36 in = 9.1 mmIntensity = 1.73 in/hr = 44.1 mm/hr
������� ������ �������
����������������������������������������������������������������������������������������������������������������������� ������� ������� ������� �������
�������������� ������
�������������������������������������������������������������������������������������������������������������������������������������������� ������� ������ �������
0
200
400
600
800
1000
1200
1400
1600
1800
1 2 3 4 5 6 7 8 9 10 11 12 13 14Test Cell
Sedi
men
t Ero
ded
(g)
7/19/99 Rainfall Event ATotal Rainfall = 0.38 in = 9.7 mmIntensity = 1.54 in/hr = 39.1 mm/hr
54

������� ������� �������
�������������������������������������������������������������������������������������������������������������������������������������������� ������� ������� �������
��������������
�������������� �������
������������������������������������������������������������������������������������������������ ������� ������� �������
0
100
200
300
400
500
600
1 2 3 4 5 6 7 8 9 10 11 12 13 14Test Cell
Sedi
men
t Ero
ded
(g)
7/19/99 Rainfall Event BTotal Rainfall = 0.27 in = 6.9 mmIntensity = 0.878 in/hr = 22.3 mm/hr
Storm of Greatest Intensity. Tipper Buckets Malfunctioned in Cells 4, 7, 8 and 11.
����������������������������
������������
������������������������������������������������������������������������������������
������������ �������
���������������������������������������������������������������������������������������������������������������������������������������������������
����������������������������
�������������� �������
����������������������������
0
100
200
300
400
500
600
700
1 2 3 4 5 6 7 8 9 10 11 12 13 14Test Cell
Sedi
men
t Ero
ded
(g)
7/24/99Total Rainfall = 0.68 in = 17 mmIntensity = 3.61 in/hr = 91.8 mm/hr
55

�������������� ������
��������������
��������������������������������������������������������������������������������������������������������������������������������������������������� ������� ������� �������
��������������
�������������� ������
��������������������������������������������������������������������������������������������������������� ������� ������ �������
0
200
400
600
800
1000
1200
1 2 3 4 5 6 7 8 9 10 11 12 13 14Test Cell
Sedi
men
t Ero
ded
(g)
08/14/99Total Rainfall = 1.65 in = 41.9 mmIntensity = 1.37 in/hr = 34.9 mm/hr
�������������� ������
��������������
�������������������������������������������������������������������������������������������������� �������
�������������� �������
��������������
�������������� ������
������������������������������������������������������������������������������������������������������������������������������������� ������� ������ �������
0
500
1000
1500
2000
2500
1 2 3 4 5 6 7 8 9 10 11 12 13 14Test Cell
Sedi
men
t Ero
ded
(g)
09/06/99Total Rainfall = 0.99 in = 25 mmIntensity = 2.00 in/hr = 50.8 mm/hr
56

������� ������ �������
�������������������������������������������������
�������������� ������� ������� �������
�������������� ������
���������������������������������������������������������������������������������������������������������������������������������������������������������� ������� ������ �������
0
200
400
600
800
1000
1200
1 2 3 4 5 6 7 8 9 10 11 12 13 14Test Cell
Sedi
men
t Ero
ded
(g)
09/10/99Total Rainfall = 1.5 in = 37 mmIntensity = 0.182 in/hr = 4.63 mm/hr
�������
�������������������������������������������������������������������������������������������������������������������������������������������� ������ �������
��������������������������������������������������������������� �������
0
50000
100000
150000
200000
250000
300000
350000
1 2 3 4 5 6 7 8 9 10 11 12 13 14Test Cell
Sedi
men
t Ero
ded
(g)
09/16/99 - Hurricane FloydTotal Rainfall = 4.4 in = 112 mmIntensity = 1.85 in/hr = 47.1 mm/hr
57

Total sediment eroded from two storms on 9/30/99 and 10/4/99.
��������������������� ������� ������
��������������������������������������������������������������������������������������������������������������������������������������������������� ������� �������
��������������
��������������
�������������� �������
��������������������������������������������������������������������������������������������������������� ������� ������� �������
0
200
400
600
800
1000
1200
1 2 3 4 5 6 7 8 9 10 11 12 13 14Test Cell
Sedi
men
t Ero
ded
(g)
09/30/99Total Rainfall = 0.83 in = 21 mmIntensity = 0.339 in/hr = 8.61 mm/hr
10/04/99Total Rainfall = 0.71 in = 18 mmIntensity = 0.354 in/hr = 8.99 mm/hr
58