pda briefing report #20
TRANSCRIPT
8/14/2019 Pda Briefing Report #20
http://slidepdf.com/reader/full/pda-briefing-report-20 1/77
PROJECT ON DEFENSE ALTERNATIVESCOMMONWEALTH INSTITUTE, CAMBRIDGE, MASSACHUSETTS
An Undisciplined DefenseUnderstanding the $2 Trillion Surge
in US Defense Spending
Carl Conetta
18 JANUARY 2010PDA BRIEFING REPORT #20

8/14/2019 Pda Briefing Report #20
http://slidepdf.com/reader/full/pda-briefing-report-20 2/77
An Undisciplined Defense
Understanding the $2 Trillion Surgein US Defense Spending
Carl Conetta
Project on Defense AlternativesBriefing Report #20
18 January 2010

8/14/2019 Pda Briefing Report #20
http://slidepdf.com/reader/full/pda-briefing-report-20 3/77
Acknowledgments
We are grateful for the support of Ben Cohen, David desJardins, and John Maher, whichhas made possible the production and publication of this report.
And we appreciate the helpful comments and input of our colleagues Gordon Adams of the
Stimson Center, David Gold of the New School Graduate Program in International Affairs,William Hartung of the Arms and Security Initiative at the New America Foundation, ChrisHelman of the National Priorities Project, Cindy Williams of the MIT Security StudiesProgram, and Winslow Wheeler of the Straus Military Reform Project at the Center forDefense Information.
© Commonwealth Institute, 2010
ISBN 1-881677-16-8
Print copies of this report are available for $11 ($16 to overseas addresses) by check or money order
mailed to the Commonwealth Institute at P.O. Box 398105, Cambridge, MA 02139. On request onecopy will sent free of charge to non-profit libraries. This report is also available online at:
www.comw.org/pda/

8/14/2019 Pda Briefing Report #20
http://slidepdf.com/reader/full/pda-briefing-report-20 4/77
CONTENTS
Tables and Figures . . . . . . . . . . . . . . . . . . . . . . . . . . . . . . . . . . . . . . . . . . . . . . . . . . . . . iv
Executive Summary . . . . . . . . . . . . . . . . . . . . . . . . . . . . . . . . . . . . . . . . . . . . . . . . . . . . . v
1. Introduction: Why more than the Cold War? . . . . . . . . . . . . . . . . . . . . . . . . . . . . . . 1
2. The post-1998 surge in US defense spending . . . . . . . . . . . . . . . . . . . . . . . . . . . . . . 2
3. Summary of empirical findings . . . . . . . . . . . . . . . . . . . . . . . . . . . . . . . . . . . . . . . . . . 5
4. What drives the DOD spending surge? . . . . . . . . . . . . . . . . . . . . . . . . . . . . . . . . . . . 7
4.1 Peace versus power dividend . . . . . . . . . . . . . . . . . . . . . . . . . . . . . . . . . . . . . . 8
4.2 Dilemmas of the drawdown . . . . . . . . . . . . . . . . . . . . . . . . . . . . . . . . . . . . . . . 9
4.3 More hands to the task: DoD workforce dynamics . . . . . . . . . . . . . . . . . . . 12
4.4 Discordant modernization . . . . . . . . . . . . . . . . . . . . . . . . . . . . . . . . . . . . . . . . 16
5. Conclusion: Trillions to burn? . . . . . . . . . . . . . . . . . . . . . . . . . . . . . . . . . . . . . . . . . . 20
Notes . . . . . . . . . . . . . . . . . . . . . . . . . . . . . . . . . . . . . . . . . . . . . . . . . . . . . . . . . . . . . . . . . 22
Appendix A: Data Review . . . . . . . . . . . . . . . . . . . . . . . . . . . . . . . . . . . . . . . . . 25
1. Disaggregating the post-1998 spending surge . . . . . . . . . . . . . . . . . . . . . . . . . . . . . . . . . . . 25
1.1 Tracing the change in spending priorities . . . . . . . . . . . . . . . . . . . . . . . . . . . . . . . . . 26
1.2 The effect of the post-9/11 wars on DoD budget allocation . . . . . . . . . . . . . . . . . . . 27
1.3 Trends in spending on personnel, operations, and maintenance . . . . . . . . . . . . . . 28
1.4 Trends in modernization spending . . . . . . . . . . . . . . . . . . . . . . . . . . . . . . . . . . . . . . . 31
2. The surge in military construction . . . . . . . . . . . . . . . . . . . . . . . . . . . . . . . . . . . . . . . . . . . . 33
3. The surge by service, spending category, and time period . . . . . . . . . . . . . . . . . . . . . . . . . 35
4. Defense-wide spending . . . . . . . . . . . . . . . . . . . . . . . . . . . . . . . . . . . . . . . . . . . . . . . . . . . . . . 39
Notes . . . . . . . . . . . . . . . . . . . . . . . . . . . . . . . . . . . . . . . . . . . . . . . . . . . . . . . . . . . . . . . . . . . . . . . 41
Appendix B: Goal inflation in post-Cold War US defense strategy . . . . . . . 43
1. The post-Cold War shift in strategy and goals . . . . . . . . . . . . . . . . . . . . . . . . . . . . . . . . . . . 44
2. The Pentagon’s full plate . . . . . . . . . . . . . . . . . . . . . . . . . . . . . . . . . . . . . . . . . . . . . . . . . . . . 45
3. Stressing the force . . . . . . . . . . . . . . . . . . . . . . . . . . . . . . . . . . . . . . . . . . . . . . . . . . . . . . . . . . 47
4. From missions to “requirements”: Capability-based planning . . . . . . . . . . . . . . . . . . . . . . 48
Notes . . . . . . . . . . . . . . . . . . . . . . . . . . . . . . . . . . . . . . . . . . . . . . . . . . . . . . . . . . . . . . . . . . . . . . . 49
Appendix C: More for less? The limits of revolution & reform . . . . . . . . . . 51
1. A costly complexity . . . . . . . . . . . . . . . . . . . . . . . . . . . . . . . . . . . . . . . . . . . . . . . . . . . . . . . . . 51
2. The prospects for reform . . . . . . . . . . . . . . . . . . . . . . . . . . . . . . . . . . . . . . . . . . . . . . . . . . . . 523. Downsizing reform . . . . . . . . . . . . . . . . . . . . . . . . . . . . . . . . . . . . . . . . . . . . . . . . . . . . . . . . . 53
4. Acquisition, logistics, and financial management reform . . . . . . . . . . . . . . . . . . . . . . . . . . 54
5. The thermidor in military affairs . . . . . . . . . . . . . . . . . . . . . . . . . . . . . . . . . . . . . . . . . . . . . . 56
Notes . . . . . . . . . . . . . . . . . . . . . . . . . . . . . . . . . . . . . . . . . . . . . . . . . . . . . . . . . . . . . . . . . . . . . . . 58
Appendix D: Data Sources . . . . . . . . . . . . . . . . . . . . . . . . . . . . . . . . . . . . . . . . . 61

8/14/2019 Pda Briefing Report #20
http://slidepdf.com/reader/full/pda-briefing-report-20 5/77
TABLES AND FIGURES
Table 1. DoD Spending Surge 1998-2008 . . . . . . . . . . . . . . . . . . . . . . . . . . . . . . . . . . . . . . . . 2
Table 2. Allocation of DoD Budget Authority – Total and “Surged” 1999-2010 . . . . . . . . . 3
Table A-1. Allocation of DoD Budget Authority – Total and “Surged” 1999-2010 . . . . . . . . 28
Table A-2. Allocation of post-1998 DoD Spending Among Services and Accounts . . . . . . 36
Table A-3. DoD Budgeting by Service and Appropriation Accounts Divided into
Four Periods Covering 1997-2008 . . . . . . . . . . . . . . . . . . . . . . . . . . . . . . . . . . 37
Table A-4. Change in DoD Budgeting by Service and Accounts 1997-2008 . . . . . . . . . . . 38
Table A-5. Defense-wide Agency & Program Funding 2010 . . . . . . . . . . . . . . . . . . . . . . 40
Table B-1. Percent US Military Overseas & in Contingency Operations . . . . . . . . . . . . . 47
Figure 1. DoD Budget Authority With and W/o Contingency Operations . . . . . . . . . . . xii
Figure 2. DoD Budget Authority 1948-2019 . . . . . . . . . . . . . . . . . . . . . . . . . . . . . . . . . . xii
Figure 3. DoD Budget Outlays 1951-2010 . . . . . . . . . . . . . . . . . . . . . . . . . . . . . . . . . . . . 2
Figure 4. DoD Budget Authority by Appropriation Title 1978-2010 . . . . . . . . . . . . . . . . . 4
Figure 5. DoD Per Person BA by Appropriation Title 1978-2010 . . . . . . . . . . . . . . . . . . . 5
Figure 6. DoD Budget Authority for Modernization 1978-2010 . . . . . . . . . . . . . . . . . . . 17
Figure 7. DoD Per Person BA for Modernization 1978-2010 . . . . . . . . . . . . . . . . . . . . . . 17
Figure A-1. DoD Budget Authority by Appropriation Title 1978-2010 . . . . . . . . . . . . . . . . 24
Figure A-2. DoD Per Person BA by Appropriation Title 1978-2010 . . . . . . . . . . . . . . . . . . 24
Figure A-3. US Military Full-Time Personnel 1978-2010 . . . . . . . . . . . . . . . . . . . . . . . . . . 25
Figure A-4. Real Change BA by Appropriation Title 1978-2010 . . . . . . . . . . . . . . . . . . . . . 26
Figure A-5.Real Change Per Person Budget Authority by Appropriation Title
1978-2010 . . . . . . . . . . . . . . . . . . . . . . . . . . . . . . . . . . . . . . . . . . . . . . . . . . . 27
Figure A-6. Budget Authority by Category 1978-2008 . . . . . . . . . . . . . . . . . . . . . . . . . . . . 29
Figure A-7. Budget Authority Per Person by Category 1978-2008 . . . . . . . . . . . . . . . . . . . 30
Figure A-8. DoD Budget Authority for Modernization 1978-2010 . . . . . . . . . . . . . . . . . . . 32
Figure A-9. DoD Per Person BA for Modernization 1978-2010 . . . . . . . . . . . . . . . . . . . . . . 32Figure A-10. Trends in Military Construction 1951-2010 . . . . . . . . . . . . . . . . . . . . . . . . . . . 34
Figure B-1. World Military Spending Shares 1986-2006 . . . . . . . . . . . . . . . . . . . . . . . . . . 44

8/14/2019 Pda Briefing Report #20
http://slidepdf.com/reader/full/pda-briefing-report-20 6/77

8/14/2019 Pda Briefing Report #20
http://slidepdf.com/reader/full/pda-briefing-report-20 7/77
vi AN UNDISCIPLINED DEFENSE
uncertainty marked by increasing demands and constraints on federal resources. By 2011, grossfederal debt will surpass 100% of GDP. And it will remain above that threshold for theforeseeable future.
The most ready explanation for the post-1998 spending surge is that it is due largely to post-9/11
military operations. In fact, however, these operations account for just 52% of the surge (andonly 17% of total spending during this period). Moreover, the wars have themselves beenexceptionally expensive by historical standards. Measured in 2010 dollars, the Korean conflictcost $393,000 per person/year invested; the Vietnam conflict cost $256,000; and the Iraq andAfghanistan commitments, $792,000 so far. Rather than adequately explain the post-1998spending surge, the high cost of recent military operations only adds to the explanatory burden.
2. The reallocation of DoD funds
Related to the rise in spending, the allocation of DoD funds among appropriation categories also
has changed, and this provides some important clues about cost drivers. The four majorappropriation categories are Personnel, Procurement, Research and Development (R&D), andOperations and Maintenance (O&M). Looking at spending patterns in the 1990s and during thefirst decade of the new century we find:
Overall spending: When divided by the number of full-time military personnel, DoD budgetauthority appears remarkably stable throughout the 25-year period 1983-1998. It begins to risein 1998, accelerating sharply with the onset of the Iraq War. For 2007-2010, it averaged $459,000per full-time person in uniform. This is 78% higher than the Reagan peak, 95% higher than in1989, and nearly three times the inflation-adjusted peak during the Vietnam era.
O&M spending: The proportion of defense spending allotted to Operations & Maintenance hasrisen from 31% in 1989 to 41% today. Calculated on a per person basis, O&M spending began
to climb in the early 1990s . It further accelerated in two bursts beginning 1999 and 2003. In real terms, it is today 2.5 times as much per person as it was at the peak of the Reagan surge.
About 85% of DoD’s civilian payroll is counted as an O&M expense. Over the years, the civilianpayroll portion of O&M spending has mostly varied between 30% and 50%. Much of theremainder of O&M costs involve DoD purchases of goods and services. Since 1989, the “goodsand services” portion has grown significantly, however. Today, it claims around 80% of theO&M budget. And, within this trend, the portion that is contractor services has grown.
Military personnel spending: During the 20-year period 1981-2000, budget authority forpersonnel varied by only a few percent around an average of $73,200 (2010 USD) per person. It
then rose by 46% between 2000 and 2010. The increase was enough to bring total personnelexpenditures back up to Cold War levels – for a military only 69% as large.
Modernization spending: This category combines R&D and procurement spending. Over the thirty-year period 1980-2010, modernization spending has moved in a boom-bust cycle, whichis historically typical for this category. Of course, what is atypical about the 1980-2010 period

8/14/2019 Pda Briefing Report #20
http://slidepdf.com/reader/full/pda-briefing-report-20 8/77
PROJECT ON DEFENSE ALTERNATIVES vii
is that it straddles the end of the Cold War. Reviewing the pattern in modernization spending,however, this event seems to register as little more than a routine dip.
Total modernization spending was 32% lower in the 1990s than in the 1980s. After 1998,however, it began to rebound. For the 2000-2009 period, it was near the 1980s level in real
terms. In per person terms, however, modernization spending for 2000-2009 surpassed the1980s level by 47%.
Comparing just the past four years (2007-2010) with the four peak Reagan years (1983-1986)shows current procurement spending to be 40% higher in real per person terms. In similar
terms, R&D spending is 135% higher.
Shifts in spending priorities: Looking at how the four main “accounts” have fared relative toeach other shows O&M spending to have advanced most significantly. Its relative importancebegan to increase in the early 1990s. Research & Development funding followed a similar
trajectory. Procurement, by contrast, has become more important relative only to militarypersonnel spending, which has slipped in importance.
The greater emphasis on modernization spending relative to personnel spending does not mean that US military power has become much more capital intensive than it was in 1989, however.This is because the principle budget shift, which has been toward a greater emphasis on O&Mspending, actually involves a significant expansion of DoD’s workforce – by means of contractlabor.
3. Explaining the spending surge
Three distinct, but related processes contributed to the exceptional rise in defense spendingafter 1998 and to its present stabilization above Cold War levels. These processes also shaped
the reallocation of funding among appropriation categories.
3.1 Peace versus power dividend
First, in the wake of Soviet collapse, both Republican and Democratic administrations sought to realize a “dividend” in the currencies of both peace and power. The first entailed militaryforce reductions and DoD budget cuts. The second involved adopting more ambitious securitygoals and requiring America’s armed forces to sustain a substantial continuous global presence,increase peacetime engagement activities, and prepare to conduct more types of missions,
faster, across a broader swath of the earth. While smaller, the US military was to be bettersupported and more ready, more deployable, and more active. In addition, all the facets of USmilitary power – the many different types of capabilities and the multiple regional commands– were to be retained, if not enhanced.
The efforts to achieve a peace dividend and a power dividend pulled the budget in oppositedirections. But the two imperatives were supposed to be reconciled by DoD reform and
transformation initiatives that would putatively allow the armed forces to do more for less. An
8/14/2019 Pda Briefing Report #20
http://slidepdf.com/reader/full/pda-briefing-report-20 9/77
viii AN UNDISCIPLINED DEFENSE
additional challenge was that, in becoming smaller, the US military lost some economy of scalein both support and acquisition functions. So the challenge for reformers was considerable.
Reform efforts were to focus principally on trimming infrastructure, streamlining support,renovating business practices, and privatizing various activities. A prospective “revolution in
military affairs,” driven by new information technology, also was supposed to help the armedforces achieve “new efficiencies”.
In implementation, however, both the reform and the transformation agendas fell well short of their promise. In both cases, institutional resistance and bureaucratic inertia proved stronger than the impetus for change. Squeezed between this shortfall and the ambitions of post-ColdWar military strategy, the peace dividend soon vanished.
Effects on the DoD budget and workforce
Increased operational tempo, increased support, and the loss of economies of scale were evident
in the relative rise in O&M spending beginning in the early 1990s. Among other aims, theprospective reforms were meant to allow a transfer of funds from O&M and infrastructureaccounts to procurement. Although some reform efforts – such as base closures – achievedsome savings, these have not amounted to more than 4% of the DoD budget. This has not beensufficient to cover the costs of increased operational tempo, much less a rebound inprocurement.
These developments also have reshaped the DoD workforce. As noted above, the increase inO&M spending correlated with an increased reliance on contract labor, which is generally lessexpensive than either military or civilian DoD labor. (In 2004, the life-cycle cost of a US militaryofficer amortized over a 20-year career was approximately $88,000 per year; for enlistedpersonnel, $43,400 per year.)
Despite increased operational tempo, DoD has been reluctant to permanently increase militaryend strength because of all the follow-on costs involved. Thus, most of the recent additions to
the Army and Marine Corp have been either temporary positions or have been matched byreductions in the Navy and Air Force. The total number of full-time US military personnel by theend of 2010 will be barely 50,000 more than the post-Cold War low point – and 22,000 of thesewill be temporaries.
Rather than add end strength, DoD has focused on squeezing more effort out of the existing poolof military personnel and migrating more of these personnel from the non-deployable to thedeployable portion of the force, and from non-combat to combat positions. Civilian DoD and(especially) contract labor have filled the support gaps left behind. Beyond this, the increasedsupport required by increased operational tempo has been increasingly provided by contractlabor. Indeed, the role of contractors now extends to some basic security and intelligencefunctions.
The result is that DoD’s total workforce is probably as large today as it was in 1989 (or evenlarger), but less of the total is in uniform. This accords with the rise in O&M spending and alsowith studies by Paul C. Light of the Brookings Institution, which suggest that the contractor

8/14/2019 Pda Briefing Report #20
http://slidepdf.com/reader/full/pda-briefing-report-20 10/77
PROJECT ON DEFENSE ALTERNATIVES ix
workforce may have grown by as much as 40% since 1989. By comparison, the full-time militaryand DoD civilian workforces are both about 32% smaller today than in 1989.
3.2 Discordant modernization
The second process contributing to the exceptional surge in defense spending concerns post-Cold War force modernization efforts. The DoD acquisition process has been the subject of frequent criticism by congressional research agencies, the Defense Science Board, and othersfor routinely delivering products late, over cost, and not as capable as promised. But theseproblems cannot fully explain the exceptional circumstance that DoD is facing today.
Since reaching a low-point in the late-1990s, procurement spending has reboundedsubstantially, rising by more than 160% in real terms. Not since the nation undertook crashrearmament for the Korean war has as much been spent in a single year as in 2008, when theprocurement account was allotted $170 billion (2010 USD). As noted above, recentmodernization spending is comparable to Reagan levels. And, in real per person terms, it
surpasses them substantially.
And yet, while the earlier period is remembered as one of robust modernization, today’s effortsare viewed as “troubled” from all sides.
What distinguishes recent practice is a dysfunction that we call “discordant modernization”.Beginning in the early 1990s, acquisition practice has been riven by several, contending trendsor visions. More important, DoD has failed to adequately prioritize among them or to compelintegration. So these have all lurched forward together, layered one atop the other.
Looking at recent practice, we can distinguish three modernization trends: Legacy,Transformational, and Adaptive.
# Legacy efforts carry forward and seek to enhance the pivotal platforms and capabilitiesof the recent past;
# Transformational efforts seek to achieve dramatic increases in effectiveness or efficiencyby employing new technology, techniques, and forms of organization;
# Adaptive efforts correspond to the perceived requirements of new security missions andcircumstances – such as stability operations, counter-insurgency, and counter-terrorism.
Given strong strategic guidance and prioritization from the center, these efforts can be fullyintegrated. Otherwise, they will proceed in a discordant way, competing for funds – acircumstance that, like inter-service rivalry, exerts unrelenting upward pressure on the budget.The Army’s recent modernization agenda provides a particularly acute example. But theproblem is evident as well in, for instance, the Navy’s program which, apart from the decision
to retire battleships, has sought to modernize virtually every type of surface, subsurface, andaircraft capability, while adding cruise-missile subs, littoral combatants, remotely pilotedvehicles, and tilt-rotor aircraft. And, of course, like every service, the Navy is attempting to buildits own encompassing C4I network.

8/14/2019 Pda Briefing Report #20
http://slidepdf.com/reader/full/pda-briefing-report-20 11/77
x AN UNDISCIPLINED DEFENSE
When strategic discipline is lax, legacy modernization tends to predominate, due to itsinstitutional momentum. Eventually, external circumstances may compel a rush of ad hoc
adaptive measures – as is the case today with regard to procurement to meet counter-insurgency needs. These may then come to predominate, prematurely. The only remedy is tostrongly discipline force modernization in accord with a sustainable, adaptive, and cost-effective
national security strategy. The various scenarios and missions that define militaryrequirements must be strongly prioritized, and these priorities must be enforced from the center.
In a broader perspective, discordant modernization risks detaching the nation’s finite defenseresources from its actual security needs. In the decade before the 9/11 attacks, the UnitedStates spent over $1 trillion on military modernization. But most of this expenditure provedirrelevant to defending against the most serious attack on America in 60 years. Subsequently,
three more years of funding added another $450 billion dollars to modernization accounts, butstill the nation found itself ill-equipped to execute the new tasks it had undertaken: counter-insurgency in Iraq and Afghanistan.
3.3 Going to war (with the military you have)
The third process contributing to the post-1998 spending surge was America’s protractedcommitment to two wars of a type for which its armed forces were ill-prepared. As noted above,fully 52% of the spending surge (and 17% of total spending since 1998) can be attributed tocontingency operations – principally to the Iraq and Afghanistan wars. Although war costsexplain a significant portion of the surge, they also beg the question: Why have these warsproved so much more expensive in real terms than their predecessors?
Part of the reason is that the United States found itself inadvertently fighting “Mr. Johnson’swar” using a reduced version of “Mr. Reagan’s military.” Unlike during the Vietnam War era,
the United States today employs an all-volunteer (that is, professional) force. The logic of thispolicy ensures that long, exhausting, labor-intensive wars will drive personnel costs sharplyhigher, as DoD must bid higher to recruit and retain personnel. And they have: after remainingvirtually flat in real terms for 22 years, military personnel spending measured on a per person
basis rose 46% between 2000 and 2010. Slightly more than half of this was war-related.
In one obvious respect – size – today’s uniformed military is not Mr. Reagan’s or Mr. Johnson’s.In this respect, too, America’s military was ill-suited to undertake occupation and counter-insurgency tasks in two challenging locales with a combined population of approximately 50million. Principally, DoD sought to compensate by employing a uniquely high proportion of contractors. The Congressional Research Services estimates that 240,000 are employed in theCENTCOM area today – and more are on the way. In budgetary terms, this registers as above-average O&M costs – and the wars are responsible for 73% of the surge in O&M spending.
The wars are also responsible for nearly 43% of the post-1998 surge in modernization spending.The challenge has been not simply to replace the equipment consumed in war, but also topurchase entirely new fleets of equipment suited to these wars (such as Mine Resistant AmbushProtected vehicles) and to significantly adapt existing fleets. As noted above, despite nearly$1.45 trillion in modernization spending during 1991-2004 – including much invested in ground

8/14/2019 Pda Briefing Report #20
http://slidepdf.com/reader/full/pda-briefing-report-20 12/77
PROJECT ON DEFENSE ALTERNATIVES xi
combat vehicles – the United States found itself ill-equipped for the major types of operationsit chose to conduct. More than three years of fighting passed before DoD began to seriously re-orient its procurement programs.
4. Enabling conditions
The three policy paths outlined above have converged to give America a historically uniqueglobal edge in military spending. This has not purchased clear and sure progress toward amore secure and stable world, however. Nor has it produced an especially efficient military,closely adapted to the current security environment.
The road not taken – at a cost of some trillions of dollars – would have involved somecombination of (i) a more forceful and thorough-going approach to Pentagon reform, (ii) anintegrated or “joint” approach to force modernization and transformation, tailoring these closely
to new era conditions, and (iii) greater restraint in setting post-Cold War military goals andmissions. That this has not occurred suggests a lapse in attention to the strategic costs andbenefits associated with our chosen defense posture. It is as though the nation has trillions toburn.
A permissive spending environment is the precondition for the types of problems identified in this report. It is easy enough to point to the 11 September 2001 attacks as the progenitor of thiscondition. However, as we note, the surge in spending began before 2001. Moreover, Galluppolls show that public support for increased spending was higher in the two years prior to theattacks than in the two years after. And it has receded significantly since then. This points toa more fundamental enabling condition: presently there seems to be little political gain (andmuch risk) in pressing for the type of tight DoD budget constraints that might prompt through-going reform and transformation. Nonetheless, emerging fiscal realities may soon compelincreased attention to how the nation allocates scarce resources among competing nationalgoals -- foreign and domestic, military and non-military. And this might put the nation on theroad to a disciplined defense.

8/14/2019 Pda Briefing Report #20
http://slidepdf.com/reader/full/pda-briefing-report-20 13/77
8/14/2019 Pda Briefing Report #20
http://slidepdf.com/reader/full/pda-briefing-report-20 14/77
PROJECT ON DEFENSE ALTERNATIVES 1
An Undisciplined Defense: Understanding the
$2 Trillion Surge in US Defense Spending
1. Introduction: Why more than the Cold War?
The year 1998 was the beginning of the end for what had been heralded as the post-Cold War“peace dividend”. That year, US budget authority for the Department of Defense (DoD) reachedits post-Cold War low point: $361.5 billion (calculated in 2010 USD). Over the next decade,Pentagon spending would rise by more than 90% in real terms before declining marginally in2009.
All told, the Pentagon was authorized to spend nearly $6.5 trillion during the period 1999-2010.Of this, $2.15 trillion was above the level set in 1998. In other words: $2.15 trillion more wasspent during 1999-2010 than would have been the case had 1998 budget levels been sustained,
rising only at the rate of inflation for the military “basket of goods”. This $2.15 trillion constitutes what we call the post-1998 “surge” in Pentagon spending. And only about half of these addedfunds are attributable to America’s recent wars and counter-terrorism operations abroad.
These are significant sums – dwarfing the cost of the recent US bank bailout, stimulus package,and health care reform effort. And they mark only the beginning. Looking forward, the Obamaadministration plans to spend at least $5 trillion (2010 USD) on defense during 2010-2017, whichis 5% more in real terms than the Bush administration authorized for 2002-2009.{1} And,notably, the portion of the Obama budget so far set aside for today’s wars is only a “placemarker” figure for years after FY 2010. It has already risen higher than was planned in mid-2009.
The bedrock reality is this: Whether one looks at the planned total DoD budget, or just thatportion not attributable to today’s wars, US defense spending is stabilizing at levelssignificantly above Cold War peaks (adjusted for inflation) – and far above the Cold War averagein real terms. As this is occurring, the United States is also entering a period of economicuncertainty marked by increasing demands and constraints on federal resources.
Do the exigencies of war and security explain and require these unprecedented levels of defenseexpenditure? Are today’s military security challenges actually greater than those of the ColdWar era? What other factors might be driving US defense expenditures to unprecedentedheights?
In this report we examine the recent dynamics of US defense spending, focusing on the Defense
Department budget (federal budget function 051), which constitutes about 95% of theencompassing National Defense budget function (050).{2} After summarizing the evolution of DoD spending in various accounts across a period of 30 years, the report identifies several“drivers” of the recent spending surge and relates these to distinct changes in US defensepolicy. We are especially careful to distinguish between that part of post-1998 spending related
to current wars (about 17%) and that part having to do with how DoD more broadly provisionsfor national defense.

8/14/2019 Pda Briefing Report #20
http://slidepdf.com/reader/full/pda-briefing-report-20 15/77
2 AN UNDISCIPLINED DEFENSE
Apart from DoD, the report does not assess national security spending by other agencies. Asnoted, the DoD budget constitutes approximately 95% of the National Defense budget function(050), with most of the rest going to the Department of Energy. Other agencies and programswhose budgets should also be considered part of America’s national security costs include theDepartment of Homeland Security ($42.7 b), Veteran’s Affairs ($55.9 b), and portions of theInternational Affairs program ($51.7 b).
2. The post-1998 surge in US defense spending
In 1998, the DoD budget reached its post-Cold War low point: $361.5 billion (2010 USD).Between then and 2008, US defense spending rose 92.7% to $696.5 billion in 2008. That portionof the budget supposedly unrelated to operations abroad – the peacetime or “base budget” –rose 41%. The surge occurred in three distinct bursts: pre-9/11 (1998-2001), post-9/11 (2001-2003), and post-Iraq invasion (2003-2008).
able 1. The DoD Spending Surge, 1998-2008($ amounts in billions 2010 USD)
1998 2001 98 > 01 2003 01 > 03 2008 03 > 08 98 > 08
DoD including operations 361.5 398.8 10.3 % 529.8 32.8 % 696.5 31.5 % 92.7 %
DoD base budget 356.5 376.9 5.7 % 442.7 17.5 % 503.1 13.6 % 41.1 %
Sources: see Data Sources appendix
Figure 3. DoD Budget Outlays 1951-2010(Billions 2010 USD)
200.0
450.0
700.0
1 9 5 1
1 9 5 4
1 9 5 7
1 9 6 0
1 9 6 3
1 9 6 6
1 9 6 9
1 9 7 2
1 9 7 5
1 9 7 8
1 9 8 1
1 9 8 4
1 9 8 7
1 9 9 0
1 9 9 3
1 9 9 6
1 9 9 9
2 0 0 2
2 0 0 5
2 0 0 8
National Defense Outlays Average 1951-2003
Sources: See Data Sources appendix.

8/14/2019 Pda Briefing Report #20
http://slidepdf.com/reader/full/pda-briefing-report-20 16/77
PROJECT ON DEFENSE ALTERNATIVES 3
As noted previously, aggregate DoD authorization during the period 1998-2010 was nearly $6.5 trillion, which is $2.15 trillion more than would have been spent had annual DoD budgets beencapped at the level prevailing in 1998 (adjusted for inflation). Of the $6.5 trillion authorizedsince 1998, about 17% (or $1.1 trillion) was allocated for “Global War on Terrorism” (GWOT)initiatives, including operations in Iraq and Afghanistan. This allotment for war constitutes
approximately 52% of the funds added above 1998 levels. (See Figure 1.)
An unprecedented surge
As evident in Figure 2, the post-1998 surge has no precedent in all the years since the Koreanwar (when the US military had been compelled to rapidly reconstitute after undergoing aprecipitous 88% post-WWII budget cut).
This recent surge most readily compares with two earlier, but lesser ones: the 1958-1968Kennedy-Johnson surge of 43% and the 1975-1985 “Reagan surge” of 57%. The first of theseinvolved the conduct of the Vietnam War as well as an effort to expand, recapitalize, and
transform the force. The second emphasized recapitalization and a modest increase in force size(8.8 %).
able 2. Allocation of DoD Budget Authority – Total and “Surged” 1999-2010
(Billions 2010 USD)
Total DoD $1999-2010
% Wars $ above 1998Baseline
Allocation of post-1998Spending “Surge”
BaseBudget
Wars % for BaseBudget
% for War
RDTE 823.13 1.63% 261.15 247.72 13.43 94.9% 5.1%
Procure 1252.14 20.03% 583.07 332.30 250.77 57.0% 43.0%
O&M 2582.86 25.29% 892.24 239.12 653.11 26.8% 73.2%
Pers 1570.50 10.29% 302.72 141.09 161.63 46.6% 53.4%
Other 253.43 13.55% 104.71 70.37 34.33 67.2% 32.8%
Total 6482.06 17.17% 2143.88 1030.6 1113.28 48.1% 51.9%
Sources: see Data Sources appendix
The 1998-present surge not only surpasses the two previous ones in terms of magnitude of growth, but also in terms of the new spending ceiling it sets. The Kennedy-Johnson surge
topped-off at about $520 billion in 2010 dollars; The Reagan surge, $560 billion. The recent surgepeaked in 2008 at $697 billion (2010 USD).
Looking at defense outlays – that is, the money actually spent each year and not just authorized– there is a remarkable consistency apparent throughout the period 1951-2002. (See figure 3.)

8/14/2019 Pda Briefing Report #20
http://slidepdf.com/reader/full/pda-briefing-report-20 17/77
4 AN UNDISCIPLINED DEFENSE
Figure 4. DoD Budget Authority by Appropriation Title 1978-2010
(Millions 2010 USD)
0
200000
400000
600000
800000
1 9 7 8
1 9 8 0
1 9 8 2
1 9 8 4
1 9 8 6
1 9 8 8
1 9 9 0
1 9 9 2
1 9 9 4
1 9 9 6
1 9 9 8
2 0 0 0
2 0 0 2
2 0 0 4
2 0 0 6
2 0 0 8
2 0 1 0
RDTE Procure O&M Pers Other
Sources: see Data Sources appendix.
Figure 5. DoD Per Person BA by Appropriation Title 1978-2010
(000's 2010 USD)
0.0
100.0
200.0
300.0
400.0
500.0
1 9 7 8
1 9 8 0
1 9 8 2
1 9 8 4
1 9 8 6
1 9 8 8
1 9 9 0
1 9 9 2
1 9 9 4
1 9 9 6
1 9 9 8
2 0 0 0
2 0 0 2
2 0 0 4
2 0 0 6
2 0 0 8
2 0 1 0
RDTE Procure O&M Pers Other
Sources: see Data Sources appendix.

8/14/2019 Pda Briefing Report #20
http://slidepdf.com/reader/full/pda-briefing-report-20 18/77
PROJECT ON DEFENSE ALTERNATIVES 5
The average annual outlay for the entire period is $425.4 billion. Across 50 years, there areoccasional surges and recessions, but these remain almost entirely within a band of plus orminus 25%. The recent surge breaks out of this 50-year pattern, however, with outlays risingmore than 30% above the average after 2006 and peaking at nearly 63% higher in 2010.
According to Obama administration plans for the years after 2015, the new anchor line forannual outlays will be some value over $560 billion – a solid one-third higher than the long-termCold War average in real terms.
3. Summary of empirical findings
Analyzing how the Pentagon allocates its funds among different functions, and how thisallocation has changed over time, provides important clues about the dynamics driving thesurge in spending. We examine allocation trends in detail in the Data Review appendix. Ourprincipal findings, however, are presented below.
Figures 4 and 5 cover the period 1978-2010, giving different views of the allocation of DoD fundsamong key congressional appropriation categories: Military Personnel, Operations andMaintenance (O&M), Procurement, and Research, Development, Testing, and Evaluation(RDT&E – henceforth R&D).
Both charts are based on budget amounts converted to 2010 dollars (that is, adjusted forinflation). Figure 4 shows the change in total budget authority for each “account”. Figure 5shows the same, but on a per person basis, which is a way of filtering out those changes thatare due to fluctuations in the size of the US military. By controlling for force size, we bring to
the fore those changes in spending and in allocation that reflect other factors. (“Per person”means per full-time person in uniform).
Notably, although not shown in these charts, the O&M category divides further into twosubcategories: “pay” (which covers approximately 85% of DoD civilian employees) and “non-pay” (which covers purchases of goods and services, including contractor labor).
Summary of Key Trends
Overall spending
When measured on a per person basis, DoD budget authority appears remarkably stable
during the 25-year period 1983-1998. It began to rise in 1998, however, acceleratingsharply with the onset of the Iraq War, before settling at an average of $459,000 per
person for the years 2007-2010. This is 78% higher than the Reagan peak, 95% higher than on the eve of the first Gulf War, and nearly three times the inflation-adjusted peakduring the Vietnam era. Setting aside war costs, the Obama administration plans tostabilize per person expenditures at about $377,000 per person in today’s dollars, whichis 57% higher than the average for 1983-1998.

8/14/2019 Pda Briefing Report #20
http://slidepdf.com/reader/full/pda-briefing-report-20 19/77
6 AN UNDISCIPLINED DEFENSE
O&M spending
An important contributing factor to the general rise in spending has been the Operationsand Maintenance (O&M) account. Calculated on a per person basis, O&M spendingbegan to climb sharply upward in the early 1990s. Its climb accelerated further with the
onset of the post-9/11 wars, before settling at a level in 2010 that is 160% higher than the1989 level in real per person terms. Today, DoD is allocating more than 2.5 times asmuch per person to O&M as it was at the peak of the Reagan surge.
The proportion of the DoD budget allocated to O&M has been rising steadily since 1979.Most of the growth in O&M as a portion of the budget occurred between 1989 (31%) and1999 (39%). Today, it claims about 41% of the total DoD budget.
Civilian & contractor labor
An important factor in the O&M rise during the mid-1990s was the balance between DoD
civilian and military payroll. The civilian payroll – which is largely paid out of O&M –went from being 49% as large as the military payroll during the 1980s to being 57% aslarge during the 1990s. Subsequently, it receded back to 44% during 2000-2008.Complementing this trend (and eventually overtaking it) was increased reliance on“outsourcing” or contracting. This registers as part of “non-pay” O&M expenditures.Beginning in the 1990s and accelerating sharply after 1998, DoD has allocated muchmore of its resources to non-pay O&M, including contracts.
R&D and procurement spending
Over the thirty-year period 1980-2010, “modernization spending” (that is, procurementand R&D spending taken together) has moved in a typical boom-bust cycle, as though
the end of the Cold War was a routine event. Total modernization spending was 32%lower in the 1990s than in the 1980s. However, in 2000-2009, total modernizationspending rebounded to near the 1980s level in real terms. Measured in per person terms,1990s modernizaton spending was only 14% lower than 1980s spending, while spendingduring 2000-2009 was fully 47% higher in real terms than during the 1980s. During thepast four years, per person modernization spending has averaged 53% higher than thehighest year of Reagan modernization spending.
Personnel spending
During the 20-year period 1981-2001, budget authority for personnel varied by only a fewpercent around an average of $73,200 (2010 USD) per person. However, between 2001and 2010, it rose 40%. The increase was sufficient to bring total personnel expendituresback up to Cold War levels – for a military only 69% as large. Slightly more than half of
the post-1998 boom in personnel spending was due to the wars.

8/14/2019 Pda Briefing Report #20
http://slidepdf.com/reader/full/pda-briefing-report-20 20/77
PROJECT ON DEFENSE ALTERNATIVES 7
4. What drives the DoD spending surge?
With an eye on the trends summarized in the previous section, we can turn our attention to ourcentral question: Why should today’s total DoD budget be higher in real terms than during theCold War, when the United States faced a peer adversary alliance in a contest spanning the
globe and encompassing multiple small wars and insurgencies?
The most ready answer – “the current wars are to blame” – clearly falls short. These, and thebroader “global war on terrorism,” account for only 52% of the post-1998 surge and only 17.2%of total DoD spending authority for the period 1999-2010. The remainder of spending is devoted
to the peacetime or “base” portion of the budget, which jumps 55% during the period. Why sucha surge?
For that matter, we might ask: Why should America’s current wars be so much more expensive
in real terms than those of the past?
# America’s Korean commitment involved 1.4 million personnel-years and cost $550 billion(2010 USD) or $393,000 per person year.
# The US involvement in Vietnam comprised 2.7 million personnel-years and cost $690billion (2010 USD) or $256,000 per person year.
# By comparison, the Iraq and Afghanistan commitments have so far consumed 1.2 millionpersonnel years and cost more than $950 billion (2010 USD) or $792,000 per person year.
Certainly, the 9/11 attacks opened the door to a spending boost, politically. But they did notdictate its character or magnitude. At any rate, by 2001 the US defense budget had alreadyentered an expansion phase, leaving behind hopes for an enduring peace dividend.
In the next sections, we examine some of the factors shaping the character and extent of thepost-1998 boost in defense spending with an eye toward discerning matters of “policy choice”.
What policy aspirations and imperatives have helped drive the DoD budget above ColdWar heights?
Is there something about our way of producing military power and sustaining it thatraises putative budget requirements?
Elements of an answer
Beginning early in the post-Cold War era, a set of long-standing problems and trends in USdefense policy intersected with new ones to produce unrelenting upward pressure on the DoDbudget. This intersection also primed the budget to balloon under the pressure of wars of the
type that consume America today in Iraq and Afghanistan.
As we shall see, the explosive growth in US defense spending involves the confluence of a setof factors – some as causes, others as consequences:

8/14/2019 Pda Briefing Report #20
http://slidepdf.com/reader/full/pda-briefing-report-20 21/77
8 AN UNDISCIPLINED DEFENSE
# America’s long-term strategy of emphasizing “quantity over quality” in developing itsarmed forces;
# The 1970s transition to a military based on high-priced volunteer labor;
# The growing complexity of US military power;
# The adoption after 1989 of more ambitious, yet less focused defense goals and missionsin the context of force reductions;
# The loss of economies of scale in both support and acquisition activities thataccompanied the post-Cold War reductions in force size;
# The failure of efforts at Defense Reform and Military Transformation to sufficiently fulfill their promise of allowing the armed forces to do “more for less”;
# The onset of unplanned, protracted, labor-intensive counter-insurgency campaigns;
# The fragmenting of US modernization efforts into several discordant strains; and,
# A surge in DoD’s dependency on contract labor.
4.1 Peace versus power dividend
The nation’s national security leadership – Republican and Democratic alike – entered the post-Soviet era hoping to realize both a fiscal “peace dividend” and a strategic “power dividend”.
The “power dividend” involved adopting more ambitious security goals and tasking a smallermilitary to maintain global presence, increase peacetime engagement activities, and conduct
more types of missions, faster, across a broader swath of the earth. This entailed retaining all the facets and the full reach of US military power, despite retrenchment. But how could this beaccomplished given force and budget reductions?
Reconciling the pursuit of both a peace and a power dividend depended on achieving new DoDefficiencies in two ways: first, by means of a program of institutional reform and, second, bymeans of a technology-based “revolution in military affairs”(RMA). Related to both of theseinitiatives was additional pressure on the armed services to become more “joint” in all theiractivities and, thus, more effective and efficient.
As it turned out, the dual program of DoD reform and transformation failed to deliver sufficientlyon the promise of enabling the services to do “more for less”. (Indeed, rather than lowering
overall modernization costs, the RMA initiative simply added a new layer to putativerequirements.) Essentially, the shortcomings in reform and transformation meant that “doingmore” would cost more. Indeed, it would cost much more due, in part, to the loss of economiesof scale in support and acquisition activities, which was the price of size reductions when notcomplemented by sufficient re-engineering of the armed forces.

8/14/2019 Pda Briefing Report #20
http://slidepdf.com/reader/full/pda-briefing-report-20 22/77
PROJECT ON DEFENSE ALTERNATIVES 9
Further adding to these costs would be the post-9/11 advent of wars of a type for whichAmerica’s armed forces were ill-prepared and wrongly-equipped (despite their having invested$1.2 trillion in modernization during the 1990s).
The pursuit of a power dividend is explored in more detail in Appendix B: Goal inflation in post-
Cold War US defense strategy. The shortfall in efforts to reform and transform DoD is exploredin Appendix C: More for less? The limits of defense reform and military transformation.
The next section examines the specific pressures and initiatives that channeled US militarydevelopment down an avenue of increasing cost during the 1990s and the first decade of thenew century. Not only have costs surged, but the allocation of Pentagon funds has changeddramatically. With this, the foundation of American military power has altered in at least onesignificant way: private defense contractors have come to play a more important role than everbefore.
4.2 Dilemmas of the drawdown
Long-term development trends
The post-Cold War changes in America’s armed forces occurred in the context of alreadyongoing efforts at force transformation. One began in the 1970s with the transition from aconscript to a volunteer or professional military. Another began in the 1980s with the effort torecapitalize the post-Vietnam military and improve its readiness. Both of these fit into an evenlonger-term force development strategy that emphasized quality over quantity. This strategyaimed to build on America’s presumed competitive advantages over likely opponents: greater
technological competency and a more skilled and motivated workforce.
The switch to a professional military produced a more reliable and ready cadre.{3} It alsosignificantly increased personnel costs, which averaged 23% higher in real per person termsduring the 1980s than during the 1960s. Although initially motivated by the Vietnamexperience, the switch was consonant with the longer-term “quality over quantity” strategy.{4}And, indeed, the transition has seemed cost-effective in terms of value per unit of cost, as longas compensation is competitive and sufficient funds are invested in recruitment.{5}
The “quality over quantity” strategy, and the dependence on high-cost personnel, also impliedincreased per person allocations for research, development, and procurement – an objective thatcame more into reach once America had exited its consumptive commitment in southeast Asia.But the resultant posture carries with it an inherent constraint: there is a size threshold beyond
which the cost of competing for and adding quality personnel becomes prohibitive.{6} Where that threshold sits depends on both intrinsic and extrinsic factors. The intrinsic factors include the amount of pressure the Pentagon puts on its personnel and the general state of militarymorale; the extrinsic include general economic conditions and population demographics.
8/14/2019 Pda Briefing Report #20
http://slidepdf.com/reader/full/pda-briefing-report-20 23/77
10 AN UNDISCIPLINED DEFENSE
Into the new era: a more “ready” and deployable force
Both the George H.W. Bush and Clinton administrations began to implement force reductionsin ways generally consonant with the “quality over quantity” strategy, aiming to match cutswith an increase in the readiness and deployability of the resultant, smaller force. This implied
higher operations and maintenance (O&M) expenditures per person.
Operations and maintenance spending already had increased dramatically and across the boardduring the 1980s, rising about 22% per person in real terms. This, too, was consonant with the“quality over quantity” strategy. Nonetheless, throughout the 1980s, parts of the US militaryremained heavily dependent on overseas host nations for support functions, which crimped theircapacity for flexible, rapid deployment.
The post-Cold War reductions were supposed to leave in place a more ready and better-supported force. Force structure – numbers of divisions, air wings, and ships – was reducedmore than personnel, so that the residual units could be better filled. Moreover, the ratiochanged between “shooters” and all those people, activities, and assets who supported them
– in favor of support. This boost in support was partly a “forced choice” and partly a free one.It is simply easier to slice away combat units than it is to appropriately downsize the complexweb of supporting structures (and infrastructure). An optimistic perspective was that “right-sizing” support would take more time and effort.
The repercussion for O&M spending during the 1990s was clear: it rose 30% on a per person
basis in real terms. (Total O&M expenditures did decline by 12%, but the decline in totalpersonnel numbers was greater.) Especially benefitting were mobility capabilities, logistics,and central support and administration.{7} Not all of this was real “benefit” to the armedforces, of course. As just noted (and addressed in more detail below), the rise in per person
O&M expenditures also reflected the retention of considerable excess support functions andinfrastructure. But this gave hope that additional savings might be achieved by carefully
identifying and trimming the excess. More than a hope, this was a necessity if the peacedividend were to be maintained. It was a necessity because, with O&M expenditures claiminga greater share of the budget, there was little or no room within “peace dividend” constraintsfor modernization spending to rebound. Something had to give.
A procurement holiday?
Procurement spending underwent the greatest post-Cold War decline: average budget authorityfor procurement in the 1990s was 44% lower in real terms than in the 1980s. The decline inaverage per person expenditure was somewhat less: 31% – still, a considerable cut. But twofactors helped mitigate it:
First, the Reagan-era DoD had capitalized a larger arsenal, which it then bequeathed to the 1990s. This was Reagan’s gift to Clinton. When reductions took hold, the retirementof older equipment effectively lowered the average age of equipment pools, thusachieving what might be called “virtual modernization.” For a while, the post-Cold WarPentagon could live off of the 1980s – if it were willing.

8/14/2019 Pda Briefing Report #20
http://slidepdf.com/reader/full/pda-briefing-report-20 24/77
PROJECT ON DEFENSE ALTERNATIVES 11
Second, total spending on Research and Development (R&D) was sustained during the1990s in real terms. Thus, comparing the two decades, it actually rose on a per person
basis by 32%. Looking at procurement and R&D spending together shows a combined,real decline of only 14% per person.
Budget authority for procurement reached its post-Cold War nadir in 1997: $54 billion (2010USD). The above caveats notwithstanding, no one at the time doubted that procurementspending would soon have to rise again. Barring further cuts in force structure, even a moderateprogram of recapitalization might aim to achieve an annual average of $75 billion inprocurement spending, once the Reagan cascade had been fully absorbed. Of course, theservices were seeking much more. But – be it more or less -- from where would these fundscome, if the peace dividend were to be preserved? The target for savings was excess O&M andinfrastructure spending.
Vacating the peace dividend
The aim of the prospective institutional reforms was to cover as much of future modernizationcosts as possible, while also absorbing the costs of increased operational tempo. In this way,
the peace dividend would be preserved. As explained in Appendix C, institutional reformsaimed to accomplish this feat by means of improved business practices, organizationalstreamlining, consolidations, and outsourcing.
In fact, in the years since 1995, some annually recurring savings have been realized – althoughprobably not an amount equal to more than 4% of today’s base budget, which is not enough.Such a modest level cannot even fund the growth in peacetime operational activity – to saynothing of war and full-bore modernization.{8}
In summary: the shortcomings in reform and transformation efforts guaranteed that there would
be a three-way zero-sum contest between:
# Higher readiness and operational tempo (even before the wars);
# Modernization, and the
# Peace dividend.
In this contest, the peace dividend lost badly. And the advent of the post-9/11 wars has onlymade matters worse. Adding to the pressure has been an unexpected surge in personnel costs,which we examine in the next section, and an undisciplined approach to force modernization,which is examined in Section 4.4.
The road not taken – at a cost of some trillions of dollars – would have involved somecombination of (i) a more forceful and thorough-going approach to Pentagon reform, (ii) anintegrated or “joint” approach to force modernization and transformation, adapting these closely
to new era conditions, and (iii) greater restraint in setting post-Cold War military goals andmissions.

8/14/2019 Pda Briefing Report #20
http://slidepdf.com/reader/full/pda-briefing-report-20 25/77

8/14/2019 Pda Briefing Report #20
http://slidepdf.com/reader/full/pda-briefing-report-20 26/77
PROJECT ON DEFENSE ALTERNATIVES 13
First (and obviously), the post-Cold War cuts in the number of miliary personnel and DoD“in-house” civilians (with a small percentage of military positions recently restored).
Second, some migration of military personnel from the “non-deployable” to the“deployable” segment of the forces. All told, the annual Defense Manpower
Requirements Reports show a migration of 59,000 military positions from theinfrastructure category to the “operating forces” category during the period 2000-2009.{10}
Third, the replacement of military personnel in some roles by civilians (either DoDemployees or contracted labor). Similarly, DoD civilian employees have beenincreasingly subject to replacement by cheaper, contract labor. And,
Fourth, a general growth in the proportion of the Pentagon workforce that is privatecontract labor. This growth far exceeds the replacement of DoD military and civilianpersonnel just cited.
There is more to this program than just the desire to optimize the use of military personnel or to achieve “savings” by having government and private entities compete for jobs. Principally, there is a drive to bring more hands to the task.
Between 1994 and 2004 as many as 15,000 military personnel were transferred (or due to be transferred) to new positions as a result of competitive outsourcing efforts. (As noted by theGAO, “when work performed by uniformed personnel is outsourced, the personnel generally areassigned to other duties.”){11} Between 2004 and 2010, another 48,000+ military positionswere slated to be soon filled by DoD civilians or contract personnel. Of these 48,000 personnel,19,000 (all Army and Marine Corp) are being transferred to other duties – many in support of theArmy’s new modular brigades.
Competitive outsourcing has effected DoD civilian personnel more than uniform personnel. But,in this case too, many of those displaced simply moved to other jobs. According to a 2004 study,between 1995 and 2003, more than 65,000 DoD civilian positions were subject to public-privatecompetition under the stringent guidelines set out in OMB Circular A-76.{12} As a result, nearly25,000 DoD civilian positions were cut. However, 11,000 of the displaced employees simplymoved to other positions.
It is clear that the A-76 public-private competitions result in lower costs to DoD, regardless of whether the winner is a public or private entity.{13} Competition brings lower costs. This doesnot mean that the savings escape the Pentagon’s orbit, however. Nor does it mean thatadditional funds are available for modernization. To the extent that displaced DoD personnelare retained and transferred, while new (and less expensive workers) fill their former jobs, both
the workforce and the budget have grown.
DoD contracting trends
By far, most DoD contracting is not governed by the A-76 process, which dictates strongcompetition. Reviewing contracting practices outside the A-76 process during the period 1998-

8/14/2019 Pda Briefing Report #20
http://slidepdf.com/reader/full/pda-briefing-report-20 27/77
14 AN UNDISCIPLINED DEFENSE
2003, a study conducted by the Center for Public Integrity has found that only 36% of DoDcontracts were awarded with both “full and open” competition and more than one bidder inplay.{14} So the extent of savings to DoD from most outsourcing is unclear.{15} Anotherpersistent problem is DoD’s failure to closely manage contracts and to carefully collect andcollate the data necessary to their assessment.{16} What is clear, however, is that (i) private
contracts are claiming a larger share of the DoD budget in recent years and (ii) the role of contract labor in the Pentagon’s workforce is growing.
Between 1989 and 1999, DoD purchases of outside goods and services grew as a part of thebudget from 45% to 47.5%. Between 1999 and 2009 it grew further to approximately 57% of thebudget.{17} GAO estimates that DoD’s total contract obligations were over $387 billion in 2008,having doubled since 2001.{18} This growth has occurred in the context of a longer-term trend:
the proportion of purchases that are “services” has been steadily growing, while the proportion that is “goods”, falling. According to one study of DoD contracts, “services” constituted more than one-third of purchases in 1984, but 56% by 2003.{19} Together, these trends underlineDoD’s increasing reliance on contract labor – the so-called “shadow workforce”.
The growth of DoD contract labor
In tandem with the increasing role of service contracts, contract labor is growing as a proportionof the DoD total workforce. Indeed, DoD’s shadow workforce may have grown by as much as40% since 1989 (while the pool of military and DoD civilian personnel each declined by 32%). Thegrowth rate of contract labor is suggested by a series of studies conducted by Paul C. Light of
the Brookings Institution and NYU’s Wagner Graduate School of Public Service.{20} These use the US Bureau of Economic Analysis’ input-output model of the US economy to resolve everydollar of federal contracting, whether for goods or services, into a labor value. The estimate isrough and surely overstates the size of the DoD contractor force (partly because it also capturessecondary workers, such as contractors’ own accountant services). But it remains valuable as
an indicator of scale and, especially, as a foundation for trend analysis. Light’s 2006 study, The New True Size of Government, indicates that DoD contracts employed as many as 5.2 millionworkers in 2005, either directly or indirectly.
Other indicators of the size of the shadow workforce tend to be partial or subject toundercounting. These include a finding that the Army alone had 228,000 contract employeesin 1996, when contract expenditures were less than half of what they are today (in real terms).In 2009, the Congressional Research Service reported that the Central Command area alonehosts over 240,000 DoD contractors.{21}
Even if one substantially discounts Light’s absolute numbers, his trend analysis provides animportant insight into DoD workforce dynamics: between 1989 and 2005, the pool of DoD
contract labor has grown more than the pool of uniform and civilian employees has declined. If we cautiously discount the study’s absolute numbers by 30%, it would still suggest that DoD’s
total workforce – military, civilian, and contractor – was as large in 2005 as it was in 1989, at theclose of the Cold War. And this would certainly entail that it is today larger than in 1989.
The prospect that the total DoD workforce is today as large or larger than it was in 1989comports well with the observed changes in the DoD budget authority, which for 2010 exceeds

8/14/2019 Pda Briefing Report #20
http://slidepdf.com/reader/full/pda-briefing-report-20 28/77
PROJECT ON DEFENSE ALTERNATIVES 15
the Reagan-era average in real terms (even when war spending is discounted). Similarly, asharp rise in the proportion of the budget devoted to contracting, and in the proportion of theworkforce that is contract labor, comports with the observed dynamics of O&M, R&D, andmilitary construction spending since 1990.
O&M spending and workforce dynamics
O&M spending mostly divides between the DoD civilian payroll and the purchase of goods andservices. During the 1990s, the civilian payroll declined much less than the military pay accountas budget cuts initially exempted many support and infrastructure activities. The ratio between
the civilian and military payrolls did not return to its earlier balance until 2003, and thishappened largely due to the war-related surge in military personnel spending. Non-pay O&M
expenditures , which cover many contract activities, held steady during the 1990s despite overallbudget cuts. It then began to rise sharply in 1998 – as did R&D and procurement spending.Together these trends indicate that:
First, the reduction in military personnel after 1989 was mitigated, first, by reducingcivilian DoD workers more slowly and, later, by adding large numbers of contractworkers.
Second, a fair portion of this mitigation had to do with retaining and then expandingsupport personnel. This reflected (i) the effects of losing economies of scale in supportactivities as the force grew smaller, (ii) the difficulty of trimming excess support andinfrastructure, (iii) the desire to retain all facets of US military power even as the numberof military personnel declined, and (iv) the adoption of policies that compelled higherreadiness levels and more operational tempo.
Reinflating the Pentagon
In sum: America’s military workforce has been fully re-inflated with most of the regrowthdisplaced to the defense contractor segment. Military end strength has recovered onlymarginally. However, there has been some migration of military personnel toward the “sharpend” – that is: from the non-deployable to the deployable segment of the forces. But thismigration probably does not and will not exceed 100,000 troops, including those recently added,both permanent and temporary.
An interesting implication of these changes is that, although much of the growth in thecontractor segment has to do with support functions, it will not register in the ongoingdiscussion about the “tooth-to-tail” ratio. Never before has the US defense budget been asweighted toward support activities as it is today. But if we focus solely on that most visible partof the Pentagon workforce – uniform personal – it appears as though the teeth have beengrowing at the expense of the tail. Also interesting: the specific character of the Pentagon’s re-inflation greatly expands the constituency of beneficiaries in the private sector.

8/14/2019 Pda Briefing Report #20
http://slidepdf.com/reader/full/pda-briefing-report-20 29/77
16 AN UNDISCIPLINED DEFENSE
4.4 Discordant modernization
Since reaching a low-point in the late-1990s, procurement spending has rebounded with avengeance, rising by more than 160% in real terms. Not since the nation undertook crashrearmament for the Korean war has as much been spent in a single year as in 2008, when the
procurement account was allotted $170 billion.
Comparing recent spending with that during the last recapitalization surge (1979-1990) providessome perspective:
# Total budget authority for procurement during the period 1999-2010 has beenapproximately $1.25 trillion (2010 USD) – which compares well with the 1979-1990recapitalization, when $1.48 trillion (2010 USD) was authorized.
# Calculated on a per person basis, procurement spending during 1999-2010 was 25%higher in real terms than during the period 1979-1990.
# Only about 20% of procurement spending since 1998 has been related to the wars in Iraqand Afghanistan.
# Research and Development spending during 1999-2010 was much higher than in 1979-1990: $822 billion versus $571 billion.
Taken together, procurement and R&D constitute the “modernization” category. (See Figure6.) And, from the above, we can see that total modernization spending was marginally higherin 1999-2010 than in 1979-1990. Viewed on a per person basis, however, recent budget authorityfor modernization is 50% higher in real terms than during the 1979-1990 period, which is quitesignificant. (Figure 7.)
And yet, while the Reagan period is remembered as one of robust modernization, today’smodernization efforts are viewed as “troubled” from all sides – as insufficient by some and as
too costly or irrelevant by others.
A period of troubled modernization
DoD’s current modernization problems stem partly from an acquisition process that routinelydelivers products late, over cost, and not as capable as promised. Of course, this is not a recentdevelopment. (Acquisition reform is addressed in more detail in Appendix C.)
Another contributing factor to current problems has been the services’ tendency to favor big- ticket “legacy” platforms, like the F-22, that still seem geared toward meeting and over-matching peer opponents, long gone. This latter problem is only a species of a larger one,however:
Beginning in the early 1990s, DoD acquisition practice has evinced several,contending “modernization imperatives” or visions. And DoD has failed toadequately prioritize among them or compel choices. So these have all lurched

8/14/2019 Pda Briefing Report #20
http://slidepdf.com/reader/full/pda-briefing-report-20 30/77
PROJECT ON DEFENSE ALTERNATIVES 17
Figure 6. DoD Budget Authority for Modernization 1978-2010
(Billions 2010 USD)
0
20
40
60
80
100
120
140
160180
1 9 7 8
1 9 8 0
1 9 8 2
1 9 8 4
1 9 8 6
1 9 8 8
1 9 9 0
1 9 9 2
1 9 9 4
1 9 9 6
1 9 9 8
2 0 0 0
2 0 0 2
2 0 0 4
2 0 0 6
2 0 0 8
2 0 1 0
RDTE Procurement
Sources: see Data Sources appendix.
Figure 7. DoD Per Person Budget Authority for Modernization 1978-2010
(000's 2010 USD)
0.0
20.0
40.0
60.0
80.0
100.0
120.0
140.0
1 9 7 8
1 9 8 0
1 9 8 2
1 9 8 4
1 9 8 6
1 9 8 8
1 9 9 0
1 9 9 2
1 9 9 4
1 9 9 6
1 9 9 8
2 0 0 0
2 0 0 2
2 0 0 4
2 0 0 6
2 0 0 8
2 0 1 0
RDTE Procurement
Sources: see Data Sources appendix

8/14/2019 Pda Briefing Report #20
http://slidepdf.com/reader/full/pda-briefing-report-20 31/77
18 AN UNDISCIPLINED DEFENSE
forward together, poorly integrated and layered one atop the other. Given resource constraints,few have developed in a satisfactory way, and this generates unrelenting upward pressure on
the budget.
We might call this phenomenon discordant modernization.
Looking back over the post-Cold War period, we can discern a variety of disparate procurementimperatives, and each has grown its own constituency. These variously sought to:
# Modernize legacy platforms and platform-types, and size their fleets to ensureoverwhelming force in multiple overlapping contingencies;
# Dramatically increase the capacity of legacy platforms to deliver guided-weapons of various sorts;{22}
# Dramatically enhance the information collection, communication, and processingcapacity of individual platforms and units at all levels;
# Complement the modernized legacy fleets with select “new technology” platforms aswell as other capabilities designed to meet specific asymmetric threats or to providenew tactical advantages;
# Develop operational networks – systems of systems – within and across services tofacilitate highly-flexible and responsive “net-centric” operations on a global scale. Theputative network would comprise three levels – information collection, strike, andsupport. The various levels and components would be fused by joint communicationsand information processing capabilities;{23}
#
Develop new “avenues” or “spheres” of warfare: space, cyber, and global conventionalstrike;
# Increase capacities for rapid, flexible large-scale global deployment. This imperativeencompassed enhancements to mobility assets, foreign basing, and prepositioned/afloatmaterial stocks as well as unit modularization initiatives. And,
# Field units and equipment specially adapted for stability, humanitarian, and counter-insurgency missions.
These imperatives can be usefully grouped into four types of modernization practice: Legacy,Transformational, Adaptive, and Ad Hoc.
Legacy efforts ideally reflect past adaptations that may nonetheless offer an insurancepolicy in the present as the force adapts to new circumstances, goals, and opportunities;
Transformational efforts pursues new opportunities for more effective action based onnew technology, techniques, and forms of organization;
Adaptive efforts correspond to new security missions and circumstances; and

8/14/2019 Pda Briefing Report #20
http://slidepdf.com/reader/full/pda-briefing-report-20 32/77
PROJECT ON DEFENSE ALTERNATIVES 19
Ad hoc efforts respond to unforeseen developments as they unfold – the exigencies of themoment.
That all four might co-exist and exert influence is not itself troubling. What is indispensable,however, is that the modernization program overall be disciplined in accord with a sustainable,
adaptive, and cost-effective national security strategy. Otherwise what is likely to happen iswhat has happened: All four impulses will proceed in a discordant way – competitively at oddswith each other.
If strategic discipline is lax, legacy modernization will predominate -- at least for a while. Thisis because legacy efforts enjoy considerable institutional momentum. Countervailing pressuresmust mount to overcome this momentum. Once they do, external circumstances may compela rush of ad hoc measures. Subsequently , these may come to redefine the main thrust of modernization – although their long-term relevance could be more limited than realized in themoment. This is the circumstance DoD finds itself in today with regard to procurement forcounter-insurgency.
The tracks of discordant modernization
The tensions between the modernization trends, and the failure to adequately integrate them,can be found defense-wide and within individual services as well.
# The Army provides an acute example with its efforts to (i) modernize or replace withsimilar systems its equipment stocks from the 1980s, (ii) digitalize and modularize itsunits, (iii) field UAVs, tactical robots, and various directed energy weapons, (iv) pursue
the Future Combat System, and (v) add Stryker armored vehicles, MRAPs, and up-armored HMMWVs for stability and counter-insurgency operations.
# In the Air Force, high-end modernization of platforms for stealthy, penetrating strikehave predominated even as capacities to use standoff weapons, simpler platforms, andUAVs have advanced.
# In the Navy, emphasis remains on numerous big-deck aircraft carriers even as (i) themissile attack capability of the fleet has grown exponentially (including the introductionof cruise-missile Tridents and the land-attack DDG-1000 destroyer), (ii) intercontinentalUSAF bombers have dramatically improved their conventional attack capability, and (iii)UAVs – which can be launched in large numbers from the Navy’s Amphibious AssaultShips – are playing an ever larger role as attack platforms. Utterly irrelevant to currentneeds, two new classes of attack submarines have entered service since 1997. And,despite a much smaller fleet, the Navy intends to maintain four classes of surface
combatants (with the planned Littoral Combat Ship entering service as Frigates exit.)
# Despite significant investment, the effort to build force networks is lagging, especiallybetween services, facing both technical and integration problems. The USAF has made
the most progress; the ground forces, the least. But one fundamental problem is evidenteverywhere: A principal conceit of networking is that it lessens the need to load

8/14/2019 Pda Briefing Report #20
http://slidepdf.com/reader/full/pda-briefing-report-20 33/77
20 AN UNDISCIPLINED DEFENSE
individual platforms and units with capabilities. There is only limited evidence of progress in exploiting this putative benefit of networking.
In a broader perspective, discordant modernization risks detaching DoD’s investment of modernization dollars from the nation’s actual security needs.
In the decade before the 9/11 attacks, the United States spent over $1 trillion on militarymodernization. But most of this expenditure proved irrelevant to defending against the mostserious attack on America in 60 years, and also irrelevant to conducting counter-terrorismoperations afterward. Subsequently, three more years of funding added another $450 billiondollars to modernization accounts, but still the nation found itself ill-equipped to execute thenew tasks it had undertaken: counter-insurgency in Iraq and Afghanistan. So a new,overlapping wave of modernization commenced.
5. Conclusion: Trillions to burn?
In the decade between 1998 and 2008, US defense spending underwent a rise unprecedentedsince the Korean war, adding more than $2 trillion in real terms to the DoD budget. Today, even
the “peacetime” portion of the defense budget significantly exceeds Cold War levels, adjustedfor inflation. And the Obama administration’s budget plan foresees sustaining this level of expenditure indefinitely.
In this report we set out to identify the factors that have propelled the exceptional rise indefense spending since 1998. Importantly, the post-9/11 wars are not more than half the cause.Moreover, these wars have themselves proved to be far more expensive in real terms than theirimmediate predecessors, which only adds to the explanatory burden.
We have found that the spending boom is the product of a unique confluence of choice andcircumstance:
# The exceptional cost of today’s wars derive partly from DoD’s having prepared“wrongly” during the years 1992-2003. Much of DoD’s considerable modernizationinvestment during that period proved irrelevant to counter-terrorism and counter-insurgency tasks. More fundamental, however, is the fact that the United States is todayfighting labor-intensive Vietnam-style conflicts with a military workforce that has a moreexorbitant cost dynamic than the conscript military of the 1960s. Recognizing this, DoDhas increased its dependence on private, contract labor.
# More generally, as the Soviet threat receded, US national leadership adopted military-
security goals that were, at once, more ambitious and more diffuse than those of the ColdWar period. The new goals and strategies entailed preserving and extending both thereach and the complexity of America’s armed forces, despite force reductions. In thiscontext, the armed forces suffered a decrement in economies of scale, affecting bothequipment procurement costs and support costs. And efforts to achieve new efficienciesvia defense reform and military transformation fell short. Thus, while successive post-Cold War administrations have hoped to do “more for less” in the military realm, theyhave had to settle for doing “more for more”.

8/14/2019 Pda Briefing Report #20
http://slidepdf.com/reader/full/pda-briefing-report-20 34/77
PROJECT ON DEFENSE ALTERNATIVES 21
# A key part of “re-inflating” the Pentagon – for purposes of both war fighting andpeacetime engagement – has been a much increased dependence on private, contractlabor. This is one of the surest outcomes of military transformation since the Cold Warended.
# A final contributor to the spending surge has been the emergence of overlapping,discordant strains of military modernization. Partly, this development reflects thedecentralized nature of the armed service’s acquisition process in which, as a former USComptroller General puts it, “[c]apabilities and requirements are based primarily onindividual service wants versus collective defense needs”.{24} Central DoD authoritiesand joint structures have proved unable or unwilling to override the services’ individualmomentum and compel a more integrated and adaptive approach. What has enabled
this problem to grow much worse in the post-Cold War era is a planning method thateschews strong prioritization and, instead, looks to hedge in all directions.
These factors have converged to give America a historically unique predominance in militaryspending. The United States today is responsible for nearly half of all military expenditure
worldwide, which is a much bigger share than was the case during the Cold War. What thisinvestment has not purchased, however, is clear and sure progress toward a more secure andstable world. Nor has it even purchased an especially efficient military – one closely adapted
to the current security environment. Indeed, in some respects, the current defense posture lackscoherence. That America should persist down this road for more than a decade suggests a lapsein attention to the strategic costs and benefits associated with our chosen defense posture. Itis as though the nation had trillions to burn – a view which, if widely held, would undercutefforts at reform and prioritization, thus guaranteeing considerable waste.
A permissive spending environment is the necessary precondition for the types of problems wehave identified in this report. And there are several political realities that have helped generateand sustain it. First, and obviously, the 11 September 2001 attacks overrode any tendencies to
suggest economizing on defense. As Richard Betts observed in a 2007 article in Foreign Affairs,
Washington opened the sluice gates of military spending after the 9/11 attacks primarilynot because it was the appropriate thing to do strategically but because it wassomething the country could do when something had to be done.{25}
Curiously, though, public support for increased spending was higher in the two years prior to the attacks than in the two years after. And it has receded significantly since then.{26} But this has not spurred a serious re-evaluation of defense spending. This points to a more deeply-seated enabling condition for the present profligacy: Both the Republican and Democraticparties are politically disinclined to press for tight DoD budget constraints – although theirreasons differ. What is important here is not the balance of raw public opinion so much as the
capacity of the contending parties to mobilize it.
In his Foreign Affairs article, Betts suggests that America’s strategic solvency may depend onpolitical change:
Democrats will have to get over their long battle against the wimp image. Republicanswill have to rediscover the virtues of fiscal responsibility.{27}
8/14/2019 Pda Briefing Report #20
http://slidepdf.com/reader/full/pda-briefing-report-20 35/77
22 AN UNDISCIPLINED DEFENSE
Clearly, we are not there yet, but there is reason to believe that fiscal realities may soon favorfocusing more critical attention on the balance of costs and benefits associated with our currentdefense posture. If so, the dynamics explored in this report offer ample opportunities forremedial action.
Notes
1. This figure includes an estimated $100 billion addition to the funding announced in the Administration’s2010 budget. Vago Muradian, “DoD to add $100B to 2011-15 spending,” Army Times, 14 December 2009.
2. The administration initially planned to authorize $692.8 billion for 050 (National Defense) for FY 2010 (in2010 USD). Of this, $667.7 billion was slated for the Pentagon (051). The rest was allotted mostly to theDepartment of Energy to fund its national defense functions. Looking back to 1998, when post-Cold Wardefense expenditures were lowest, the National Defense function absorbed $379 billion, while thePentagon’s portion of this allotment was $361.5 billion.
3. Among the positive trends were an increase in aptitude scores and in both age and average time in
service. Trends in the quality of military personnel are presented yearly in the Population Representation in the Military Services report, produced by the office of the Deputy Under Secretary for Military PersonnelPolicy and is currently (2010) available at: available at http://prhome.defense.gov/mpp.html
4. Bernard Rostker and Curtis Gilroy, “The Transition to an All-Volunteer Force: The US Experience” inGilroy and Cindy Williams, eds, Service to Country: Personnel Policy and the Transformation of Western
Militaries (Cambridge MA: Belfer Center for Science and International Affairs, 2006).
5. Gilroy and Williams, “The Way Ahead: Transformation of Personnel Policies” in Gilroy and Williams, pp.462-463.
6. John Warner and S. Negrusa, “The Economic Case for All-Volunteer Forces” in Gilroy and Williams.
7. Amy Belasco, Paying for Military Readiness and Upkeep: Trends in Operation and Maintenance Spending (Washington DC: Congressional Budget Office, September 1997), pp. 25-47.
8. Testifying before the Senate Armed Services Committee in 2000, JCS Chairman General Hugh Sheltonreported that 75% of the increased funding for Operations and Maintenance during the fiscal years 1998-2001 went to support operations overseas and to military base support. “US Senator John Warner (R-VA)Holds Hearing on Status of US Forces,” FDCH Political Transcripts, 27 September 2000.
9. Carl J. Dahlman, The cost of a military person-year: a method for computing savings from force reductions
(Santa Monica: RAND, 2007), p. 108.
10. Defense Manpower Requirements Report FY-2009, FY-2008, FY-2007, FY-2006, FY-2005, FY-2003, FY-
2001 (Washington DC: Office of the Under Secretary of Defense for Personnel and Readiness, 2000-2009);http://prhome.defense.gov/pi.html
11. Defense Budget: Trends in Operation and Maintenance Costs and Support Services Contracting (Washington DC: US Government Accountability Office, May 2007).
12. Jacques S. Gansler and William Lucyshyn,Competitive Sourcing: What Happens to Federal Employees?
(Washington DC: IBM Center for the Business of Government, October 2004).

8/14/2019 Pda Briefing Report #20
http://slidepdf.com/reader/full/pda-briefing-report-20 36/77
PROJECT ON DEFENSE ALTERNATIVES 23
13. Defense Budget: Trends in Operation and Maintenance Costs and Support Services Contracting
(Washington DC: US GAO, May 2007); Defense Outsourcing: The OMB Circular A-76 Policy (WashingtonDC: CRS, 23 January 2001); and, Susan Gates and Albert Robbert, Personnel Savings in Competitively
Sourced DoD Activities: Are they real? Will they last? (Santa Monica: RAND, 2000).
14. Larry Makinson, Outsourcing the Pentagon: Who benefits from the Politics and Economics of National
Security? (Washington DC: Center for Public Integrity, 29 September 2004),http://projects.publicintegrity.org/pns/report.aspx?aid=385
15. Defense Budget: Trends in Operation and Maintenance Costs and Support Services Contracting
(Washington DC: US Government Accountability Office, May 2007).
16. David M. Walker, Comptroller of the United States, “DoD’s Increased Reliance on Service ContractorsExacerbates Long-standing Challenges,” testimony before the Subcommittee on Defense, Committee onAppropriations, House of Representatives, 23 January 2008.
17. Derived from Federal Procurement Report (Washington DC: Federal Procurement Data Center, 1989)and Consolidated Federal Funds Report for FY 2008 (Washington DC: Census Bureau, July 2009).
18. DoD’s High-risk Areas: Actions Needed to Reduce Vulnerabilities (Washington DC: US GovernmentAccountability Office, March 2009).
19. Makinson, Outsourcing the Pentagon: Who benefits from the Politics and Economics of National
Security? (Washington DC: Center for Public Integrity, 29 September 2004),http://projects.publicintegrity.org/pns/report.aspx?aid=385
20. Paul C. Light, The New True Size of Government, Organizational Performance Initiative, Research Brief
#2 (New York City: NYU Wagner Graduate School of Public Service, August 2006); Light, Fact Sheet on the
New True Size of Government (Washington DC: Brookings Institution, September 2003); and, Light, The
True Size of Government (Washington DC: The Brookings Institution, 1999).
21. Moshe Schwartz, Department of Defense Contractors in Iraq and Afghanistan: Background and Analysis
(Washington DC: Congressional Research Service, 13 August 2009); and, Katherine McIntire Peters, “Down to the Core,” Government Executive, 1 May 1999.
22. Precision-guided Munitions in Inventory, Production, and Development (Washington DC: GovernmentAccounting Office, June 1996).
23. Clay Wilson, Network Centric Warfare: Background and Oversight Issues for Congress (Washington DC:Congressional Research Service, June 2004).
24. The Honorable David M. Walker, Comptroller General of the United States, “DOD TransformationChallenges and Opportunities,” testimony before the House Armed Services Committee, 24 Jan 2007.
25. Richard K. Betts, “A Disciplined Defense: How to Regain Strategic Solvency,” Foreign Affairs
(November/December 2007).
26. Lydia Saad, “Americans More Upbeat About US Defense Readiness,” Gallup,26 March 2009, available:www.gallup.com/poll/117100/Americans-Upbeat-Defense-Readiness.aspx. All Gallup polling on defensespending: www.gallup.com/poll/1666/Military-National-Defense.aspx.
27. Betts, “A Disciplined Defense.”

8/14/2019 Pda Briefing Report #20
http://slidepdf.com/reader/full/pda-briefing-report-20 37/77
24 AN UNDISCIPLINED DEFENSE
Figure A-1. DoD Budget Authority by Appropriation Title 1978-2010
(Millions 2010 USD)
0
200000
400000
600000
800000
1 9 7 8
1 9 8 0
1 9 8 2
1 9 8 4
1 9 8 6
1 9 8 8
1 9 9 0
1 9 9 2
1 9 9 4
1 9 9 6
1 9 9 8
2 0 0 0
2 0 0 2
2 0 0 4
2 0 0 6
2 0 0 8
2 0 1 0
RDTE Procure O&M Pers Other
Sources: see Data Sources appendix.
Figure A-2. DoD Per Person BA by Appropriation Title 1978-2010
(000's 2010 USD)
0.0
100.0
200.0
300.0
400.0
500.0
1 9 7 8
1 9 8 0
1 9 8 2
1 9 8 4
1 9 8 6
1 9 8 8
1 9 9 0
1 9 9 2
1 9 9 4
1 9 9 6
1 9 9 8
2 0 0 0
2 0 0 2
2 0 0 4
2 0 0 6
2 0 0 8
2 0 1 0
RDTE Procure O&M Pers Other
Sources: see Data Sources appendix.

8/14/2019 Pda Briefing Report #20
http://slidepdf.com/reader/full/pda-briefing-report-20 38/77
PROJECT ON DEFENSE ALTERNATIVES 25
Appendix A: Data Review
A1. Disaggregating the post-1998 Spending Surge
Since 1998, Pentagon budget authority has grown by approximately 90%. All told, in the period1999-2010, more than $2 trillion has been added to Pentagon accounts above the levelsprevailing in 1998. Approximately 52% of this added amount has been devoted to GWOT effortsabroad, including the wars in Iraq and Afghanistan. If the conduct of the Afghanistan and Iraqwars cannot sufficiently explain the unprecedented growth in US defense expenditures, whatcan? A closer look at changes in the allotment of funds among appropriation categoriesprovides some relevant clues.
It also is instructive to view the evolution of funding in per person terms – that is: per full-timeUS uniformed personnel. This controls for changes in the numbers of armed forces personnel– a prevalent feature of the post-Cold War period – and enables a clearer focus on other typesof change.
# Figure A-1 shows for 1978-2010 the total budget authority (in 2010 USD) allotted to thepersonnel, operations and maintenance (O&M), procurement, Research, Development,Testing, and Evaluation (RDT&E), and other smaller accounts.
# Figure A-2 shows in per person terms the budget authority (in 2010 USD) allotted to thevarious appropriation categories.
# Figure A-3 shows the fluctuation in full-time strength during 1978-2010 in percentage terms (with the 1978 total of 2.062 million full-time personnel set equal to 100).
Figure A-3. US Full-time Military Personnel 1978-2010
(1978 = 100 = 2.062 million)*
0
20
40
60
80
100
120
1 9 7 8
1 9 8 0
1 9 8 2
1 9 8 4
1 9 8 6
1 9 8 8
1 9 9 0
1 9 9 2
1 9 9 4
1 9 9 6
1 9 9 8
2 0 0 0
2 0 0 2
2 0 0 4
2 0 0 6
2 0 0 8
2 0 1 0
Note: * Personnel include full-time Guard & Reserve
Sources: see Data Sources appendix

8/14/2019 Pda Briefing Report #20
http://slidepdf.com/reader/full/pda-briefing-report-20 39/77
26 AN UNDISCIPLINED DEFENSE
Looking at DoD budget authority for the period 1978-2010 shows that overall funding per full- time person in uniform was remarkably stable from 1983 through 1998 – a period encompassingall of G.H.W. Bush’s presidency as well as most of Ronald Reagan’s and Bill Clinton’s –averaging $240,000 per person . In only three out of 16 years does it vary from this mean by more
than 3%. However, after 1998, it begins to rise above $250,000, until accelerating sharply with
the onset of the Iraq War and then settling at an average of $459,000 per person for the years2007-2010. Today spending exceeds $450,000 per person – which is 78% higher than the Reaganpeak, 95% higher than on the eve of the first Gulf War, and nearly three times the inflation-adjusted peak during the Vietnam era (which was approximately $154,000 per full-time militarypersonnel).
A1.1 Tracing the change in spending priorities
Figures A-4 and A-5 give a better sense of how the spending trends in the major appropriationaccounts changed relative to each other. All underlying dollar figures have been converted toUSD 2010. In order to highlight relative change, the figures take 1978 as a baseline year, setting
expenditures in each account for that year as equal to 100. For subsequent years, the allocations to each account are recorded in terms of the 1978 baseline as being more or less than 100. Had the four accounts retained the ratios they had had in 1978, their trend lines would not havediverged from each other, but would instead have moved as a single line up, down, orhorizontally. Instead, the divergence is pronounced, which indicates a significant shift in forcedevelopment strategy.
Figure A-4 shows change in terms of dollar allocations to the various DoD accounts. Figure A-5shows change in terms of “per person” expenditures with the relevant population pool beingfull-time military personnel. Doing this takes into account the prevalent fact of force structure
Figure A-4. Real Change Budget Authority by Appropriation Title 1978-2010
(1978 = 100)
50.0
100.0
150.0
200.0
250.0
300.0
1 9 7 8
1 9 8 0
1 9 8 2
1 9 8 4
1 9 8 6
1 9 8 8
1 9 9 0
1 9 9 2
1 9 9 4
1 9 9 6
1 9 9 8
2 0 0 0
2 0 0 2
2 0 0 4
2 0 0 6
2 0 0 8
2 0 1 0
50.0
100.0
150.0
200.0
250.0
300.0
O&M Procure Pers RDTE
Sources: see Data Sources appendix.

8/14/2019 Pda Briefing Report #20
http://slidepdf.com/reader/full/pda-briefing-report-20 40/77
PROJECT ON DEFENSE ALTERNATIVES 27
and personnel increases and reductions during the period. Thus, Figure A-5 asks: Given thereduction in force size, how has the allocation of funds among appropriation categorieschanged?
In absolute terms, all accounts decline during the 1990s – but especially personnel andprocurement. The first of these obviously reflects the effect of force reductions, while the latterreflects both decreased demand for equipment and the fact that a surge in procurement had justbeen completed. By comparison, O&M and RDT&E spending does not decline proportionatelyduring the 1990s and, when viewed in per person terms, actually begin a distinct upward climb
in 1993. All accounts are rising in real absolute terms after 2000 or 2001, however. And whenviewed in per person terms, this rise is quite precipitous for most.
Broadly speaking, post-Cold War policy evinces a substantial rebalancing of spending prioritiesin favor of O&M and RDT&E. By comparison, the personnel account just barely rebounds to ColdWar levels (although in per person terms it shows a 50% rise).
A1.2 The effect of the post-9/11 wars on DoD budget allocation
Table A-1 allocates total DoD budget authority (in 2010 dollars) for the period 1999-2010 amongappropriation categories. It also denotes that portion of spending that was above the levels setin 1998. Finally, it distinguishes between those portions devoted to the “base” DoD budget and
those portions devoted to operations abroad. As noted previously, America’s recent wars willhave cost more than $1.1 trillion through 2010 – about 17% of the total $6.5 trillion authorizedsince 1998. Also as stated before, this amounts to approximately 52% of the $2.15 trillion addedover the levels set in 1998.
Figure A-5. Real Change Per Person Budget Authority by Appropriation Title 1978-2010
(1978 = 100)
50.0
100.0
150.0
200.0
250.0
300.0
350.0
400.0
1 9 7 8
1 9 8 0
1 9 8 2
1 9 8 4
1 9 8 6
1 9 8 8
1 9 9 0
1 9 9 2
1 9 9 4
1 9 9 6
1 9 9 8
2 0 0 0
2 0 0 2
2 0 0 4
2 0 0 6
2 0 0 8
2 0 1 0
50.0
100.0
150.0
200.0
250.0
300.0
350.0
400.0
O&M Procurement Personnel RDTE
Sources: see Data Sources appendix

8/14/2019 Pda Briefing Report #20
http://slidepdf.com/reader/full/pda-briefing-report-20 41/77
28 AN UNDISCIPLINED DEFENSE
Reviewing the distribution of the surged funds among appropriation accounts:
# The operations and maintenance account is the biggest beneficiary of the post-1998boom. Nearly three-quarters of this O&M surge was due to the wars.
# Since 1998, nearly $2.1 trillion has been spent on force modernization – that is,procurement and R&D. Of this, $844 billion is above the levels set in 1998. The wars areresponsible for approximately $264 billion of post-1998 modernization funding.
# Increased personnel spending since 1998 is divided almost evenly between war-relatedrequirements and the base budget.
able A-1. Allocation of DoD Budget Authority – Total and “Surged” 1999-2010
(Billions 2010 USD)
Total DoD $
1999-2010
% Wars $ above 1998
Baseline
Allocation of post-1998
Spending “Surge”
BaseBudget
Wars % for BaseBudget
% for War
RDTE 823.13 1.63% 261.15 247.72 13.43 94.9% 5.1%
Procure 1252.14 20.03% 583.07 332.30 250.77 57.0% 43.0%
O&M 2582.86 25.29% 892.24 239.12 653.11 26.8% 73.2%
Pers 1570.50 10.29% 302.72 141.09 161.63 46.6% 53.4%
Other 253.43 13.55% 104.71 70.37 34.33 67.2% 32.8%
Total 6482.06 17.17% 2143.88 1030.60 1113.28 48.1% 51.9%
Sources: see Data Sources appendix
A1.3 Trends in spending on personnel, operations, and maintenance
Personnel
During the 1990s, total inflation-adjusted expenditures for personnel declined substantially fromprevious Cold War peaks, as the number of full-time military personnel dropped from 2.24 million
in 1987 to 1.451 million in 2000. Modest numbers of troops were added after 2000 – anadditional 21,000 active-component and 14,000 full-time reservists – amounting to a 2.4%increase. (The 94,000 added to the Army and Marine Corps were counter-balanced by 75,000lost to the Navy and Air Force.) Overall, US military end strength after 1990 was only briefly one-
third lower than the level prevailing in the 1980s, however. Average end strength during theperiod 1992-2010 has been 70% of the level prevailing in the 1980s. Today, there are 69% asmany full-time personnel as there were in 1990.

8/14/2019 Pda Briefing Report #20
http://slidepdf.com/reader/full/pda-briefing-report-20 42/77
PROJECT ON DEFENSE ALTERNATIVES 29
In 2002, total spending on personnel began to climb upward again, soon reaching levels notseen since the 1980s, when spending had reached $159.5 billion (2010 USD). In 2010, personnelspending stood at $154.7 billion – up nearly 50% from the year 2000, when it was $103.4 billion(2010 USD). Given an only modest increase in the number of full-time personnel, the rise inexpenditures is due mostly to increased per person costs.
Throughout 1981-2001, average personnel expenditures measured in per person terms stayedremarkably constant, varying by no more than a few percent around an average of $73,200 per
person (in 2010 USD). Between 2000 and 2010, however, per capita personnel costs rose 46%in real terms and today stand at $104,000.
Operations and Maintenance
In the course of the 1990s, as the US military underwent force reductions, DoD expenditures forOperations and Maintenance per full-time person in uniform rose about 46% in real terms.Between 2000 and 2003, it rose another 13%. From 2002 to 2010 – a period coinciding with the
Iraq war – it jumped another 59%. All told, the increase between 1989 and 2010 has been 160%.Thus, today, DoD is allocating more than 2.5 times as much per person to O&M as it was at thepeak of the Reagan surge.
Looking at the proportion of the DoD budget allocated to O&M in 1979, 1989, 1999, and 2009shows it to rise in ten-year intervals from 30.6% of the total budget to 31% to 39% to 41%. Thekey shift occurs in the decade between 1989 and 1999, not after.
One factor relevant to increasing O&M costs during the 1990s was the increasing ratio of thecivilian payroll to the military one during that decade. The civilian payroll, largely paid out of
Figure A-6. Budget Authority by Category 1978-2008(Millions 2010 USD)
0
50000
100000
150000
200000
250000
300000
1 9 7 8
1 9 8 0
1 9 8 2
1 9 8 4
1 9 8 6
1 9 8 8
1 9 9 0
1 9 9 2
1 9 9 4
1 9 9 6
1 9 9 8
2 0 0 0
2 0 0 2
2 0 0 4
2 0 0 6
2 0 0 8
MIL PAY CIV PAY O&M Non-pay Proc/R&D/Construct
Sources: see Data Sources appendix

8/14/2019 Pda Briefing Report #20
http://slidepdf.com/reader/full/pda-briefing-report-20 43/77
30 AN UNDISCIPLINED DEFENSE
O&M, went from being 49% as large as the military payroll during the 1980s to being 57% aslarge during the 1990s. Partly, this reflects pay dynamics. Partly it reflects the fact that, as thenumber of uniformed personnel declined, the force became somewhat more dependent on directhire civilian employees. Complementing this trend (and eventually overtaking it) was increasedreliance on “outsourcing” or contracting. During the period 2000-2008, the proportion of civilian
to military personnel receded again, averaging 44% for these years.
Another perspective on civilian pay and O&M
Figures A-6 and A-7 provide a different perspective on the change in the allocation of defensedollars across the period 1978-2008. The charts are based on annual spending expressed in2010 dollars and they present allocations in both absolute (Figure A-6) and per person terms(Figure A-7). The categories differ from those in previous charts, however. Civilian pay isextracted from the other categories and represented independently. The greatest impact is on
the Operations and Maintenance account, which normally incorporates most civilian pay. Whatremains of O&M in Figures A-6 and A-7 are purchases of goods and services – including
contractor services.
The increased reliance on DoD civilian labor (relative to military personnel) during the 1990s isapparent in the convergence of the two trend lines in Figure A-6, beginning in 1991 and endingin 2002. Also notable is the rise in non-pay O&M expenditures (including contracts), which isclear in the total expenditures chart beginning in 1998 and, in the per person chart, beginningin 1992. Beginning in the 1990s and accelerating sharply after 1998, DoD has allocated muchmore of its resources to non-pay O&M, including contracts.
Figure A-7. Budget Authority Per Person by Category 1978-2008
(000's 2010 USD)
20.0
50.0
80.0
110.0
140.0
170.0
200.0
1 9 7 8
1 9 8 0
1 9 8 2
1 9 8 4
1 9 8 6
1 9 8 8
1 9 9 0
1 9 9 2
1 9 9 4
1 9 9 6
1 9 9 8
2 0 0 0
2 0 0 2
2 0 0 4
2 0 0 6
2 0 0 8
MIL PAY CIV PAY O&M Non-pay Proc/R&D/Construct
Sources: see Data Sources appendix
8/14/2019 Pda Briefing Report #20
http://slidepdf.com/reader/full/pda-briefing-report-20 44/77
PROJECT ON DEFENSE ALTERNATIVES 31
How much did the post-9/11 wars add to O&M?
As noted above, O&M costs per full-time person rose another 59% between 2002 and 2010 (in2010 dollars). But a 50% rise during wartime is not unusual. O&M costs during the Korean andVietnam wars were comparably higher than in the years between the two conflicts. What
makes the recent O&M surge especially noteworthy is that it comes on top of a cumulative 65% per person increase for the period 1989-2002.
It is also worth noting that the 58% O&M boost that accompanied the recent wars is somewhatgreater than that experienced in Korea and Vietnam. One factor contributing to a higher than
typical O&M multiplier in recent wars is the significantly greater emphasis today on contractorsupport. The Congressional Research Service reports that the Central Command area todayhosts over 240,000 DoD contractors (compared to 280,000 military personnel supporting waroperations there).{1} This ratio of nearly one-to-one contrasts with a 5:1 ratio in Vietnam and2.5 : 1 ratio in Korea.
A1.4 Trends in modernization spending
The procurement account evinces the greatest degree of variation during the period underreview (1978-2010). (Figures A-8 and A-9 show the 1978-2010 trends in modernizationspending – procurement and R&D – corrected for inflation.) Having risen to $165 billion (2010USD) in 1985 – by far the highest level since the Korean war rearmament – procurement budgetauthority then receded to a post-Cold War low of $54 billion in 1997 before rebounding in severalbursts: first to $74 billion in FY 2001, then to $105 billion in FY 2005, and then peaking at $170billion in 2008.
Taking into account changes in force size clarifies the picture in important ways, however:
# The Reagan-era peak allotted to procurement $75,000 per full-time military personnel.
# The post-Cold War ebb, $35,000 per person.
# The recent, post-9/11 peak is $115,000 per person – more than 50% higher than theprevious peak.
In a broader view, comparing average procurement spending per person for the period 1983-1986 with that for 2007-2010 shows the latter to be only 40% higher in real terms. When the sizeof the military is taken into account, the funds allotted to procurement over the years takes on
the appearance of a typical procurement “wave” with peaks in 1984 and 2007. This mitigates the impression of atypical retrenchment during the Clinton years.
While absolute funding fell peak-to-ebb by two-thirds, per person funding declined by half. Partof the reason procurement spending dipped so low during these years was that Reagan-eraspending had capitalized a larger force. Subsequently, when the force shrank, retirement of older equipment effectively lowered the average age of equipment pools, achieving virtualmodernization. The per capita view does not alter the impression of a great leap after Clinton,however. This, because the pool of full-time military personnel grew only marginally between1999 and 2008 (by 21,000 persons).

8/14/2019 Pda Briefing Report #20
http://slidepdf.com/reader/full/pda-briefing-report-20 45/77
32 AN UNDISCIPLINED DEFENSE
Figure A-8. DoD Budget Authority for Modernization 1978-2010
(Billions 2010 USD)
0
20
40
60
80
100
120
140
160
180
1 9 7 8
1 9 8 0
1 9 8 2
1 9 8 4
1 9 8 6
1 9 8 8
1 9 9 0
1 9 9 2
1 9 9 4
1 9 9 6
1 9 9 8
2 0 0 0
2 0 0 2
2 0 0 4
2 0 0 6
2 0 0 8
2 0 1 0
RDTE Procurement
Sources: see Data Sources appendix.
Figure A-9. DoD Per Person Budget Authority for Modernization 1978-2010
(000's 2010 USD)
0.0
20.0
40.0
60.0
80.0
100.0
120.0
140.0
1 9
7 8
1 9
8 0
1 9
8 2
1 9
8 4
1 9
8 6
1 9
8 8
1 9
9 0
1 9
9 2
1 9
9 4
1 9
9 6
1 9
9 8
2 0
0 0
2 0
0 2
2 0
0 4
2 0
0 6
2 0
0 8
2 0
1 0
RDTE Procurement
Sources: see Data Sources appendix

8/14/2019 Pda Briefing Report #20
http://slidepdf.com/reader/full/pda-briefing-report-20 46/77
PROJECT ON DEFENSE ALTERNATIVES 33
Research & Development
Partially counterbalancing the 1990s decline in procurement was sustained funding forResearch, Development, Evaluation, and Testing (RDT&E – henceforth R&D). Funding in thisarea during the 1990s equaled that during the 1980s in real terms. Thus, given a reduction in
force size, R&D authority actually increased on a per person basis – from about $26,000 in thelate 1980s to $47,000 ten years later.
The real change in the total R&D budget 1978-2010 exhibits a modified “sine wave” form, muchlike the procurement budget. However, the R&D curve is much flatter. This reflects theinteraction of two dynamics. First, a portion of R&D spending closely parallels procurementspending as new items under procurement are tested and tweaked or modified.{2} The rise andfall of R&D spending is less pronounced, however, because – independent of currentprocurement – ongoing R&D serves to constantly test technological horizons, which is anespecially important function for a military establishment as heavily dependent on its
technological edge as is the US military. In this respect, putative R&D requirements correspondmore to the complexity of the force and its technical composition than they do to its size.
In one notable respect the recent trend in R&D spending does resemble that in procurement:It too surges distinctively upward following the start of the Iraq war. Average R&D spendingfor the years 2007-2009 was more than 60% higher in real terms than in 2001 – and 37% higher
than the Reagan-era peak.
How much of the rebound in procurement is attributable to war?
The low-point in recent procurement spending came in 1997, when about $54 billion (2010 USD)was allotted to that account. In the subsequent 12-year period, 1998-2009, Congress authorized
approximately $1.25 trillion for procurement. If we take the 1997 level as a baseline thenprocurement spending during 1998-2009 was $538 billion above it, in aggregate. Totalprocurement funding in war supplementals 2001-2010 was approximately $250 billion (2010USD) – although congressional research agencies and the DoD Inspector General havechallenged whether all this funding was actually devoted to war requirements.{3} It isprobably the case that not more than 20% of post-1997 budget authority for procurement wasdue to operations abroad. And not much more than 40% of the post-1997 procurement surge canbe attributed to the war.
A2. The Surge in military construction
Military construction is one of the lesser appropriation categories, although formally comparable to Procurement and Operations and Maintenance. During the past 60 years, militaryconstruction expenditures have seldom accounted for more than 2% of DoD expenditures. Theperiod 2006-2010 deviates from the pattern, however, as shown in Figure A-10. Nearly $100billion has been set aside for military construction during the past 5 years. The yearly averagefor this period is 2.5 times as great as the average annual budget for the preceding 15 years.

8/14/2019 Pda Briefing Report #20
http://slidepdf.com/reader/full/pda-briefing-report-20 47/77
34 AN UNDISCIPLINED DEFENSE
As in the case of several other DoD accounts, the remarkable growth in this one is due to asudden convergence of initiatives and little apparent imperative to choose among them:
# The Global Defense Posture initiatives seek to relocate US troops within a number of allied host countries, expand US presence and facilities in others, stand up the newAfrica Command (including new forward operating sites and cooperative securitylocations), and return as many as 70,000 troops to the United States. DoD has estimated
the total cost of these actions as between $9 billion and $12 billion, but with less than$4 billion falling within the period under review.{4}
# Efforts to “grow the force” through the addition of 65,000 Army, 27,000 Marine, and9,200 Guard and Reserve personnel will require considerable new construction andrenovation. The Congressional Budget Office has estimated the construction costsassociated with this initiative as $15.7 billion.{5}
# Substantial construction costs are associated with the Army’s effort to transform to amodular structure because the effort would reallocate personnel among additionallocations and require more training, support, and headquarters facilities. In 2005, theGAO estimated the associated construction costs as $5.8 billion in current dollars.However, some of these costs are probably covered in the estimates for the GlobalDefense Posture and “Grow the Force” initiatives.{6}
# The current round of the Base Realignment and Closure (BRAC) process involves actionat nearly 800 locations and the movement of more than 100,000 domestic-basedpersonnel. Most recently, DoD has reported the cost of implementing this round of BRACas $34.9 billion (although this figure may incorporate some, if not all, of the Global
Defense Posture initiative costs.){7}
Figure A-10. Trends in Military Construction 1951-2010(Aggregate budget authority for five-year periods in billions 2010 USD)
73.7
48.7
31.038.8
27.8 27.4
43.0 42.436.2 36.2 37.0
96.7
0.0
30.0
60.0
90.0
120.0
51-55 56-60 61-65 66-70 71-75 76-80 81-85 86-90 91-95 96-00 01-05 06-10
Sources: see Data Sources appendix

8/14/2019 Pda Briefing Report #20
http://slidepdf.com/reader/full/pda-briefing-report-20 48/77
PROJECT ON DEFENSE ALTERNATIVES 35
# DoD is seeking to generally accelerate the renovation of military facilities, especiallyhousing, so that the building replacement rate declines from over 100 years to 67 years.This alone might imply increasing typical renovation and building costs by as much as50% although, again, some of this requirement might be met through other initiatives.
# Considerable construction costs have been associated with ongoing operations in Iraqand Afghanistan. These consumed more than $10 billion during the 2005-2010 period.
A3. The surge by service, spending category, and time period
The post-1998 boost in US defense spending is the result of a convergence of disparate policy trends – some planned, some not. The putative requirements of the wars in Iraq andAfghanistan are only part of the picture. This becomes apparent when the spending boost is
disaggregated into service and appropriation accounts and then further divided into timeperiods. The policy imperatives that have driven the budget to unparalleled heights might bedivided into a “war-related” set and a “standard” or “peacetime” set. Alternatively, they mightbe divided into “operational” and “preparedness” imperatives. Either way, the surge suggests
that the pressure to set priorities among these contending “requirements” or “imperatives”have been weak. Instead, the demands for funding have been layered one on top of the other.
Tables A-2, A-3, and A-4 disaggregate the spending surge in several ways: by appropriationcategory, by service, and by period. The principal conclusion of this analysis is that the surgeproceeded in overlapping phases, each with distinct foci. As indicated in the tables, ouranalysis takes spending levels in 1997 and 1998 as constituting an annual “baseline”. We thenmeasure average variation from this putative “baseline” in the years that follow. The aim is to
illustrate where and when the DoD spending surge was allocated – what ends did it serve?
# Table A-2. shows how much individual services and appropriation accounts gained in the course of the surge years 1999-2006.
# Table A-3. shows average expenditures by service and appropriation account for threeperiods (of unequal length): 1997-1998, 1999-2002, 2003-2006, and 2007-2008. (Thebreakpoints were chosen to accentuate differences in funding levels and allocation).
# Table A-4. shows how the allocation of funds changed from one period to the next, eachstep constituting a “phase” in the surge of funds.
Beginning with a view of the surge as a whole shows that, on average, annual budgets during the period 1999-2008 were $155 billion higher than the 1998 budget. Thus, in aggregate,approximately $1.55 trillion was added during this period to the level set in 1998. (And, of course, more is surged in 2009 and 2010.)

8/14/2019 Pda Briefing Report #20
http://slidepdf.com/reader/full/pda-briefing-report-20 49/77
36 AN UNDISCIPLINED DEFENSE
The accounts consuming the most were:
# Defense-wide: 16%
# Individual Services:
N Modernization: 35.8%
N Operations & Maintenance: 35.4%
N Personnel: 13.1%
The substantial increases in O&M spending is not surprising, given large-scale operations inIraq and Afghanistan – although spending in this category did begin to rise before the on setof the wars. Neither is it surprising that personnel costs would rise. More surprising is that
able A-2. Allocation of post-1998 DoD Spending Surge
Among Services and Appropriation Accounts(Dollar amounts in billions 2010 USD)
1998 Allocation1999-2008Average Delta $
% Shareof Surge
Defense Wide 55.3 15.5% 80.0 24.7 16.0%
USA Personnel 39.6 11.1% 51.9 12.3 7.9%
USA O&M 32.0 8.9% 62.7 30.7 19.8%
USA Procurement 9.2 2.6% 26.4 17.2 11.1%
USA RDTE 6.6 1.8% 9.9 3.3 2.1%
USA MILCON 1.8 0.5% 4.0 2.2 1.4%
USA Housing 1.6 0.4% 1.5 -0.2 -0.1%
USAF Personnel 29.0 8.0% 32.7 3.7 2.4%
USAF O&M 35.8 10.0% 45.5 9.7 6.3%
USAF Procurement 19.0 5.3% 33.5 14.6 9.4%
USAF RDTE 17.9 5.0% 21.4 3.5 2.2%
USAF MILCON 1.9 0.5% 2.0 0.1 0.0%
USAF Housing 1.4 0.4% 1.6 0.2 0.1%
USMC Personnel 9.8 2.7% 12.1 2.3 1.5%
USMC O&M 3.7 1.0% 6.3 2.6 1.7%
USMC Ground Force Procurement 0.6 0.2% 2.3 1.7 1.1%
Navy Personnel 27.4 7.7% 29.5 2.1 1.3%
Navy O&M 27.0 0.5% 38.9 12.0 7.7%
Navy & other USMC Procurement 23.6 6.6% 30.9 7.3 4.7%
Navy & USMC RDTE 9.9 2.8% 15.9 6.0 3.9%
Navy & USMC MILCON 2.2 0.6% 1.8 -0.3 -0.2%
Navy & USMC Housing 1.7 0.5% 1.2 -0.6 -0.4%
Sources: see Data Sources appendix

8/14/2019 Pda Briefing Report #20
http://slidepdf.com/reader/full/pda-briefing-report-20 50/77
PROJECT ON DEFENSE ALTERNATIVES 37
able A-3. DoD Budgeting by Service and Appropriation Accounts
Divided into Four Periods Covering 1997-2008
(Dollar amounts in billions 2010 USD)
Period 1
1997-1998Average
Period 2
1999-2002Average
Period 3
2003-2006Average
Period 4
2007-2008Average
Defense Wide 57.9 66.6 84.0 98.8
USA Personnel 40.5 39.7 58.3 63.3
USA O&M 32.4 34.9 72.5 98.7
USA Procurement 9.6 13.1 23.3 59.1
USA RDTE 6.6 7.4 11.2 12.4
USA MILCON 1.7 2.1 3.2 9.2
USA Housing 1.7 1.5 1.5 1.2
USAF Personnel 29.7 29.2 35.3 34.3
USAF O&M 34.9 39.1 49.0 51.4
USAF Procurement 18.4 24.7 37.4 43.2
USAF RDTE 17.8 17.3 22.9 26.5
USAF MILCON 1.9 1.6 2.0 2.8
USAF Housing 1.4 1.4 1.9 1.5
USMC Personnel 10.0 9.9 13.1 14.2
USMC O&M 3.7 4.0 7.2 9.1
USMC Ground ForceProcurement 0.7 1.3 3.6 1.6
Navy Personnel 28.3 26.8 31.5 30.6
Navy O&M 30.0 35.4 40.9 42.1
Navy & other USMCProcurement 22.2 26.6 31.2 38.7
Navy & USMC RDTE 10.0 11.9 18.0 19.8
Navy & USMC MILCON 2.3 1.4 1.7 2.9
Navy & USMC Housing 1.8 1.5 1.1 0.7
Total 363.5 397.5 550.9 662.1
Sources: see Data Sources appendix
modernization – that is, procurement and R&D – should register as the largest single recipient
of the spending boost. Although a fair portion of this goes to US ground forces during the warperiod, most does not. Taken together, the Air Force and the Navy (excluding the Marine Corps)claim more. Reviewing the spending surge in phases shows that:
# The first phase (culminating in the 1999-2001 period) emphasized modernization across the services, but especially benefitting the Air Force. O&M accounts show real but lesser

8/14/2019 Pda Briefing Report #20
http://slidepdf.com/reader/full/pda-briefing-report-20 51/77
38 AN UNDISCIPLINED DEFENSE
able A-4. Change in DoD Budgeting by Service
and Appropriation Accounts 1997-2008
(Dollar amounts in billions 2010 USD)
Period 1 > 2 Period 2 > 3 Period 3 > 4
$ Delta % Delta $ Delta % Delta $ Delta % Delta
Defense Wide 8.7 15.1% 17.4 26.2% 14.8 17.6%
USA Personnel -0.8 -2.0% 18.6 46.8% 4.9 8.4%
USA O&M 2.6 7.9% 37.5 107.4% 26.3 36.3%
USA Procurement 3.4 35.5% 10.3 78.6% 35.8 153.3%
USA RDTE 0.7 11.0% 3.8 52.3% 1.2 10.5%
USA MILCON 0.4 26.6% 1.1 53.0% 6.0 184.9%
USA Housing -0.2 -10.3% 0.0 1.2% -0.3 -21.7%
USAF Personnel -0.5 -1.7% 6.1 20.9% -1.0 -2.8%
USAF O&M 4.3 12.3% 9.9 25.2% 2.4 4.9%
USAF Procurement 6.3 34.3% 12.7 51.4% 5.7 15.3%
USAF RDTE -0.6 -3.2% 5.6 32.6% 3.7 16.0%
USAF MILCON -0.4 -18.9% 0.4 25.5% 0.8 42.1%
USAF Housing 0.0 0.2% 0.5 31.9% -0.4 -20.0%
USMC Personnel 0.0 -0.2% 3.2 31.7% 1.2 8.8%
USMC O&M 0.3 8.2% 3.2 79.2% 1.9 26.7%
USMC Ground ForceProcurement 0.6 95.7% 2.4 183.8% -2.1 -57.2%
Navy Personnel -1.4 -5.1% 4.7 17.4% -0.9 -2.7%
Navy O&M 5.4 17.9% 5.5 15.6% 1.1 2.8%
Navy & other USMCProcurement 4.4 20.0% 4.6 17.3% 7.5 23.9%
Navy & USMC RDTE 1.9 19.0% 6.0 50.7% 1.9 10.3%
Navy & USMC MILCON -1.0 -41.7% 0.4 29.0% 1.2 67.6%
Navy & USMC Housing -0.3 -18.0% -0.4 -29.5% -0.4 -34.9%
33.9 9.3% 153.4 38.6% 111.2 20.2%
Sources: see Data Sources appendix
growth, reflecting responses to readiness concerns during the late 1990s and thedemands of operations in Iraq (Desert Fox) and the Kosovo war.
# The second phase (culminating 2003-2006) brought O&M spending to the fore – especiallyfor the ground forces. But it also involved considerable procurement expenditures forground and air forces.
# The third (culminating 2007-2008) was characterized by an even greater emphasis onground forces – and especially on Army procurement. Nonetheless, Navy procurementalso advanced in the third phase. (The analysis treats USMC ground equipment

8/14/2019 Pda Briefing Report #20
http://slidepdf.com/reader/full/pda-briefing-report-20 52/77
PROJECT ON DEFENSE ALTERNATIVES 39
procurement as a category separate from Navy procurement). Additionally, the thirdphase saw a surge in military construction funding for all the services.
# Across all three phases, the “defense-wide” spending category showed significant gains.
This overview of the surge suggests that it comprised several overlapping trends or imperatives.Throughout the period, there is an effort to ramp up standard peacetime modernization – therebound from the post-Cold War ebb. However, beginning in 2003, this imperative is graduallyovertaken (although not entirely stalled) by an ad hoc surge of funding to meet Iraq andAfghanistan war requirements. Initially, the focus of ad hoc measures is O&M, but thiseventually gives way to greater emphasis on war-driven procurement, either to “reset” theground forces or provide them with specialized equipment (notably, Mine Resistant AmbushProtected vehicles).
While war requirements may have curbed peacetime modernization plans, they did not derail them. Indeed, under Donald Rumsfeld, DoD was late to recognize the likely costs of theAfghanistan and Iraq interventions. (Average annual funding for the wars during 2001-2008 was
$103 billion in 2010 USD – but not until 2006 were incrementals consistently above $100 billion.)So, a significant portion of planned peacetime modernization goes forward parallel to wardemands.
Consistent growth in the “defense wide” category points to another war imperative: specialoperations and intelligence capabilities. While relevant to the conduct of occupation andcounter-insurgency campaigns in Iraq and Afghanistan, these also pertain to more generalizedcounter-terrorism activities worldwide. The broader “Global War on Terrorism” constitutes anoverlapping, but separable “front” of US military activity helping to drive the surge in “defensewide” spending.
The next section provides a closer look at the “Defense Wide” spending category and what it
encompasses.
A4. Defense-wide spending
The “defense-wide” account also saw substantial growth across the periods – 53.7 % -- but withmost of this occurring between Period 2 (1999-2002) and Period 3 (2003-2008).
This account funds 18 defense agencies, 10 field activities, and a variety of other programs,including the Joint Staff and the Office of the Secretary of Defense. In the 2010 budget, thelargest recipients were the Defense Health Program (DHP - $27.9 billion) and a cluster of intelligence agencies and activities. These two together probably account for nearly half of the$90 billion defense-wide base budget. Other substantial components of this account are theMissile Defense Agency, the Special Operations Command (USSOCOM), the Office of theSecretary of Defense , and the Defense Advanced Research Projects Agency. These additionalprograms absorb more than another 20% of the defense-wide budget.

8/14/2019 Pda Briefing Report #20
http://slidepdf.com/reader/full/pda-briefing-report-20 53/77

8/14/2019 Pda Briefing Report #20
http://slidepdf.com/reader/full/pda-briefing-report-20 54/77
PROJECT ON DEFENSE ALTERNATIVES 41
The Defense Health Program is the principal driver of growth in defense-wide spending due both to its size and cost dynamics. The program had a budget of $9.9 billion in 1999, which equates to between $13 billion and $14 billion in 2010 USD (depending on the deflator employed). Givena 2010 DHP budget of $27.9 billion, the program budget has grown by more than 100% in real
terms since 1999. Partly this reflects the trend in medical care generally, which has especially
affected the cost of those services the DHP purchases from civilian providers. Also, the feescharged to participants have not kept pace with national trends, while eligibility for the programhas expanded. Finally, the mobilization of reservists for the wars in Iraq and Afghanistan hasbrought more families into the “direct care” portion of the program, which is the least expensive,and this has driven other eligible recipients into the higher-cost “privatized” portion.{8}
Also a major factor in the growth of the defense-wide account is the budgeting for intelligenceagencies and accounts. How much this component has grown is hard to say because the variousintelligence elements included in the defense-wide folder are classified. However, budgetgrowth for a significant portion of the US intelligence community can be measured, and this cangive some indication of growth in the intelligence component of DoD’s defense-wide accounts.
In 2008, the then Director of National Intelligence, Adm. Michael McConnell, reported the USNational Intelligence Program (NIP) budget to be $47.5 billion.{9} In 1998, George Tenet hadreported it as $26.7 billion. Adjusting for inflation, these figures imply a 32% increase in real
terms between 1998 and 2008. (The NIP is only one of three components of a US intelligencesystem that, in total, presently costs about $75 billion annually. Most of the intelligencecommunity is funded through DoD accounts, but only a portion of this is covered in the “defense-wide” category.) {10}
Finally, the US Special Operations Command (SOCOM) and the US Missile Defense Agency(MDA) have significantly contributed to the rise in defense-wide spending. In 1999 the MDAreceived a budget of $4.8 billion (2010 USD); in the 2010 budget request, it was allotted $7.8billion. In FY 2000, SOCOM’s budget was $4.77 billion (2010 USD). In FY 2008, it received a total
of $9.72 (2010 USD), which represents a greater than 100% increase in real terms.
Notes
1. Moshe Schwartz, Department of Defense Contractors in Iraq and Afghanistan: Background and Analysis
(Washington DC: Congressional Research Service, 13 August 2009); also see: DoD, State, and USAID
Continue to Face Challenges in Tracking Contractor Personnel and Contracts in Iraq and Afghanistan
(Washington DC: Government Accountability Office, October 2009); and, Contractors’ Support of US
Operations in Iraq (Washington DC: Congressional Budget Office, August 2008).
2. The Department of Defense's Research, Development, Test and Evaluation Program: A Primer (Washington
DC: Congressional Research Service, 1996).
3. Stephen Daggett, et. al., FY2009 Spring Supplemental Appropriations for Overseas Contingency Operations
(Washington DC, Congressional Research Agency, July 2009); Amy Belasco, The Cost of Iraq, Afghanistan,
and Other Global War on Terror Operations Since 9/11 (Washington DC, Congressional Research Agency,May 2009); DoD Components’ Use of Global War on Terror Supplemental Funding Provided for Procurement
and Research, Development, Test, and Evaluation (Arlington VA: Inspector General, Department of Defense,April 2009); and, Analysis of the Growth in Funding for Operations in Iraq, Afghanistan, and Elsewhere in
the War on Terrorism (Congressional Budget Office, February 2008).

8/14/2019 Pda Briefing Report #20
http://slidepdf.com/reader/full/pda-briefing-report-20 55/77
42 AN UNDISCIPLINED DEFENSE
4. Force Structure: Actions Needed to Improve DoD's Ability to Manage, Assess, and Report on Global Defense
Posture Initiatives (Washington DC: Government Accountability Office, 2 July 2009).
5. Estimated Cost of the Administration’s Proposal to Increase the Army’s and the Marine Corps’s Personnel
Levels (Washington DC: Congressional Budget Office, 16 April 2007).
6. Force Structure: Actions Needed to Improve Estimates and Oversight of Costs for Transforming Army to
a Modular Force (Government Accountability Office, 29 September 2005).
7. Military Base Realignments and Closures: Estimated Costs Have Increased While Savings Estimates Have
Decreased Since Fiscal Year 2009 (Washington DC: Government Accountability Office, 13 November 2009).
8. Philip Lurie, “Analysis and Forecasts of TRICARE Costs,” IDA Research Notes (Fall 2008).
9. The 1998 NIP budget was $37.27 billion (2010 USD), while the 2008 NIP budget was 49.2 billion. Jim Wolf,“US says 2008 intelligence budget was $47.5 billion,” Reuters.com,28 October 2008; Stephen Daggett, The
US Intelligence Budget: A Basic Overview (Washington DC: CRS, 24 September 2004).
10. “2009 National Intelligence Strategy,” Media conference Call with Mr. Dennis C. Blair, Office of the
Director of National Intelligence, Washington DC, 15 September 2009.

8/14/2019 Pda Briefing Report #20
http://slidepdf.com/reader/full/pda-briefing-report-20 56/77
PROJECT ON DEFENSE ALTERNATIVES 43
Appendix B: Goal Inflation in
post-Cold War US Defense Strategy
Interpreting the rebound in defense spending requires putting it into strategic perspective. And the period under review straddles a pivotal strategic divide: the end of the Cold War.
During the Cold War, the United States faced a multifaceted, global challenge of unparalleledmagnitude – a peer challenge. At that time, the cluster of Western adversaries worldwideincluded what are today 42 independent states – nearly one quarter of the world’s total. And thisgroup invested as heavily in military power as did the United States and its allies.
Looking only at Cold War Europe, two million Soviet bloc troops stood ready within a few daysstriking distance of the Western heartland. Behind these stood perhaps 5 million more troops.The Soviet arsenal grew to include 9000 tactical aircraft, 65,000 tanks, a global navy, thousandsof advanced missiles, more than 45,000 nuclear warheads, approximately 40,000 metric tons of
chemical agents, and tens of thousands of tons of biological agents.
The East-West contest also intersected and redefined the North-South divide. Together, thesuperpower blocs provisioned more than 60 garrison states in the South and involved themselvesin more than 30 significant civil conflicts there -- including, most notably, the Korean and Vietnamwars.{1} And the entire configuration was linked to the prospect of a global nuclear war which,had it commenced, might have claimed 40 million lives within one week and many more insubsequent months.{2}
With the eclipse of the Cold War threat, one might have expected a relatively deep retrenchmentin US defense spending. And, indeed, there was a short-lived ebb during the 1990s. However,looking back from the vantage point of 2010, the 1990s dip is virtually indistinguishable from
earlier cyclical dips in defense spending.
Taking a longer view, DoD budgets during the first two decades of the “new era” run about 7% higher on average (in real terms) than they did during the last two decades of the Cold War(which encompass several high-tide years of Vietnam war spending). Take the current US warsout of the calculation and the first two decades of the post-Cold War era cost about 97% as muchas during the last two decade of the Cold War.
Looking at trends in world military expenditure, the 1990s decline in US spending never matched the world decline. (See Figure B-1.) And the growth in US spending since the 1990s has Americaclaiming a much larger share today.
# The United States went from accounting for only 28% of world spending during the ColdWar to 41% in 2006.
# The Western group as a whole went from a 49% share to a 70% share.
# By contrast, the group of potential adversary and competitor states went from claiminga 42% share to just 16% in 2006.

8/14/2019 Pda Briefing Report #20
http://slidepdf.com/reader/full/pda-briefing-report-20 57/77
44 AN UNDISCIPLINED DEFENSE
America’s present predominance in military expenditure is not solely a product of post-9/11initiatives. Throughout most of the 1990s, the United States claimed between 31% and 33% of world military expenditures, while potential adversary states in aggregate claimed 18% to 20%.
B1. The post-Cold War shift in strategy and goals
It is one thing to argue that the complexity, instability, and uncertainty of today’s world posesa special challenge to military strategists and planners striving to devise a sustainable securitypolicy. It is quite another to contend that these circumstances in themselves require America
to spend more on defense today than during the Cold War. But, then, the formulation of defense“requirements” always has involved more than net assessment – that is, more than a comparisonof “our” capabilities and “theirs”. Goals and strategy also figure centrally in the setting of “requirements”. And there is no doubt that, with the end of the Cold War, the United Statesadopted more challenging goals for itself and its armed forces. Appreciating this strategic choiceas a choice brings us a step closer to understanding the phenomenal growth in defense
expenditure since 1998.
As the Cold War threat receded, successive US administrations indulged in what is mostaccurately described as “goal inflation.”
# The Cold War emphasis in Pentagon planning on achieving simple defense anddeterrence gave way to increased emphasis on various forms of preventative action – notonly preventative war and regime change, but also greater reliance on the military to
Figure B-1. World Military Spending Shares 1986-2006(% Total Based on PPP*)
28.2 34.3 34.7 41.2
20.5
33.1 31.0528.5
42.419.9 18 16
8.9 12.7 16.2 14.2
0%
20%
40%
60%
80%
100%
1986 1994 2000 2006
United States US allies** Adversary & competitor states** Rest of world
* PPP = Purchasing Power Parity ** See Data Sources appendix for country lists
Sources: see Data Sources appendix

8/14/2019 Pda Briefing Report #20
http://slidepdf.com/reader/full/pda-briefing-report-20 58/77
PROJECT ON DEFENSE ALTERNATIVES 45
“shape the strategic environment” and prevent the emergence of threats. Increasingly,military power substituted for diplomacy and other instruments of national power.
# The emphasis on preparing against real and present or emerging military threats gaveway to an increased emphasis on preparing against a broad range of lower probability
and future possible or “unseen” threats.{3}
# Military-strategic and operational goals also grew more ambitious, as explicated below.
Military-strategic and operational goals determine how America fights its wars and handlesmultiple contingencies. What types of contingencies must we prepare for? How much forcemust we be able to deploy, how fast, and how far? How quickly must we “finish up” and prepare
to redeploy? How much risk and uncertainty can we tolerate? “Requirements” vary dependingon how these questions are answered – with profound implications for force size, modernization,and readiness standards.
The Pentagon may ambitiously seek the capacity to deploy significant force to distant theaters
in 10 days, defeat an enemy in 30, and be ready to fight again within another 30.{4} Or, the USArmy may seek, unrealistically, to deploy a brigade anywhere in the world in 96 hours, a divisionin 120 hours, and five divisions in 30 days.{5} In devising a double war scenario, planners mayassume that the wars come just 45 days apart.{6} If such goals and assumptions become thestandards for assessing preparedness, then “readiness crises” easily ensue. Such was the casein 1999 when two Army divisions were found to be not sufficiently ready to deploy on schedulefor an ambitious double-war scenario.{7} What is lost in this is a balanced assessment of thelikely risks entailed by reverting to more modest deployment schedules.
Most of the new strategic imperatives were first codified in the 1997 and 2001 Quadrennial
Defense Reviews (although they resonate with ideas first ventilated in the 1992 Defense Policy
Guidance document).{8} With regard to defense programming and budgeting, they had the
effect of capping the cuts in force structure while providing reasons to:
# Sustain and enhance US global military presence and reach,# Attain and maintain higher-levels of operational readiness, and# Restore a higher pace of equipment modernization.
Additionally, the new guidance required that the US military, although reduced in size,nonetheless retain nearly all the facets of power that it had evolved over 50 years: the commands,services, service “arms”, and enabling capabilities. In a sense, the “house” was to be smaller,but it was to have just as many wings, rooms, and windows as before. And, as we explore in Appendix C, this was to pose a serious challenge throughout the new era as Pentagon managersstruggled to streamline the services and their supporting structures.
B2. The Pentagon’s full plate
As the new guidance took hold, the Pentagon’s list of essential tasks grew in length, complexity,and ambition. The 2006 Quadrennial Defense Review usefully divides the essential tasks into twobroad categories: steady-state and surge.

8/14/2019 Pda Briefing Report #20
http://slidepdf.com/reader/full/pda-briefing-report-20 59/77
46 AN UNDISCIPLINED DEFENSE
Steady-state activities include:
# Maintaining a generalized US global military presence on land and sea, including newreaches into eastern Europe, central Asia, and sub-Saharan Africa. Today, globalpresence involves a network of over 850 foreign bases and installations, 130,000
personnel on foreign soil (excluding those in Iraq, Kuwait, and Afghanistan), and 30,000sailors afloat on more than 100 deployed ships and submarines.
# Maintaining significant deterrent strength with regard to potential aggression on theKorean peninsula, in the Taiwan straights, in the Persian Gulf, and in Europe.
# Conducting multiple, complex missions of varying duration – including counter-terroristoperations and smaller-scale counterinsurgency, stability, and nation-building missions.
# Conducting a broad variety of engagement and partnerships activities involving training,exercises, exchanges, and security cooperation with allied and friendly nations. Thescope of these activities has expanded substantially since the end of the Cold War and
presently include significant activities involving nearly 60 nations. On the eve of the 9/11attacks, America’s armed services were already engaging in more than 170 multinationalexercises per year.{9}
# Ongoing counter-proliferation and counter-terrorism campaigns. Apart from Iraq andAfghanistan, the latter includes significant efforts in about 20 countries outside NATO,involving approximately 5,000 troops; and,
# Homeland protection duties.
Surge missions might include:
# Helping to manage the consequences of domestic WMD attacks and other catastrophicevents. And,
# The conduct of two overlapping large-scale operations. One of these might include theaim of “regime change”. And one might be a protracted counterinsurgency, stability,and/or nation-building operation.
In a marginal concession to reality, the forthcoming 2010 QDR may modify the two-war standardand task the military to be ready to either handle two major conflicts or (i) fight and win onemajor war, while simultaneously (ii) maintaining deterrent strength in several theaters and (iii)conducting several less intensive operations of varying size.{10}
With or without an explicit “two-war” standard, the US military today prepares to conduct four types of major combat operations:
# Operations like Allied Force in Serbia/Kosovo and the initial phase of Enduring Freedom,
in which air power plays the primary role.
# Conflicts like the conventional phase of the 2003 Iraq war, which involve large numbersof mechanized units as well as air power in a traditional form of air-land battle.
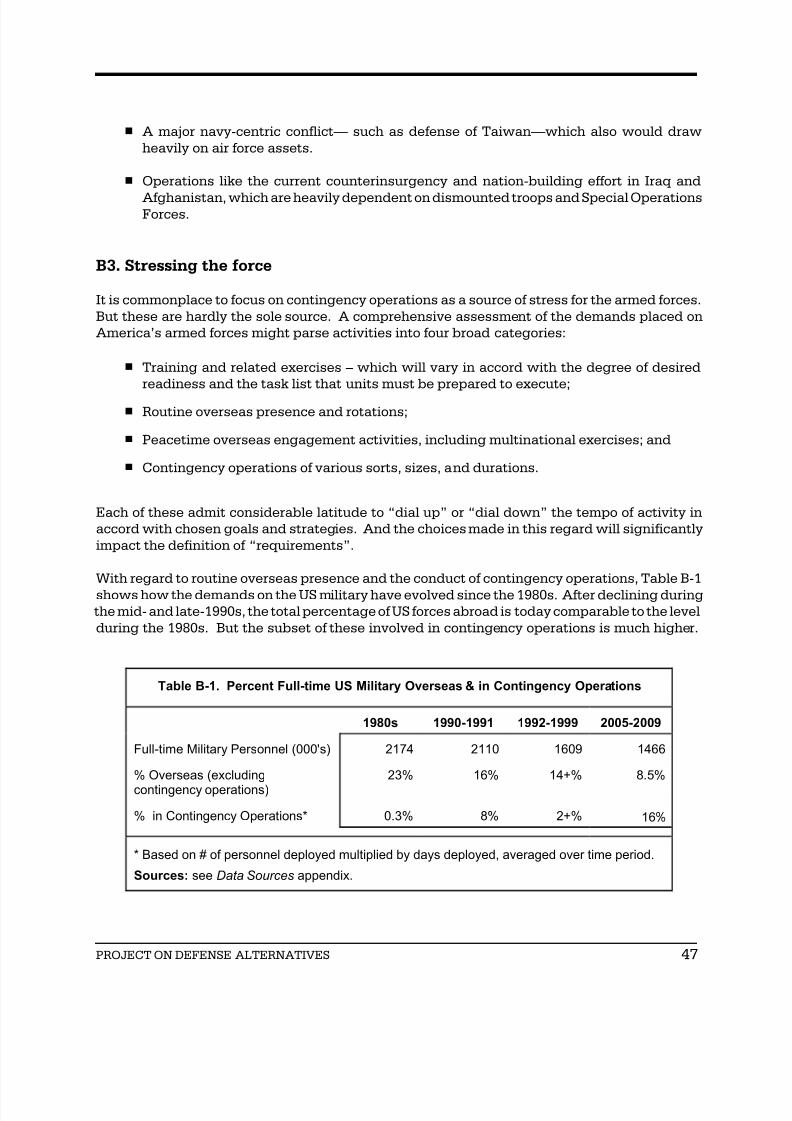
8/14/2019 Pda Briefing Report #20
http://slidepdf.com/reader/full/pda-briefing-report-20 60/77
PROJECT ON DEFENSE ALTERNATIVES 47
# A major navy-centric conflict— such as defense of Taiwan—which also would drawheavily on air force assets.
# Operations like the current counterinsurgency and nation-building effort in Iraq and
Afghanistan, which are heavily dependent on dismounted troops and Special OperationsForces.
B3. Stressing the force
It is commonplace to focus on contingency operations as a source of stress for the armed forces.But these are hardly the sole source. A comprehensive assessment of the demands placed onAmerica’s armed forces might parse activities into four broad categories:
# Training and related exercises – which will vary in accord with the degree of desiredreadiness and the task list that units must be prepared to execute;
# Routine overseas presence and rotations;
# Peacetime overseas engagement activities, including multinational exercises; and
# Contingency operations of various sorts, sizes, and durations.
Each of these admit considerable latitude to “dial up” or “dial down” the tempo of activity inaccord with chosen goals and strategies. And the choices made in this regard will significantlyimpact the definition of “requirements”.
With regard to routine overseas presence and the conduct of contingency operations, Table B-1
shows how the demands on the US military have evolved since the 1980s. After declining during the mid- and late-1990s, the total percentage of US forces abroad is today comparable to the levelduring the 1980s. But the subset of these involved in contingency operations is much higher.
able B-1. Percent Full-time US Military Overseas & in Contingency Operations
1980s 1990-1991 1992-1999 2005-2009
Full-time Military Personnel (000's) 2174 2110 1609 1466
% Overseas (excluding
contingency operations)
23% 16% 14+% 8.5%
% in Contingency Operations* 0.3% 8% 2+% 16%
* Based on # of personnel deployed multiplied by days deployed, averaged over time period.
Sources: see Data Sources appendix.

8/14/2019 Pda Briefing Report #20
http://slidepdf.com/reader/full/pda-briefing-report-20 61/77
48 AN UNDISCIPLINED DEFENSE
Still, even today, contingency operations may constitute only half of the aggregate demandplaced on the US armed forces. Certainly, during the 1990s – when military readiness concernsreached a fever pitch – they constituted much less than half. At the time, a study by RandCorporation found that three stressed Air Force wings probably devoted only 7% of their time tocontingency operations. The rest was consumed by routine peacetime activities, training,
inspections, and various types of exercises – command, joint, and multinational.{11} A morecomprehensive RAND study found that contingency operations consumed about 6% of USAFflying hours during the mid-1990s.{12}
Historically, the employment of the armed forces in activities other than contingency operationsand routine training has been considerable. Reflecting again on the readiness crisis of the late1990s:
# The 1999 USAF posture statement asserted that in a single year service members"participated in over 1,600 exercises in 35 countries, and conducted almost 300military-to-military contact visits in Europe and the Pacific."{13}
# A GAO study of the 1,405 JCS exercises conducted or planned for the period 1995-2002found that 44% were primarily directed toward engagement activities with foreignmilitary forces.{14}
# In testimony before the US House Subcommittee on Military Readiness, General RichardMyers, then commander of Pacific Air Forces, noted that in 1998 the Pacific Commandwas conducting an intensive exercise program involving 23 Pacific nations.{15}
# Admiral Paul Reason, when commander of the US Atlantic Fleet, argued before the HouseReadiness Subcommittee that “too many (regional) CinCs are placing demands on too fewassets,” leading to duplicative training, among other problems.{16}
B4. From missions to “requirements”: Capability-based planning
Commensurate with the adoption of goals that were both more diffuse and more ambitious, the“threat-based planning” common to the Cold War period gave way to “capability-basedplanning” (CBP). The earlier “threat-based” approach set out a handful of key scenarios to guideforce planning (with everything else relegated to “lesser included” status). By contrast, CBPseeks to build armed forces optimized to address a much broader array of missions and scenariosmore equally – as best they can, at any given level of funding.{17} This can generate unrelentingupward pressure on the budget for several reasons:
First,because the supply of “scenarios” is unlimited and there can never be certaintyabout how much capability is needed to achieve any particular objective.
Second, because a force optimized to do the best it can across a broad range of scenarioswill often prove sub-optimal for those contingencies that actually occur.
The galaxy of security threats and challenges becomes something of a “soft blur” in CBP. Thus, the linkage between specific assets and specific threats is attenuated, making it hard to

8/14/2019 Pda Briefing Report #20
http://slidepdf.com/reader/full/pda-briefing-report-20 62/77
PROJECT ON DEFENSE ALTERNATIVES 49
determine the true cost-benefit value of any particular asset. Instead, “assets” are weighed in terms of their putative contribution to the whole – a “whole” that melds essential missions andless essential ones, likely scenarios and unlikely ones.
CBP is supposed to provide a hedge against uncertainty. But, paradoxically, the approach did
not prepare America well for the contingencies it faced beginning on 11 September 2001. In thecontext of DoD’s virtually feudalistic approach to defining “requirements”, CBP instead gave anew lease-on-life to legacy systems and capabilities. In the soft blur of CBP, almost any assetcan find a place – although only some come forward with the benefit of institutionalizedmomentum.
There are several prerequisites to a more disciplined practice of CPB, and these help illuminate the problems with the approach as currently practiced:
# First, as David Walker, former US Comptroller General, has observed: DoD “capabilitiesand requirements are based primarily on individual service wants versus collectivedefense needs.”{18} What is needed instead, especially under a CBP regime, is a unified
“bottom up” approach to defining requirements and fashioning forces. Such an approachwould not privilege legacy systems or the traditional allocation of roles and missionsamong services.
# Second, the threats and scenarios employed in planning must be strictly prioritized.Those with high and moderate probabilities should lead the way and, in these cases only,
the investment in counter-capabilities should correspond to the value of what is at stake.
# Finally, national authorities must institute and enforce strong budget limits so as tocompel planners to set clear priorities and make hard choices about force development.
It is often argued that “budgets should conform to defense strategy – and not the other way
around.”{19} This is reasonable enough when, for instance, a nation is defending againstimmediate threats to its survival. In such cases, the stakes are clear and unlimited. It is lessreasonable when objectives are much less urgent or much less necessary. What really isrequired is for defense budgeting to be strictly bound by a higher-order national strategy thatbalances the allocation of scarce resources among competing national goals -- foreign anddomestic, military and non-military.
Notes
1. Nils Petter Gleditsch, et. al., “Armed Conflict 1946-2001: A New Dataset”, Journal of Peace Research, Vol.
29, No. 5 (2002); and, Ruth Leger Sivard, World Military and Social Expenditures 1996 (Washington DC:World Priorities, 1996).
2. The Effects of Nuclear War (Washington DC: Office of Technological Assessment, May 1979).
3. Benjamin H. Friedman and Harvey M. Sapolsky, “You Never Know(ism),” Breakthroughs, MIT SecurityStudies Program (Spring 2006); and, Carl Conetta and Charles Knight, Dueling with Uncertainty: the New
Logic of American Military Planning (Cambridge MA: Commonwealth Institute, February 1998).
4. Jason Sherman, "US Shifts Troops Around The World," Defense News, May 31, 2004, Pg. 4.

8/14/2019 Pda Briefing Report #20
http://slidepdf.com/reader/full/pda-briefing-report-20 63/77
50 AN UNDISCIPLINED DEFENSE
5. Megan Scully, "US Army Weighs Deployment Goals Against Reality," Defense News, May 17, 2004, Pg.11.
6. In 1999 Senate testimony, General Michael Ryan, who was at the time Air Force Chief of Staff, stated thatDoD planning for the two-war scenario assumed that the wars would commence 45 days apart. Hearings
on Department of Defense Appropriations for Fiscal Year 2000, Defense Subcommittee of the US SenateCommittee on Appropriations, 17 March 1999.
7. Army Readiness, DoD Background Briefing, Federal News Service, 10 November 1999.
8. For a critical overview of the 1997, 2001, and 2006 QDRs see Carl Conetta, “Dissuading China andFighting the ‘Long War’,” World Policy Journal (Summer 2006) and, Conetta, The Pentagon's New Budget,
New Strategy, and New War, PDA Briefing Report #12 (Cambridge MA: Commonwealth Institute, June2002). Both available here: http://www.comw.org/pda . On Defense Policy Guidance 1992-1994 see, BartonGellman, “Keeping the US First; Pentagon Would Preclude a Rival Superpower,” Washington Post, 11 March1992; and, Patrick E. Tyler, “US Strategy Plan Calls for Insuring No Rivals Develop,” NYT, 8 March 1992.
9. Joint Training: Observations on the Chairman, Joint Chiefs of Staff, Exercise Program (Washington DC:GAO, July 1998).
10. Christopher J. Castelli, “DoD Guidance Includes ‘Hypothesis’ for New Force-sizing Construct,” Inside
the Pentagon, 6 August 2009
11. Bruce D. Callander, "Dissecting the Tempo Problem," Air Force Magazine (April 1998); and, ThomasFossen, et al., What Helps and What Hurts: How Ten Activities Affect Readiness and Quality of Life at Three
8AF Wings (Santa Monica, CA: National Defense Research Institute-RAND, 1997).
12. Alan Vick, et al., Preparing the US Air Force for Military Operations Other Than War (Santa Monica, CA:National Defense Institute-RAND, 1997).
13. US Air Force, Posture Statement 1999 (Washington DC: US Department of the Air Force, 1999), p. 5.
14. Joint Training: Observations on the Chairman, Joint Chiefs of Staff, Exercise Program (Washington DC:United States GAO, July 1998), pp. 3-4.
15. Gen. Richard Myers, testimony before the House Subcommittee on Military Readiness concerningQuarterly Readiness Report to Congress, Washington DC, 6 March 1998.
16. Robert Holzer, “Structure of US High Command Could Damage Force Readiness,” Defense News, 17March 1997.
17. Paul Davis, ed., New Challenges for Defense Planning: Rethinking How Much is Enough (Santa Monica:RAND, 1994).
18. The Honorable David M. Walker, Comptroller General of the United States, “DoD Transformation
Challenges and Opportunities,” testimony before the House Armed Services Committee, 24 Jan 2007.
19. Office of Congressman J. Randy Forbes, “Strategy, Not Dollars Should Drive Defense Decisions,” Press
Release, 16 June 2009; Sheila Foote, “Cohen says defense strategy will drive QDR, Defense Daily, 13February 1997; Baker Spring, Clinton's ‘No-Win’ Defense Budget, Heritage Foundation Executive
Memorandum #467 (Washington DC: 14 February 1997).

8/14/2019 Pda Briefing Report #20
http://slidepdf.com/reader/full/pda-briefing-report-20 64/77
PROJECT ON DEFENSE ALTERNATIVES 51
Appendix C: More for Less? The Limits of
Defense Reform and Military Transformation
The problem set that reform and transformation efforts were meant to address comprises bothlong-standing issues and some new ones introduced by the process of force reduction itself.
Among the long-standing and broadly recognized problems are:
# Difficulties in integrating the efforts of the individual services and removing unnecessaryredundancies in both combat and support functions;
# Streamlining the armed services support and maintenance systems, generally, and “right-sizing” the defense infrastructure, including the military base system;
# DoD’s chaotic financial management and accounting system, which renders audits
virtually impossible and, thus, opens the door to waste (or worse), while impairingaccurate cost analysis and good planning; and
# DoD’s dysfunctional equipment acquisition process, which GAO scores as routinelydelivering systems that “involve higher costs, later fielding than planned, and lessperformance than expected.”{1}
In addition to these long-standing problems, the process of reducing the size of America’smilitary itself introduced new efficiency problems.
# With the reduction in force size, acquisition and support systems that had evolved toserve a larger military lost some economy of scale, making everything more expensive
per unit. Recovering (or improving on) that economy requires extensive restructuring.
# A similar problem concerns the complexity of the US armed forces, generally. If the fullcomplexity of the military were retained, while its size reduced, “field units” (such ascombat battalions, air squadrons, and naval combatants) would suffer disproportionatecuts.
C1. A costly complexity
The US military is an organization of incomparable complexity, larger in size than IBM, GM, Ford,GE, and Bank of America combined. Apart from the four services – five including the CoastGuard – and six reserve components, it maintains 50 major commands either one step above orbelow the service level. Each service maintains a variety of combat arms in addition to supportunits. For instance, the US Navy’s “arms” include surface combatants of several types, aircraftcarriers, carrier aviation, amphibious warfare capabilities, mine warfare aircraft and ships,special operations units, and nuclear attack, hunter-killer, and conventional land-attacksubmarines.

8/14/2019 Pda Briefing Report #20
http://slidepdf.com/reader/full/pda-briefing-report-20 65/77
52 AN UNDISCIPLINED DEFENSE
A thorough accounting of the US military’s complexity might measure it in terms of the numberand variety of its:
# Functions or “mission portfolios”,
# Constituent arms, and
# “Command spheres” – some geographical (CENTCOM), some functional (STRATCOM),but all serving to define the military’s scope of action.
All of these represent facets of power. And each requires some specialized fixed investment(staff, infrastructure, support). The fact of this fixed investment means that cuts weighdisproportionately on the most variable elements of the force structure: field units andcombatants, which can be easily sliced away or hollowed out.
A “bottom up” reform might seek to re-engineer the whole enterprise, adapting its way of doingbusiness to a smaller size. However, as it turns out, the path of change actually chosen was toretain complexity, implement personnel reductions, and increase the level of outsourced
activities. This partly compensated for lost efficiency and made it possible to keep morepersonnel in the deployable and combat components of the force than would have otherwisebeen the case. This is tantamount to retaining or increasing the military’s de facto size, but withmore of the support functions sitting outside DoD in private hands.
This option trades a reduction in personnel expenditures for an increase in contract expenditures(which would manifest mostly as a rise in O&M costs). There is a potential for financial savingsby this path insofar as the cost to DoD for non-DoD labor is usually less than the cost of in-houselabor, whether military or civilian. But much depends on how carefully contracts are negotiatedand managed -- and on how much is demanded of the services. The higher the level of expectedreadiness, overseas engagement, and operational activities, the more likely it is that O&M costswill rise to vacate any hoped for peace dividend.
C2. The prospects for reform
The end of the Cold War created an opportunity for the deep structural reform of America’smilitary – potentially comparable to that achieved after the Second World War. Restructuringwas necessary due to planned force reductions and the desire to extract a “peace dividend”.However, achieving these ends depended on national leadership exercising sufficient politicalwill to overcome considerable inertia within America’s most respected institution: its military.
It is not that the DoD and armed forces lack in-house reformers and visionaries.{2} They arepresent, often celebrated, but also often either marginalized or “niched” in reform vestibules,
such as the Office of Force Transformation (which was closed in August 2006, after nearly fiveyears of operation).{3} Even when reformers rise to the top, reform itself faces a hard slog. TheUS military’s quasi-feudalistic structure can dissipate reform impulses as easily as a good shockabsorber dissipates bumps. More effective at prompting the institution to reform itself are theexigencies of war or the shock of defeat. But the Pentagon emerged from the Cold War (and from
the Gulf War soon after) as a victor.

8/14/2019 Pda Briefing Report #20
http://slidepdf.com/reader/full/pda-briefing-report-20 66/77

8/14/2019 Pda Briefing Report #20
http://slidepdf.com/reader/full/pda-briefing-report-20 67/77
54 AN UNDISCIPLINED DEFENSE
The 1990s opened with impressive measures to downsize and streamline militaryinfrastructure ...... But, inside the Pentagon, the vision for achieving infrastructuresavings became increasingly limited: seek Congressional support for closing morebases; reduce the number of personnel at service and command headquarters and inorganizations that report directly to the Secretary of Defense; pursue more public-private
competitions, conduct limited internal consolidations; and eke out whatever savings arepossible from adopting business practices that have become common outsidegovernment.{6}
The Government Accountability Office points to competitive (out)sourcing efforts and militarybase reductions as the initiatives that probably have saved the most money. Although DoD hassought to open 240,000 existing military and DoD civilian positions to outside competition, theactual number of positions competed so far is much less. At any rate, once completed, theprocess is not likely to produce annual savings exceeding $3 billion (2010), if that.{7}
As for base closures: The first four BRAC rounds – 1988, 1991, 1993, and 1995 – reducedinfrastructure by about 20% and have produced annual savings of about $7 billion. The fifth
round, now underway, may close as much again, but produce savings of only $3.9 billionaccording to the GAO.{8}
In sum, the two most fruitful of current reform efforts will probably not produce reliable annualsavings exceeding $14 billion (2010) – once enactment costs have been fully paid.
C4. Acquisition, logistics, and financial management reform
In the 13 years since the Clinton administration first launched a coordinated defense reformeffort, the GAO has routinely noted the slow pace of progress in the pivotal areas of financialmanagement, acquisition reform, and logistics.{9} Regarding shortfalls in DoD’s managementof its finances, the acting US Comptroller General, Gene Dodaro, recently noted that:
While DoD represents a big share of the federal budget, it is one of the few federalentities that cannot accurately account for its spending or assets. It is one of only 3entities in the entire government that cannot pass the test of an independent audit.{10}
The implications of this failure for planning and budgeting are clear in the assessment of KwaiChan, a former lead analysts with the GAO: “DoD does not know what it owns, where itsinventory is located, and how its annual budget is being spent.”{11}
Regarding logistics problems, there recently has been some notable progress in speeding the
delivery of critical items to theaters of war, but the larger problems of excess inventory, poorinventory control, and weak coordination among DoD’s multiple logistics systems persists.{12}This implies little progress since the Defense Science Board reported in 2006 on “the failure of DoD improvement strategies to date, which have been primarily focused on incrementalimprovement within traditionally-defined logistics structures and organizations.”{13}
Turning to the equipment acquisition process: The number of programs showing one or moreof the characteristic problems – over budget, late in delivery, less capability than expected – has

8/14/2019 Pda Briefing Report #20
http://slidepdf.com/reader/full/pda-briefing-report-20 68/77

8/14/2019 Pda Briefing Report #20
http://slidepdf.com/reader/full/pda-briefing-report-20 69/77
56 AN UNDISCIPLINED DEFENSE
C5. The thermidor in military affairs
Although not part of the defense reform agenda, per se, the prospect of achieving a technology-based “revolution in military affairs” (RMA) contributed to hopes that the post-Cold War USmilitary might be able to do “more for less.” The central conceit of RMA thinkers was that –
given the employment of appropriate technology, organization, and methods – informationmightserve to partially substitute for mass in the functioning of military forces.{18} By reducinguncertainty, information would lessen the need for redundancy. Greater precision in the deliveryof firepower, in the movement and coordination of assets, and in the provisioning of units wouldallow less to do more – or, a similar sized force to do much more.
The fullest realization of the RMA vision would be a military with assets and units fully“networked” within and across services.{19} In this way, the vision complements and dependson advances in “jointness”. As noted in the main section of this report, the putative networkwould comprise three levels – information collection, strike, and support – and these would befused by joint communications and information processing capabilities. Ideally, this would serveefficiency by reducing the resort to redundant capabilities:
# Capabilities would be distributed among cooperating platforms, alleviating the tendency to overload individual platforms with capabilities (and costs).
# Capabilities would be shared (or fused) across services. Thus, for instance, varioussources of firepower – fixed-wing aircraft, helicopters, artillery, UAVs, cruise-missilesubmarines, missile-bearing surface ships – would become fungible. All would becomeavailable to all. And,
# The tendency for logistics stores to accumulate at multiple (and often opaque) sitesstretching from the continental United States to forward operating areas would berelieved.
These promises have gone substantially unfulfilled, however. Partly, this reflects the uneven andslow progress in creating the foundation for the envisioned “network-centric” force. Here, theproblems are of both the engineering and bureaucratic variety. The limits were evident in thefirst phase of Operation Iraqi Freedom, which some had hailed as marking the advent of network-centric warfare. Admiral Cebrowski, then head of the Office of Force Transformation, gave amore modest appraisal, however, concluding that the operation evinced “network-centricwarfare for the joint task force commander” only.{20}
Linkages had been established among higher-level headquarters that could support much betterdata-sharing and real-time interaction among staff. But the “network” had substantial problems
getting useful information and support to tactical units in a timely fashion, leading fieldcommanders to complain of a “digital divide” and Cebrowski to cite a “pronounced weaknessin connectivity at the tactical level.”{21} In fact, tactical commanders found themselvesoverburdened with disparate communications gear and -- when available bandwidth wouldallow data to flow -- glutted with data (which, importantly, is not the same as “information”).
In testimony before Congress, the Army forces commander, Lt. General William Wallace,complained of incompatible communications systems, insufficient bandwidth, network

8/14/2019 Pda Briefing Report #20
http://slidepdf.com/reader/full/pda-briefing-report-20 70/77
PROJECT ON DEFENSE ALTERNATIVES 57
unreliability, and poor dissemination of intelligence.{22} Blockages in joint support systems of various types -- intelligence, logistics -- led the services to mostly rely on their own stovepipesand led tactical units to depend on organic assets.{23}
Moving and tracking material to the theater went much better than it had in Desert Storm,
making it possible to send less. However, efforts to then move the material forward to tacticalunits often came up short -- especially when those units were on-the-move. This promptednumerous and frequent complaints from battalion- and company-level commanders. Structurally,logistics systems remain fragmented.
One area of operations that has shown greater progress is aerial reconnaissance and strike,mostly involving Air Force assets. Capacities for standoff attack with guided weapons haveincreased dramatically since 1990 and reaction times have been shortened. Also noteworthy is
the integration of special forces in the targeting cycle and the much increased use of UAVs inreconnaissance and strike roles. Advances of this sort have inspired “net-centric” thinking since
the first Gulf War. But they hardly represent what has been accomplished overall. Indeed, theysuggest a much narrower type of network: what the Soviets used to call a “reconnaissance-fire
complex.”
At heart, network-centric warfare depends on the emergence of a common nervous system among
the services. What presently exists, however, is a wide variety of service-centric and oftenincompatible command, control, communications, computation, and intelligence (C4I) systems– some of which are cludged together on the eve of war to enable better joint staff work.Certainly, at all levels, war compels greater inter-service cooperation. But when that comes upshort – as it often does – the services are quick to fall back on their individual devices. The largerreality is that the simplest, most essential thing -- getting the services to buy and use compatibleradios and communication protocols -- remains deeply conflicted.{24}
In a 1997 article, Kenneth Allard reflected on the structural impediments to transforming C4I
along joint lines, suggesting that “separately organized military services always put their ownneeds first and joint concerns second – especially when building command and controlsystems.”{25} At issue is not simply cooperation in the field, but cooperation in designing andbuilding a common nervous system (or, at least, compatible nervous systems), within andbetween services. Strong leadership and resourcing from the center are essential, but as the2004 Joint Defense Capabilities Study found: In the development of joint warfighting capabilities,
the individual services are still in the lead and “‘jointness’ is forced into the program late in theprocess.”{26}
Looking specifically at the development of joint command and control capabilities, a 2005Defense Science Board study concluded that DoD “and its subordinate entities have notarticulated a general way forward... especially to address tactical needs.”{27} Of particularconcern, the Board found that:{28}
# Command and control advances made in recent operations had not been institutionalized.
# Systems engineering for the developing, fielding, and integrating a “network-enabledoperations information infrastructure” was inadequate.

8/14/2019 Pda Briefing Report #20
http://slidepdf.com/reader/full/pda-briefing-report-20 71/77
58 AN UNDISCIPLINED DEFENSE
# DoD lacked a systematic process for setting priorities among competing informationinfrastructure programs. And, indeed,
# The authorities for developing a “network-enabled operations information infrastructure”were not fully established.
What the above suggests is that the weakness of joint endeavors is reproducing itself byundermining the development of common C4I systems. In this light, it is not surprising thatinter-service networks have not developed to the point where DoD might consider (and theservices might accept) more substantial tradeoffs between individual service capabilities. Putsimply: it is far from the case that “all is available all”. Moreover, it is not clear that such canbe achieved if policy proceeds along its current path.
Even if the services accepted and achieved the type of deep structural cooperation that networkcentric visions entail, there is no guarantee that this would translate into “savings”. Nationalleadership and DoD might choose instead seek to retain a power dividend. This already has been
the case with regard to the most substantial technology-driven advance of the past 20 years: the
great increase in the number of targets the US armed forces can engage from a standoff distanceand in all weather conditions, day or night.
Air Force combat aircraft presently possess twenty times the ground target interdictioncapability of their 1990 counterparts (on average, plane for plane).{29} And the introduction of
the small diameter bomb will make for another qualitative leap. The Navy claims that the targetattack capacity of its carrier air wings has grown from about 200 a day in 1997 to more than 700
today.{30} The number of missile launch systems on surface ships also has increasedsubstantially – from about 1900 in 1990 to 8000 today.{31} Implicit in this is the opportunity fora significant reduction in strike assets – so far not forthcoming.
Notes
1. Major Management Challenges and Program Risks Department of Defense (Washington DC: USGovernment Accountability Office, January 2003). Also see: Gene L. Dodaro, Acting Comptroller Generalof the United States, “Maximizing DoD's Untapped Potential to Improve Business Performance,” DoD
Performance Breakthrough Convention, Lansdowne VA, 14 October 2009; and, The Honorable DavidWalker, Comptroller General of the United States, “DoD Transformation Challenges and Opportunities,” testimony before the House Armed Services Committee, 24 Jan 2007.
2. Among others, these include Vice Admiral Arthur K. Cebrowski, who served as Director of the Office of Force Transformation from 2001 to 2005; Col. Douglas Macgregor (US Army), author of Breaking the Phalanx
(Westport CT: Praeger, 1997); Andrew Marshall, director of the Office of Net Assessment; Adm. WilliamC. Owens, author of Lifting the Fog of War (Baltimore MD: John Hopkins University Press, 2001), who servedas Vice Chairman of the Joint Chiefs of Staff from 1994-1996; and, Franklin C. Spinney, who served in theOffice of Program Analysis and Evaluation from 1977 to 2003.
3. A Defense Science Board task force concluded in 2005 that “the extent of influence that the Office of ForceTransformation has had on the rest of the Department is debatable, and many view the office as merely anappliqué.” DSB 2005 Summer Study on Transformation, Vols. I & II (Washington DC: Office of the UnderSecretary of Defense For Acquisition, Technology, and Logistics, April 2006), Volume 11, p. 209. On the risks

8/14/2019 Pda Briefing Report #20
http://slidepdf.com/reader/full/pda-briefing-report-20 72/77
PROJECT ON DEFENSE ALTERNATIVES 59
involved for “maverick” thinkers inside the services, see Tom Ricks, “Colonel's Transfer Said To Test Bush'sMilitary Reform Pledge,” Washington Post, 20 February 2002.
4. Directions for Defense: Report of the Commission on Roles and Missions of the Armed Forces (WashingtonDC: US Government Printing Office, June 1995). For critical perspectives see: Andrew F. Krepinevich, Missed opportunities: An Assessment of the Roles & Missions Commission Report (Washington DC: DefenseBudget Project, 1995); David C. Morrison, “Roles Panel Doesn't Roil Anybody,” The National Journal, 10June 1995; Philip Gold, “Military roles and missions, commission-style,” Washington Times, 31 May 1995;and John T. Correll, “Surprise Package on Roles and Missions,” Air Force Magazine (August 1995).
5. Colonel Richard A. Lacquement, Jr., Shaping American Military Capabilities after the Cold War (WestportCT: Praeger Publishers, 2003), p. 104.
6. Cindy Williams, "Holding the Line on Infrastructure Spending" in Holding the Line: US Defense
Alternatives for the 21 st Century, ed. C. Williams (Cambridge MA: MIT Press, 2001), p 60.
7. Trends in Operation and Maintenance Costs and Support Services Contracting (Washington DC:Government Accountability Office, May 2007); and, Defense Outsourcing: The OMB Circular A-76 Policy
(Washington DC: Congressional Research Service, 23 January 2001).
8. Military Base Realignments and Closures: Estimated Costs Have Increased While Savings Estimates Have
Decreased Since Fiscal Year 2009 (Washington DC: US Government Accountability Office, November 2009); Military Base Realignments and Closures: DoD Faces Challenges in Implementing Recommendations on Time
and Is Not Consistently Updating Savings Estimates (Washington DC: US Government Accountability Office,January 2009); and Military Base Closures: Observations of Prior and Current BRAC Rounds (WashingtonDC: US Government Accountability Office, May 2005).
9. Gene L. Dodaro, Acting Comptroller General of the United States, “Maximizing DoD's Untapped Potential to Improve Business Performance,” DoD Performance Breakthrough Convention, Lansdowne VA, 14 October2009; Defense Business Transformation: Sustaining Progress Requires Continuity of Leadership and an
Integrated Approach (Washington DC: US Government Accountability Office, March 2008); and, David M.Walker, Comptroller General of the United States, “DoD Transformation Challenges and Opportunities,”
testimony before the House Armed Services Committee, 24 Jan 2007.
10. Dodaro, “Maximizing DoD's Untapped Potential to Improve Business Performance.”
11. Kwai Chan, Financial Management in the Department of Defense: No One is Accountable (New York:Business Leaders for Sensible Priorities, May 2006).
12. Modernizing Defense Logistics (Arlington VA: Aerospace Industries Association, 2009).
13. Defense Science Board 2005 Summer Study on Transformation: A Progress Assessment (Washington DC:Under Secretary of Defense For Acquisition, Technology, and Logistics, April 2006), Volume II, p. 19.
14. Assessments of Selected Weapon Programs (Washington DC: GAO, 30 March 2009).
15. Anthony H. Cordesman and Paul S. Frederiksen, Is Defense Transformation Affordable? Cost Escalation
in Major Weapons Programs, Draft (Washington DC: CSIS, 27 June 2006).
16. Fred Kaplan, “Rumsfeld's Legacy ‘Military transformation’? Mission not-yet-accomplished,” Salon, 19October 2004; and, Thomas Ricks, “Rumsfeld on High Wire of Defense Reform,” WP, 20 May 2001.
17. Creating Defense Excellence: Defense Addendum to Road Map for National Security (Washington DC:US Commission on National Security/21st Century, May 2001).

8/14/2019 Pda Briefing Report #20
http://slidepdf.com/reader/full/pda-briefing-report-20 73/77
60 AN UNDISCIPLINED DEFENSE
18. Adm. William C. Owens, Lifting the Fog of War (Baltimore MD: John Hopkins University Press, 2001);and, Lt. General Frederic J. Brown, USA (Ret.), The US Army in Transition II: Landpower in the Information
Age (Washington: Brassey's, 1993).
19. Clay Wilson, Network Centric Warfare: Background and Oversight Issues for Congress (Washington DC:Congressional Research Service, March 2005);The Implementation of Network Centric Warfare (WashingtonDC: Office of the Secretary of Defense, 5 January 2005); and, Vice Admiral Arthur K. Cebrowski (USN) andJohn H. Garstka, “Network-Centric Warfare: Its Origin and Future,” Proceedings (January 1998).
20. Dan Caterinicchia and Matthew French, “Network-centric warfare: Not there yet,” Federal Computer
Week, 9 June 2003.
21. Dawn Onley, “Military fights C4I digital divide,” Government Computer News, 19 Nov 2003; John Ferris,“A New American Way of War? C4ISR in Operation Iraqi Freedom, A Provisional Assessment,” Journal of
Strategic and Military Studies (Spring-Summer 2003); and, David Fulghum, “Force-transformation directorlooks at what did, didn't work in Iraq,” Aviation Week & Space Technology, 2 May 2003.
22. Onley, “Military fights C4I digital divide.” Also see: Marc Selinger, “Faster battle damage assessmentsneeded, war study finds,” Aerospace Daily, 3 October 2003.
23. Lieutenant Commander Carl M. Bradley (USN), Intelligence, Surveillance and Reconnaissance in Support
of Operation Iraqi Freedom: Challenges for Rapid Maneuvers and Joint C4ISR Integration and Interoperability
(Newport RI: Naval War College, September 2004).
24. Department of Defense Needs Framework for Balancing Investments in Tactical Radios (Washington DC:Government Accountability Office, 15 August 2008); Resolving Development Risks in the Army's Networked
Communications Capabilities Is Key to Fielding Future Force (Washington DC: Government AccountabilityOffice, 15 Jun 2005); and, Recent Campaigns Benefitted from Improved Communications and Technology,
but Barriers to Continued Progress Remain (Washington DC: Government Accountability Office, June 2004).
25. Kenneth Allard, “Interoperability Is Hilt of Information Based Sword,” C4I News, 6 November 1997.
26. Joint Defense Capabilities Study Team (E.C. Aldridge, team leader), Joint Defense Capabilities Study Final Report (Washington DC: Office of the Under Secretary of Defense For Acquisition, Technology, andLogistics, January 2004), p iii.
27. Defense Science Board 2005 Summer Study on Transformation: A Progress Assessment (Washington DC:Under Secretary of Defense For Acquisition, Technology, and Logistics, April 2006), Volume II, p. 213.
28. DSB Summer Study on Transformation, Volume II, pp. 214 and 217-218.
29. Carl Conetta, Toward a sustainable US defense posture: an option to save $60+ billion over the next five
years, Project on Defense Alternatives Briefing Memo #42 (Cambridge MA: Commonwealth Institute, 2August 2007).
30. Admiral Vernon Clark, Chief of Naval Operations, statement before the Senate Armed ServicesCommittee, 10 February 2005, p. 18.
31. Transforming the Navy’s Surface Combatant Force (Washington DC: CBO, March 2003).

8/14/2019 Pda Briefing Report #20
http://slidepdf.com/reader/full/pda-briefing-report-20 74/77
PROJECT ON DEFENSE ALTERNATIVES 61
Appendix D: Data Sources
Tables
Table 1. DoD Spending Surge 1998-2008.
US Department of Defense (DoD), National Defense Budget Estimates for FY 2010 (Washington DC: USDoD, June 2009), Table 6-8 DoD BA by Appropriation Title, FY 1948 to FY 2010; US DoD, FY 2010
Budget Request Summary Justification (Washington DC: US Department of Defense, May 2009), Figure1.1 Historical DoD Funding, p. 1-6; US Office of Management and Budget (OMB), Analytical
Perspectives, Budget of the United States Government: Fiscal Year 2010 (Washington: GPO, May 2009),Table 26-1 Budget Authority and Outlays by Function, Category, and Program; Nina M. Serafino, Peacekeeping and Related Stability Operations: Issues of U.S. Military Involvement (Washington DC:Congressional Research Service, 4 October 2004).
Table 2. Allocation of DoD Budget Authority – Total and “Surged” 1999-2010.
For data through 2008 see, National Defense Budget Estimates for FY 2010 (Washington DC: US DoD,June 2009), Table 6-8 Budget Authority by Appropriation Title FY 1948-FY 2010, p. 91. For 2009 and2010 data see: US DoD, Budget Amendment to the FY 2010 President’s Budget Request for Overseas
Contingency Operations (OCO), Summary and Explanation of Changes (Washington DC: Office of theUndersecretary of Defense Comptroller, August 2009), pp. 6-9; US DoD, FY 2010 Budget Request
Summary Justification (Washington DC: US DoD, May 2009), p. 1-9; US OMB, Analytical Perspectives,
Budget of the United States Government Fiscal Year 2010 (Washington: GPO, May 2009), Table 26-1Budget Authority and Outlays by Function, Category, and Program.
Table A-1. Allocation of DoD Budget Authority – Total and “Surged” 1999-2010. See sourcesfor Table 2.
Table A-2. Allocation of Spending Surge Among Services and Appropriation Accounts.
National Defense Budget Estimates for FY 2010 (Washington DC: US DoD, June 2009), Table 6-19 ArmyBA by Appropriation Title FY 1948 to FY 2010; Table 6-20 Navy BA by Appropriation Title FY 1948 toFY 2010; Table 6-21 Air Force BA by Appropriation Title FY 1948 to FY 2010; Department of the Navy(DoN), Office of Budget, FY-2001, -2003, -2004, -2005, -2006, -2007, -2008, -2009 Budget Estimates
(Washington DC, March 2000, 2002, 2003, 2004, 2005, February 2006, 2007, 2008); DoN, Highlights of
the Department of the Navy FY 2002 Budget, – FY 2010 Budget (Washington DC, June 2001, June 2010);DoN, FY 2000/2001 Biennial Budget Estimates (Washington DC, March 1999); and, DoN, FY 1999
Amended Budget Estimates (Washington DC, March 1998).
Table A-3. DoD Budgeting by Service and Appropriation Accounts Divided into Four Periods
Covering 1997-2008. See sources for Table A-2.
Table A-4. Change in DoD Budgeting by Service and Appropriation Accounts 1997-2008. Seesources for Table A-2.
Table A-5. Defense-wide Agency & Program Funding 2010. US DoD, FY 2010 Budget Request
Summary Justification (Washington DC: US DoD, May 2009), “Defense Wide Agencies,” p. 1-52-1-65.

8/14/2019 Pda Briefing Report #20
http://slidepdf.com/reader/full/pda-briefing-report-20 75/77
62 AN UNDISCIPLINED DEFENSE
Table B-1. Percent US Military Overseas and in Contingency Operations
Estimates are derived principally from the quarterly and yearly DoD report, Active Duty Military
Personnel Strengths by Regional Area and by Country, produced by the Statistical Information AnalysisDivision of the Defense Manpower Data Center, US DoD: http://siadapp.dmdc.osd.mil/ For
contingency operations see: Amy Belasco, Troop Levels in the Afghan and Iraq Wars, FY2001-FY2012:Cost and Other Potential Issues (Washington DC: CRS, 2 July 2009); Richard F. Grimmett, Instances
of Use of United States Armed Forces Abroad 1798-2007 (Washington DC: CRS, 14 January 2008);Michael Waterhouse and JoAnne O’Bryant National Guard Personnel and Deployments: Fact Sheet
(Washington DC: CRS, 17 January 2008); W. Eugene Cobble, et. al., For the Record: All US Forces
Responses to Situations, 1970-2000 (with additions covering 2000-2003) (Alexandria VA: Center forStrategic Studies, Center for Naval Analysis, May 2005); and Nina M. Serafino, Peacekeeping and
Related Stability Operations: Issues of U.S. Military Involvement (Washington DC: CRS, 4 October 2004).An also useful source on the evolution of US overseas military presence is Tim Kane, Global US Troop
Deployment 1950-2003, Center for Data Analysis Report #04-11 (Washington DC: Heritage Foundation,27 October 2004).
Figures
Figure 1. DoD Budget Authority with and without contingency operations. See sources forTable 1.
Figure 2. DoD Budget Authority 1948-2019. See sources for Table 1.
Figure 3. DoD Budget Outlays 1951-2010.
For years before 2009: US DoD, National Defense Budget Estimates for FY 2010 (Washington DC: USDoD, June 2009), Table 6-11 DoD Outlays by Appropriation Title FY 1948 to FY 2010. For 2009 and2010: US OMB, Analytical Perspectives, Budget of the United States Government: Fiscal Year 2010
(Washington: GPO, May 2009), Table 26-1: Budget Authority and Outlays by Function, Category, andProgram.
Figure 4. DoD Budget Authority by Appropriation Title 1978-2010. See sources for Table 1.
Figure 5. DoD Per Person BA by Appropriation Title 1978-2010. See sources for Table 1 andalso: US DoD, National Defense Budget Estimates for FY 2010 (Washington DC: US DoD, June2009), Table 7-5 DoD Manpower – FY 1940 to FY 2010.
Figure 6. DoD Budget Authority for Modernization 1978-2010. See sources for Table 2.
Figure 7. DoD Per Person Budget Authority for Modernization 1978-2010. See sources for
Table 2 and also: US DoD, National Defense Budget Estimates for FY 2010 (Washington DC: USDoD, June 2009), Table 7-5 DoD Manpower FY 1940 to FY 2010.
Figure A-1. DoD Budget Authority by Appropriation Title 1978-2010. See sources Table 2.
Figure A-2. DoD Per Person BA by Appropriation Title 1978-2010. See sources for Table 2 andFigure A-3.

8/14/2019 Pda Briefing Report #20
http://slidepdf.com/reader/full/pda-briefing-report-20 76/77
PROJECT ON DEFENSE ALTERNATIVES 63
Figure A-3. US Military Full-Time Personnel 1978-2010. US DoD, National Defense Budget
Estimates for FY 2010 (Washington DC: US DoD, June 2009), Table 7-5 DoD Manpower FY 1940 to FY 2010.
Figure A-4. Real Change Budget Authority by Appropriation Title 1978-2010. See sources for
Table 2.
Figure A-5. Real Change Per Person Budget Authority by Appropriation Title 1978-2010. Seesources for Table A-1 and Figure A-3.
Figure A-6. Budget Authority by Category 1978-2008. National Defense Budget Estimates for
FY 2010 (Washington DC: US DoD, June 2009), Table 6-9 DoD BA by Category FY 1948 to FY 2010,p. 97.
Figure A-7. Budget Authority Per Person by Category 1978-2008. See sources for Figure A-6and Figure A-3.
Figure A-8. DoD Budget Authority for Modernization 1978-2010. See sources for Table 2.
Figure A-9. DoD Per Person Budget Authority for Modernization 1978-2010. See sources forTable 2 and Figure A-3.
Figure A-10. Trends in Military Construction 1951-2010.
US DoD, National Defense Budget Estimates for FY 2010 (Washington DC: US DoD, June 2009), Table6-8 DoD BA by Appropriation Title FY 1948 to FY 2010; OMB, Historical Tables, Budget of the US
Government, Fiscal Year 2010 (Washington DC: US Government Printing Office, 2009), Table 5.1 BudgetAuthority by Function and Subfunction 1976-2014; and, Daniel Else, et. al., Military Construction,
Veterans Affairs, and Related Agencies: FY 2009 Appropriations; –FY 2008 Appropriations (Washington
DC: CRS, February 2009, February 2008).
Figure B-1. World Military Spending Shares 1986-2006
Figure B-1 counts as US allies all NATO states plus Israel, Australia, New Zealand, Japan, Taiwan, andSouth Korea. The category of “potential adversary and competitor states” includes, for 1986: the SovietUnion and other Warsaw Treaty states, China, Cuba, Iran, Iraq, North Korea, Libya, Syria, and Vietnam.For 1994, it includes the former Soviet Union and Warsaw Treaty states are replaced by Russia andBelarus. In 2000, Vietnam is removed from this category. In 2006, Libya is also removed, but Venezuelais added.
Sources: US ACDA, World Military Expenditures and Arms Transfers 1995, 1999-2000 (Washington DC:US Government Printing Office, 1996; 2001); and, International Institute for Strategic Studies, The
Military Balance 1996/97, 1995/96, 1994/95, 1993/94, 1992/93, 2002-2003, 2008 (Oxfordshire: Routledge,2008; London: Oxford University Press, 2002, 1996-1995; London: Brassey's, 1992-1994).

8/14/2019 Pda Briefing Report #20
http://slidepdf.com/reader/full/pda-briefing-report-20 77/77