pcr validation - tums
TRANSCRIPT
PCR validation
August 2014
Willem van Leeuwen

Validation of PCR test
Primers, probes has been designed. PCR
protocol developed.
• Does the new developed assay meet all
performance criteria?
• Is the outcome clinically relevant?
VALIDATION OF THE PCR TEST

Validation of PCR test
1. First line: infra structure lab, performance and
management lab
2. Second line: design PCR for specific target(s)
3. Second line: technical validation (IQA)
4. Second line: clinical validation, concordance
test (gold standard method)
5. Third line: EQA

The PCR reference
curve
technical validation part 1

Applications of the PCR refernce curve
• Qualitative identification of the sample
• To identify the ‘analytical range’, LLOD, LOD and
LOQ of a (RT)-qPCR analysis
• To compare the curves e.g. for the optimization of
single- and multiplex (RT)-qPCR using the slope of
the curve
• TAKE CARE: quality requirements for reference
curve

PCR reference curve
– Inverse association
between Cq and initial
concentration (viral-
or bacterial load)

Q with respect to PCR reference curve
• The distance between the consecutive curves in a 10 Log
dilution series of the sample is ideally 3.3 Cq-units
• Watwhat is happening when the distance becomes 4?
• In that case, what happens with the slope? Steeper or
flatter?
• What is the ideal slope?
• What happens with the Cq value when by-products
appear using an:
– Intercalating dye?
– Probe?
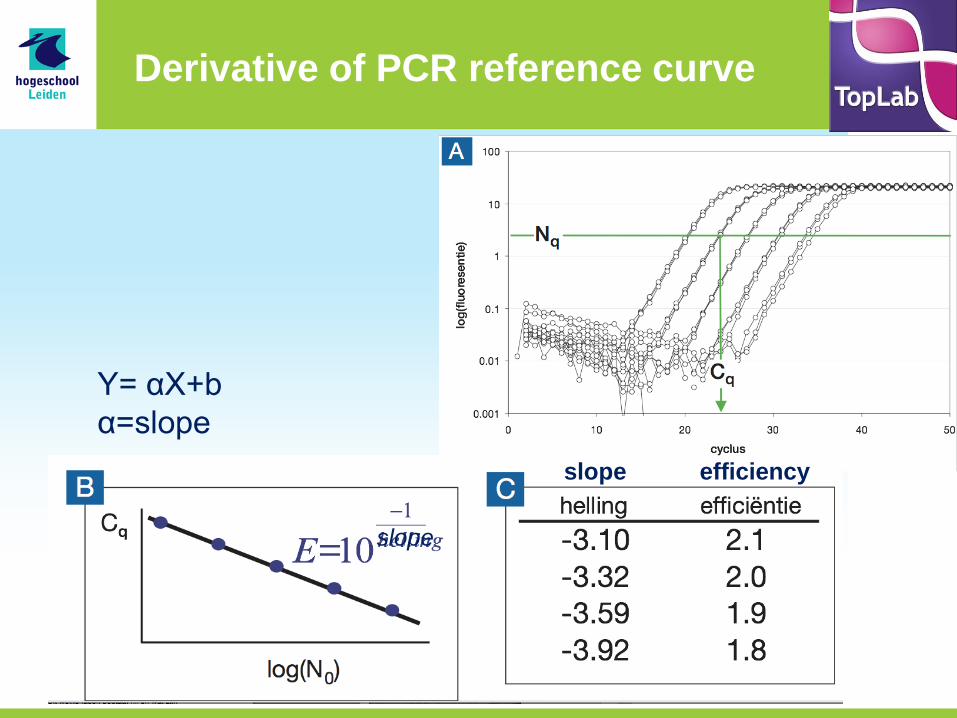
Derivative of PCR reference curve
Y= αX+b
α=slope
slope
slope efficiency

Requirements for the PCR reference curve (validation)
• Dilution series (10X): at least 5 log scales
• Datapoint: 3-5 times in separate tests (for SD calculation)
– SD max <5 % per datapoint
• Reference curve:
– Linear correlation R ≥0.985 (or R2 ≥0,95)
– Slope of linear line: -3,1 tot -3,6
– Usable area (analytical range)
• All points with SD <5%
• At least 10xSD difference with negative sample
– Run to run variation <5%
• TAKE CARE: dilution reagent (saline, water, matrix) is not always stable!
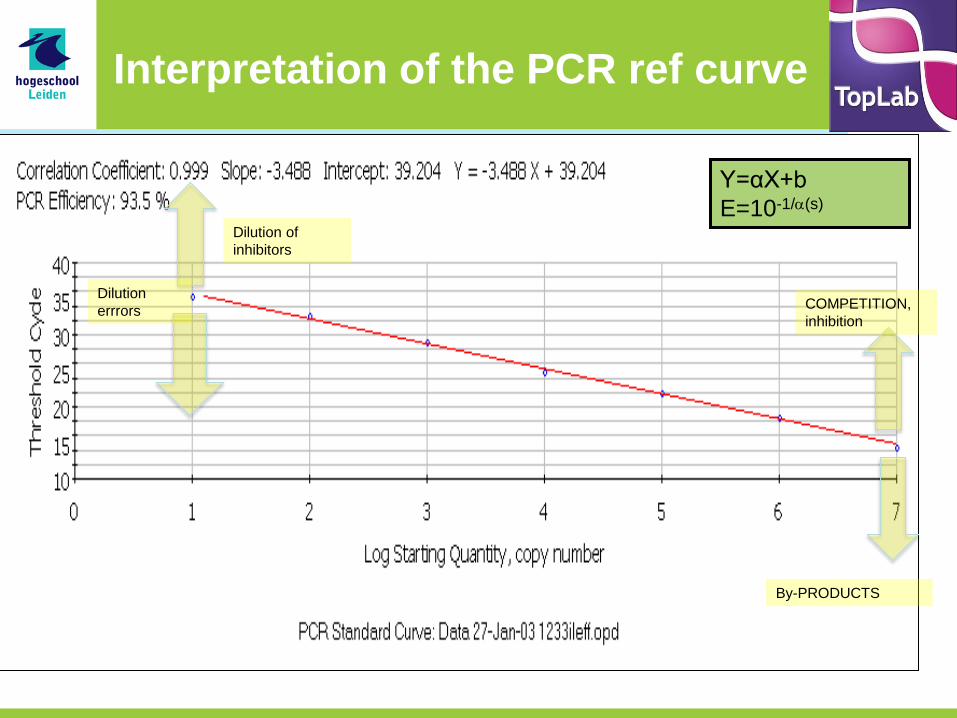
COMPETITION,
inhibition
By-PRODUCTS
Y=αX+b
E=10-1/(s)
Interpretation of the PCR ref curve
Dilution
errrors
Dilution of
inhibitors
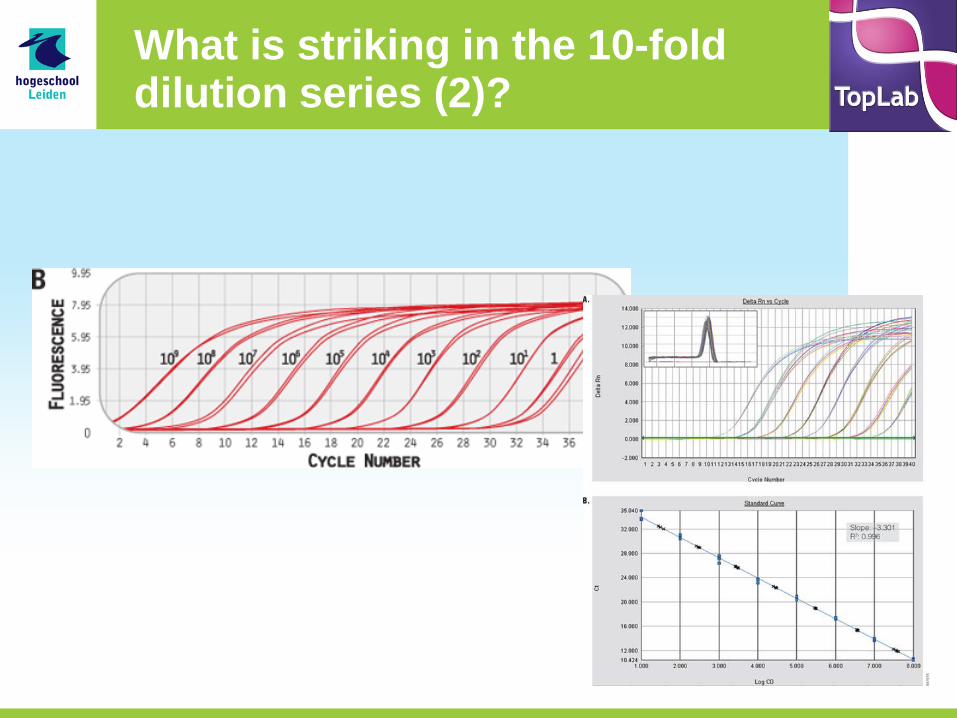
What is striking in the 10-fold dilution series (2)?

Determine the analytical range
• Using the refernce curve (used as a calibrationcurve)
– SD criterium (5%), datapoints (upper- and lower level)
and known concentrations
• Upper level:dilute sample
• Lower level: more complex, for reasons of false
negativity, probability of detection and proper cut-
off value

• Analytical range:
– Concentration area in which test results are reliable
(also useful area for quantification)
Refernce curve: ‘analytical range’
• Cq > LOD?
• Results not
reliable for
diagnostics

Optimal PCR results: same plateau, regardless the concentration
different PCR; by-
products

Which datapoints are suitable?
• Check with
melting curve
analysis!
• 105 should be
excluded! Shape
of curve is OK!
watch ΔCq
104
107 106
105
104
1

• Can you extrapolate to define ‘cut off’
(interception Y-axis)?
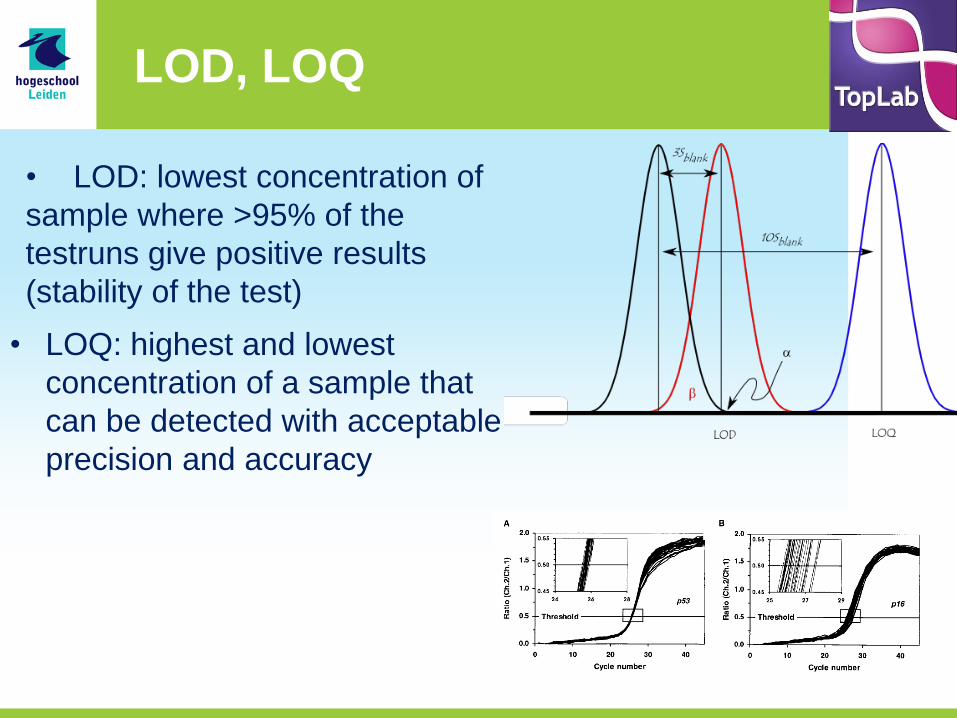
LOD, LOQ
• LOQ: highest and lowest
concentration of a sample that
can be detected with acceptable
precision and accuracy
• LOD: lowest concentration of
sample where >95% of the
testruns give positive results
(stability of the test)

Quality assurance PCR design technical validation part 2

PCR specificity on different levels
• Primer specificity
• Amplicon specificity
• Specificity method to determine
– Understanding FP; FN results
– “fit” analytical range with sample?
• Diagnostic specificity
– Differentiation between “health/disease”?

Validation: IQA
1. Start with clean target DNA (culture) in clean environment (water, buffer) – ref curve
2. Start with known POS/NEG samples, select strong pos, weak but consistent pos and negative samples + NTC (develop IC)
• Proper results with standards and controls
3. Same in matrix (check again analytical range)

Technical validation: quality criteria
• sensitivity
• Analytical sensitivity/specificity
– using ref curve
• Accurate
– Correctness and precision
• Reproducibility

Quality criteria Accuracy; balansce between correctness and precision
• Amplicon – correct:
• Length • sequence
– incorrect: • Mispriming • FN
– Not precise:
• Accidental and systematic mistakes
• [Assessment runs]
22

Quality criteria: precision, difference between PCRs
23
• Two targets
• correctness same
• Precision differs
• Important in reaction control and monitoring

quality criteria: reproducibility
• Int quality controles – Run to run (reproducibility)
– Certification of reagents • parallel assays
• Helps with identification issues
– loss of quality in current batch
– Deviations in new batch
• Use for Taq DNApol, primers, probes, controls, standards
• Monitoring of controls (plot)

Validation of a new test; concordance
• determine:
– Accuracy
• Control samples; known pos/neg samples
– Method to calculate specificity/sensitivity
– Diagnostic specificity/sensitivity
• Influence of FP/FN on convenience of test
• Define a reference method (objective/indepent)
– Culture, microscopy, ELISA
– Ref methods is existing diagnostics: gold standard
• Determine FN; FP

Concordance test (= association between tests)
• observed concordance – test A
• PCR
• conventional
• Single plex
– test B • Real Time
• multiplex
methode A
methode B POS NEG
POS a b
NEG c d
a + d Observed = Obs = ------------
concordance a + b + c + d

Concordance test; using known POS/NEG samples
• 100%
– c and b zero
• <100%
– Different results
– method B new
• more POS (b): test better; precision
• more POS (c) test worse; preciesion
methode A
methode B POS NEG
POS a b
NEG c d
a + d Observed = Obs = ------------
concordance a + b + c + d

Clinical samples: Concordance test (C3)
HAQUE Am. J. Trop. Med. Hyg., 76, 2007,713
E. histolytica
ELISA versus
single/multiplex
PCR
Analytical sensitivity
Cq

Endphase implementation test
• make a SOP
• define
– 1e, 2e, line controls (IQA)
– Planning 3e line controls (EQA)
• Monitor controls

Surveillance of PCR quality; diagnostic validation validation part 3

Kwaliteitsborging; 3 niveau’s
• Lab organisation/-management
• Technical PCR test
• Special requirements test for clinics
– Healthy and disease correctly classified with test
• disease: test POS
• healthy: test NEG

Specificity of PCR; in diagnostics
• Clinician: – yes/no answer
• Differential diagnose – yes/no not “sharp” defined
– Additional info is needed (other tests; clinical anamnesis)
– Important: risk on……. / probability

Specificity of PCR; in diagnostics
• Dynamic discrimination of populations
Populations separated by threshold (T); yes/no answer 100% certain
Populations overlap FP/FN arises
at threshold
Conclusion: there will be false
diagnoses

Specificity of PCR; in diagnostics
• False negativity not acceptable – Risk for FN too high always treatment
• Fals positivity not acceptable – Invasive treatment as result of diagnose
• Patient not ill therapy unacceptable
• T-lijn shifts to the right on X-axis
• Only “true positive” fals within the criterion
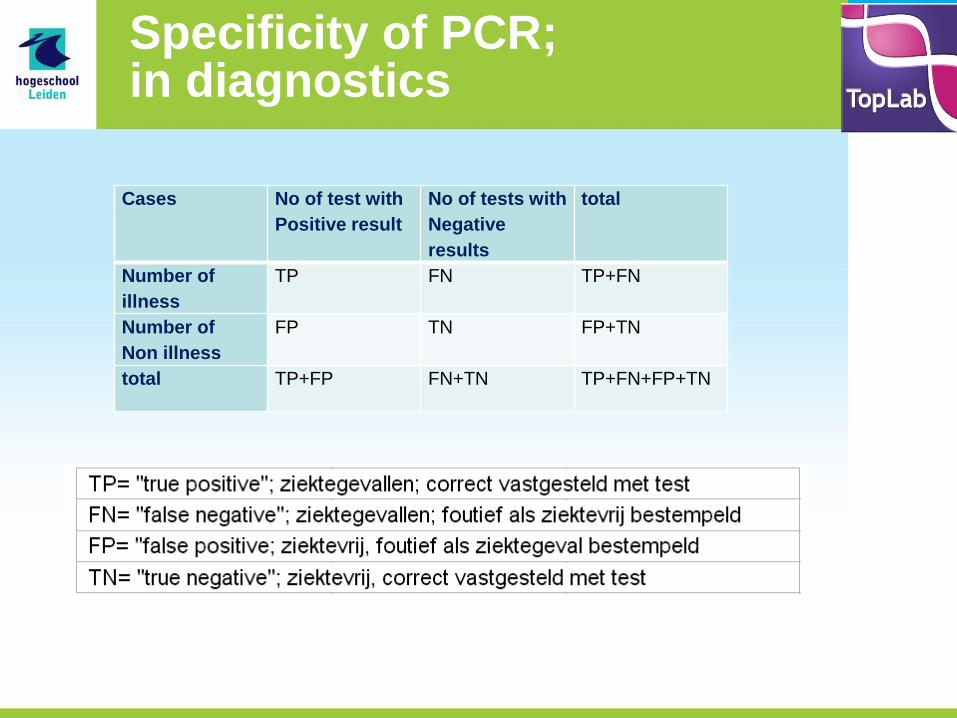
Specificity of PCR; in diagnostics
Cases No of test with
Positive result
No of tests with
Negative
results
total
Number of
illness
TP FN TP+FN
Number of
Non illness
FP TN FP+TN
total TP+FP FN+TN TP+FN+FP+TN

Diagnostic sensitivity and - specificity
• Percentage diagnostic sensitivity – Level in which all “ill people” can be
addressed correctly by the test
TP/(TP +FN)X100
• Percentage diagnostic specificity – Level in which all “helathy people” can be
addressed correctly by the test
TN/(TN+FP)X100