pavement management simplified - city of …€¦ · · 2015-10-22pavement management project 616...
TRANSCRIPT

FINAL PROJECT REPORT
PAVEMENT MANAGEMENT PROJECT
616 HEBRON ROAD, SUITE F | HEATH, OH 43056 | 800.638.8040 | [email protected]
City of Zanesville OH
October 15, 2015
PAVEMENT MANAGEMENT SIMPLIFIED

616 HEBRON RD, SUITE F • HEATH, OH 43056 • 800.638.8040 • [email protected]
EXECUTIVE SUMMARY JG3 CONSULTING, LLC (JG3) was contracted by the City of Zanesville to provide a pavement management assessment and condition rating to implement using the PAVERTM system platform.
The scope of the project was as follows:
Define the roadway network inventory
Identify representative sample locations for inspection
Identify all distress types, severity levels and quantities within each sample through ASTM D6433-11
Provide a digital photo of each sample location
Calculate the PCI for each pavement section
Provide a complete inventory and condition listing of each pavement section
Link all pavement management data to GIS base map
Provide a final report of findings
Provide continued support services
PAVEMENT NETWORK SUMMARY
133 Centerline miles
306 Lane miles
19,410,817 Square feet
1,538 Management sections
CURRENT CONDITION SUMMARY
After updating the pavement management database with the most recent work history and ASTM D6433 inspections, the current average PCI for the City of Zanesville roadway pavement network is a 58. This classifies the roadway pavement network as being in “Fair” overall condition.
PURPOSE The City of Zanesville will use the PAVERTM Pavement Management Software (PMS) to aid in cost-effective
decisions related to the roadway network, maximizing the return on investment from available maintenance and rehabilitation funds; generating a prioritized plan; and identifying specific areas in need of maintenance and rehabilitation. The services of JG3 help the City of Zanesville to realize goals through pavement management consulting as well as an accurate and objective ASTM D6433 inspection for all management sections within the roadway network. This report will identify the project scope, define the Pavement Condition Index (PCI), outline the ASTM D6433 inspection process followed and provide detailed condition analysis about the roadway pavement network.

CITY OF ZANESVILLE – 2015 PAVEMENT MANAGEMENT FINAL REPORT
2
TABLE OF CONTENTS
EXECUTIVE SUMMARY ..................................................................................................................................................... 1
PAVEMENT NETWORK SUMMARY ................................................................................................................................ 1
CURRENT CONDITION SUMMARY ................................................................................................................................. 1
PURPOSE ......................................................................................................................................................................... 1
INTRODUCTION ............................................................................................................................................................... 3
ASTM INSPECTION PROCESS ............................................................................................................................................ 3
SAMPLE DEFINITION .................................................................................................................................................... 3
DISTRESS DEFINITION ................................................................................................................................................... 3
PCI AND CONDITION CATEGORY DEFINITION................................................................................................................ 4
NETWORK CONDITION RESULTS ....................................................................................................................................... 5
NETWORK CONDITION MAP............................................................................................................................................. 7
AREA CONDITION COMPARISON ...................................................................................................................................... 8
DIGITAL IMAGES .............................................................................................................................................................. 8
DIGITAL IMAGES – EXCELLENT CONDITION CATEGORY ................................................................................................. 9
DIGITAL IMAGES – VERY GOOD CONDITION CATEGORY...............................................................................................10
DIGITAL IMAGES – GOOD CONDITION CATEGORY .......................................................................................................11
DIGITAL IMAGES – FAIR CONDITION CATEGORY ..........................................................................................................12
DIGITAL IMAGES – POOR CONDITION CATEGORY ........................................................................................................13
DIGITAL IMAGES – VERY POOR CONDITION CATEGORY ...............................................................................................14
DIGITAL IMAGES – FAILED CONDITION CATEGORY ......................................................................................................15
CONCLUSION ..................................................................................................................................................................16

CITY OF ZANESVILLE – 2015 PAVEMENT MANAGEMENT FINAL REPORT
3
INTRODUCTION JG3 was contracted by the City of Zanesville to provide continuing pavement management services for their 133
centerline mile (306 lane mile) roadway network. Through these services a field inventory review and inspection
was performed on all 1,538 management sections within the network. All inventory changes were updated
within their current PMS database and an updated PCI was calculated for each section. Digital images were
taken at each sample location to provide visual documentation and record of the inspection. This report
provides a thorough definition of the inspection process performed as well as the condition results of our
project.
ASTM INSPECTION PROCESS The PAVERTM PMS defines the pavement network in terms of “Branches” and “Sections”. The City of Zanesville Roadways Network consists of all maintained roadways within the agency, each roadway broken down into management sections on a block by block basis. Within each management section, the total number of possible sample locations is first determined, and then approximately 10% of these samples are inspected following ASTM D6433. The trained inspector exits the vehicle, walks the sample area and identifies all distress information for that sample. The information is then recorded into the PAVERTM database for Pavement Condition Index (PCI) calculation. The final result is a PCI score for each management section.
SAMPLE DEFINITION
Following ASTM D6433-11 a sample unit size must be between 1,000 and 3,500 sf for proper PCI calculation. To maintain consistent procedure, each sample size was determined to be 100’ long x the width of the pavement section. In the event that the section width was over 35’ wide, the sample size was half the width x 100’. In the event that the section area was less than 1,000 sf in area size, the entire section was sampled.
DISTRESS DEFINITION There are 20 possible distress types that can occur within asphalt based surfaces and 19 possible distress
types that can occur within a concrete surface. The U.S. Army Corps of Engineers publishes the Asphalt
and Concrete Surfaced Roads and Parking Lots Inspection Manuals. These manuals provide a description
of each distress type, the criteria to determine each severity level (low, medium, high) and how to
measure each. The asphalt distress types are outlined in Figure 1. And the concrete distress types are
outlined in Figure 2.
Figure 1. Asphalt Distresses
16 – Shoving
17 – Slippage Cracking
18 – Swell
19 – Raveling
20 – Weathering
11 – Patch/Utility Cut
12 – Polished Aggregate
13 – Pothole
14 – Railroad Crossing
15 – Rutting
06 – Depression
07 – Edge Cracking
08 – Joint Reflection
09 – Lane/Shoulder Drop
10 – L&T Cracking
01 – Alligator Cracking
02 – Bleeding
03 – Block Cracking
04 – Bumps and Sags
05 - Corrugation

CITY OF ZANESVILLE – 2015 PAVEMENT MANAGEMENT FINAL REPORT
4
Figure 2. Concrete Distresses
PCI AND CONDITION CATEGORY DEFINITION
The PCI is on a scale of 0 – 100 with 0 being the worst and 100 being the best. It is calculated by PAVERTM through the input of distress type, severity and quantity information. Figure 3 illustrates the factors that go into the PCI as well as the seven (7) condition categories of the PCI.
Figure. 3 Factors Determining PCI Value
To further simplify the condition assessment of each pavement section, seven (7) condition categories were developed criteria is listed in table 1.
CONDITION CATEGORY LOW PCI VALUE HIGH PCI VALUE
Excellent 92 100
Very Good 82 91
Good 68 81
Fair 50 67
Poor 35 49
Very Poor 20 34
Failed 0 19
Table 1. Condition Category Values
36 – Scaling
37 – Shrink Cracking
38 – Corner Spall
39 – Joint Spall
31 – Polished Aggregate
32 – Popouts
33 – Pumping
34 – Punchout
35 – Railroad Crossing
26 – Joint Seal Damage
27 – Lane/Shoulder Drop
28 – Linear Cracking
29 – Large Patch
30 – Small Patch
21 – Blow Up
22 – Corner Break
23 – Divided Slab
24 – Durability Crack
25 - Faulting

CITY OF ZANESVILLE – 2015 PAVEMENT MANAGEMENT FINAL REPORT
5
NETWORK CONDITION RESULTS After completion of the 2015 pavement management project, JG3 has determined that the average PCI for the City of Zanesville’s 133 centerline mile (306 lane mile) Roadway Network was a 58 and considered to be in Fair condition. Figures 4, 5, 6 and 7 further illustrate the condition breakdown.
Figure 4. Number of Sections by Condition
Figure 5. Pavement Area by Condition
75
162
295
534
223
101
148
0
100
200
300
400
500
600
FAILED VERY POOR POOR FAIR GOOD VERY GOOD EXCELLENT
SEC
TIO
NS
CONDITION CATEGORY
SECTIONS BY CONDITION
530,271.
1,498,565.
3,728,707.
7,347,620.
2,912,396.
1,367,519.
2,025,739.
0.
1,000,000.
2,000,000.
3,000,000.
4,000,000.
5,000,000.
6,000,000.
7,000,000.
8,000,000.
FAILED VERY POOR POOR FAIR GOOD VERY GOOD EXCELLENT
AR
EA (
SQ F
T)
CONDITION CATEGORY
PAVEMENT AREA BY CONDITION

CITY OF ZANESVILLE – 2015 PAVEMENT MANAGEMENT FINAL REPORT
6
Figure 6. Lane Miles by Condition
Figure 7. Percent Area by Condition
8
24
59
116
46
22
32
0
20
40
60
80
100
120
140
FAILED VERY POOR POOR FAIR GOOD VERY GOOD EXCELLENT
LAN
E M
ILES
CONDITION CATEGORY
LANE MILES BY CONDITION
3
8
19
37
15
7
11
0
5
10
15
20
25
30
35
40
FAILED VERY POOR POOR FAIR GOOD VERY GOOD EXCELLENT
PER
CEN
T A
REA
CONDITION CATEGORY
PERCENT AREA BY CONDITION
CITY OF ZANESVILLE – 2015 PAVEMENT MANAGEMENT FINAL REPORT
7
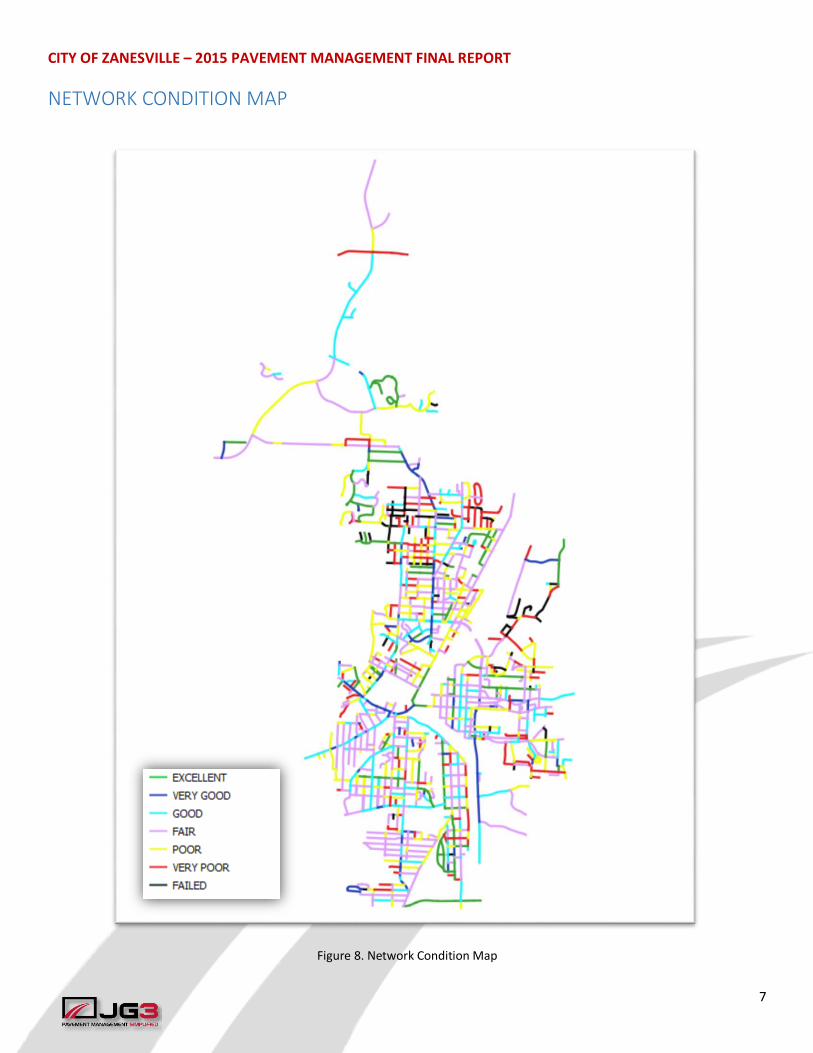
NETWORK CONDITION MAP
Figure 8. Network Condition Map
CITY OF ZANESVILLE – 2015 PAVEMENT MANAGEMENT FINAL REPORT
8
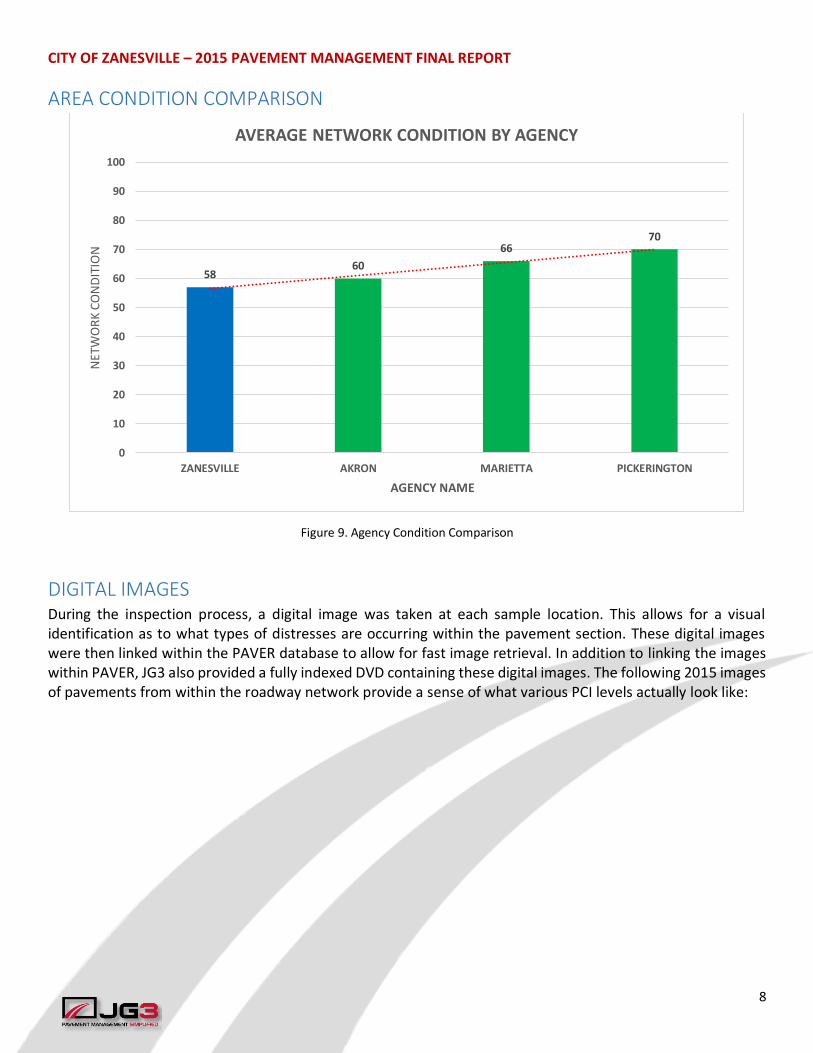
AREA CONDITION COMPARISON
Figure 9. Agency Condition Comparison
DIGITAL IMAGES During the inspection process, a digital image was taken at each sample location. This allows for a visual identification as to what types of distresses are occurring within the pavement section. These digital images were then linked within the PAVER database to allow for fast image retrieval. In addition to linking the images within PAVER, JG3 also provided a fully indexed DVD containing these digital images. The following 2015 images of pavements from within the roadway network provide a sense of what various PCI levels actually look like:
5860
6670
0
10
20
30
40
50
60
70
80
90
100
ZANESVILLE AKRON MARIETTA PICKERINGTON
NET
WO
RK
CO
ND
ITIO
N
AGENCY NAME
AVERAGE NETWORK CONDITION BY AGENCY

CITY OF ZANESVILLE – 2015 PAVEMENT MANAGEMENT FINAL REPORT
9
DIGITAL IMAGES – EXCELLENT CONDITION CATEGORY
LICKING RD | SECTION 03 | SAMPLE .1MI | PCI 100

CITY OF ZANESVILLE – 2015 PAVEMENT MANAGEMENT FINAL REPORT
10
DIGITAL IMAGES – VERY GOOD CONDITION CATEGORY
W MAIN ST | SECTION 03 | SAMPLE 1614 | PCI 86

CITY OF ZANESVILLE – 2015 PAVEMENT MANAGEMENT FINAL REPORT
11
DIGITAL IMAGES – GOOD CONDITION CATEGORY
DRYDEN RD | SECTION 10 | SAMPLE AYERS | PCI 76

CITY OF ZANESVILLE – 2015 PAVEMENT MANAGEMENT FINAL REPORT
12
DIGITAL IMAGES – FAIR CONDITION CATEGORY
HAMLINE AVE | SECTION 02 | SAMPLE 302 | PCI 63

CITY OF ZANESVILLE – 2015 PAVEMENT MANAGEMENT FINAL REPORT
13
DIGITAL IMAGES – POOR CONDITION CATEGORY
VIRGINIA ST | SECTION 02 | SAMPLE ALLEY | PCI 50

CITY OF ZANESVILLE – 2015 PAVEMENT MANAGEMENT FINAL REPORT
14
DIGITAL IMAGES – VERY POOR CONDITION CATEGORY
CHESTER ST | SECTION 01 | SAMPLE 923 | PCI 28

CITY OF ZANESVILLE – 2015 PAVEMENT MANAGEMENT FINAL REPORT
15
DIGITAL IMAGES – FAILED CONDITION CATEGORY
FRANCIS ST | SECTION 06 | PARK | PCI 4

CITY OF ZANESVILLE – 2015 PAVEMENT MANAGEMENT FINAL REPORT
16
CONCLUSION The PCI study provides for a PCI rating on each pavement section within the maintained roadway network. Based upon the distresses identified within each representative sample location inspected, a PCI number is assigned to each pavement section. This number is on a scale of 0 – 100 with 0 being the worst and 100 being the best.
The City of Zanesville’s Roadway Network is approximately 133 centerline miles (306 lane miles) in size. Through the ASTM D6433-11 PCI study, JG3 has determined the Roadway Network to have an average PCI of 58 and is considered to be in “Fair” condition. In comparison to other PAVERTM users and JG3 clients within the region, the City of Zanesville’s Roadway Network is considered to be below average.
JG3 would again like to thank you for the opportunity to provide the City of Zanesville with this PCI study and our pavement management services. Our goal is to provide the highest level of services and support, providing our clients with the data, tools and expertise necessary to be successful in their goals of pavement management. Should you require any additional information or support regarding this PCI study or the PAVERTM PMS, please do not hesitate to ask.
JAMES GOLDEN III President/CEO
P: (740) 507-3842 E: [email protected]