paul s. pregosin nmr in organometallic chemistry€¦ · just as in organic chemistry or...
TRANSCRIPT

NMR in Organometallic Chemistry
Paul S. Pregosin


Paul S. Pregosin
NMR in Organometallic Chemistry

Related Titles
Steinborn, Dirk
Fundamentals ofOrganometallic Catalysis
2011
Hardcover
ISBN: 978-3-527-32716-4
Softcover
ISBN: 978-3-527-32717-1
Friebolin, H.
Basic One- andTwo-Dimensional NMRSpectroscopy5th, completely revised and enlargededition
2010
Softcover
ISBN: 978-3-527-32782-9
Berger, S., Sicker, D.
Classics in SpectroscopyIsolation and Structure Elucidation ofNatural Products
2009
Softcover
ISBN: 978-3-527-32516-0
Hardcover
ISBN: 978-3-527-32617-4

Paul S. Pregosin
NMR in Organometallic Chemistry
The Author
Prof. Dr. Paul S. PregosinETHZ HCI HonggerbergLab. fur Anorganische ChemieHonggerberg HCI/G1398093 ZurichSwitzerland
All books published by Wiley-VCH arecarefully produced. Nevertheless, authors,editors, and publisher do not warrant theinformation contained in these books,including this book, to be free of errors.Readers are advised to keep in mind thatstatements, data, illustrations, proceduraldetails or other items may inadvertently beinaccurate.
Library of Congress Card No.: applied for
British Library Cataloguing-in-PublicationDataA catalogue record for this book is availablefrom the British Library.
Bibliographic information published by theDeutsche NationalbibliothekThe Deutsche Nationalbibliotheklists this publication in the DeutscheNationalbibliografie; detailed bibliographicdata are available on the Internet at<http://dnb.d-nb.de>.
2012 Wiley-VCH Verlag & Co. KGaA,Boschstr. 12, 69469 Weinheim, Germany
All rights reserved (including those oftranslation into other languages). No partof this book may be reproduced in anyform – by photoprinting, microfilm, or anyother means – nor transmitted or translatedinto a machine language without writtenpermission from the publishers. Registerednames, trademarks, etc. used in this book,even when not specifically marked as such,are not to be considered unprotected by law.
Cover Design Formgeber, EppelheimTypesetting Laserwords Private Limited,Chennai, IndiaPrinting and Binding
Printed inPrinted on acid-free paper
Print ISBN: 978-3-527-33013-3

V
This book is dedicated, first and foremost, to my wife Carole-Joyce, without whosesupport and understanding, it would never have appeared and also to the memory ofProf. L. M. Venanzi.

VII
Contents
Preface XIAbbreviations XIII
1 Introduction 1
References 5
2 Routine Measuring and Relaxation 7
2.1 Getting Started 7
2.2 Relaxation 9
2.2.1 Dipole–Dipole Relaxation 12
2.2.2 Chemical Shift Anisotropy 15
2.2.3 Passing Comments 16
2.2.4 Useful Tips 16
References 17
3 COSY and HMQC 2-D Sequences 19
3.1 Tactics 19
3.2 COSY 20
3.3 HMQC and HMBC 21
3.3.1 Methods 21
3.3.2 One-Bond 2-D 13C,1H Correlations 22
3.3.3 One-Bond 2-D 15N,1H Correlations 25
3.3.4 Two and Three Long-Range Bond 13C,1H Correlations 26
3.3.5 X,1H Correlations 31
References 36
4 Overhauser Effects and 2-D NOESY 39
4.1 Background 39
4.2 Assigning Signals via NOEs and General Applications 40
4.3 X,1H Overhauser Effects 41
4.4 2-D NOESY 43
4.5 HOESY 50
VIII Contents
4.6 Metal Complexes and NOEs. ROESY vs NOESY 51References 54
5 Diffusion Constants via NMR Measurements 55References 60
6 Chemical Shifts 636.1 1H NMR 646.1.1 Anisotropic Effects 646.1.2 Hydrides 676.1.3 Molecular H2 and η2-X-H–M Complexes with X = C, Si, and H 726.1.4 σ -Bound Alkyl Groups 736.1.5 η2, η4-Olefin, and η6-Arene Proton Chemical Shifts 746.1.6 Allyl and Cp Anions 796.1.7 Carbene Ligands 836.2 Introduction to Heavy Atom NMR 846.3 13C 876.3.1 σ -Bound Alkyl, Aryl, and Alkynyl Complexes 896.3.2 π-Bound Olefin Complexes 996.3.3 Acetylene Complexes 1096.3.4 Allyl and Cp Complexes 1116.3.5 Carbonyl Complexes 1196.3.6 Carbenes, Carbynes, and Related Complexes 1256.3.7 N-Heterocyclic Carbenes (NHCs) 1306.4 15N NMR 1346.5 19F NMR 1466.6 31P NMR 1556.7 Transition Metals 179
References 196Further Reading 206
7 Coupling Constants 2077.1 Background 2077.2 One-Bond Interactions 2087.3 A Short 19F Excursion 2167.4 Applications Involving 1J 2197.5 1J(H,D) and Molecular Hydrogen Complexes 2207.6 1J(C,H) in η2-C-H· · ·M Complexes: Agostic Interactions 2227.7 Remote Agostic Bonds 2267.8 1J(Si,H) in η2-Si-H· · ·M Complexes 2267.9 Trans Influence and 1J 2307.10 Two- and Three-Bond J-Values 2387.10.1 Routine 1H Coupling Constants 2427.10.2 Two and Three-Bond 31P Coupling Constants with 1H 2467.10.3 An Excursion Involving 31P and 13C J-Values 249

Contents IX
7.10.4 Second-Order Effects in 13C Spectra of Bisphosphine Complexes 2517.10.5 The Geometric Dependence of 2J(L1-M-L2) 2547.10.6 2J(31P-M-1H) 2557.10.7 2J(X,1H) 2567.10.8 2J(31P,31P) 2587.10.9 2J(31P,13C) 2647.10.10 2J(31P,19F) 2667.10.10.1 2J(31P,X) 267
References 273Further Reading 277
8 Dynamics 2798.1 Variable Temperature 2808.2 Line Shape Analysis 2848.3 Magnetization Transfer 2918.4 Two-Dimensional NMR and Chemical Exchange 296
References 308
9 Preface to the Problems 311
10 Organometallic Introduction 31310.1 Oxidative Addition 31310.2 Migratory Insertion (or Intramolecular Nucleophilic Attack) 31410.3 External Nucleophilic Attack 31410.4 Beta-Hydrogen Elimination 31510.5 Reductive Elimination 31510.6 Synthesis of Transition Metal–Hydride Complexes 31610.7 Synthesis of Transition Metal Alkyl Complexes 31610.8 Synthesis of Transition Metal Carbonyl Complexes 31710.9 Synthesis of Transition Metal Olefin Complexes 31710.10 Synthesis of Transition Metal Carbene Complexes 318
11 NMR Problems 31911.1 Three Sample Problems 31911.2 NMR Problems 323
12 Solutions to the Problems and Comments 361
Index 389


XI
Preface
Multinuclear NMR spectroscopy is without doubt a major contributor to eluci-dating molecular structure in solution. Coordination and organometallic chemistsroutinely measure hundreds (if not thousands) of NMR spectra every day. Nev-ertheless, there are very few books devoted to the NMR characteristics of thesemetal complexes. Further, although many of the NMR details connected with thesemeasurements are closely related to those associated with the 1H and 13C charac-teristics of organic or biological molecules, there are some important and uniquedifferences arising due to complexation of an organic molecule to a transitionmetal.
In this text, designed for PhD and postdoctoral chemistry students, I discussmany (but certainly not all) of the multinuclear NMR parameters that are mostrelevant for transition metal organometallic chemists. There will be a strongemphasis on routine measurements, that is, 1H and 13C NMR, but there are anumber of readily measurable spin = 1/2 nuclei such as 15N, 19F or 31P, that affordstructurally valuable chemical shifts, plus diagnostic spin-spin coupling constants.Measurements on these nuclei are important since coordination chemists needto understand the immediate environment of the metal center, and 1H and 13CNMR alone may not be sufficient, as these probes can be somewhat remote fromthe metal. Frequently, 31P and/or other spin I = 1/2 nuclei such as 29Si, 103Rh,117,119Sn or 195Pt will prove to be a better choice. Some of the model transition metalcompounds chosen for the chemical shift and coupling constant discussion willoften be either directly involved with, or related to, some aspect of homogeneousand enantioselective catalysis. There will be an emphasis on metal phosphine andcarbene complexes as these are fairly important ligands in this area.
Somewhere in an old cookbook I remember reading ‘‘the first thing one needsto do in order to make rabbit stew is to catch the rabbit’’. First one needs to obtainthe various spectra so that these NMR techniques make up the first part of thebook. Although many young researchers measure NMR spectra, it is importantto think not only about ‘‘routine measuring’’ but also a bit about how one mightimprove the quality of the spectra obtained. In my experience, we are a littlespoiled, in that modern NMR spectrometers often deliver good quality spectrawithout much effort on the part of the user. Of course once the spectrum ispresent, there is the question of assignment. Since it may prove necessary to assign
XII Preface
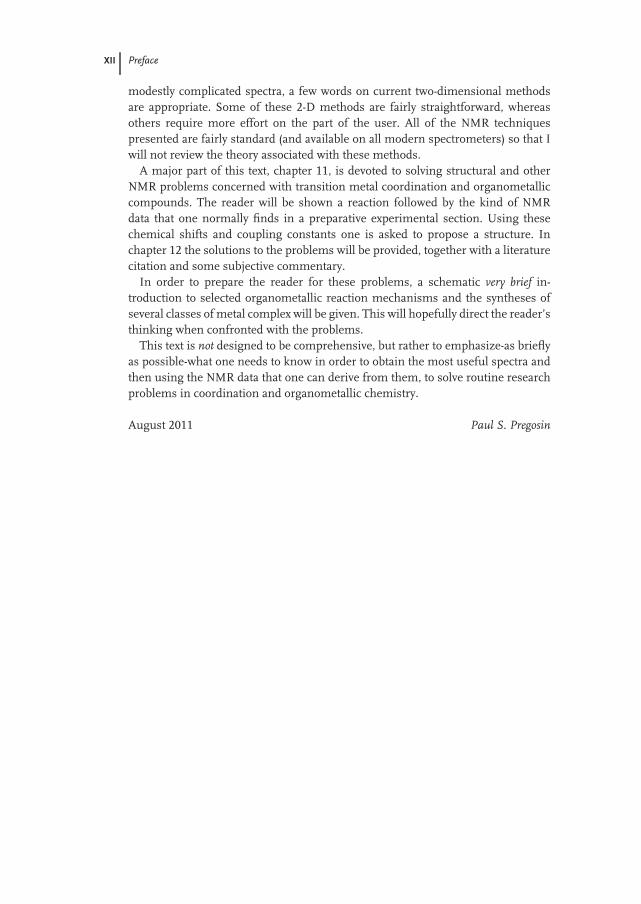
modestly complicated spectra, a few words on current two-dimensional methodsare appropriate. Some of these 2-D methods are fairly straightforward, whereasothers require more effort on the part of the user. All of the NMR techniquespresented are fairly standard (and available on all modern spectrometers) so that Iwill not review the theory associated with these methods.
A major part of this text, chapter 11, is devoted to solving structural and otherNMR problems concerned with transition metal coordination and organometalliccompounds. The reader will be shown a reaction followed by the kind of NMRdata that one normally finds in a preparative experimental section. Using thesechemical shifts and coupling constants one is asked to propose a structure. Inchapter 12 the solutions to the problems will be provided, together with a literaturecitation and some subjective commentary.
In order to prepare the reader for these problems, a schematic very brief in-troduction to selected organometallic reaction mechanisms and the syntheses ofseveral classes of metal complex will be given. This will hopefully direct the reader’sthinking when confronted with the problems.
This text is not designed to be comprehensive, but rather to emphasize-as brieflyas possible-what one needs to know in order to obtain the most useful spectra andthen using the NMR data that one can derive from them, to solve routine researchproblems in coordination and organometallic chemistry.
August 2011 Paul S. Pregosin

XIII
Abbreviations
Me methylEt ethyli-Pr (or Pri) iso-propylt-Bu (or But) tert-butylCy cyclohexylp-Tol para-methyl phenylMes 2,4,6-trimethyl phenylTriflate CF3SO3
− anionOAc acetate anionacac acetyl acetonate anionDFT density functional theoryDMSO dimethyl sulfoxideDMF dimethyl formamide
F3C
F3C
B−
4N
Ph = C6H5 py = pyridine BArF−
R
η5-Cp η5-Cp* η6-arene

XIV Abbreviations
1,5-COD NBD
PPh2Ph2P
(CH2) (H2C)
Ph2P PPh2
(CH2) (H2C)
Ph2P PPh2
(CH2)
(CH2)
dppm dppe = diphos dppp
MeO
PPh2
PPh2
MeOPPh2
PPh2
An enantiomer of Binap An enantiomer of MeO-Biphep
1
1Introduction
Just as in organic chemistry or biochemistry, it is now routine to measure 1H,13C, and, often, 31P NMR spectra of diamagnetic organometallic and coordinationcompounds. Many NMR spectra are measured simply to see if a reaction has takenplace as this approach can take sometimes take <5 min. Having determined thatsomething has happened, the most common reasons for continuing to measureare usually associated with
1) Confirmation that a reaction has taken place and, by simply counting thesignals, deciding how to proceed
2) The recognition of new and/or novel structural features via marked changes inchemical shifts and/or J-values, and
3) The need for a unique probe with sufficient ‘‘structural resolution’’ to followthe kinetics or the development of a reaction.
When a P atom is present, proton-decoupled 31P NMR often represents one ofthe simplest analytical tools available as the spectra can be obtained quickly and donot normally contain many lines.
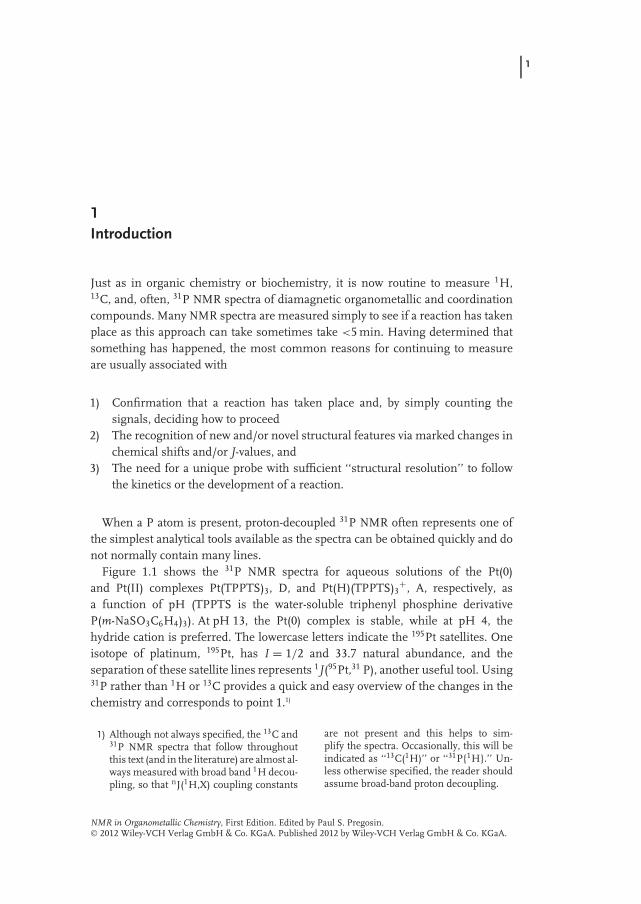
Figure 1.1 shows the 31P NMR spectra for aqueous solutions of the Pt(0)and Pt(II) complexes Pt(TPPTS)3, D, and Pt(H)(TPPTS)3
+, A, respectively, asa function of pH (TPPTS is the water-soluble triphenyl phosphine derivativeP(m-NaSO3C6H4)3). At pH 13, the Pt(0) complex is stable, while at pH 4, thehydride cation is preferred. The lowercase letters indicate the 195Pt satellites. Oneisotope of platinum, 195Pt, has I = 1/2 and 33.7 natural abundance, and theseparation of these satellite lines represents 1J(95Pt,31 P), another useful tool. Using31P rather than 1H or 13C provides a quick and easy overview of the changes in thechemistry and corresponds to point 1.1)
1) Although not always specified, the 13C and31P NMR spectra that follow throughoutthis text (and in the literature) are almost al-ways measured with broad band 1H decou-pling, so that nJ(1H,X) coupling constants
are not present and this helps to sim-plify the spectra. Occasionally, this will beindicated as ‘‘13C(1H)’’ or ‘‘31P{1H}.’’ Un-less otherwise specified, the reader shouldassume broad-band proton decoupling.
NMR in Organometallic Chemistry, First Edition. Edited by Paul S. Pregosin. 2012 Wiley-VCH Verlag GmbH & Co. KGaA. Published 2012 by Wiley-VCH Verlag GmbH & Co. KGaA.

2 1 Introduction
LL
LPt
Pt
D
D
L
L
c
L
L L
HA
B A
L
L
c
cc
D
(a)
(b)
d d
C
D
OTPPTS
OTPPTS
Pt PtOH
OH
+
A
a, bB
ba
60 50 40 30 20ppm
10 0
Figure 1.1 31P NMR spectra recorded on the same solu-tion after 10 cycles between pH 4 and 13: (a) recorded atpH 13, showing the Pt(0) complex, D, Pt(TPPTS)3, and (b)recorded at pH 4, showing Pt(H)(TPPTS)3 cation, A. Tracesof the hydroxide-bridged dinuclear complex, C, as well as thephosphine oxide, OTPPTS, are marked [1].
Apart from recognizing the number of different chemical environments, manytimes the important clue(s) with respect to the nature/and or source of the reactionproducts stem from specific chemical shifts.
RuPPh2
OTf
PPh2OHRuP
Ph2 OP
OC
CH3
Ph2heat
1.1 1.2,
Ru(OAc)2(Binap)
+ 2CF3SO3H
(OTf)2 (OTf)
OTf = CF3SO3
Reaction of Ru(OAc)2(Binap) with 2 equivalents of the strong acid CF3SO3H affordsthe product 1.2 in high yield. Superficially, complex 1.2 appears to arise as a resultof the addition of H2O across a Binap P-C bond. But what is the water source? The

1 Introduction 3
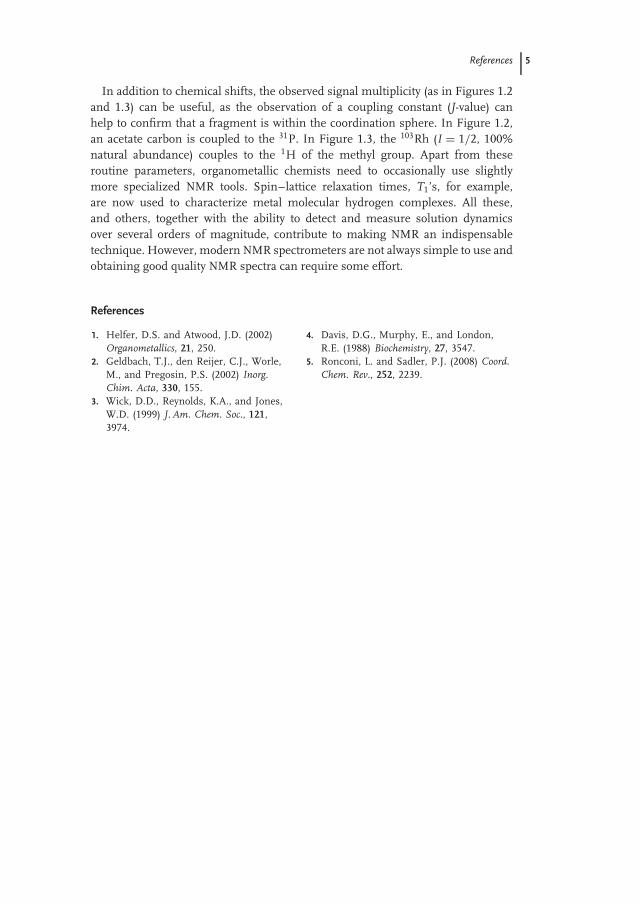
13C spectrum of the reaction solution, see Figure 1.2, reveals that acetic anhydrideis produced (and thus water) from the two molecules of HOAc produced from theprotonation. Further, the spectrum shows a C=O signal for the novel intermediate1.1.
This reaction represents an example of point 2, in that the product reveals anunexpected feature.
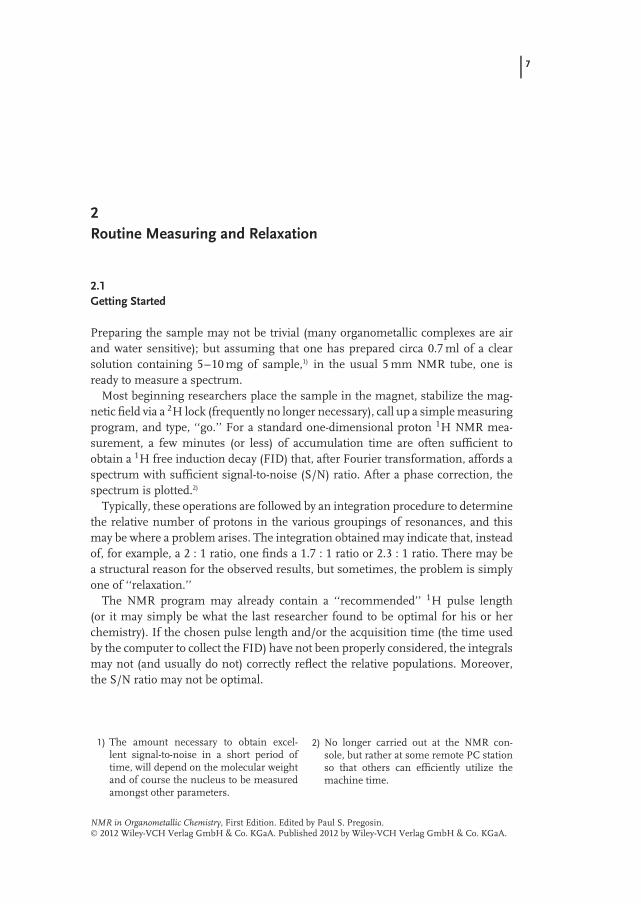
Figures 1.3 and 1.4 demonstrate point 3. The 1H NMR spectrum of the deuteratedrhodium pyrazolylborate isonitrile complex, RhD(CH3)(Tp′)(CNCH2But), in themethyl region, slowly changes to reveal the isomer in which the deuterium atomin now incorporated in the methyl group to afford RhH(CH2D)(Tp′)(CNCH2But).In this chemistry, the deuterium isotope effect on the 1H methyl chemical shift issufficient to allow the resolution of the two slightly different methyl groups andthus allow the 1H(2H) exchange to be followed.
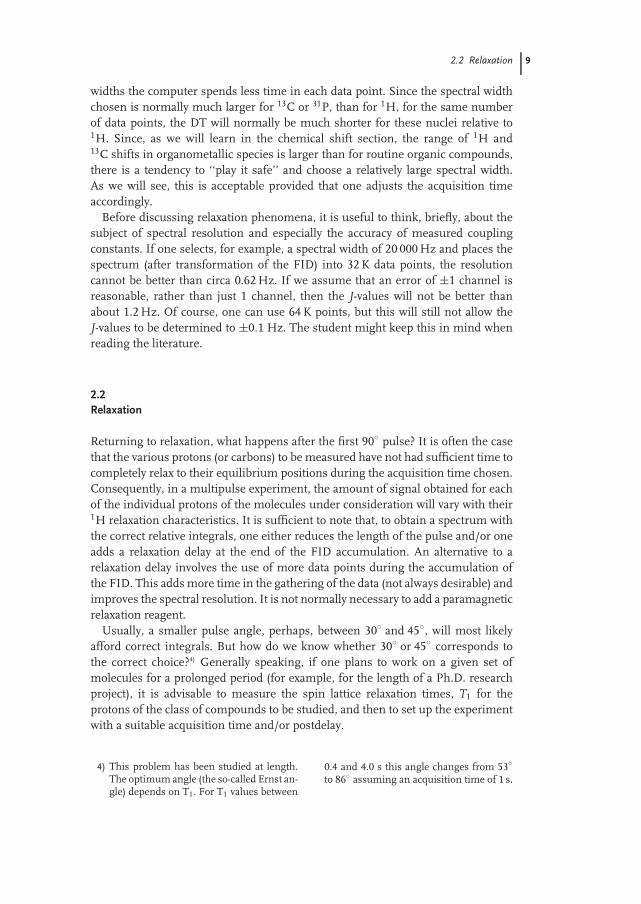
Figure 1.4 shows the intracellular and extracellular exchange of cesium, via 33CsNMR (I = 7/2, 100% abundant), as a function of time. Although this subject doesnot involve transition metal chemistry, it does demonstrate how NMR can shedlight on a potentially complicated biological subject. Both Figures 1.3 and 1.4represent examples of the use of NMR to follow a slowly developing chemicaltransformation (point 3).
To be fair, a unique structural assignment cannot usually be made by countingthe number of 1H, 13C, or 31P signals and/or measuring their chemical shifts. X-raycrystallography remains the acknowledged ultimate structure proof. However, formonitoring reactions, identifying mixtures of products and detailed mechanisticstudies involving varying structures, NMR has proven to be a flexible and uniquemethodology. Apart from 1H, 13C, 15N, 19F, or 31P, already mentioned, there aremany other possibilities, including 2H, 29Si, one of the Sn isotopes, and 195Pt, tomention only a few.
d(13C) 185 180 175 170 165
Coordinatedacetate
Acetic acid Aceticanhydride
2Jpc = 2 Hz
Figure 1.2 Section of the 13C spectrum of the reactionsolution after 30 min at 353 K with peaks for the acetatemoiety of 1.1, acetic acid, and acetic anhydride. The ex-panded section shows the P C coupling, 2J = 2 Hz (75 MHzin 1,2-dichloroethane solution) [2].

4 1 Introduction
314
218
88
34
10
0
Figure 1.3 Methyl region as a function of time (minutes)of the 1H NMR spectrum from the rearrangement ofRhD(CH3)(Tp′)(CNCH2But), to RhH(CH2D)(Tp′)(CNCH2But)in benzene-d6 at 295 K [3].
0.5 0 −0.5 −1.0 −1.5
d (133Cs) (ppm)
0.51.01.76
2.253.0
4.54.0
9.77.3
Tim
e (h
)
Intracellular
Exracellular133Cs
Figure 1.4 133Cs NMR spectra of human erythrocytessuspended in a buffer containing 140 mM NaCl and 10 mMCsCl. The origin of the chemical shift scale is arbitrary [4, 5].
References 5
In addition to chemical shifts, the observed signal multiplicity (as in Figures 1.2and 1.3) can be useful, as the observation of a coupling constant (J-value) canhelp to confirm that a fragment is within the coordination sphere. In Figure 1.2,an acetate carbon is coupled to the 31P. In Figure 1.3, the 103Rh (I = 1/2, 100%natural abundance) couples to the 1H of the methyl group. Apart from theseroutine parameters, organometallic chemists need to occasionally use slightlymore specialized NMR tools. Spin–lattice relaxation times, T1’s, for example,are now used to characterize metal molecular hydrogen complexes. All these,and others, together with the ability to detect and measure solution dynamicsover several orders of magnitude, contribute to making NMR an indispensabletechnique. However, modern NMR spectrometers are not always simple to use andobtaining good quality NMR spectra can require some effort.
References
1. Helfer, D.S. and Atwood, J.D. (2002)Organometallics, 21, 250.
2. Geldbach, T.J., den Reijer, C.J., Worle,M., and Pregosin, P.S. (2002) Inorg.Chim. Acta, 330, 155.
3. Wick, D.D., Reynolds, K.A., and Jones,W.D. (1999) J. Am. Chem. Soc., 121,3974.
4. Davis, D.G., Murphy, E., and London,R.E. (1988) Biochemistry, 27, 3547.
5. Ronconi, L. and Sadler, P.J. (2008) Coord.Chem. Rev., 252, 2239.

7
2Routine Measuring and Relaxation
2.1Getting Started
Preparing the sample may not be trivial (many organometallic complexes are airand water sensitive); but assuming that one has prepared circa 0.7 ml of a clearsolution containing 5–10 mg of sample,1) in the usual 5 mm NMR tube, one isready to measure a spectrum.
Most beginning researchers place the sample in the magnet, stabilize the mag-netic field via a 2H lock (frequently no longer necessary), call up a simple measuringprogram, and type, ‘‘go.’’ For a standard one-dimensional proton 1H NMR mea-surement, a few minutes (or less) of accumulation time are often sufficient toobtain a 1H free induction decay (FID) that, after Fourier transformation, affords aspectrum with sufficient signal-to-noise (S/N) ratio. After a phase correction, thespectrum is plotted.2)
Typically, these operations are followed by an integration procedure to determinethe relative number of protons in the various groupings of resonances, and thismay be where a problem arises. The integration obtained may indicate that, insteadof, for example, a 2 : 1 ratio, one finds a 1.7 : 1 ratio or 2.3 : 1 ratio. There may bea structural reason for the observed results, but sometimes, the problem is simplyone of ‘‘relaxation.’’
The NMR program may already contain a ‘‘recommended’’ 1H pulse length(or it may simply be what the last researcher found to be optimal for his or herchemistry). If the chosen pulse length and/or the acquisition time (the time usedby the computer to collect the FID) have not been properly considered, the integralsmay not (and usually do not) correctly reflect the relative populations. Moreover,the S/N ratio may not be optimal.
1) The amount necessary to obtain excel-lent signal-to-noise in a short period oftime, will depend on the molecular weightand of course the nucleus to be measuredamongst other parameters.
2) No longer carried out at the NMR con-sole, but rather at some remote PC stationso that others can efficiently utilize themachine time.
NMR in Organometallic Chemistry, First Edition. Edited by Paul S. Pregosin. 2012 Wiley-VCH Verlag GmbH & Co. KGaA. Published 2012 by Wiley-VCH Verlag GmbH & Co. KGaA.

8 2 Routine Measuring and Relaxation
TIME in the data memory (= channels)
Pulse length in micro seconds
Short “pre” delay for “ringing”
FID acquisition time.
Can be seconds or somewhat less
“Post” delay (s) for relaxation
Dwell time = DT = time in each memory point
FID acquisition time = DT × number of data points.
Spectral width = 1/2 DT
Measuring
N times
y
x
z
A CB
Scheme 2.1
Scheme 2.1 shows a cartoon of a routine measurement (note that the horizontalaxis is not to scale). We will assume that the pulse length chosen (in microseconds)corresponds to a 90◦ pulse. A 90◦ pulse is defined as that pulse length that tipsthe magnetization vector 90◦ from its equilibrium position on the z-axis (A) andaffords the maximum signal after one pulse (B). Less than 90◦ will afford a vectorwhose projection on (for example) the x-axis, will not be quite so large (C).
After the excitation via the 90◦ radio frequency pulse, an FID is collected inthe chosen number of memory points. If there is no relaxation (post) delay, theexperiment is repeated ‘‘N’’ times until sufficient signal is obtained. The acquisitiontime is determined by the number of data points in the FID (chosen by the operator),multiplied by the time the computer ‘‘resides’’ in each channel (the dwell time,DT). The value of DT is set by the computer and is related to the selected spectralwidth. The simple relation is spectral width = 1/2(DT)3), so that for large spectral
3) For Bruker instruments.
2.2 Relaxation 9
widths the computer spends less time in each data point. Since the spectral widthchosen is normally much larger for 13C or 31P, than for 1H, for the same numberof data points, the DT will normally be much shorter for these nuclei relative to1H. Since, as we will learn in the chemical shift section, the range of 1H and13C shifts in organometallic species is larger than for routine organic compounds,there is a tendency to ‘‘play it safe’’ and choose a relatively large spectral width.As we will see, this is acceptable provided that one adjusts the acquisition timeaccordingly.
Before discussing relaxation phenomena, it is useful to think, briefly, about thesubject of spectral resolution and especially the accuracy of measured couplingconstants. If one selects, for example, a spectral width of 20 000 Hz and places thespectrum (after transformation of the FID) into 32 K data points, the resolutioncannot be better than circa 0.62 Hz. If we assume that an error of ±1 channel isreasonable, rather than just 1 channel, then the J-values will not be better thanabout 1.2 Hz. Of course, one can use 64 K points, but this will still not allow theJ-values to be determined to ±0.1 Hz. The student might keep this in mind whenreading the literature.
2.2Relaxation
Returning to relaxation, what happens after the first 90◦ pulse? It is often the casethat the various protons (or carbons) to be measured have not had sufficient time tocompletely relax to their equilibrium positions during the acquisition time chosen.Consequently, in a multipulse experiment, the amount of signal obtained for eachof the individual protons of the molecules under consideration will vary with their1H relaxation characteristics. It is sufficient to note that, to obtain a spectrum withthe correct relative integrals, one either reduces the length of the pulse and/or oneadds a relaxation delay at the end of the FID accumulation. An alternative to arelaxation delay involves the use of more data points during the accumulation ofthe FID. This adds more time in the gathering of the data (not always desirable) andimproves the spectral resolution. It is not normally necessary to add a paramagneticrelaxation reagent.
Usually, a smaller pulse angle, perhaps, between 30◦ and 45◦, will most likelyafford correct integrals. But how do we know whether 30◦ or 45◦ corresponds tothe correct choice?4) Generally speaking, if one plans to work on a given set ofmolecules for a prolonged period (for example, for the length of a Ph.D. researchproject), it is advisable to measure the spin lattice relaxation times, T1 for theprotons of the class of compounds to be studied, and then to set up the experimentwith a suitable acquisition time and/or postdelay.
4) This problem has been studied at length.The optimum angle (the so-called Ernst an-gle) depends on T1. For T1 values between
0.4 and 4.0 s this angle changes from 53◦
to 86◦ assuming an acquisition time of 1 s.

10 2 Routine Measuring and Relaxation
Measuring T1, for example, via the inversion-recovery sequence (Eq. (2.1)):
180◦ pulse − τ (waiting time) − 90◦ pulse − (collect the FID and transform) (2.1)
is a straightforward process and affords a series of spectra as a function of thedifferent waiting times, τ . The 180◦ pulse inverts the magnetization. After short τ
values, the magnetization is still inverted and, after the 90◦ pulse, transformationof the FID affords a ‘‘negative’’ signal. As the waiting time τ increases, the spinsrelax more and more toward their original equilibrium positions and the 90◦ pulseresults in a ‘‘positive’’ signal.
Figure 2.1a shows an inversion-recovery T1 measurement for the two typesof hydride ligand in WH3(Cp)+2 (2.1). Note that with a τ value of 2000 ms, thecentral proton is ‘‘positive’’ whereas the outer two hydride signals have close tozero intensity. For the two separate 195Pt measurements on Pt{P(t-Bu)3}2 at 310 K,given in Figure 2.1b, one sees the effect on the signal intensities of altering thewaiting time and of changing the magnetic field strength and we shall comeback to this field dependence shortly. The T1 values can be calculated from theexperimental data via a well-known regression analysis. The waiting time thatcorresponds to ‘‘zero’’ signal is circa T1(ln2) and although this may prove a usefulrelation for estimating T1 it is not usually very accurate.
2.1
W
+ H
H
H
An understanding of the factors affecting the spin–lattice relaxation times, T1’s,will help to solve the 1H integration problem, and also can be of value in connectionwith optimizing S/N ratios and/or mixing times in 2-D 1H,1H nuclear Ovehausereffect (NOE) experiments. Moreover, there are some subtle problems concernedwith integrals and intensities for 13C and 31P, involving T1 so that a brief discussionon NMR relaxation is useful.
One can summarize the longitudinal relaxation rate of a nucleus, R1(= 1/T1),as resulting from the sum of a number of contributions and these are shown inEq. (2.2).
R1 = RDD1 + RCSA
1 + RSR1 + Rsc + REN
1 (2.2)
−−−−−−−−−−−−−−−−−−−−−−−−−−−−−−−−−−−−−−−−−−−−−−−−−−−−−−−−−−−−→Figure 2.1 (a) Inversion-recovery exper-iments to determine the relaxation timesof the hydride ligands for WH3(Cp)+2 inCF3CO2H at 298 K. The waiting timesare in milliseconds. The weak resonancessurrounding the main bands stem from183W [1]. (b) 195Pt T1 measurements on
Pt{P(t-Bu)3}2 at 310 K at 7.0 T (left) and9.4 T (right) using the inversion-recoverypulse sequence. The variable delays betweenthe 90′′ and 180′′ pulses were varied be-tween 0.001 and 0.4 s. The spectral widthcorresponds to 12 000 Hz [2].

2.2 Relaxation 11
0.0020.004
0.0060.008
0.0100.020
0.0300.050
0.0800.100
0.1500.200
500
1000
2000
3000
4000
10 000t (ms)
−6.0 −6.4 −6.6 −7.0 −7.2d
0.400
0.0010.002
0.0040.008
0.0100.020
0.0300.050
0.1000.150
0.2000.400
(a)
(b)
12 2 Routine Measuring and Relaxation
The various contributions [3] to the overall relaxation rate are defined as follows:DD, dipole–dipole; CSA, chemical shift anisotropy; SR, spin rotation; SC, scalarcoupling; Q, quadrupole; and EN, electron–nuclear. For our purposes, it is usefulto discuss only two of these contributions, RDD
1 and RCSA1 .
2.2.1Dipole–Dipole Relaxation
Dipole–dipole relaxation, in which one of the two dipoles is 1H, represents animportant (and usually dominating) contributor to the relaxation of the two
R = 1/T1 = 4γ 2Hγ 2
AhS(S + 1)τ/3r6H,A (2.3)
important nuclei 1H, 13C, and occasionally for 15N and 31P. In the equation above,γ is the gyromagnetic ratio and is directly proportional to the magnitude of themagnetic moment of the nuclei A and 1H, S is the spin quantum number, h isPlanck′s constant, τ is a molecular correlation time, and r is the distance betweenthe two dipoles. Often, a number of proximate dipoles (for example, a set of protonsin an aliphatic chain and/or the protons of an aromatic moiety) will contribute to therelaxation of a given 13C, 15N, or (sometimes) 31P. The values of τ and r representtwo very important factors that vary with molecular structure. Large moleculesmove slowly (large τ ) and some 13C or 15N spins have the protons directly bonded(short r-values).
Specifically for 13C
R = 1/T1 is proportional to Nγ 213C
2γ1H2τ/r6
C−H (2.4)
where N in Eq. (2.4) represents the number of protons attached to the carbon inquestion. Clearly, a short r-value (e.g., a hydrogen atom directly bound to the 13Cin question) will afford a shorter T1. However, the τ value can be quite important.Anything that changes molecular motions (different solvents, via their viscosities,variable temperature experiments – again through a change in viscosity –, large vssmall molecular size, or perhaps steric crowding) can affect τ and thus T1.
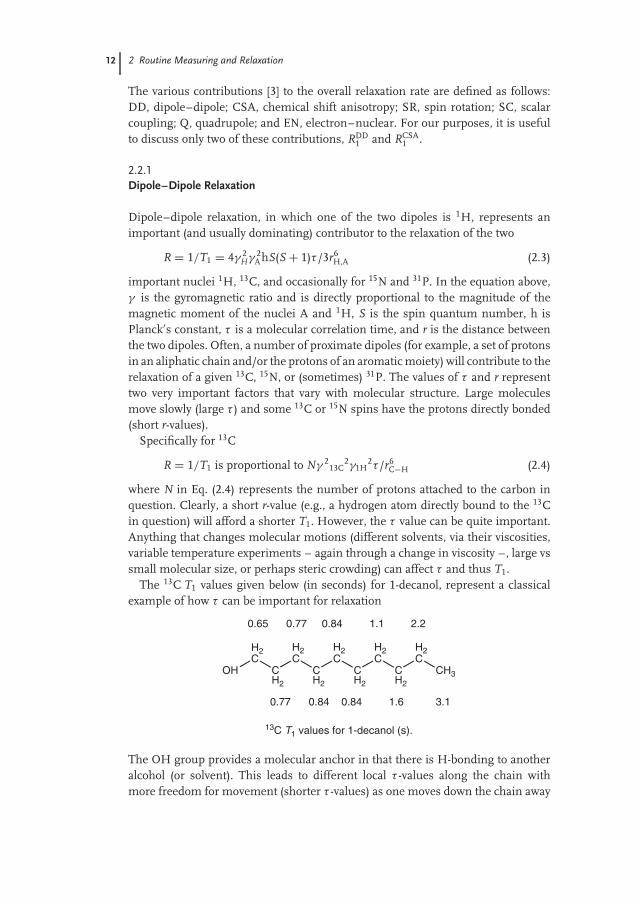
The 13C T1 values given below (in seconds) for 1-decanol, represent a classicalexample of how τ can be important for relaxation
OH
H2C
CH2
H2C
CH2
H2C
CH2
H2C
CH2
H2C
CH3
0.65 0.77 0.84 1.1 2.2
0.77 0.84 0.84 1.6 3.1
13C T1 values for 1-decanol (s).
The OH group provides a molecular anchor in that there is H-bonding to anotheralcohol (or solvent). This leads to different local τ -values along the chain withmore freedom for movement (shorter τ -values) as one moves down the chain away
2.2 Relaxation 13
Table 2.1 31P TI for PPh3 and some phosphine complexes in CDCl3.
trans-IrCl(CO)(P(p-X-C6H4)3)a trans-PdCl2(PR3)2b
X T1 (s) R T1 (s)
H 8.7–9.0c Et 9.5F 8.1 n-Pr 6.3Cl 6.8 n-Bu 4.3CH3 6.2 Cy 3.6OCH3 4.4
AuCl(P(p-X-C6H4)3)a
H 16.0OCH3 11.3PPh3 (free ligand) 26.0
aR1DDis not the only contributor to the P-relaxation [4a].
bRef. [4b].cMeasured several times. All values in seconds.
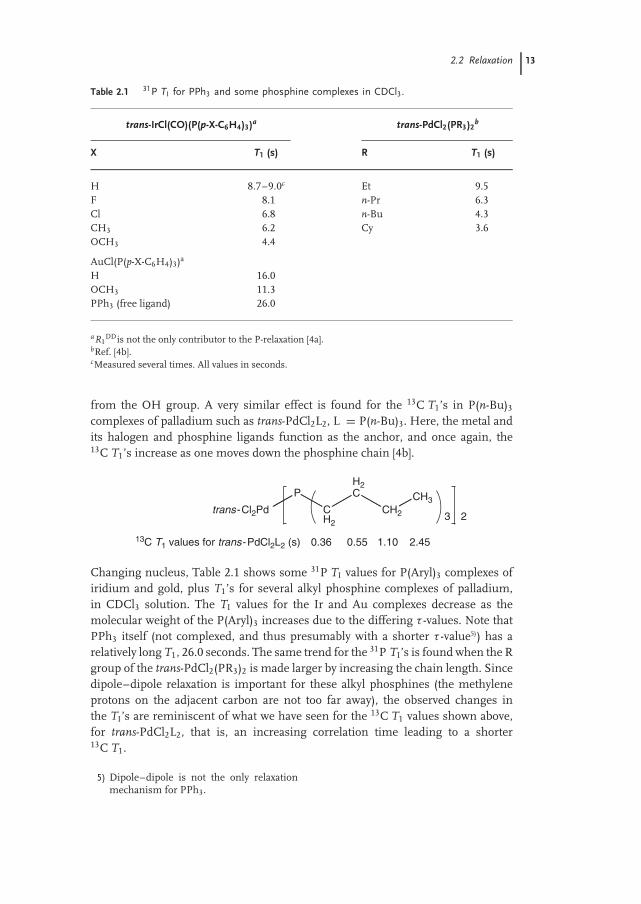
from the OH group. A very similar effect is found for the 13C T1’s in P(n-Bu)3
complexes of palladium such as trans-PdCl2L2, L = P(n-Bu)3. Here, the metal andits halogen and phosphine ligands function as the anchor, and once again, the13C T1’s increase as one moves down the phosphine chain [4b].
trans -Cl2Pd
P
CH2
H2C
CH2
CH3
3
13C T1 values for trans -PdCl2L2 (s)
2
0.36 0.55 1.10 2.45
Changing nucleus, Table 2.1 shows some 31P TI values for P(Aryl)3 complexes ofiridium and gold, plus T1’s for several alkyl phosphine complexes of palladium,in CDCl3 solution. The TI values for the Ir and Au complexes decrease as themolecular weight of the P(Aryl)3 increases due to the differing τ -values. Note thatPPh3 itself (not complexed, and thus presumably with a shorter τ -value5)) has arelatively long T1, 26.0 seconds. The same trend for the 31P TI’s is found when the Rgroup of the trans-PdCl2(PR3)2 is made larger by increasing the chain length. Sincedipole–dipole relaxation is important for these alkyl phosphines (the methyleneprotons on the adjacent carbon are not too far away), the observed changes inthe TI’s are reminiscent of what we have seen for the 13C T1 values shown above,for trans-PdCl2L2, that is, an increasing correlation time leading to a shorter13C T1.
5) Dipole–dipole is not the only relaxationmechanism for PPh3.
14 2 Routine Measuring and Relaxation
Where dipole–dipole relaxation is important (as in 1H and 13C NMR), NOEs,that develop due to relaxation effects, can result in signal enhancement. Thetheoretical maximum is 50% for 1H and almost a factor of 2 for 13C. Althoughnot widely recognized, there is a dipole–dipole contribution to the 31P relaxationin metal phosphine complexes, and especially in alkyl phosphine complexes. Indeed,the dipole–dipole contribution can amount to between 70 and 100% of therelaxation [5]. Since a substantial dipole–dipole contribution exists, Overhausereffects between 31P and 1H can have a marked effect on the 31P signal intensitywhen the phosphorus spectrum is measured with 1H decoupling.
Assume that one is interested in studying a reaction involving P-donor exchange
L,M(P1R3) + P2R3 −→ M(P2R3) + P1R3 (2.5)
such as that indicated in Eq. (2.5). Simple integration of the 31P spectra will mostlikely not lead to the correct relative populations, unless both T1’s and NOE’shave been considered. Measuring and using integrals in 31P spectra can be quitechallenging!
Although technically important, there are not too many areas of organometallicchemistry where measuring TI’s is necessary to understand the chemistry. How-ever, in the discussion of the NMR parameters of molecular hydrogen complexes,to follow later on, 1H T1 data for both the hydrogen and hydride ligands aresuggested to afford a diagnostic tool for these complexes in solution. The shortH–H distance in the complexed η2-H2 ligand (short r-values) results in extremelyshort 1H T1 values, (usually <20 ms) relative to those T1’s for terminal hydrides(often several hundred milliseconds). A review by Morris [6] includes more than100 representative examples of these very short T1’s.
M
H
H
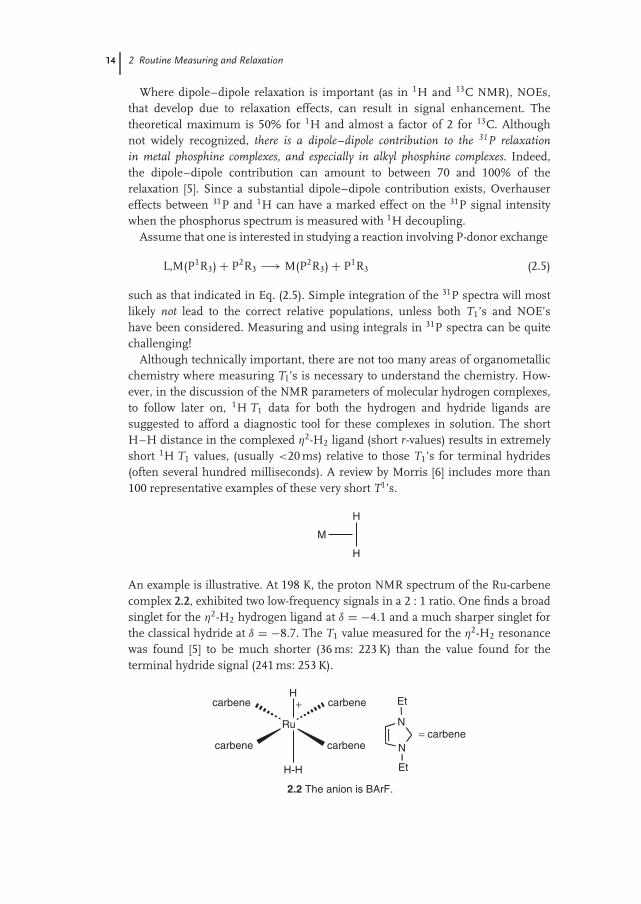
An example is illustrative. At 198 K, the proton NMR spectrum of the Ru-carbenecomplex 2.2, exhibited two low-frequency signals in a 2 : 1 ratio. One finds a broadsinglet for the η2-H2 hydrogen ligand at δ = −4.1 and a much sharper singlet forthe classical hydride at δ = −8.7. The T1 value measured for the η2-H2 resonancewas found [5] to be much shorter (36 ms: 223 K) than the value found for theterminal hydride signal (241 ms: 253 K).
carbene
Ru
carbene
carbene carbene
H
H-H
N
N
Et
Et
= carbene
2.2 The anion is BArF.
+