patterns of adoption - irribooks.irri.org/9789712202872_content.pdfcontents i edited by s. pandey,...
TRANSCRIPT


Contents i
Edited byS. Pandey, D. Gauchan, M. Malabayabas,
M. Bool-Emerick, and B. Hardy
2012
Patterns of adoption of improved rice varieties and farm-level impacts
in stress-prone rainfed areas in South Asia
ii Contents
The International Rice Research Institute (IRRI) was established in 1960 by the Ford and Rockefeller Foundations with the help and approval of the Government of the Philippines. Today, IRRI is one of the 15 nonprofi t international research centers supported in part by more than 40 donors: members of the Consultative Group on International Agricultural Research (CGIAR – www.cgiar.org), other government funding agencies, foundations, the private sector, and nongovernment organizations.
The responsibility for this publication rests with the International Rice Research Institute.
Copyright International Rice Research Institute 2012
This publication is copyrighted by the International Rice Research Institute (IRRI) and is licensed for use under a Creative Commons Attribution-NonCommercial-ShareAlike 3.0 License (Unported). Unless otherwise noted, users are free to copy, duplicate, or reproduce, and distribute, display, or transmit any of the articles or portions of the articles, and to make translations, adaptations, or other derivative works under the following conditions:
Attribution: The work must be attributed, but not in any way that suggests endorsement by IRRI or the author(s).
NonCommercial: This work may not be used for commercial purposes.
ShareAlike: If this work is altered, transformed, or built upon, the resulting work must be distributed only under the same or similar license to this one.
l For any reuse or distribution, the license terms of this work must be made clear to others.l Any of the above conditions can be waived if permission is obtained from the copyright
holder.l Nothing in this license impairs or restricts the author’s moral rights.l Fair dealing and other rights are in no way affected by the above.l To view the full text of this license, visit http://creativecommons.org/licenses/by-nc-sa/3.0/
Mailing address: IRRI, DAPO Box 7777, Metro Manila, PhilippinesPhone: +63 (2) 580-5600Fax: +63 (2) 580-5699Email: [email protected]: www.irri.org.Rice Knowledge Bank: www.knowledgebank.irri.orgCourier address: Suite 1009, Security Bank Center 6776 Ayala Avenue, Makati City, Philippines Tel. +63 (2) 891-1236, 891-1174, 891-1258, 891-1303
Suggested citation: Pandey S, Gauchan D, Malabayabas M, Bool-Emerick M, Hardy B, editors. 2012. Patterns of adoption of improved rice varieties and farm-level impacts in stress-prone rainfed areas in South Asia. Los Baños (Philippines): International Rice Re-search Institute. 318 p.
Cover design: Juan Lazaro IVPage makeup and composition: Emmanuel PanisalesFigures and illustrations: Emmanuel Panisales
ISBN 978-971-22-0287-2
Foreword iii
Contents
Foreword v
Acknowledgments vi
Chapter 1 Synthesis of key results and implications 1 D. Gauchan and S. Pandey
Chapter 2 Methodological framework 19 D. Gauchan and S. Pandey
Chapter 3 Patterns of adoption of improved rice varieties and farm-level 35 impacts in stress-prone rainfed areas of Nepal
D. Gauchan, H.K. Panta, S. Gautam, and M.B. Nepali
Chapter 4 Patterns of adoption of improved rice varieties and farm-level 105 impacts in stress-prone rainfed areas of Assam, India
N. Deka and D. Gauchan
Chapter 5 Patterns of adoption of improved rice varieties and farm-level 161 impacts in stress-prone rainfed areas of Bangladesh M.R. Islam, M.A. Islam, M.S. Rahman, A. Salam, S. Alam, E. Harun, and M. Bool-Emerick
Chapter 6 Patterns of adoption of improved rice varieties and farm-level 215 impacts in stress-prone rainfed areas of West Bengal, India
B. Bagchi and M. Bool-Emerick
Chapter 7 Patterns of adoption of improved rice varieties and farm-level 259 impacts in stress-prone rainfed areas of Chhattisgarh and Orissa
D. Behura, A. Koshta, D. Naik, P. Samal, and M. Malabayabas

vii
v
Foreword
Widespread and persistent poverty in Asia is a longstanding problem, particularly in rainfed ecosystems. Rice is dominant in these areas because it is the only crop that can be grown in the wet season. As a result, it is the principal source of the rural popula-tion’s food, employment, and income. Rice yields in these rainfed ecosystems—home to 100 million farm households that plant a total of 60 million hectares—remain low (1.5–2.5 tons/ha) and unstable—unstable because of two perennial wraths of nature, drought and fl ooding, which with looming climate change will only become worse. Compounding this problem are poor soils that pervade many rice-growing environments. The incidence of poverty in these rainfed areas is high. Many of these poor people belong to minority ethnic groups, lower castes, and tribes that are economically and socially marginalized. These people are truly the poorest of the poor. And they will stay that way unless the farm families among them can obtain higher incomes through higher and more stable rice yields in the rainfed environments where rice productivity is constrained by diffi cult growing conditions. Raising the productivity and stability of rice in this region is a key to reducing poverty. Higher rice productivity will directly increase the quantity of food available to poor households. This will also raise the income of poor landless households as family members are employed as hired labor for rice production. Increased production will benefi t the poor households that buy rice by keeping its price low. In addition, higher rice productivity will promote diversifi cation into income-generating activities as family food needs can be met from using less land and labor. The cumulative effect of these factors can provide a strong foundation for reducing poverty. With this vision, IRRI is investing substantially in developing rice varieties and production practices that are suited to rainfed environments where rice production suffers from drought, submergence, and salinity. Support from many donors has led to the development of several improved rice varieties that are tolerant of submergence, drought, and salinity. These varieties are now being widely distributed in rainfed rice areas in Asia and Africa under the project “Stress-Tolerant Rice for Africa and South Asia (STRASA)” with major support from the Bill & Melinda Gates Foundation. It is important to understand the social and economic context of rice production in these areas for effi cient targeting of such varieties and for assessing their impacts. The various chapters in this book are based on household-level benchmark data on farmers’ livelihood strategies, technology adoption patterns, constraints to adoption, and the impact of drought, submergence, and salinity in rainfed rice-growing areas of Bangladesh, India, and Nepal. I am confi dent that the results, based on a detailed analysis of farm-level data from these three countries, provide important insights for underpinning technology development and dissemination in stress-prone rainfed areas.
Robert S. ZeiglerDirector GeneralIRRI
vi D. Gauchan and S. Pandey
Acknowledgments
We would like to acknowledge several organizations and individuals that have directly or indirectly contributed to the completion of this research work and publication. The research carried out here is a part of the Bill & Melinda Gates Foundations (BMGF)–supported project on Stress-Tolerant Rice for Poor Farmers in Africa and South Asia (STRASA). We acknowledge funding support from the Foundation. The research was implemented by IRRI in partnership with many national re-search organizations in South Asia. The main partner organizations directly involved were the Indian Council of Agricultural Research (ICAR), Orissa Univeristy of Agri-cultural Technology (OUAT), Central Rice Research Institute (CRRI), Indira Gandhi Agricultural University (IGAU), Assam Agricultural University (AAU), Nadia Zilla Farmers’ Development Organization (NZFDO), Bangladesh Rice Research Institute (BRRI), Bangladesh Agricultural University (BAU), Institute of Agricultural and Animal Sciences (IAAS), and Nepal Agricultural Research Council (NARC). The following staff of these organizations took on leadership roles in implementing the research work: Dr. Shahe Alam (BRRI), Mr. Eusuf Harun (BRRI), Dr. M. Rafi qul Islam (BRRI), Mr. M. Ariful Islam (BRRI), Mr. Abdus Salam (BRRI), Mr. M. Saidur Rahman (BAU), Dr. Bhanudeb Bagchi (NZFDO), Dr. Parshuram Samal (CRRI), Dr. Dibakar Naik (OUAT), Dr. Debdutt Behura (OUAT), Dr. Nivedita Deka (AAU), Dr. Ajay Kumar Koshta (IGAU), Mr. Megh B. Nepali (NARC), Mr. Sudeep Gautam (NARC), and Mr. Hari Panta (IAAS). We would like to express our appreciation to those organizations and individuals for their collaboration. We thank the staff of the Social Sciences Division—Ludy Velasco, Orlee Velarde, Lydia Damian, and Gina Zarsadias—who were directly involved in providing sup-port at various stages of the research study. Dr. Andy Nelson and the staff of IRRI’s Geographic Information Systems (GIS) Laboratory, particularly Cornelia Garcia, provided the maps. Other SSD staff who provided logistical and other support were Dr. Thelma Paris, Josie Narciso, and Mirla Domingo. We also wish to thank the staff of IRRI’s Communication and Publications Services, who helped with the graphic design and gave editorial assistance: Emmanuel Panisales, Juan Lazaro, and Grace Cañas. We are also grateful to the STRASA management team, initially led by Dr. David Mackill and subsequently by Dr. Abdelbagi Ismail. We also acknowledge the help provided by Dr. Umesh Singh, the South Asia coordinator for STRASA. Finally, we are thankful to the 1,900 farmers from Bangladesh, India, and Nepal who provided their time and valuable information on which this work is based.
Editors

vii
Synthesis of key results and implications 1
Synthesis of key results and implications
Chapter 1

2 D. Gauchan and S. Pandey

Synthesis of key results and implications 3
Synthesis of key results and implications
Rice is the main staple food and a major source of livelihood for more than 400 mil-lion people in South Asia (IRRI 2010). It accounts for 73% of the calorie intake in Bangladesh, 40% in Nepal, and 30% in India (FAOSTAT 2010). South Asia has about 37% of the world’s total rice area and approximately 50% of the rice-growing area in South Asia is rainfed (Dawe et al 2010). Rice is the only crop that grows well in large areas of wetlands in monsoon Asia. Most of these rainfed rice areas regularly suffer from various abiotic stresses such as droughts, fl oods, and salinity. The productiv-ity of rice in these stress-prone rainfed environments is less than 3.0 t/ha (Pandey et al 2010). Historical rice productivity trends in three countries of South Asia (India, Bangladesh, and Nepal) show that growth in yield has been sluggish and unstable in rainfed areas due to the regular occurrence of abiotic and biotic stresses. Therefore, improving the productivity of rice through stress-tolerant technologies is a key entry point to enhance the income and livelihood of resource-poor farmers in these stress-prone environments. The Social Sciences Division (SSD) at the International Rice Research Institute (IRRI) is implementing research work related to the “Impact Assessment and Target-ing” component of the Stress-Tolerant Rice for Africa and South Asia (STRASA) project for South Asia. The main objectives of this component of research are to
1. Analyze patterns of varietal adoption and the factors that infl uence the adop-tion of improved varieties.
2. Analyze the economics of rice production and returns to varietal change.3. Assess farmers’ livelihood strategies in stress-prone rainfed environments.4. Understand the gender roles in rice production and women’s participation in
decision making.5. Derive implications for technology design, targeting, and policy reforms for
enhancing the impact of improved technologies in stress-prone areas. This report consists of seven chapters. The fi rst chapter provides an overall synthesis of key fi ndings and their implications. The subsequent chapters provide a detailed analysis of the results from the three countries included, namely, Bangladesh, India, and Nepal. The baseline socioeconomic survey was implemented in partner-ship with NARES institutions in 19 representative locations (districts) in Bangladesh, India, and Nepal. The survey covered 1,900 farm households growing rice in areas subject to drought, submergence, and salinity. The farm-level data were collected for the cropping year 2008. The methodological aspects and the survey sampling design are described in detail in Chapter 2.
D. Gauchan and S. Pandey

4 D. Gauchan and S. Pandey
Table 1. Characterization of stress situations at the selected sites, 2008.
Item Drought Submergence Salinity (coastal)
Frequency Once in 2–3 years Once in 2–5 years Regular
Duration 20–45 days 3–30 days (3–7 days, short fl ood, and 7–30 days, long fl ood)
Dry season and early wet season
Timing June-July (early), Sept.-Oct. (terminal)
July-September March-June
Stage of crop growth Planting, tillering, maturity
Vegetative stage Early reproductive stage
Panicle stage (dry season) and seedling stage (wet season)
% Yield loss 20–70 30–80 20–40
Major fi ndings
The incidence and severity of abiotic stressesThe incidence and severity of abiotic stresses vary by sites in South Asia (Table 1). The fi ndings, based on farmer perceptions elicited during focus group discussions (FGD) and key informant surveys (KIS), indicated that drought and submergence occur very frequently in the study areas, with the annual frequency varying from 20% to 50%. Salinity is a permanent phenomenon but it tends to be more severe during the dry season than in the wet season. Both early-season and end-of-the-season (or terminal) drought are common in these areas of South Asia. Flooding occurs mainly during the vegetative growth stage (tillering and crop growing stage). Coastal salin-ity is a problem at crop maturity during the dry season (March-May) and seedling and tillering stages in the wet season (June-July). About 20–90% of the rice area in the surveyed locations is affected by these stresses, resulting in a 30–80% yield loss depending on the type of stress and sites.
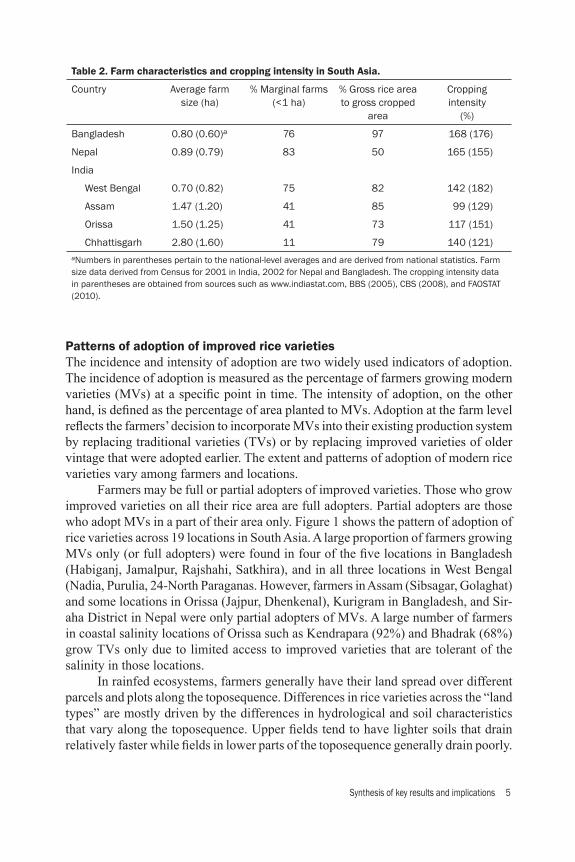
Farm characteristics and cropping intensityRice farmers in South Asia are smallholders, with average farm size of less than 1 hectare in densely populated areas of Bangladesh, Nepal, and West Bengal of India (Table 2). Over two-thirds of the sample farmers in Bangladesh, Nepal, and West Bengal have less than 1 hectare average farm size, indicating the dominance of small farms. Rice is a dominant crop in all parts of South Asia, with its share in gross cropped area being very high in Chhattisgarh (100%) and Bangladesh (95%). The intensity of land use as measured by cropping intensity is low in Assam and Orissa but fairly high in Bangladesh. These estimates obtained from the sample survey are consistent with offi cial statistics at the national/subnational level.
Synthesis of key results and implications 5
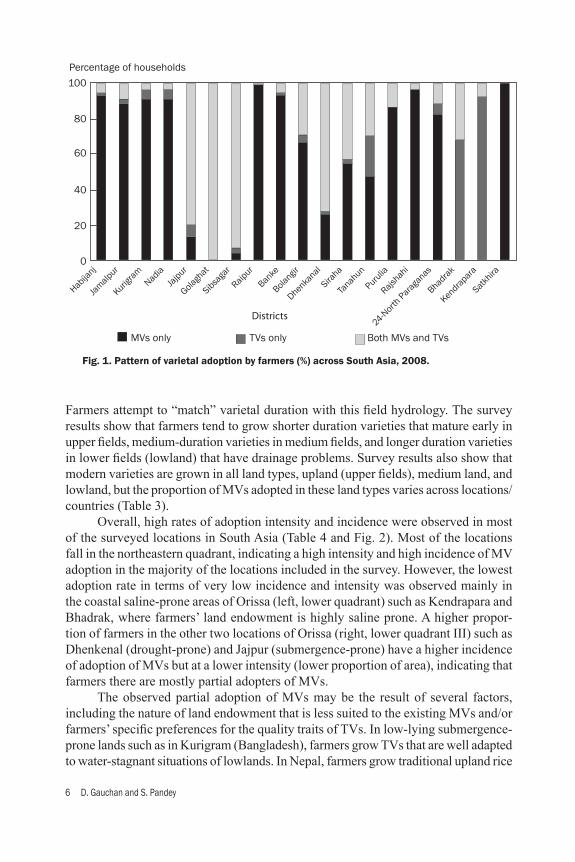
Patterns of adoption of improved rice varietiesThe incidence and intensity of adoption are two widely used indicators of adoption. The incidence of adoption is measured as the percentage of farmers growing modern varieties (MVs) at a specifi c point in time. The intensity of adoption, on the other hand, is defi ned as the percentage of area planted to MVs. Adoption at the farm level refl ects the farmers’ decision to incorporate MVs into their existing production system by replacing traditional varieties (TVs) or by replacing improved varieties of older vintage that were adopted earlier. The extent and patterns of adoption of modern rice varieties vary among farmers and locations. Farmers may be full or partial adopters of improved varieties. Those who grow improved varieties on all their rice area are full adopters. Partial adopters are those who adopt MVs in a part of their area only. Figure 1 shows the pattern of adoption of rice varieties across 19 locations in South Asia. A large proportion of farmers growing MVs only (or full adopters) were found in four of the fi ve locations in Bangladesh (Habiganj, Jamalpur, Rajshahi, Satkhira), and in all three locations in West Bengal (Nadia, Purulia, 24-North Paraganas. However, farmers in Assam (Sibsagar, Golaghat) and some locations in Orissa (Jajpur, Dhenkenal), Kurigram in Bangladesh, and Sir-aha District in Nepal were only partial adopters of MVs. A large number of farmers in coastal salinity locations of Orissa such as Kendrapara (92%) and Bhadrak (68%) grow TVs only due to limited access to improved varieties that are tolerant of the salinity in those locations. In rainfed ecosystems, farmers generally have their land spread over different parcels and plots along the toposequence. Differences in rice varieties across the “land types” are mostly driven by the differences in hydrological and soil characteristics that vary along the toposequence. Upper fi elds tend to have lighter soils that drain relatively faster while fi elds in lower parts of the toposequence generally drain poorly.
Table 2. Farm characteristics and cropping intensity in South Asia.
Country Average farm size (ha)
% Marginal farms (<1 ha)
% Gross rice area to gross cropped
area
Cropping intensity
(%)
Bangladesh 0.80 (0.60)a 76 97 168 (176)
Nepal 0.89 (0.79) 83 50 165 (155)
India
West Bengal 0.70 (0.82) 75 82 142 (182)
Assam 1.47 (1.20) 41 85 99 (129)
Orissa 1.50 (1.25) 41 73 117 (151)
Chhattisgarh 2.80 (1.60) 11 79 140 (121)aNumbers in parentheses pertain to the national-level averages and are derived from national statistics. Farm size data derived from Census for 2001 in India, 2002 for Nepal and Bangladesh. The cropping intensity data in parentheses are obtained from sources such as www.indiastat.com, BBS (2005), CBS (2008), and FAOSTAT (2010).
6 D. Gauchan and S. Pandey
Farmers attempt to “match” varietal duration with this fi eld hydrology. The survey results show that farmers tend to grow shorter duration varieties that mature early in upper fi elds, medium-duration varieties in medium fi elds, and longer duration varieties in lower fi elds (lowland) that have drainage problems. Survey results also show that modern varieties are grown in all land types, upland (upper fi elds), medium land, and lowland, but the proportion of MVs adopted in these land types varies across locations/countries (Table 3). Overall, high rates of adoption intensity and incidence were observed in most of the surveyed locations in South Asia (Table 4 and Fig. 2). Most of the locations fall in the northeastern quadrant, indicating a high intensity and high incidence of MV adoption in the majority of the locations included in the survey. However, the lowest adoption rate in terms of very low incidence and intensity was observed mainly in the coastal saline-prone areas of Orissa (left, lower quadrant) such as Kendrapara and Bhadrak, where farmers’ land endowment is highly saline prone. A higher propor-tion of farmers in the other two locations of Orissa (right, lower quadrant III) such as Dhenkenal (drought-prone) and Jajpur (submergence-prone) have a higher incidence of adoption of MVs but at a lower intensity (lower proportion of area), indicating that farmers there are mostly partial adopters of MVs. The observed partial adoption of MVs may be the result of several factors, including the nature of land endowment that is less suited to the existing MVs and/or farmers’ specifi c preferences for the quality traits of TVs. In low-lying submergence-prone lands such as in Kurigram (Bangladesh), farmers grow TVs that are well adapted to water-stagnant situations of lowlands. In Nepal, farmers grow traditional upland rice
Fig. 1. Pattern of varietal adoption by farmers (%) across South Asia, 2008.
100
80
60
40
20
0
Tanah
un
Purulia
24-Nor
th Par
agan
as
Rajshah
i
Satkh
ira
Kendra
para
Bhadra
k
Siraha
Dhenka
nal
Bolangir
Banke
Raipur
Sibsaga
r
Golagh
at
Jajpur
Nadia
Kurigra
m
Jamalp
ur
Habija
nj
Districts
MVs only TVs only Both MVs and TVs
Percentage of households

Synthesis of key results and implications 7
Table 3. MV adoption by land types (% area) across countries/states, wet season.
Countries/states Upland (upper fi elds) Medium land Lowland
MVs TVs MVs TVs MVs TVs
Nepal 77 23 87 13 92 8
Bangladesh 97 3 98 2 82 18
India
Orissa 77 23 77 23 25 75
Chhattisgarh 100 0 99 1 98 2
Assam – – 37 63 76 24
West Bengal 92 8 97 3 86 14
Table 4. Adoption intensity (% area) and incidence (% farmers) of MVs.
Location Intensity (% area) Incidence (% farmers)
Bangladesh 93 97
Nepal 86 91
India
Orissa 47 79
Chhattisgarh 99 100
Assam 61 99
West Bengal 93 99
100Adoption (% area)
Adoption (% farmers)
II. High intensity, low incidence
IV. High intensity, high incidence
I. Low intensity, low incidence
III. Low intensity, high incidence
90
8070
605040
302010
00 10 20 30 40 50 60 70 80 90 100
Fig. 2. Intensity and incidence of MV adoption across locations in South Asia.
8 D. Gauchan and S. Pandey
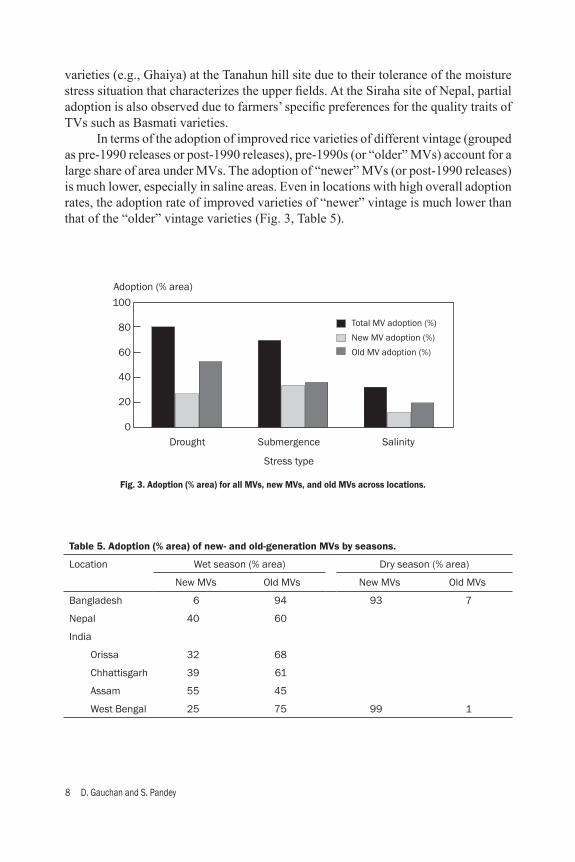
varieties (e.g., Ghaiya) at the Tanahun hill site due to their tolerance of the moisture stress situation that characterizes the upper fi elds. At the Siraha site of Nepal, partial adoption is also observed due to farmers’ specifi c preferences for the quality traits of TVs such as Basmati varieties. In terms of the adoption of improved rice varieties of different vintage (grouped as pre-1990 releases or post-1990 releases), pre-1990s (or “older” MVs) account for a large share of area under MVs. The adoption of “newer” MVs (or post-1990 releases) is much lower, especially in saline areas. Even in locations with high overall adoption rates, the adoption rate of improved varieties of “newer” vintage is much lower than that of the “older” vintage varieties (Fig. 3, Table 5).
Table 5. Adoption (% area) of new- and old-generation MVs by seasons.
Location Wet season (% area) Dry season (% area)
New MVs Old MVs New MVs Old MVs
Bangladesh 6 94 93 7
Nepal 40 60
India
Orissa 32 68
Chhattisgarh 39 61
Assam 55 45
West Bengal 25 75 99 1
100
80
60
40
20
0
Adoption (% area)
Total MV adoption (%)
New MV adoption (%)
Old MV adoption (%)
Drought Submergence
Stress type
Salinity
Fig. 3. Adoption (% area) for all MVs, new MVs, and old MVs across locations.
Synthesis of key results and implications 9
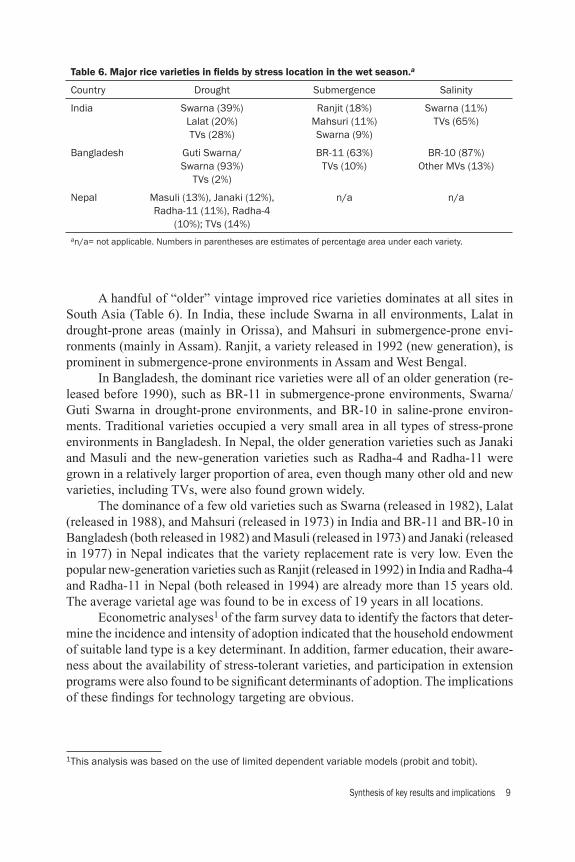
A handful of “older” vintage improved rice varieties dominates at all sites in South Asia (Table 6). In India, these include Swarna in all environments, Lalat in drought-prone areas (mainly in Orissa), and Mahsuri in submergence-prone envi-ronments (mainly in Assam). Ranjit, a variety released in 1992 (new generation), is prominent in submergence-prone environments in Assam and West Bengal. In Bangladesh, the dominant rice varieties were all of an older generation (re-leased before 1990), such as BR-11 in submergence-prone environments, Swarna/Guti Swarna in drought-prone environments, and BR-10 in saline-prone environ-ments. Traditional varieties occupied a very small area in all types of stress-prone environments in Bangladesh. In Nepal, the older generation varieties such as Janaki and Masuli and the new-generation varieties such as Radha-4 and Radha-11 were grown in a relatively larger proportion of area, even though many other old and new varieties, including TVs, were also found grown widely. The dominance of a few old varieties such as Swarna (released in 1982), Lalat (released in 1988), and Mahsuri (released in 1973) in India and BR-11 and BR-10 in Bangladesh (both released in 1982) and Masuli (released in 1973) and Janaki (released in 1977) in Nepal indicates that the variety replacement rate is very low. Even the popular new-generation varieties such as Ranjit (released in 1992) in India and Radha-4 and Radha-11 in Nepal (both released in 1994) are already more than 15 years old. The average varietal age was found to be in excess of 19 years in all locations. Econometric analyses1 of the farm survey data to identify the factors that deter-mine the incidence and intensity of adoption indicated that the household endowment of suitable land type is a key determinant. In addition, farmer education, their aware-ness about the availability of stress-tolerant varieties, and participation in extension programs were also found to be signifi cant determinants of adoption. The implications of these fi ndings for technology targeting are obvious.
1This analysis was based on the use of limited dependent variable models (probit and tobit).
Table 6. Major rice varieties in fi elds by stress location in the wet season.a
Country Drought Submergence Salinity
India Swarna (39%)Lalat (20%)TVs (28%)
Ranjit (18%)Mahsuri (11%)Swarna (9%)
Swarna (11%)TVs (65%)
Bangladesh Guti Swarna/Swarna (93%)
TVs (2%)
BR-11 (63%)TVs (10%)
BR-10 (87%)Other MVs (13%)
Nepal Masuli (13%), Janaki (12%),Radha-11 (11%), Radha-4
(10%); TVs (14%)
n/a n/a
an/a= not applicable. Numbers in parentheses are estimates of percentage area under each variety.
10 D. Gauchan and S. Pandey
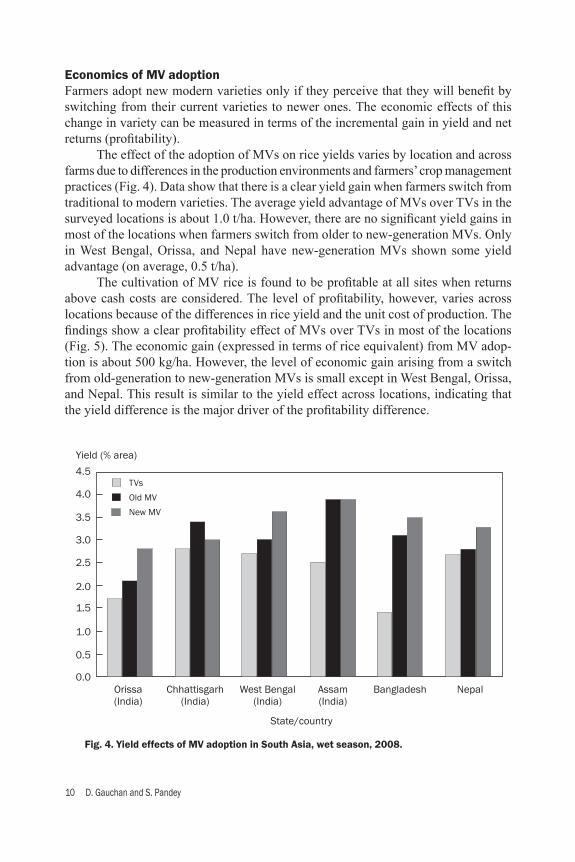
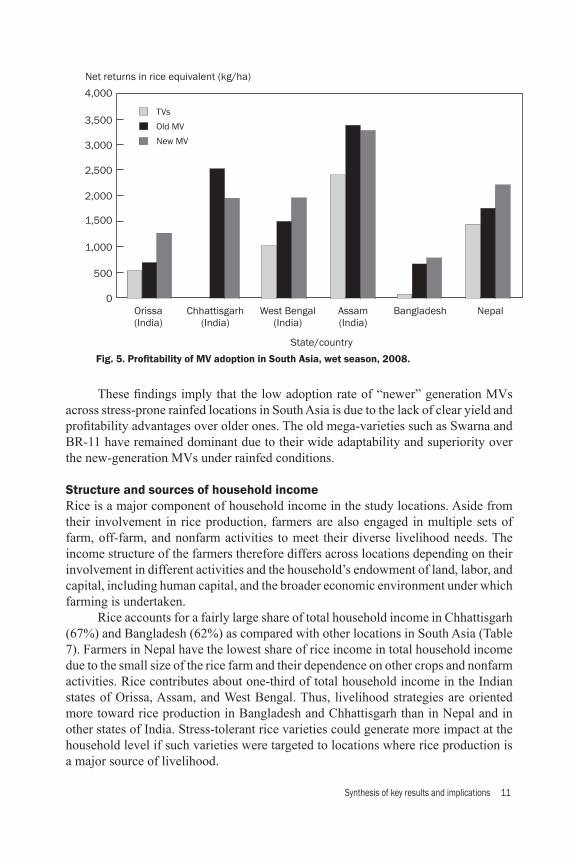
Economics of MV adoptionFarmers adopt new modern varieties only if they perceive that they will benefi t by switching from their current varieties to newer ones. The economic effects of this change in variety can be measured in terms of the incremental gain in yield and net returns (profi tability). The effect of the adoption of MVs on rice yields varies by location and across farms due to differences in the production environments and farmers’ crop management practices (Fig. 4). Data show that there is a clear yield gain when farmers switch from traditional to modern varieties. The average yield advantage of MVs over TVs in the surveyed locations is about 1.0 t/ha. However, there are no signifi cant yield gains in most of the locations when farmers switch from older to new-generation MVs. Only in West Bengal, Orissa, and Nepal have new-generation MVs shown some yield advantage (on average, 0.5 t/ha). The cultivation of MV rice is found to be profi table at all sites when returns above cash costs are considered. The level of profi tability, however, varies across locations because of the differences in rice yield and the unit cost of production. The fi ndings show a clear profi tability effect of MVs over TVs in most of the locations (Fig. 5). The economic gain (expressed in terms of rice equivalent) from MV adop-tion is about 500 kg/ha. However, the level of economic gain arising from a switch from old-generation to new-generation MVs is small except in West Bengal, Orissa, and Nepal. This result is similar to the yield effect across locations, indicating that the yield difference is the major driver of the profi tability difference.
Fig. 4. Yield effects of MV adoption in South Asia, wet season, 2008.
4.5
4.0
3.5
3.0
2.0
2.5
1.5
0.5
0.0
1.0
Yield (% area)
TVs
Old MV
New MV
Orissa(India)
Chhattisgarh(India)
West Bengal(India)
Assam(India)
Bangladesh Nepal
State/country
Synthesis of key results and implications 11
These fi ndings imply that the low adoption rate of “newer” generation MVs across stress-prone rainfed locations in South Asia is due to the lack of clear yield and profi tability advantages over older ones. The old mega-varieties such as Swarna and BR-11 have remained dominant due to their wide adaptability and superiority over the new-generation MVs under rainfed conditions.
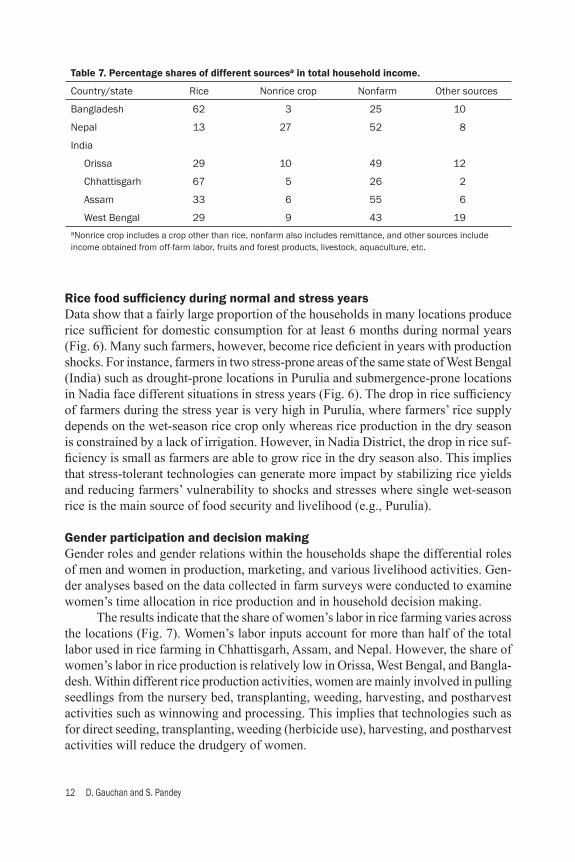
Structure and sources of household incomeRice is a major component of household income in the study locations. Aside from their involvement in rice production, farmers are also engaged in multiple sets of farm, off-farm, and nonfarm activities to meet their diverse livelihood needs. The income structure of the farmers therefore differs across locations depending on their involvement in different activities and the household’s endowment of land, labor, and capital, including human capital, and the broader economic environment under which farming is undertaken. Rice accounts for a fairly large share of total household income in Chhattisgarh (67%) and Bangladesh (62%) as compared with other locations in South Asia (Table 7). Farmers in Nepal have the lowest share of rice income in total household income due to the small size of the rice farm and their dependence on other crops and nonfarm activities. Rice contributes about one-third of total household income in the Indian states of Orissa, Assam, and West Bengal. Thus, livelihood strategies are oriented more toward rice production in Bangladesh and Chhattisgarh than in Nepal and in other states of India. Stress-tolerant rice varieties could generate more impact at the household level if such varieties were targeted to locations where rice production is a major source of livelihood.
Fig. 5. Profi tability of MV adoption in South Asia, wet season, 2008.
4,000
3,500
3,000
2,500
1,500
500
1,000
2,000
0
Net returns in rice equivalent (kg/ha)
TVs
Old MV
New MV
Orissa(India)
Chhattisgarh(India)
West Bengal(India)
Assam(India)
Bangladesh Nepal
State/country
12 D. Gauchan and S. Pandey
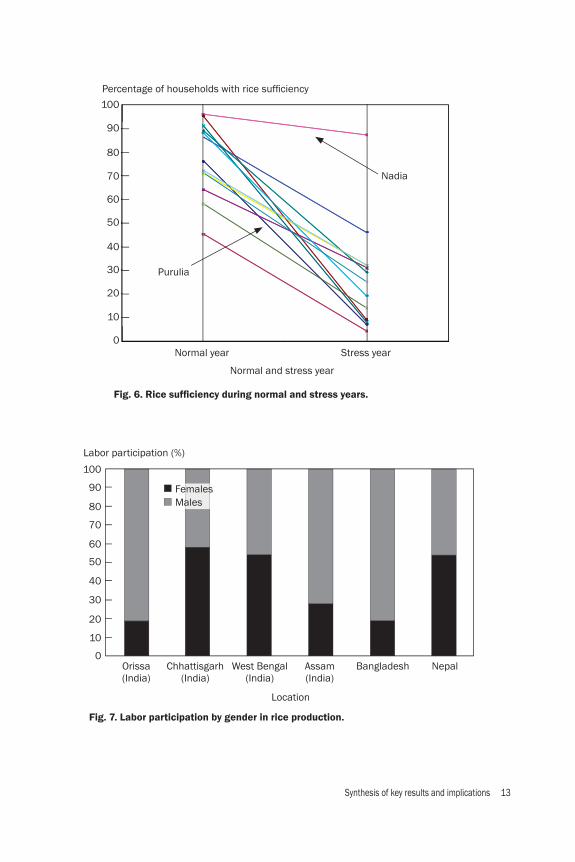
Rice food suffi ciency during normal and stress yearsData show that a fairly large proportion of the households in many locations produce rice suffi cient for domestic consumption for at least 6 months during normal years (Fig. 6). Many such farmers, however, become rice defi cient in years with production shocks. For instance, farmers in two stress-prone areas of the same state of West Bengal (India) such as drought-prone locations in Purulia and submergence-prone locations in Nadia face different situations in stress years (Fig. 6). The drop in rice suffi ciency of farmers during the stress year is very high in Purulia, where farmers’ rice supply depends on the wet-season rice crop only whereas rice production in the dry season is constrained by a lack of irrigation. However, in Nadia District, the drop in rice suf-fi ciency is small as farmers are able to grow rice in the dry season also. This implies that stress-tolerant technologies can generate more impact by stabilizing rice yields and reducing farmers’ vulnerability to shocks and stresses where single wet-season rice is the main source of food security and livelihood (e.g., Purulia).
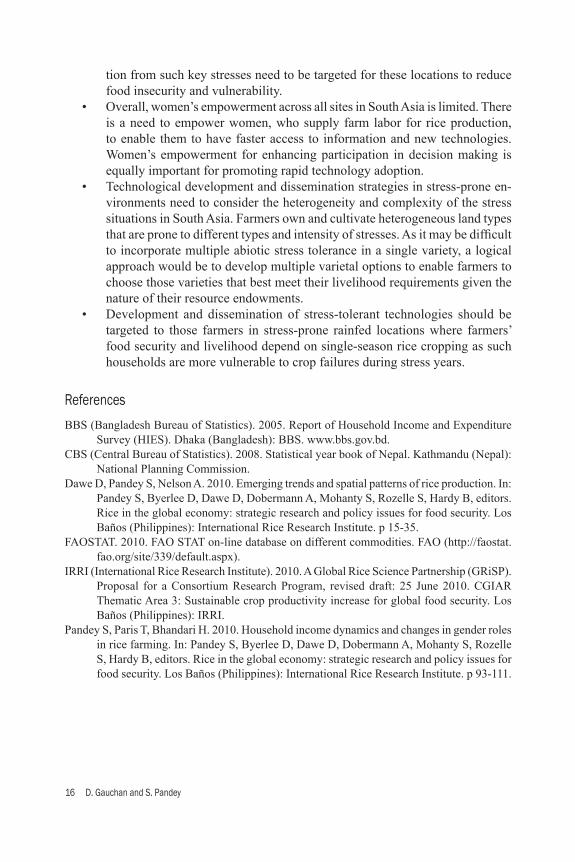
Gender participation and decision makingGender roles and gender relations within the households shape the differential roles of men and women in production, marketing, and various livelihood activities. Gen-der analyses based on the data collected in farm surveys were conducted to examine women’s time allocation in rice production and in household decision making. The results indicate that the share of women’s labor in rice farming varies across the locations (Fig. 7). Women’s labor inputs account for more than half of the total labor used in rice farming in Chhattisgarh, Assam, and Nepal. However, the share of women’s labor in rice production is relatively low in Orissa, West Bengal, and Bangla-desh. Within different rice production activities, women are mainly involved in pulling seedlings from the nursery bed, transplanting, weeding, harvesting, and postharvest activities such as winnowing and processing. This implies that technologies such as for direct seeding, transplanting, weeding (herbicide use), harvesting, and postharvest activities will reduce the drudgery of women.
Table 7. Percentage shares of different sourcesa in total household income.
Country/state Rice Nonrice crop Nonfarm Other sources
Bangladesh 62 3 25 10
Nepal 13 27 52 8
India
Orissa 29 10 49 12
Chhattisgarh 67 5 26 2
Assam 33 6 55 6
West Bengal 29 9 43 19aNonrice crop includes a crop other than rice, nonfarm also includes remittance, and other sources include income obtained from off-farm labor, fruits and forest products, livestock, aquaculture, etc.
Synthesis of key results and implications 13
Fig. 6. Rice suffi ciency during normal and stress years.
100
90
80
70
60
50
40
30
20
10
0
Percentage of households with rice suffi ciency
Purulia
Normal year
Normal and stress year
Stress year
Nadia
100
Labor participation (%)
90
80
70
60
50
40
30
20
10
0Orissa(India)
Chhattisgarh(India)
West Bengal(India)
Assam(India)
Bangladesh
Location
Nepal
FemalesMales
Fig. 7. Labor participation by gender in rice production.

14 D. Gauchan and S. Pandey
Women’s role in decision making in rice farming and broader livelihood activi-ties was analyzed using the Women’s Empowerment Index (WEI, see Chapter 2 for details). The index was computed for 16 gender-related indicators of decision making, with a higher value of the index indicating a greater role of women in making that decision. The results indicate that gender roles, responsibilities, and decision-making patterns in rice farming across sites in South Asia are similar, with men making major decisions solely or in consultation with women members in matters related to vari-ety choices, farming, income, marketing, and other household livelihood activities. Women’s participation and decision-making roles are found to be limited and confi ned to decisions mostly related to food consumption and some household management.
Potential farm-level impact of the adoption of improved stress-tolerant rice varietiesStress-tolerant improved varieties that reduce losses in rice production under stress conditions will generate a farm and aggregate-level impact as adoption spreads. Sev-eral varieties that have tolerance of submergence have been developed through the introgression of the SUB1 gene in popular mega-varieties in South Asia. Similarly, improved varieties with some degree of drought tolerance and tolerance of salinity have also been developed. The seeds of these improved varieties are now being multiplied and distributed widely to rice farmers in South Asia. The dissemination program is described in detail elsewhere. The potential impact of these varieties in terms of income of farm households is assessed here. This is based on the data regarding the seed quantities being made available to farmers and the likely adoption patterns up to 2014. This initial ex ante impact assessment covering 2011-14 is conducted by considering the impact on farm-ers’ income only.2 The variety considered is Swarna-Sub1, a submergence-tolerant variety similar in all aspects to the currently popular and widely grown Swarna in South Asia. The benefi cial effects considered in this ex ante impact assessment are the reduced production losses in years with submergence and the additional cost of re-transplanting avoided when farmers have no choice but to re-transplant rice because of submergence. The cumulative undiscounted benefi t over the period 2011-14 relative to the counterfactual in which no Swarna-Sub1 varieties are available is estimated to be US$380 million or $95 million per year on average. This is the total value of economic gain considering all submergence-prone areas in the three countries of South Asia. The benefi t is the sum of the yield loss prevented due to submergence assuming the submergence probability of 0.3 and considering the avoided cost of re-transplanting when the established crop is damaged by submergence. The latter component, however, accounts for about 5% of the total benefi t only. The estimated benefi t of $380 million is the average value considering both submergence and nonsubmergence years. The value of production loss avoided in submergence years will be considerably higher
2For brevity, the potential impact on consumers through lower rice prices that might result from in-creased and more stable production has not been considered in this initial analysis.

Synthesis of key results and implications 15
than this average value, suggesting that the potential impact of submergence-tolerant varieties on farm income can indeed be very large.
Conclusions and implications
• Improved varieties have generally spread in stress-prone areas but most of these improved varieties are of “older” vintage (defi ned here as varieties released before 1990). Some of these older vintage varieties occupy substantial area and are often known as mega-varieties. These mega-varieties generally have wide adaptability, desirable grain quality characteristics, and well-established marketing/processing channels.
• Field hydrology (as indicated by different “land types” such as upland, medium land, and lowland) is a key determinant of the adoption of improved variet-ies (irrespective of vintage) across sites and stress situations. Differences in the endowment of land types across households are the key determinants of cross-sectional variations in adoption.
• Yield and profi tability effects of MV adoption are greater when farmers switch from TVs to MVs but such effects are not apparent when they switch from older to “newer” generation MVs (defi ned here as those improved rice varieties that were released after 1990). This indicates that available new-generation rice varieties are not distinctly superior in yield and profi tability across most stress-prone environments where older generation mega-varieties such as Swarna and BR-11 are widely grown.
• The dominance of the mega-variety Swarna in eastern India and BR-11 in Bangladesh in stress-prone rainfed environments provides a good justifi cation for the strategy followed by STRASA of incorporating SUB1 and other stress-tolerance genes in these mega-varieties. This strategy is likely to increase the impact domain and the magnitude of impact by accelerating adoption.
• Even in rainfed areas of Asia, rice production is not always the most important source of income of farm households, indicating that other livelihood strate-gies have evolved over time. Other livelihood options such as the production of a nonrice crop and employment in a nonfarm sector are becoming increas-ingly important. This indicates that future assessments of rice technologies must take into account not just yield per hectare but the overall contribution to farmer income.
• Increasing farmers’ awareness of new stress-tolerant rice varieties can be ex-pected to increase the adoption rate. This requires strengthening of extension and demonstration programs to promote and popularize the new generation of rice varieties suited to rainfed conditions. Similarly, farmers’ training and capacity-building programs are needed to further enhance rapid varietal spread.
• The household-level consequences of a loss in rice production due to abiotic stresses are substantial, with poor farmers being pushed back into high food insecurity and vulnerability, particularly in locations where alternative options for livelihood are limited. Rice varieties and technologies that provide protec-
16 D. Gauchan and S. Pandey
tion from such key stresses need to be targeted for these locations to reduce food insecurity and vulnerability.
• Overall, women’s empowerment across all sites in South Asia is limited. There is a need to empower women, who supply farm labor for rice production, to enable them to have faster access to information and new technologies. Women’s empowerment for enhancing participation in decision making is equally important for promoting rapid technology adoption.
• Technological development and dissemination strategies in stress-prone en-vironments need to consider the heterogeneity and complexity of the stress situations in South Asia. Farmers own and cultivate heterogeneous land types that are prone to different types and intensity of stresses. As it may be diffi cult to incorporate multiple abiotic stress tolerance in a single variety, a logical approach would be to develop multiple varietal options to enable farmers to choose those varieties that best meet their livelihood requirements given the nature of their resource endowments.
• Development and dissemination of stress-tolerant technologies should be targeted to those farmers in stress-prone rainfed locations where farmers’ food security and livelihood depend on single-season rice cropping as such households are more vulnerable to crop failures during stress years.
References
BBS (Bangladesh Bureau of Statistics). 2005. Report of Household Income and Expenditure Survey (HIES). Dhaka (Bangladesh): BBS. www.bbs.gov.bd.
CBS (Central Bureau of Statistics). 2008. Statistical year book of Nepal. Kathmandu (Nepal): National Planning Commission.
Dawe D, Pandey S, Nelson A. 2010. Emerging trends and spatial patterns of rice production. In: Pandey S, Byerlee D, Dawe D, Dobermann A, Mohanty S, Rozelle S, Hardy B, editors. Rice in the global economy: strategic research and policy issues for food security. Los Baños (Philippines): International Rice Research Institute. p 15-35.
FAOSTAT. 2010. FAO STAT on-line database on different commodities. FAO (http://faostat.fao.org/site/339/default.aspx).
IRRI (International Rice Research Institute). 2010. A Global Rice Science Partnership (GRiSP). Proposal for a Consortium Research Program, revised draft: 25 June 2010. CGIAR Thematic Area 3: Sustainable crop productivity increase for global food security. Los Baños (Philippines): IRRI.
Pandey S, Paris T, Bhandari H. 2010. Household income dynamics and changes in gender roles in rice farming. In: Pandey S, Byerlee D, Dawe D, Dobermann A, Mohanty S, Rozelle S, Hardy B, editors. Rice in the global economy: strategic research and policy issues for food security. Los Baños (Philippines): International Rice Research Institute. p 93-111.
Synthesis of key results and implications 17
Notes
Authors’ addresses: D. Gauchan, Socioeconomics & Agricultural Research Policy Division, Nepal Agricultural Research Council (NARC), P.O. Box 5459, Kathmandu Khumaltar, Lalitpur, Nepal; S. Pandey, Social Sciences Division, International Rice Research Institute, Los Baños, Philippines, respectively.

18 D. Gauchan and S. Pandey

Methodological framework 19
Methodological framework
Chapter 2

20 D. Gauchan and S. Pandey
Methodological framework 21
Methodological framework
The framework of this study involves a cross-site comparative analysis of technology adoption and livelihood of rice farmers in rainfed areas affected by submergence, drought, and salinity in South Asia. Three countries are involved in the report: Ban-gladesh, India, and Nepal. Synthesis reports for Bangladesh and Nepal and for selected states of eastern India were prepared separately. Key syntheses of the overall fi ndings were prepared broadly across sites and stresses together.
Research approach
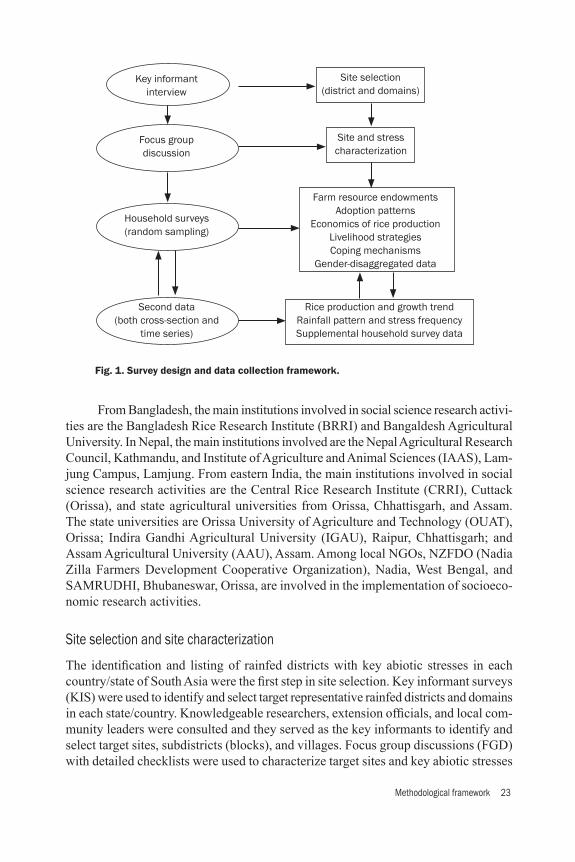
This study employed a standardized data collection framework across sites to collect reliable, high-quality, and comparable data. A combination of household survey and rural appraisal (focus group discussion, key informant survey) methods was used to collect, complement, and triangulate fi eld data across the sites. The research was implemented in collaboration with 10 NARES (national ag-ricultural research and extension system) partners at 19 sites (districts) in South Asia (India, Bangladesh, and Nepal) covering 60 villages representing drought, submer-gence, and salinity stresses in rainfed areas (Table 1). Both primary and secondary data were used to characterize the rice production systems and analyze livelihood situations and the pattern and economics of modern variety adoption (Fig. 1). The collection of primary data was based on the use of detailed household surveys and rapid rural appraisal methods. Secondary aggregate-level data were obtained from government statistical offi ces for national and subnational levels. They were analyzed to under-stand broad agricultural and rice production situations nationally and subnationally (state and districts), trends in rice production growth, and historical trends of stress incidence and intensity. The details of the methods and approaches employed for the study are briefl y outlined in the following sections.
Research implementation through partnerships with NARES social scientists
The research was implemented in close collaboration and partnership with NARES social scientists in South Asia. The objectives were twofold: to collect reliable and quality benchmark information in a cost-effective manner and, at the same time, en-hance the capacity of NARES social scientists. Research activities were implemented by developing new collaboration and expanding partnership with diverse NARES social scientists and their affi liated institutions representing government research institutes, universities, and NGOs. The list of the lead NARES institutions involved in the collaborative research activities in South Asia with the key abiotic stresses, survey districts, and sample villages is presented in Table 1.
D. Gauchan and S. Pandey

22 D. Gauchan and S. Pandey
Table 1. Lead NARES institutions, states, survey districts, and villages in South Asia.
Country and state
Institutiona Key stresses Surveyed districts
Sample villages
Bangladesh
BRRI Submergence Kurigram Hardanga and Fulbari
Submergence Habibganj Suraboi, Nurpur, Purasanda
Salinity Satkhira Atulia, Beajua, Biralaxmi,Hogla, Joypotrokati, Sreedharkati
Drought Rajshahi Agolpur, Balia Dung, Biroil, Borgitola, Dolia para, Edulpur, Gi-olmari, Gohomabona, Jaoipara, Kamlapur, Lalmatia, Malompara, Norsingor Adorsho, Shahana para, Shreerampur
BAU Submergence Jamalpur Titpala, Sonkatta
Nepal
NARC Drought Siraha Baluwa
Drought Banke Puraina, Parbatipur
IAAS Drought Tanahun Bhansar, Purkot
India
Chhattisgarh IGAU Drought Raipur Khairkunt, Saguni, Sankara, Tarpongi
Orissa
OUAT Drought Dhenkanal Kankadapala, Kalanga
Drought Balangir Solbandha, Telenpalli
CRRISamrudhi
SubmergenceSalinity
JajpurKendrapara
Nuagaon, SakuntalapurTilachi, Sikhar
Salinity Bhadrak Khamasi, Bahu
West Bengal
NZFDO
SubmergenceDroughtSalinity
NadiaPurulia24 North Parganas
Byaspur, Ekperepara, ShibpurDhuliapara, Ghastoria, KumardihDarirjungal, Kumarjole
Assam AAU SubmergenceSubmergence
SibsagarGolaghat
Gorkasoria, MogorhatKendugiri, Mithamchapori
Total 10 NARES 3 stresses 19 districts 60 villages aBRRI = Bangladesh Rice Research Institute; BAU = Bangladesh Agricultural University; NARC = Nepal Agricultural Research Council; IAAS = Institute of Agriculture & Animal Sciences;IGAU = Indira Gandhi Agricultural University; AAU = Assam Agricultural University; OUAT = Orissa University of Agriculture & Technology; CRRI = Central Rice Research Institute; NZFDO = Nadia Zilla Farmers Development Cooperative Organization.
Methodological framework 23
From Bangladesh, the main institutions involved in social science research activi-ties are the Bangladesh Rice Research Institute (BRRI) and Bangaldesh Agricultural University. In Nepal, the main institutions involved are the Nepal Agricultural Research Council, Kathmandu, and Institute of Agriculture and Animal Sciences (IAAS), Lam-jung Campus, Lamjung. From eastern India, the main institutions involved in social science research activities are the Central Rice Research Institute (CRRI), Cuttack (Orissa), and state agricultural universities from Orissa, Chhattisgarh, and Assam. The state universities are Orissa University of Agriculture and Technology (OUAT), Orissa; Indira Gandhi Agricultural University (IGAU), Raipur, Chhattisgarh; and Assam Agricultural University (AAU), Assam. Among local NGOs, NZFDO (Nadia Zilla Farmers Development Cooperative Organization), Nadia, West Bengal, and SAMRUDHI, Bhubaneswar, Orissa, are involved in the implementation of socioeco-nomic research activities.
Site selection and site characterization
The identifi cation and listing of rainfed districts with key abiotic stresses in each country/state of South Asia were the fi rst step in site selection. Key informant surveys (KIS) were used to identify and select target representative rainfed districts and domains in each state/country. Knowledgeable researchers, extension offi cials, and local com-munity leaders were consulted and they served as the key informants to identify and select target sites, subdistricts (blocks), and villages. Focus group discussions (FGD) with detailed checklists were used to characterize target sites and key abiotic stresses
Key informantinterview
Site selection(district and domains)
Site and stresscharacterization
Farm resource endowmentsAdoption patterns
Economics of rice productionLivelihood strategiesCoping mechanisms
Gender-disaggregated data
Rice production and growth trendRainfall pattern and stress frequencySupplemental household survey data
Focus group discussion
Household surveys(random sampling)
Second data(both cross-section and
time series)
Fig. 1. Survey design and data collection framework.

24 D. Gauchan and S. Pandey
(Fig. 1). A target site (location) representing a specifi c stress domain was selected from each district covering more than one village or a cluster of villages that represent rainfed stress-prone environments. The proportion of rainfed rice area and severity of the abiotic stress were the main criteria used for selecting target districts and sites (locations). During the site selection phase, emphasis was given to identifying and selecting representative sites covering the broader spatial variability and diversity of stress-prone domains. As much as possible, the villages with participatory varietal selection (PVS) trials were included to enable linking with the varietal testing work as well as capturing the diversity of socioeconomic domains in the districts. In Bangladesh, fi ve districts from different regions with different stress types (submergence, drought, salinity) covering the northern, eastern, and southern coastal belts were selected for the study. However, special emphasis was given to submer-gence stress by selecting three submergence-prone districts. Similarly, for Nepal, three districts representing the eastern and western Terai and Hill ecological regions were selected to capture the spatial and socioeconomic diversity of the rainfed drought-prone environments. In India, four states of eastern India with the highest proportion of rain-fed stress-prone environments were selected and the sites characterized in partnership with NARES. These included fi ve districts of Orissa, one district of Chhattisgarh, three districts of West Bengal, and two districts of Assam. In Orissa and West Bengal, all three types of abiotic stresses were considered when selecting the sites. Table 2 lists the districts selected with the key abiotic stresses and sample sizes.
Design of survey instruments
A standard framework with a different set of questionnaires and checklists was used for each stress, drought, submergence, and salinity, while capturing the differential nature, infl uences, and effects of each stress on rice production and livelihood of farmers. We designed a structured household survey method to collect detailed data on farmers’ socioeconomic information, resource endowment, livelihood situation, land use, rice production practices, technology use and choices, input-output data, income sources, awareness of stress-tolerant rice varieties, coping strategies, and gender participation. The focus of the household survey was to generate baseline
Table 2. Key stress, sites (districts), and sample size by country in South Asia.
Key stress No. of sitesCountry Sample size
(no. of households)Indiaa Bangladesh Nepal
Drought 8 4 1 3 800
Submergence 7 4 3 0 700
Salinity 4 3 1 0 408
Total sites 19 11 5 3 1,908aThe sample survey was implemented in four states of eastern India: Orissa, Chhattisgarh, West Bengal, and Assam.
Methodological framework 25
information on patterns of technology adoption, economics of rice production, and productivity situations, including the nature of their coping mechanisms to deal with abiotic stresses. In addition, emphasis was given to collecting detailed information on costs-returns, sources and components of farm and nonfarm income, and farmers’ livelihoods. Special consideration was given to collecting gender-disaggregated data to capture differential roles, livelihood opportunities, and needs and priorities of men and women farmers. In addition to detailed household questionnaires, a short checklist was also prepared separately for key informant surveys and focus group discussions to docu-ment information related to key biophysical and socioeconomic features of the sites, farmers’ livelihood situations, rice production systems, technology use and nature, and the magnitude and frequency of the key abiotic stresses that affect rice production at the target sites. After the development of draft survey instruments for the household survey and rapid rural appraisals, a training workshop was organized at the Central Rice Research Institute (CRRI), Orissa, on 16-18 October 2008 to orient NARES partners on data collection and survey implementation and get feedback on the revi-sion of the draft survey instruments. During the training workshop, questionnaires and checklists for each stress were thoroughly reviewed, checked, and revised with the lead NARES partners. Each NARES lead partner, after returning to the respective institution, further revised and pretested the questionnaire to suit the local context and improve the consistency and completeness before actual implementation of the survey.
Household survey implementation
A sampling framework was developed to select sample farmers at each site and in villages. Secondary information on specifi c districts, target domains, subdistricts, and villages was reviewed thoroughly for developing a sampling framework. FGD and KIS methods as mentioned above were also used to develop a sampling framework for the detailed household survey. A random sampling framework was used to select households from purposefully selected villages from the target stress-prone environ-ments (Fig. 1). A total of 100 sample farmers were interviewed from selected villages for each site in drought- and submergence-prone environments. Unlike the probabilistic occurrence of drought/submergence, salinity is prevalent year-round and regular in a specifi c area. Therefore, in order to measure the effect of salinity, two villages were selected purposefully: one village representing a saline-prone area and the other vil-lage representing a nonsaline area (or “control” village). The nonsaline area (control village) was selected from nearby places with similar agroecological, socioeconomic, and rice production situations but not affected by salinity. From each of these villages, 50 households were randomly selected for the survey. The respondents interviewed are the household head or household principal male or female members who directly manage the farm. The survey was implemented starting in November 2008 and completed in March-April 2009. Multiple visits were made to collect missing information and to cross-check and remove inconsistencies and ambiguity. The data were collected for the cropping year 2008.
26 D. Gauchan and S. Pandey
Data management, processing, and analysis
Survey data were compiled, managed, cleaned, and validated by developing a stan-dard database management system in MS Access. The database management system was developed, tested, and refi ned to make it user-friendly for data entry, cleaning, validation, and management in a standard framework across the sites and countries. A training workshop on data compilation, processing, and management was held in Orissa (OUAT) on 12-14 April 2009 to improve documentation and validation of the data collected by the partners. Data cleaning and validation involved several rounds of review from IRRI re-source persons and subsequent updates of the data sets by the lead NARES partners. A data analysis framework was developed and validated data sets were analyzed by linking MS Access with Excel using Access queries and Pivot tables. Key summary tables were prepared for each section for summarizing the fi ndings of the survey for each site. The STATA statistical package was used for econometric analyses of the factors determining the adoption of modern varieties at the study sites.
Analytical framework
Analysis of growth rate and trendThe annual growth rate for rice area, production, and yield for the STRASA countries in South Asia was estimated using a semi-log trend equation from the time-series data obtained from national statistics. The compound growth rate was estimated for each decade from 1970 to 2008. Before fi tting the trend equation for each period and the overall growth rate, estimation data were smoothed using a fi ve-year moving-average process.
Analysis of MV adoption pattern by type and generationThe adoption of improved varieties was measured by two indicators: the proportion of farmers growing modern varieties (incidence) and the proportion of area under modern varieties at a given time (intensity). The adoption of modern varieties (MVs) in terms of percent area and percent farmers growing them was estimated and compared across sites, stress situations (drought vs. submergence), and countries/states. Varietal adoption patterns were also analyzed in terms of farmers growing MVs only, TVs (traditional varieties) only, and a combination of both MVs and TVs for each location. Two sets of analysis were prepared based on the nature of the data sets and fi ndings of the descriptive analysis. For some locations (e.g., Orissa), where MV adoption is relatively low (where many farmers still grow TVs), the usual analysis of adoption was carried out where the choice set is MV vs. TV. However, for several other locations, where MV adoption has already approached a ceiling value, the problem analyzed was the replacement of old MVs by new MVs. The choice set was a new generation of MVs over an older generation of rice varieties. The objective here was to understand more about the type and generation of MVs (new or old) that farmers
Methodological framework 27
are adopting. For analyzing the specifi c adoption pattern of new MVs, we classifi ed existing MVs adopted by farmers into two groups, those that were released before 1990 were considered as “old generation” and those that were released after 1990 were considered as “new generation.” The adoption percentage in terms of area and farmers growing both new- and old-generation MVs was also estimated and compared across sites.
Yield effects of MV adoptionYield gains of MVs over TVs as well as new MVs over older MVs were estimated and compared across locations by both land type and season. The comparisons were also made across stress situations, countries, and states in India to identify the effect of MV adoption on the rate of yield gains in different stages of adoption.
Cost-return analysis and profi tability effectYield and detailed input-use data from intensive data plots obtained from household surveys were used to analyze the costs and returns of rice production by variety type (e.g., MV vs. TV, new vs. old MVs) for different seasons. Both grain and straw yields were used for the estimation of value of output. Costs were estimated from the material inputs (seeds, chemical and organic fertilizers, irrigation, and pesticide use), labor use, and power use (animal and mechanical, e.g., tractors). Farm-gate prices of outputs and inputs obtained from household surveys were used in the revenue and cost estimation. Estimation of both cash and noncash costs (imputed value of family-owned resources, e.g., family labor, farm-produced seeds, farmyard manure, etc.) was made and used in the cost-return analysis. Profi tability in terms of both returns above cash costs and total costs was analyzed for each site and compared across sites and countries.
Econometric analysis: determinants of MV adoptionEconometric analyses were carried out to study the various factors infl uencing the adoption of MVs using household survey data. Censored regression (tobit and probit) models were considered suitable for adoption studies in our context because of the censored nature of the data as there were a number of farmers with zero adoption at the limit. Two sets of analyses were prepared. In the fi rst analysis, the focus was the factors that determine the differential adoption of modern varieties across fi elds and households. The focus of the second analysis was to investigate the factors determin-ing farmers’ decisions to adopt new-generation rice varieties given the situation that farmers have already adopted an older generation of MVs. We hypothesized that various household-, farm-, and fi eld-specifi c and institutional variables determine the adoption of new-generation MVs. Analyses of adoption were conducted at both the plot level and farm level. For the fi rst set of analysis, the dependent variable for the tobit model (for farm-level analysis) was the share of rice area allocated to MVs where many farmers are growing both MVs and TVs (e.g., some locations in Orissa).

28 D. Gauchan and S. Pandey
For the probit model (plot-level analysis), the dependent variable was a dichotomous variable, which was specifi ed as whether MVs are grown or not at the plot level. For the second set of analysis covering locations where MV adoption has reached a ceil-ing, the dependent variable for the tobit model was the share of MV area allocated to new-generation MVs, whereas, for the probit model, the choice set was the adoption of new-generation MVs at the plot level. Probit and tobit models are described below.
The probit modelA probit analysis was used to explain the adoption and nonadoption of MVs at the plot level. The dependent variable in the probit model is the dichotomous adoption variable that takes value 1 for MV adopters and 0 for nonadopters at the plot level. The model was specifi ed as
Y* = X + u
where Y* is the unobserved underlying stimulus index of the adoption of new modern varieties and Y is the (n × 1) observable dependent variable, which is equal to 1 if the plot is planted to a new-generation modern variety and 0 otherwise, is the (k × 1) vector of unknown parameters, X is the (n × k) vector of exogenous or predetermined variables, and u is the residual where ),0(~ 2INu .
Tobit modelA censored regression model (tobit) was used to study the extent of adoption of modern varieties as the data sets are continuous and censored at zero (lower limit). A censored regression model is suitable here as it uses all observations, both those at the limit, usually zero (e.g., nonadopters), and those above the limit (e.g., adopters), to estimate a regression line.
The model is defi ned as
Y = X + u, if X + u >0; = 0, otherwise
where Yi is the (n × 1) vector of the dependent variable, which is expressed as the share of total rice area of a household under modern varieties or the share of MV area under new-generation rice varieties depending on the type of analysis, is the (k × 1) vector of unknown parameters, Xi is the (n × k) vector of exogenous and predetermined variables, and u is the residual where ),0(~ 2INu . Table 3 presents the defi nitions of variables and hypothesized effects on adoption of MVs. Several variables are hypothesized to determine a farmer’s decision to adopt a new technology. A survey of empirical studies of technology adoption indicates that a range of fi eld, farm, farmer characteristics, and institutional variables, including
otherwise
YifY
00*1
otherwise
YifY
00*1

Methodological framework 29
farmers’ perceptions of technology attributes, infl uences the probability and rate of adoption (Feder et al 1985, Adesina and Zinnah 1993, Bellon and Taylor 1993, Traxler and Byerlee 1993, Adesina and Seidi 1995, Kshirsagar et al 2002, Sall et al 2000, Doss 2006, Langyintuo and Mungoma 2008). These factors include household demographic characteristics (age, education, and household size), gender of the decision makers, land type, farm size, and access to information, awareness level, and participation in training and local farmers’ organizations, which are briefl y described below. Household demographic characteristics. Household-specifi c variables such as age, education, and household size affect adoption decisions through preferences, experiences, knowledge, and family labor available for the adoption of a new technol-ogy. Younger farmers may be more receptive to new technology and hence more likely to experiment with new rice varieties. On the other hand, an older farmer may have greater experience with farming, and thus may have more ability to make the right decisions on the adoption of new technology (Bellon and Taylor 1993, Langyintuo and Mungoma 2008). Household size is a proxy for labor stock available, which will enhance the adoption of a new technology that may need more care and may be more labor intensive (Doss 2006). Education helps with the ability to understand and manage new and unfamiliar technology, which may increase willingness to try out new ideas and experiment with
Table 3. Defi nitions of variables and hypothesized effects of adoption for new MVs.
Type of variable Variable defi nition
Dependent variables Grow NMV
Grow new-generation MVs from total MVs at the plot level (yes = 1; otherwise = 0)
Probit model
NMV share Share of new-generation MVs in total MV rice area Tobit model
Explanatory variables
Hypothesized effect
Farm size Cultivated area of the farm (ha) (+, –)
Adult household size Household members >15 years old (+)
Age Age of the household head in years (+, –)
Education Education of the household head in years (+, –)
Gender decisions Gender of the decision maker who chooses rice varieties to grow (male only = 1; otherwise = 0)
(+)
Land type Lowland (yes = 1; otherwise = 0) (+)
Lowlandpct Percent area under lowland (+)
Market distance Distance to nearest market (km) (–)
Training and organization
Participation in training and farmers’ organization (yes = 1; otherwise = 0)
(+)
Awareness Awareness of new stress-tolerant varieties (yes = 1; otherwise = 0)
(+)

30 D. Gauchan and S. Pandey
new rice varieties. However, more education may also have a negative effect on adop-tion since highly educated farmers are more expected to work off the farm, ceteris paribus, as human capital accumulated through longer years of formal education becomes an advantage for fi nding more lucrative off-farm employment opportunities, which makes farming relatively less attractive (Umatsu and Mishra 2010). Farm size and farm land characteristics. Farm size may have both positive and negative effects on the adoption of new MVs. Larger farmers may adopt new technolo-gies faster since they have more ability to experiment with new varieties due to their higher risk-bearing ability, better fi nancial resources, and larger size of landholdings (Doss 2006, Langyintuo and Mungoma 2008). On the other hand, it may have a nega-tive effect since smaller farmers are likely to be more motivated in searching for new technology due to their subsistence pressure and they may be willing to accept newer varieties in changing circumstances. In the rainfed heterogeneous environments, farmers grow different rice varieties to match different land types or toposequences of fi elds based on fi eld hydrology and soil quality (Bellon and Taylor 1993). Therefore, an endowment of favorable-quality land is important in the adoption of modern varieties. Farmers are likely to grow new-generation MVs on preferred land types (lowland, medium land, or upland) that provide more favorable hydrological conditions for crop growth. Gender participation in the choice of rice varieties. A dummy variable for gen-der is used to capture women’s participation in decision making about a rice variety to grow. We hypothesize that decisions related to choice of new rice technology are made solely by the principal male member, who is normally the household head. In the South Asian context, many such decisions are made by male members who are the main decision makers in farming and they have more control over household resources due to the patriarchal nature of the society and prevailing male-dominated culture. Market distance. Market distance is considered a proxy for farmers’ access to input and output markets. Households that are far from the market are less likely to adopt MVs because of their poor access to new seeds, high search costs, and high transaction cost for selling surplus product from the adoption of new technologies. In Andean potato agriculture, Brush et al (1992) found proximity to markets to be positively associated with the adoption of modern varieties. Awareness of stress-tolerant rice varieties. Farmers’ level of awareness of new rice varieties reduces the fi xed cost of adoption and uncertainty of the expected output of the new technology. Since some of the new-generation stress-tolerant rice variet-ies (e.g., Swarna-Sub1 and Sahabhagi dhan) are already being promoted at the sites, awareness of these rice varieties will help to determine the probability and intensity of adoption. Participation in training and membership in local farmers’ organizations. Par-ticipation of farmers in agricultural and rural income-generating training programs and participation in local farmers’ organizations increase the likelihood of adopting new-generation MVs. The literature indicates that training provides more knowledge, information, and skills to adopt new technologies (Doss 2006). Similarly, participa-
Methodological framework 31
tion in local farmer organizations such as cooperatives and community and farmers’ groups is directly related to adoption behavior because cooperatives provide informa-tion and access to credit and new technologies. A dummy variable is used to test the probability and intensity of adopting new-generation MVs by combining training and organizational variables.
Estimation of household income structure
Total household income is estimated by combining gross income obtained from rice, nonrice crops, and other various farm and nonfarm activities that the households derived earnings from during the study period (2008). Gross income for rice and nonrice crops was estimated from the value of total produce on the farm and then it was combined by summing the value of all goods (e.g., livestock income) and services (labor income) produced on the farm, off-farm, and in nonfarm activities to estimate total household income. The major components of total household income are farm, off-farm, and nonfarm income. Farm income constitutes the gross income obtained from rice, nonrice crops, and livestock. Off-farm income constitutes the income earned by the household as farm labor. Nonfarm income is the income arising from nonagricultural labor and nonfarm employment activities, including remittances.
Gender analysis and the Women’s Empowerment Index
Gender analyses in terms of women’s participation and decision making related to rice production and overall livelihood activities were carried out using gender-dis-aggregated data collected from the household surveys. The Women’s Empowerment Index (WEI) was computed using 16 gender-related indicators to document the status of women’s empowerment at the study sites. The index was computed using the ap-proach described by Hossain et al (2004) and Paris et al (2008).
Report preparation and fi nalization
Separate reports were fi rst drafted by each NARES center based on the analyzed summary tables provided from the IRRI STRASA team. These reports were reviewed and revised by organizing a “writeshop” program at IRRI-Los Baños in May 2010. In addition, this activity was used for sharing initial results of the survey and for receiving feedback on the draft reports and data sets from the partner lead scientists and IRRI resource persons. Based on the feedback and comments, individual draft reports of the NARES centers were revised at IRRI. The revised individual reports were integrated at the country level (e.g., Bangladesh and Nepal) and at the state level for India for the cross-site comparison and synthesis. Finally, a short synthesis report for South Asia was prepared by integrating relevant information from individual country/state reports to draw key conclusions and derive implications for future research.

32 D. Gauchan and S. Pandey
Organization of the report
This report presents a synthesis of the fi ndings of 19 locations (districts) covering 1,900 households representing 11 sites from India, 5 sites from Bangladesh, and 3 sites from Nepal. The report is organized into three major sections representing three countries of South Asia, Bangladesh, Nepal, and India. For India, the report is further subgrouped by state (Assam, West Bengal, and Orissa + Chhattisgarh). Each country and state report includes a synthesis of different sites and stresses of the country, with details of farm-level analysis, including a broader overview of the rice production situation at the national and state level. Individual country reports have subsections with country/state background, site and stress characterization, details of farm-level analyses focusing on the socioeconomics of rice production and livelihoods, modern variety adoption, farm-level yield effects of MV adoption, economics of rice produc-tion, household income analyses, farmers coping strategies, including gender roles and participation in decision making, and women’s empowerment situation.
References
Adesina AA, Zinnah MM. 1993. Technology characteristics, farmers’ perceptions and adoption decisions: a Tobit model application in Sierra Leone. Agric. Econ. 9:297-311.
Adesina A, Seidi S. 1995. Farmers’ perceptions and adoption of new agricultural technology: analysis of modern Mangrove rice varieties in Guinea-Bissau. Quart. J. Int. Agric. 34:358-385.
Bellon M, Taylor JE. 1993. “Folk” soil taxonomy and the partial adoption of new seed varieties. Econ. Dev. Cultural Change 41:763-786.
Brush SB, Taylor JE, Bellon MR. 1992. Biological diversity and technology adoption in Andean potato agriculture. J. Dev. Econ. 39:365-387.
Doss CR. 2006. Analyzing technology adoption using micro-studies: limitations, challenges, and opportunities for improvement. Agric. Econ. 34:207-219.
Feder G, Just RE, Zilberman D. 1985. Adoption of agricultural innovations in developing countries: a survey. Econ. Dev. Cultural Change 33:255-298.
Hossain M, Bose ML, Ahmad A. 2004. Nature and impact of women’s participation in economic activities in rural Bangladesh: insights from household surveys. CPD-IRRI, Policy Brief 7. Dhaka (Bangladesh): International Rice Research Institute.
Herdt RW, Capule C. 1983. Adoption, spread and production impact of modern rice varieties in Asia. Los Baños (Philippines): International Rice Research Institute.
Kshirsagar KG, Pandey S, Bellon MR. 2002. Farmer perceptions, varietal characteristics and technology adoption: the case of a rainfed rice village in Orissa. Econ. Polit. Weekly 37(13):1239-1246.
Langyintuo A, Mungoma C. 2008. The effect of household wealth on the adoption of improved maize varieties in Zambia. Food Policy 33:550-559.
Paris T, Singh A, Cueno A, Singh VN. 2008. Assessing the impact of participatory research in rice breeding on women farmers: a case study in eastern Uttar Pradesh, India. Exp. Agric. 44:97-112.
Sall S, Norman D, Featherstone AM. 2000. Quantitative assessment of improved rice variety adoption: the farmer’s perspective. Agric. Syst. 66:129-144.

Methodological framework 33
Traxler G, Byerlee D. 1993. A joint-product analysis of the adoption of modern cereal varieties in developing countries. Am. J. Agric. Econ. 75:981-989.
Umatsu H, Mishra AK. 2010. Net effect of education on technology adoption by U.S. farmers. Selected paper prepared for presentation at the Southern Agricultural Economics As-sociation Annual Meeting, Orlando, FL, 6-9 February 2010, USA.
Notes
Authors’ addresses: D. Gauchan, Socioeconomics & Agricultural Research Policy Division, Nepal Agricultural Research Council (NARC), P.O. Box 5459, Kathmandu Khumaltar, Lalitpur, Nepal; S. Pandey, Social Sciences Division, International Rice Research Institute, Los Baños, Philippines, respectively.

34 D. Gauchan and S. Pandey

Patterns of adoption of improved rice varieties...of Nepal 35
Patterns of adoption of improved rice varieties and farm-level impacts in stress-prone rainfed areasof Nepal
Chapter 3

36 D. Gauchan et al
Patterns of adoption of improved rice varieties...of Nepal 37
Patterns of adoption of improved rice varieties and farm-level impacts in stress-prone rainfed areas of Nepal
Introduction
Country backgroundNepal is a small landlocked mountainous country with diverse agroecologies, culture, and agriculture. Agriculture is the mainstay of the economy, providing livelihood to more than two-thirds of the population and accounting for one-third of the GDP (MoAC 2009). The population growth rate is high (2.0%), with about 28 million people in a land area of 147,181 km2. Its unique topography lies between the southern lap of the Himalayas, bordering with India in the south and the People’s Republic of China in the north. The altitudes in the country vary dramatically, from a minimum of 60 m in the lowlands (e.g., Kechana, Jhapa District) to a maximum of 8,848 m (Mount Ever-est) in the Himalayas, including seven of the ten highest mountain peaks in the world. Geographically, the country is divided into three ecological regions: Mountain, Hill, and Terai, accommodating 7.3%, 44.3%, and 48.4% of the population (CBS 2001). Annual rainfall varies from about 250 mm in rain-shadow areas such as the Mustang valley to over 5,200 mm in the Pokhara valley. Over 80% of the annual rainfall occurs during the four months of the monsoon season, which lasts from June to September. Rice is the most important food crop in the country in terms of area, production, and livelihood of the people. It is currently grown on about half of the total cropped area and it provides livelihood for more than two-thirds of the farm households in the country. Rice also supplies about 40% of the food calorie intake for the people of Nepal. However, despite its importance in national food security and the economy, currently, a majority of the farmers in Nepal produce their rice crop mainly under rainfed and risk-prone marginal conditions, in which drought is a major constraint to increasing production and improving rural livelihoods. This report is the outcome of a baseline socioeconomic survey carried out under the Objective 7 (Impact assessment and targeting) component of the STRASA project. The specifi c objectives of the study follow.
D. Gauchan, H.K. Panta, S. Gautam, and M.B. Nepali

38 D. Gauchan et al
Objectives• To assess farmers’ livelihood systems in the selected drought-prone environ-
ments.• To analyze the patterns of varietal adoption and the factors infl uencing the
adoption of modern rice varieties.• To analyze the economics of rice production by the type of variety.• To document strategies of farmers to cope with drought stress.• To understand gender roles in rice production and women’s participation in
decision making.• To serve as a baseline for rice technology design, targeting, and policy reforms
in stress-prone areas.
Organization of the reportThis report is organized into six major sections. The fi rst section gives a general background on the country and the objectives of the study. This is followed by a short description of research design and data generation. The third section gives a brief description of the broader trends in rice production in Nepal using national-level time-series data. The fourth section provides a general description of the survey sites and stress situations using information gathered from focus group discussions and key informant surveys. Section fi ve provides a farm-level analysis of the socioeconomic survey describing the livelihoods of farmers, adoption patterns, economics of rice production, consumption patterns, coping strategies, and gender analysis. The fi nal section provides a summary of the fi ndings and implications.
Research design and data generation
This research was implemented in close collaboration and partnership with the So-cioeconomics and Agricultural Research Policy Division (SARPOD) of the Nepal Agricultural Research Council (NARC), Kathmandu, and Institute of Agriculture and Animal Sciences (IAAS), Lamjung Campus, Lamjung. Data for this study were collected by combining rapid rural appraisals methods, secondary sources, and spe-cifi cally designed household surveys from three representative rainfed rice-producing locations of Nepal. The selected survey locations represent three developmental regions (east, west, and far/mid-west) and two ecological belts (Hills and Terai1) where rice is produced mainly under rainfed and drought-prone conditions (Fig. 1). The survey was carried out for the 2008 rice-cropping season under the STRASA project in South Asia. The prevalence of drought stress and proportion of rainfed rice area were two major criteria for the selection of districts and study villages. Household surveys were conducted in 300 randomly selected households (100 households in each district) covering representative rainfed districts of the eastern and western Terai and
1Terai refers to the southern fl at low-lying region of the country bordering India, which is a part of the Indo-Gangetic fertile plains. This region stretches parallel from east to west in the country, covering more than 1,000 km in length.

Patterns of adoption of improved rice varieties...of Nepal 39
the Hills of Nepal. These districts were Banke, Siraha, and Tanahun, representing eastern and mid-western Terai and the mid-Hills, respectively. Within each district, two villages were selected for the detailed household survey covering 50 households from each village. These selected surveyed villages were also the on-farm participa-tory varietal selection (PVS) sites for the STRASA project. The survey sites and stress situations were characterized by using focus group discussions (FGD) and key informant surveys (KIS). Detailed information on farmers’ livelihoods, socioeconomic features, rice pro-duction systems, variety adoption patterns, input use, costs-returns, income structure, farmers’ coping strategies, and gender-disaggregated data on rice farming was collected from the specifi cally designed household surveys. Survey data were compiled, man-aged, cleaned, and validated by developing a standard database management system in the MS Access program. The STATA statistical package was used for econometric and statistical analyses. The annual growth rate for rice area, production, and yield was estimated using a semi-log trend equation. Before fi tting a trend equation for each period and the overall growth rate estimation (1961-2008), data were smoothed using a fi ve-year moving-average process. The adoption percentage of modern varieties (MVs) in terms of area and farmers growing them was estimated and compared across sites. For analyzing specifi c adoption patterns of new MVs, we classifi ed the existing MVs adopted by farmers into two groups: those that were released before 1990 were considered as “old generation” and those that were released after 1990 were considered as “new genera-tion.” The area-weighted age of rice varieties was computed for each site using the proportion of rice area covered by each variety with the age of that specifi c variety
Siraha
Tanahun
Banke
Fig. 1. Map of Nepal showing the STRASA survey sites.

40 D. Gauchan et al
measured from the year of release. The yield effects of MV adoption were analyzed by the variety and fi eld types (land types) across the locations. Econometric analysis was carried out using censored regression (tobit) and probit models to identify the major factors determining the probability and the rate of adoption of new-generation MVs. Yield and detailed input-use data from intensive data plots obtained from household surveys were used to analyze the costs and returns of rice production by variety types (MV and TV) and the generation of modern varieties (new and old MVs). The sources and structure of household income and farmers’ coping strategies were assessed and documented. Gender analyses in terms of women’s participation and decision mak-ing related to rice production and overall livelihood activities were carried out using gender-disaggregated data collected from the household surveys. The Women’s Em-powerment Index was computed using 16 gender-related indicators to document the status of women’s empowerment at the study sites.
Agriculture and trends in rice production
Agriculture and the economyNepal is an agrarian country where agriculture is still the single largest sector in the economy, accounting for 32% of GDP (MOF 2009). The country’s main agricultural production involves paddy rice, maize, wheat, sugar cane, vegetables, potatoes, pulses, and tea, milk, meat, and other livestock products. The country also produces cash crops such as tea, ginger, citrus, and nontimber forest products in the Hill region for both domestic consumption and export. The cropping pattern is dominated by three crops, rice, maize, and wheat, accounting for over 90% of the area and food grain production. Growth in agriculture has a direct impact on the national economy and livelihood of the poor as more than two-thirds of the labor force is currently employed in agriculture. This high labor force employment from agriculture in Nepal is higher than in other South Asian neighbors such as India (58%), Bangladesh (55%), and Pakistan (47%) (World Bank 2008). Within agriculture, self-employment predomi-nates. Despite the important role of agriculture in the national economy, growth in agriculture is slow and its share has been declining over the years. For 1984-2007, an estimate shows that nonagriculture gross domestic product (at constant 2001 prices) grew at 6% per year. However, agriculture domestic product grew at only 2% per year during the same period (MOF 2009). This is a cause for concern since the growth of the Nepalese economy is determined largely by the growth of its agricultural sector.
Farmland ownership and distributionAgrarian structures in Nepal are characterized by very small landholdings scattered among different plots, where irrigation is either not available or seasonal. The aver-age size of land owned by the household currently in Nepal is about 0.8 ha, which is frequently fragmented, averaging 3.3 parcels. Currently, 3.3 million farm households cultivate 2.6 million hectares of land, where a wide disparity exists in the distribution of land, with inequality of 0.544 as measured by the Gini coeffi cient (NLSS 2004).
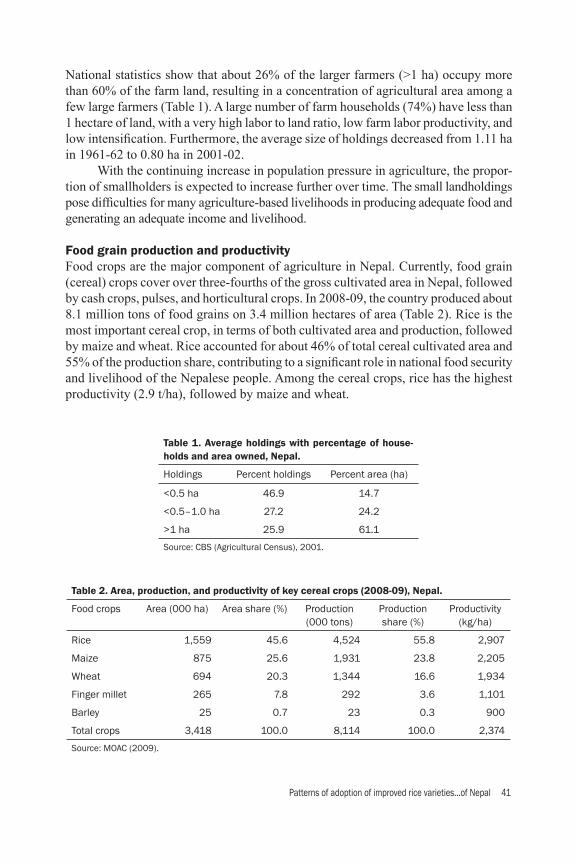
Patterns of adoption of improved rice varieties...of Nepal 41
National statistics show that about 26% of the larger farmers (>1 ha) occupy more than 60% of the farm land, resulting in a concentration of agricultural area among a few large farmers (Table 1). A large number of farm households (74%) have less than 1 hectare of land, with a very high labor to land ratio, low farm labor productivity, and low intensifi cation. Furthermore, the average size of holdings decreased from 1.11 ha in 1961-62 to 0.80 ha in 2001-02. With the continuing increase in population pressure in agriculture, the propor-tion of smallholders is expected to increase further over time. The small landholdings pose diffi culties for many agriculture-based livelihoods in producing adequate food and generating an adequate income and livelihood.
Food grain production and productivityFood crops are the major component of agriculture in Nepal. Currently, food grain (cereal) crops cover over three-fourths of the gross cultivated area in Nepal, followed by cash crops, pulses, and horticultural crops. In 2008-09, the country produced about 8.1 million tons of food grains on 3.4 million hectares of area (Table 2). Rice is the most important cereal crop, in terms of both cultivated area and production, followed by maize and wheat. Rice accounted for about 46% of total cereal cultivated area and 55% of the production share, contributing to a signifi cant role in national food security and livelihood of the Nepalese people. Among the cereal crops, rice has the highest productivity (2.9 t/ha), followed by maize and wheat.
Table 1. Average holdings with percentage of house-holds and area owned, Nepal.
Holdings Percent holdings Percent area (ha)
<0.5 ha 46.9 14.7
<0.5–1.0 ha 27.2 24.2
>1 ha 25.9 61.1
Source: CBS (Agricultural Census), 2001.
Table 2. Area, production, and productivity of key cereal crops (2008-09), Nepal.
Food crops Area (000 ha) Area share (%) Production (000 tons)
Production share (%)
Productivity (kg/ha)
Rice 1,559 45.6 4,524 55.8 2,907
Maize 875 25.6 1,931 23.8 2,205
Wheat 694 20.3 1,344 16.6 1,934
Finger millet 265 7.8 292 3.6 1,101
Barley 25 0.7 23 0.3 900
Total crops 3,418 100.0 8,114 100.0 2,374
Source: MOAC (2009).

42 D. Gauchan et al
Growth in rice area, yield, and productionRice is the principal crop grown on 1.5 million hectares. This area has remained almost constant for the past decade (Fig. 2). The trend of area, yield, and production was positive during the early 1980s and 1990s. However, during other periods, before 1980 and after 2000, no signifi cant growth occurred in production and yield. The esti-mated compound growth rate for rice area, yield, and production for different periods (decades) is presented in Table 3. From 1961 to 2008, rice production for the longer term grew at 1.7% per annum, which was even less than the population growth rate of 2.2%. Yield growth was only 20 kg per year from 1961 to 2008. In recent years, particularly from 2001 to 2008, growth was only marginal in yield and production. An important characteristic of rice production systems in Nepal is the high temporal variability (Fig. 2). This is mainly due to rainfall variability since about two-thirds of the rice is produced in rainfed conditions. Rice production increased during the favorable monsoon season (e.g., 2003), whereas, during unfavorable years (dry spells, e.g., 2006), area, yield, and production dropped sharply.
Rice production systems and agroecological environmentsRice, the number-one food crop of Nepal, is grown extensively under a wide range of agroecological conditions from lowland in the Terai (50 m) to high mountain valleys and mountain slopes (2,830 m) in Jumla—the highest altitude of rice-growing loca-tions in the world. The crop is cultivated in all agroecological regions (Mountains, Hills, and Terai), covering mountain slopes, hill terraces, intermountain basins, river valleys, and fl at lowland plains bordering India (Gauchan et al 2008). About two-thirds (74%) of the paddy is produced in the fl at lowland of the Terai and the rest (26%) in the Hills and Mountains. Rice is mainly cultivated during the wet monsoon season (June-November) in major parts of the country. However, in some parts of the lowland plains and valley fl oors, it is also grown during the spring season (Chaite rice) as an irrigated crop. Transplanting is the major method of rice establishment in both irrigated and rainfed lowland conditions. Direct seeding (broadcasting) is mainly practiced for upland rice (Ghaiya) in upland fi elds.
Table 3. Growth rates (% per year) of rice area, yield, and production by period.
Period Areaa Yield Production
1961-70 0.55*** –0.39*** 0.28***
1971-80 1.09*** –0.28 0.68**
1981-90 1.37*** 2.08*** 3.46***
1991-2000 0.94*** 1.06*** 1.99***
2001-08 –0.09 0.75** 0.66*
All (1961-2008) 0.85*** 0.86*** 1.71***a***, **, and * indicate statistical signifi cance at 1%, 5%, and 10%, respectively. The growth rate is estimated us-ing a semi-log trend equation. Before fi tting the trend equation for growth rate estimation, data were smoothed using a fi ve-year moving average centered at end points.

Patterns of adoption of improved rice varieties...of Nepal 43
Rainfed lowland is the dominant ecosystem, accounting for 79% of the rice area in the country (Table 4). The irrigated ecosystem constitutes one-fi fth of the rice area. Upland and deepwater ecosystems account for 5% and 8% of the total rice area, respectively. A large spatial variation exists in the amount of rainfall from east to west in the country, which can be attributed to the onset and cessation of the southwest monsoon. The eastern part receives more rainfall since the monsoon begins earlier and terminates later there. The country also receives some dry-season rainfall during winter through the west monsoon originating from the Mediterranean Sea.
Fig. 2. Trend in rice area, yield, and production in Nepal. Data source: FAOSTAT (2007), MoAC (2009).
5.0 5.0
AreaProdYield
Area (ha) and production (tons) in millions Yield (t/ha)
Year
4.5 4.5
3.5 3.5
2.5 2.5
1.5 1.5
0.5 0.5
4.0 4.0
3.0 3.0
2.0 2.0
1.0 1.0
0.0 0.01963
19661969
19721975
19781981
19841987
19901993
19961999
20022005
2008
Table 4. Rice area (ha) and percent share by ecosystem.
Rice ecosystem % of area Area (000 ha)
Irrigated 21.0 325.5
Rainfed 79.0 1,224.5
Lowland 66.0 1,023.0
Upland 5.0 77.5
Deepwater 8.0 124.0
Total 100.0 1,550.0
Source: IRRI (2009).
44 D. Gauchan et al
Rice variety development and releaseEfforts started to increase the productivity of rice with the establishment of agricultural farms in Parwanipur and Khumaltar in the 1950s and the introduction of modern va-rieties (MVs) in the mid-1960s in Nepal (Mallick 1981). In the last 50 years, several rice varieties have been promoted and adopted in different parts of the country. Until 2010, the government of Nepal had developed and released 60 rice varieties for differ-ent ecosystems and agroecological conditions (NARC 2010). Most of these varieties came from the International Rice Research Institute (IRRI) through the International Network for Genetic Evaluation of Rice (INGER) and were released directly or used as parents for developing new varieties. A few of them were selections from popular local landraces of Nepal. CH-45, obtained through IRRI (originated in China), was the fi rst offi cially released modern variety in 1966 for general cultivation in Nepal, followed by the Taiwanese varieties (Taichung-176, Chainung-242, Chainan-2, and Tainan-1) in 1967 and IR8 from IRRI in 1968 (NARC 2009). These MVs were fi rst planted on a signifi -cant area in Nepal in 1968-69, but did not extend to more than 10% of the area until 1972-73 and they continued to increase slowly (Herdt and Capule 1983). By 1980, it was estimated that MVs may have covered 30% of Nepal’s rice area, but the rate of increase was still low (Herdt and Capule 1983). According to Upadhyay (1996), modern varieties covered about 40% of the area by 1990. After the mid-1990s, their area coverage increased, and they now cover 87.6% of the cultivated rice area (MoAC 2009). However, the increase in rice yields following the adoption of MVs has not been as dramatic as in other rice-growing Asian countries such as Bangladesh, Vietnam, and the Philippines (IRRI 2009). Despite the high proportion of area covered by MVs in recent years (87%), most of them are old and low yielding, developed and released during the early 1970s and 1980s. The variety replacement rate is very low as the country has been releasing at the rate of 12 varieties per decade averaged for the last fi ve decades of varietal development work. The lowest number of releases occurred during 1960-69 (n = 6) and the highest during 1980-89 (n = 14). Furthermore, the development and release of high-yielding new-generation stress-tolerant rice varieties are limited.
Incidence and effect of drought stressThe country’s macro-economy is more affected by drought than any other natural haz-ard (MOHA 2009). Drought is a critical abiotic stress in rice production since two-thirds of the rice area in the country is rainfed and prone to weather-related risks. Upadhyay (1996) reported that drought was the number-one constraint to the rice crop among the different types of biotic (weeds, pests, diseases) and abiotic (drought, submergence, poor soils) stresses studied during the early 1990s, which reduce yield by as much as 36% in Nepal. Drought caused by low, erratic, and untimely rainfall has resulted in low rice production growth. In recent years, Nepal has experienced frequent dry spells in various parts of the country, particularly during 2001, 2002, 2004, 2005, 2006, and 2009. Rainfed rice production environments are the hardest hit by the dry spells due to the absence of irrigation facilities. The literature shows that, in the past 50 years,

Patterns of adoption of improved rice varieties...of Nepal 45
Nepal had drought problems mainly in 1964, 1967, 1973, 1974, 1977, 1979, 1980, 1983, 1992, 1994, 2001, 2002, 2005, 2006, and 2009 (MOPE 2002, MOHA 2009). The occurrence of early-stage drought is most common in Nepal. This causes a substantial reduction in area planted to rice. This was most common during 2006 and 2009, with a signifi cant reduction in area sown and yield losses. The prolonged dry spells of 2006 caused a substantial reduction in national rice production, which decreased by 13%, and in some districts the reduction reached 40%. In the eastern Terai districts of Siraha and Saptari, the reduction in rice production in 2006 was 38% and 46%, respectively (FAO/WFP 2007).
Site and stress characterization
Description of survey sitesGeneral features of survey sites. A socioeconomic baseline survey was conducted in three representative locations (districts) where rice is cultivated mainly under rainfed and stress-prone conditions (Table 5). The prevalence of drought stress and proportion of rainfed rice area were the two major criteria for the selection of sites. Among these three sites, two are located in the Terai region (eastern and mid-western) and one in the mid-Hill region in the western Hills. These sites are located in Banke, Siraha, and Tanahun districts of the Terai and Hill regions, respectively. These sites are also the major on-farm technology testing sites (e.g., PVS and other on-farm trials) for NARC (RARS, Nepalganj; NRRP, Hardinath) and IAAS, Lamjung Campus, of the STRASA project in Nepal. Banke District in mid-western and far-western Nepal and Siraha District in eastern Nepal are rainfed and drought-prone districts of Nepal. Similarly, Tanahun District in the mid-Hill region also has a large portion of its rice production in a rain-fed system (Tar area) near the river basin and lower hills. These districts also have a higher incidence of poverty than many of the rice production districts in Nepal. From these selected rainfed districts, villages that are most representative of rainfed rice production environments are selected for the baseline survey in Nepal. In Banke District, these include Puraina (Puraina VDC) and Parbatipur (ward #8) villages of Shamsherganj VDC that are close (5–15 km) to the Nepalganj Market. In
Table 5. Survey sites/districts, villages, and responsible institutions, Nepal.
Site/district Institutiona Site Village VDCa
Banke RARS, NARC, Nepalganj
Banke Puraina andParbati pur
Puraina VDC and Shamsherganj
Siraha NRRP, NARCHardinath
Siraha Baluwa Naraha-Balkawa
Tanahun IAAS, Lamjung Tanahun Bhansar and Purkot
Bhanu and Purkot
aVDC refers to village development committee, RARS = Regional Agricultural Research Station, NARC = Nepal Agricultural Research Council, NRRP = National Rice Research Program, IAAS = Institute of Agriculture and Animal Sciences.

46 D. Gauchan et al
Siraha, this is Baluwa Village in Naraha-Balkawa VDC about 15 km northwest from the district headquarters in Siraha. Similarly, in Tanahun, Bhansar, and Purkot villages, which are located in Bhanu (ward #1, 5, 6, 7, 8) and Purkot VDCs (ward #1, 5, 6, 7), respectively, are selected. These villages in Tanahun are also part of the scaling-up sites for the IRRI/IFAD project. Biophysical profi le of the study sites. All three sites are accessible by motorable road and located close to market centers. Banke and Siraha are located in lowland fl at plains at an altitude range of 100–250 m, with an average rainfall of 1,300–1,400 mm (Table 6). However, the Tanahun site is located in the mid-Hill region at altitude that ranges from 360 to 1,000 m. This site also has relatively higher average rainfall of 1,700 mm per year. Rice-wheat and rice-lentil are the major cropping patterns at the two Terai sites while Tanahun has rice/maize and blackgram-fallow patterns. Rice-fallow is common at all the sties. Sandy loam to clay loam are the major soil types at the Banke site, with clay loam at Siraha and clay loam to silty loam at Tanahun. Ethnic profi le of the households. The study villages have various ethnic and caste groups living together (Table 7). These include high-caste Hindus (Brahmin-Chhetri), Yadav, other Terai mixed caste (Kurmi, Teli, Burma), Janjati (indigenous hill people), Dalit (lower caste disadvantaged Hindus), and Muslims. Yadav are mainly concentrated in Siraha (61%), whereas Dalits are predominant in Banke (43%) and Siraha (16%). Brahmin-Chhetri (64%) and Janjati (27%) are concentrated in the Hill villages in Tanahun. Muslims are found in both Banke and Siraha at Terai sites.
Description of stress situationsFarmers perceived that 2006 was the most recent drought year at all three sites. The national literature and rainfall information obtained from the government of Nepal also indicate that 2006 was a severe drought year (MoHA 2009). The national and
Table 6. Biophysical profi le of the study sites Banke, Siraha, and Tanahun, Nepal.
Characteristics Banke Siraha Tanahun
Latitude and longitude 81º32′–82º05′E and 27º52′–28º14′N
86º05′ and 86º26′E; 26º16′N
28º04′–28º09′N; 84º43′–84º48′E
Altitude (m) 150–250 102 360–1,000
Average rainfall (mm) 1,319 1,467 1,750
Temperature (ºC) 5–40 5–38 2–35
Soil type Sandy loam Clay loam Clay loam
Clay loam Silty loam
Cropping system Rice-lentil Rice-fallow Rice-fallow
Rice-wheat Rice-lentil Rice-maize
Rice-fallow Rice-wheat Blackgram-fallow
Access to roads Dirt road Paved road Paved road
Nearest market (km) 5–12 5 3–17
Source: Based on focus group discussions and key informant surveys.
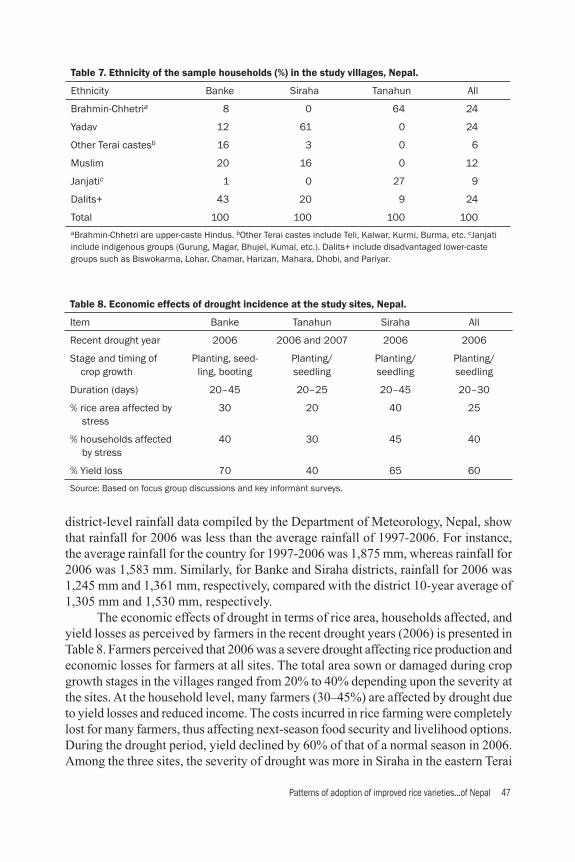
Patterns of adoption of improved rice varieties...of Nepal 47
district-level rainfall data compiled by the Department of Meteorology, Nepal, show that rainfall for 2006 was less than the average rainfall of 1997-2006. For instance, the average rainfall for the country for 1997-2006 was 1,875 mm, whereas rainfall for 2006 was 1,583 mm. Similarly, for Banke and Siraha districts, rainfall for 2006 was 1,245 mm and 1,361 mm, respectively, compared with the district 10-year average of 1,305 mm and 1,530 mm, respectively. The economic effects of drought in terms of rice area, households affected, and yield losses as perceived by farmers in the recent drought years (2006) is presented in Table 8. Farmers perceived that 2006 was a severe drought affecting rice production and economic losses for farmers at all sites. The total area sown or damaged during crop growth stages in the villages ranged from 20% to 40% depending upon the severity at the sites. At the household level, many farmers (30–45%) are affected by drought due to yield losses and reduced income. The costs incurred in rice farming were completely lost for many farmers, thus affecting next-season food security and livelihood options. During the drought period, yield declined by 60% of that of a normal season in 2006. Among the three sites, the severity of drought was more in Siraha in the eastern Terai
Table 7. Ethnicity of the sample households (%) in the study villages, Nepal.
Ethnicity Banke Siraha Tanahun All
Brahmin-Chhetria 8 0 64 24
Yadav 12 61 0 24
Other Terai castesb 16 3 0 6
Muslim 20 16 0 12
Janjatic 1 0 27 9
Dalits+ 43 20 9 24
Total 100 100 100 100aBrahmin-Chhetri are upper-caste Hindus. bOther Terai castes include Teli, Kalwar, Kurmi, Burma, etc. cJanjati include indigenous groups (Gurung, Magar, Bhujel, Kumal, etc.). Dalits+ include disadvantaged lower-caste groups such as Biswokarma, Lohar, Chamar, Harizan, Mahara, Dhobi, and Pariyar.
Table 8. Economic effects of drought incidence at the study sites, Nepal.
Item Banke Tanahun Siraha All
Recent drought year 2006 2006 and 2007 2006 2006
Stage and timing of crop growth
Planting, seed-ling, booting
Planting/seedling
Planting/ seedling
Planting/ seedling
Duration (days) 20–45 20–25 20–45 20–30
% rice area affected by stress
30 20 40 25
% households affected by stress
40 30 45 40
% Yield loss 70 40 65 60
Source: Based on focus group discussions and key informant surveys.
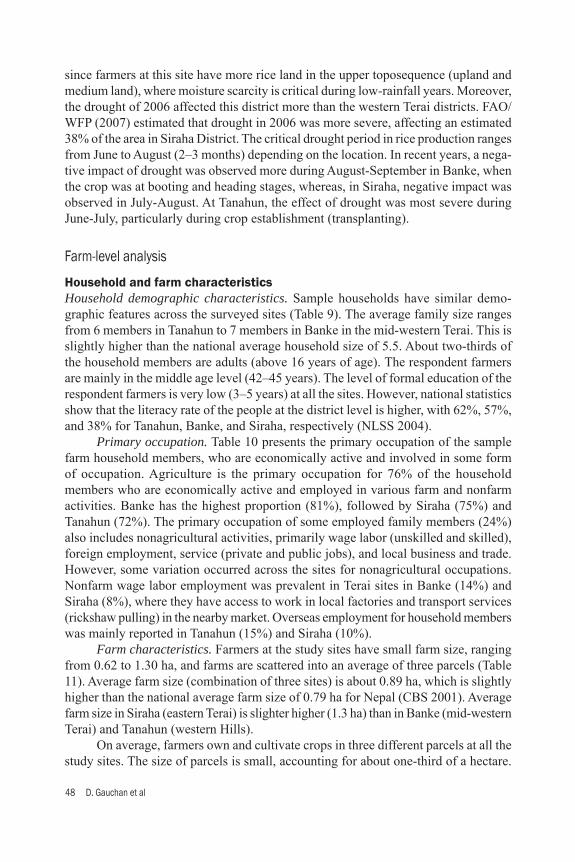
48 D. Gauchan et al
since farmers at this site have more rice land in the upper toposequence (upland and medium land), where moisture scarcity is critical during low-rainfall years. Moreover, the drought of 2006 affected this district more than the western Terai districts. FAO/WFP (2007) estimated that drought in 2006 was more severe, affecting an estimated 38% of the area in Siraha District. The critical drought period in rice production ranges from June to August (2–3 months) depending on the location. In recent years, a nega-tive impact of drought was observed more during August-September in Banke, when the crop was at booting and heading stages, whereas, in Siraha, negative impact was observed in July-August. At Tanahun, the effect of drought was most severe during June-July, particularly during crop establishment (transplanting).
Farm-level analysis
Household and farm characteristicsHousehold demographic characteristics. Sample households have similar demo-graphic features across the surveyed sites (Table 9). The average family size ranges from 6 members in Tanahun to 7 members in Banke in the mid-western Terai. This is slightly higher than the national average household size of 5.5. About two-thirds of the household members are adults (above 16 years of age). The respondent farmers are mainly in the middle age level (42–45 years). The level of formal education of the respondent farmers is very low (3–5 years) at all the sites. However, national statistics show that the literacy rate of the people at the district level is higher, with 62%, 57%, and 38% for Tanahun, Banke, and Siraha, respectively (NLSS 2004). Primary occupation. Table 10 presents the primary occupation of the sample farm household members, who are economically active and involved in some form of occupation. Agriculture is the primary occupation for 76% of the household members who are economically active and employed in various farm and nonfarm activities. Banke has the highest proportion (81%), followed by Siraha (75%) and Tanahun (72%). The primary occupation of some employed family members (24%) also includes nonagricultural activities, primarily wage labor (unskilled and skilled), foreign employment, service (private and public jobs), and local business and trade. However, some variation occurred across the sites for nonagricultural occupations.Nonfarm wage labor employment was prevalent in Terai sites in Banke (14%) and Siraha (8%), where they have access to work in local factories and transport services (rickshaw pulling) in the nearby market. Overseas employment for household members was mainly reported in Tanahun (15%) and Siraha (10%). Farm characteristics. Farmers at the study sites have small farm size, ranging from 0.62 to 1.30 ha, and farms are scattered into an average of three parcels (Table 11). Average farm size (combination of three sites) is about 0.89 ha, which is slightly higher than the national average farm size of 0.79 ha for Nepal (CBS 2001). Average farm size in Siraha (eastern Terai) is slighter higher (1.3 ha) than in Banke (mid-western Terai) and Tanahun (western Hills). On average, farmers own and cultivate crops in three different parcels at all the study sites. The size of parcels is small, accounting for about one-third of a hectare.

Patterns of adoption of improved rice varieties...of Nepal 49
Farmers normally plant each rice variety separately on different parcels or sometimes in different parts of the same parcel (based on land type and irrigation source). The parcels are recognized based on the location, land type, tenure, or source of irrigation. Farmers also subdivide parcels into plots and subplots to fi t their different crops and rice varieties. Irrigation facilities are very much limited at the study sites as no large-scale irrigation infrastructure is available. The percent irrigated area ranges from less than 10% in Banke to about 30% in Tanahun during the rainy season. Irrigation to the rice
Table 9. General household characteristics.
Household characteristics Banke Siraha Tanahun All
No. of households 100 100 100 300
Average household size 6.9 6.6 6.0 6.5
Average number of adult members 4.2 4.2 4.0 4.1
Average age of respondents 42 45 44 44
Average years of education of respondents 3 5 4 4
Table 10. Primary occupation of economically active household members.
Primary occupation Banke Siraha Tanahun All
Agriculture (rice-based farming) 81 75 72 76
Service (private + public jobs) 3 6 10 6
Nonfarm wage labora
Unskilled wage labor 11 7 0 6
Skilled wage labor 3 1 0 2
Business 2 1 3 2
Foreign employment 0 10 15 8
Total 100 100 100 100aUnskilled wage labor includes working as wage labor in factories, transport (rickshaw pulling, etc.), construction work, etc. Skilled wage labor includes working as a carpenter, plumber, mechanic, driver, etc.
Table 11. Farm characteristics of the sample households.
Farm characteristic Banke Siraha Tanahun All
Average farm size (ha) 0.75 1.30 0.62 0.89
Average number of parcels per household 3.2 3.1 3.1 3.1
Average area of parcels (ha) 0.25 0.46 0.42 0.30
Percentage of area irrigated
Wet season 9.1 20.7 28.7 21.0
Dry season 6.5 21.1 8.1 14.0
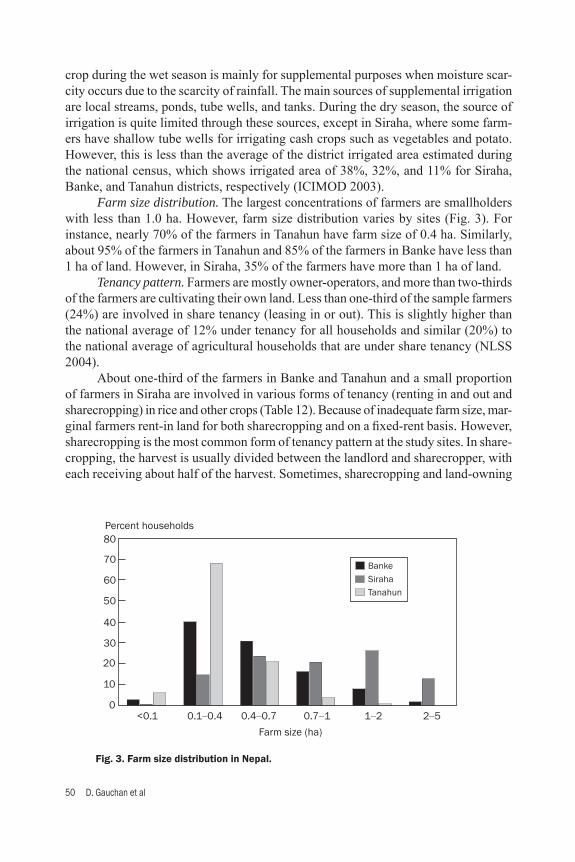
50 D. Gauchan et al
crop during the wet season is mainly for supplemental purposes when moisture scar-city occurs due to the scarcity of rainfall. The main sources of supplemental irrigation are local streams, ponds, tube wells, and tanks. During the dry season, the source of irrigation is quite limited through these sources, except in Siraha, where some farm-ers have shallow tube wells for irrigating cash crops such as vegetables and potato. However, this is less than the average of the district irrigated area estimated during the national census, which shows irrigated area of 38%, 32%, and 11% for Siraha, Banke, and Tanahun districts, respectively (ICIMOD 2003). Farm size distribution. The largest concentrations of farmers are smallholders with less than 1.0 ha. However, farm size distribution varies by sites (Fig. 3). For instance, nearly 70% of the farmers in Tanahun have farm size of 0.4 ha. Similarly, about 95% of the farmers in Tanahun and 85% of the farmers in Banke have less than 1 ha of land. However, in Siraha, 35% of the farmers have more than 1 ha of land. Tenancy pattern. Farmers are mostly owner-operators, and more than two-thirds of the farmers are cultivating their own land. Less than one-third of the sample farmers (24%) are involved in share tenancy (leasing in or out). This is slightly higher than the national average of 12% under tenancy for all households and similar (20%) to the national average of agricultural households that are under share tenancy (NLSS 2004). About one-third of the farmers in Banke and Tanahun and a small proportion of farmers in Siraha are involved in various forms of tenancy (renting in and out and sharecropping) in rice and other crops (Table 12). Because of inadequate farm size, mar-ginal farmers rent-in land for both sharecropping and on a fi xed-rent basis. However, sharecropping is the most common form of tenancy pattern at the study sites. In share- cropping, the harvest is usually divided between the landlord and sharecropper, with each receiving about half of the harvest. Sometimes, sharecropping and land-owning
Fig. 3. Farm size distribution in Nepal.
70
60
50
40
30
20
10
<0.1 0.1–0.4 0.4–0.7
Farm size (ha)
0.7–1 1–2 2–50
80Percent households
BankeSirahaTanahun

Patterns of adoption of improved rice varieties...of Nepal 51
households also share the use of farm animals and production inputs. Renting out of the land is also practiced among relatively large land owners, especially in Tanahun, due to the diffi culty of cultivating land as a result of labor scarcity or engagement in other nonfarm activities. Land endowment. Farmers own and cultivate rice on different land types (fi eld types) with different topographical sequence and moisture level and fi t their rice va-rieties and crops to meet their diverse production and consumption needs (Table 13). Generally, rice scientists and farmers both recognize and classify rice fi elds into three different types based on fi eld hydrology and soil type: lowland, medium land, and upland (upper fi elds). Lowlands are located in the lower toposequence of the fi elds. Uplands are located in upper fi elds, with less moisture availability and poor soil quality (sandy soils with less water retention capacity). Medium land is intermediate between lowland and upland. The proportion of lower fi eld types is higher at the Tanahun Hill site, followed by Banke at the mid-western Terai site. However, the proportion of medium land type is higher (84%) in Siraha in the eastern Terai, with the largest total cultivated area at the surveyed sites in Nepal. Rice-based cropping systems. Rice is a predominant crop and it is mainly grown in the wet season during July to November. Dry-season cropping after rice is limited to wheat and maize (winter). Other crops (minor) are mustard, potato, some legumes,
Table 12. Tenancy patterns of farm households (% area).
Farm characteristics Banke Siraha Tanahun All
Percentage of farm area by tenure status
Land owners 66 85 68 76
Renting in 3 14 9 10
Sharecropping 31 1 0 9
Renting out 0 0 22 5
Total 100 100 100 100
Table 13. Land endowments by land type (% share).
Land endowment Banke Siraha Tanahun All
Average farm size (ha) 0.75 1.30 0.62 0.89
Share of different land types (%)
Upland (upper fi elds) 23 11 45 22
Medium land (medium fi elds) 34 84 0 51
Lowland (lower fi elds) 43 6 55 28
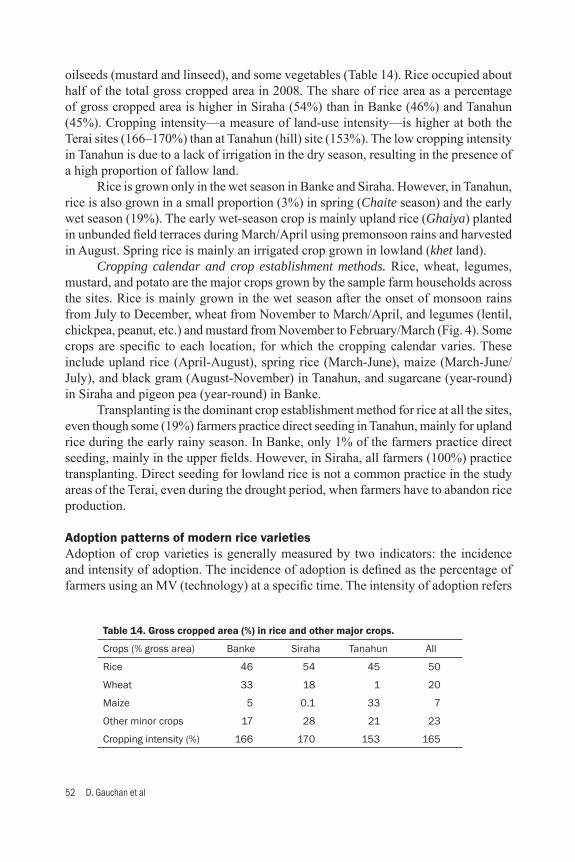
52 D. Gauchan et al
oilseeds (mustard and linseed), and some vegetables (Table 14). Rice occupied about half of the total gross cropped area in 2008. The share of rice area as a percentage of gross cropped area is higher in Siraha (54%) than in Banke (46%) and Tanahun (45%). Cropping intensity—a measure of land-use intensity—is higher at both the Terai sites (166–170%) than at Tanahun (hill) site (153%). The low cropping intensity in Tanahun is due to a lack of irrigation in the dry season, resulting in the presence of a high proportion of fallow land. Rice is grown only in the wet season in Banke and Siraha. However, in Tanahun, rice is also grown in a small proportion (3%) in spring (Chaite season) and the early wet season (19%). The early wet-season crop is mainly upland rice (Ghaiya) planted in unbunded fi eld terraces during March/April using premonsoon rains and harvested in August. Spring rice is mainly an irrigated crop grown in lowland (khet land). Cropping calendar and crop establishment methods. Rice, wheat, legumes, mustard, and potato are the major crops grown by the sample farm households across the sites. Rice is mainly grown in the wet season after the onset of monsoon rains from July to December, wheat from November to March/April, and legumes (lentil, chickpea, peanut, etc.) and mustard from November to February/March (Fig. 4). Some crops are specifi c to each location, for which the cropping calendar varies. These include upland rice (April-August), spring rice (March-June), maize (March-June/July), and black gram (August-November) in Tanahun, and sugarcane (year-round) in Siraha and pigeon pea (year-round) in Banke. Transplanting is the dominant crop establishment method for rice at all the sites, even though some (19%) farmers practice direct seeding in Tanahun, mainly for upland rice during the early rainy season. In Banke, only 1% of the farmers practice direct seeding, mainly in the upper fi elds. However, in Siraha, all farmers (100%) practice transplanting. Direct seeding for lowland rice is not a common practice in the study areas of the Terai, even during the drought period, when farmers have to abandon rice production.
Adoption patterns of modern rice varietiesAdoption of crop varieties is generally measured by two indicators: the incidence and intensity of adoption. The incidence of adoption is defi ned as the percentage of farmers using an MV (technology) at a specifi c time. The intensity of adoption refers
Table 14. Gross cropped area (%) in rice and other major crops.
Crops (% gross area) Banke Siraha Tanahun All
Rice 46 54 45 50
Wheat 33 18 1 20
Maize 5 0.1 33 7
Other minor crops 17 28 21 23
Cropping intensity (%) 166 170 153 165
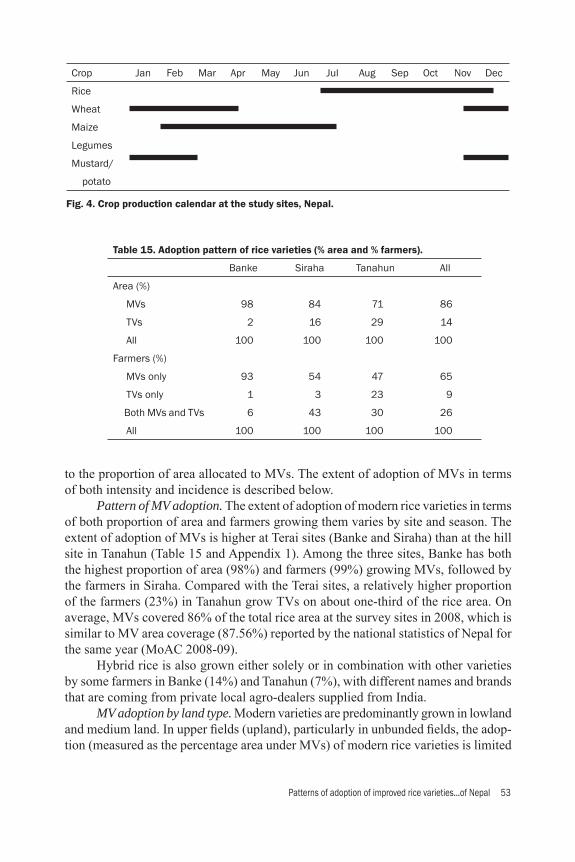
Patterns of adoption of improved rice varieties...of Nepal 53
to the proportion of area allocated to MVs. The extent of adoption of MVs in terms of both intensity and incidence is described below. Pattern of MV adoption. The extent of adoption of modern rice varieties in terms of both proportion of area and farmers growing them varies by site and season. The extent of adoption of MVs is higher at Terai sites (Banke and Siraha) than at the hill site in Tanahun (Table 15 and Appendix 1). Among the three sites, Banke has both the highest proportion of area (98%) and farmers (99%) growing MVs, followed by the farmers in Siraha. Compared with the Terai sites, a relatively higher proportion of the farmers (23%) in Tanahun grow TVs on about one-third of the rice area. On average, MVs covered 86% of the total rice area at the survey sites in 2008, which is similar to MV area coverage (87.56%) reported by the national statistics of Nepal for the same year (MoAC 2008-09). Hybrid rice is also grown either solely or in combination with other varieties by some farmers in Banke (14%) and Tanahun (7%), with different names and brands that are coming from private local agro-dealers supplied from India. MV adoption by land type. Modern varieties are predominantly grown in lowland and medium land. In upper fi elds (upland), particularly in unbunded fi elds, the adop-tion (measured as the percentage area under MVs) of modern rice varieties is limited
Crop Jan Feb Mar Apr May Jun Jul Aug Sep Oct Nov Dec
Rice
Wheat
Maize
Legumes
Mustard/
potato
Fig. 4. Crop production calendar at the study sites, Nepal.
Table 15. Adoption pattern of rice varieties (% area and % farmers).
Banke Siraha Tanahun All
Area (%)
MVs 98 84 71 86
TVs 2 16 29 14
All 100 100 100 100
Farmers (%)
MVs only 93 54 47 65
TVs only 1 3 23 9
Both MVs and TVs 6 43 30 26
All 100 100 100 100
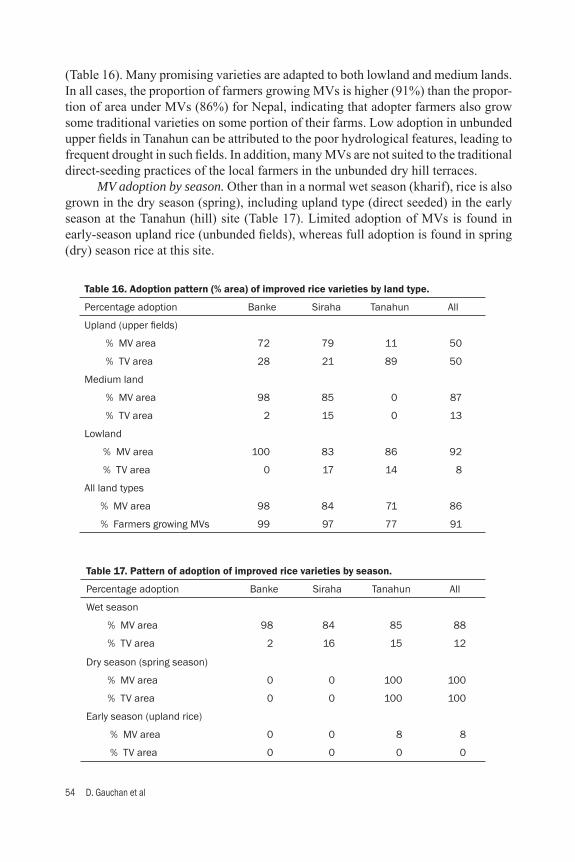
54 D. Gauchan et al
Table 16. Adoption pattern (% area) of improved rice varieties by land type.
Percentage adoption Banke Siraha Tanahun All
Upland (upper fi elds)
% MV area 72 79 11 50
% TV area 28 21 89 50
Medium land
% MV area 98 85 0 87
% TV area 2 15 0 13
Lowland
% MV area 100 83 86 92
% TV area 0 17 14 8
All land types
% MV area 98 84 71 86
% Farmers growing MVs 99 97 77 91
(Table 16). Many promising varieties are adapted to both lowland and medium lands. In all cases, the proportion of farmers growing MVs is higher (91%) than the propor-tion of area under MVs (86%) for Nepal, indicating that adopter farmers also grow some traditional varieties on some portion of their farms. Low adoption in unbunded upper fi elds in Tanahun can be attributed to the poor hydrological features, leading to frequent drought in such fi elds. In addition, many MVs are not suited to the traditional direct-seeding practices of the local farmers in the unbunded dry hill terraces. MV adoption by season. Other than in a normal wet season (kharif), rice is also grown in the dry season (spring), including upland type (direct seeded) in the early season at the Tanahun (hill) site (Table 17). Limited adoption of MVs is found in early-season upland rice (unbunded fi elds), whereas full adoption is found in spring (dry) season rice at this site.
Table 17. Pattern of adoption of improved rice varieties by season.
Percentage adoption Banke Siraha Tanahun All
Wet season
% MV area 98 84 85 88
% TV area 2 16 15 12
Dry season (spring season)
% MV area 0 0 100 100
% TV area 0 0 100 100
Early season (upland rice)
% MV area 0 0 8 8
% TV area 0 0 0 0
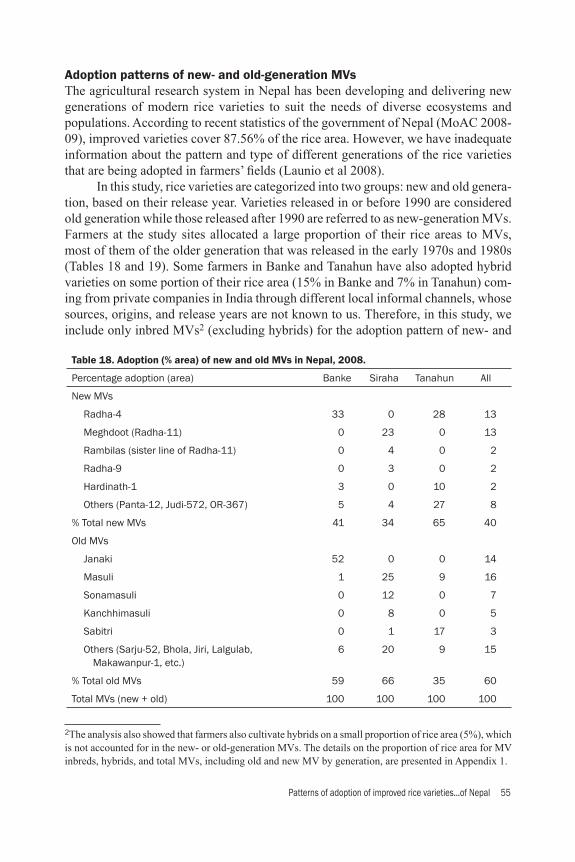
Patterns of adoption of improved rice varieties...of Nepal 55
Adoption patterns of new- and old-generation MVsThe agricultural research system in Nepal has been developing and delivering new generations of modern rice varieties to suit the needs of diverse ecosystems and populations. According to recent statistics of the government of Nepal (MoAC 2008-09), improved varieties cover 87.56% of the rice area. However, we have inadequate information about the pattern and type of different generations of the rice varieties that are being adopted in farmers’ fi elds (Launio et al 2008). In this study, rice varieties are categorized into two groups: new and old genera-tion, based on their release year. Varieties released in or before 1990 are considered old generation while those released after 1990 are referred to as new-generation MVs. Farmers at the study sites allocated a large proportion of their rice areas to MVs, most of them of the older generation that was released in the early 1970s and 1980s (Tables 18 and 19). Some farmers in Banke and Tanahun have also adopted hybrid varieties on some portion of their rice area (15% in Banke and 7% in Tanahun) com-ing from private companies in India through different local informal channels, whose sources, origins, and release years are not known to us. Therefore, in this study, we include only inbred MVs2 (excluding hybrids) for the adoption pattern of new- and
2The analysis also showed that farmers also cultivate hybrids on a small proportion of rice area (5%), which is not accounted for in the new- or old-generation MVs. The details on the proportion of rice area for MV inbreds, hybrids, and total MVs, including old and new MV by generation, are presented in Appendix 1.
Table 18. Adoption (% area) of new and old MVs in Nepal, 2008.
Percentage adoption (area) Banke Siraha Tanahun All
New MVs
Radha-4 33 0 28 13
Meghdoot (Radha-11) 0 23 0 13
Rambilas (sister line of Radha-11) 0 4 0 2
Radha-9 0 3 0 2
Hardinath-1 3 0 10 2
Others (Panta-12, Judi-572, OR-367) 5 4 27 8
% Total new MVs 41 34 65 40
Old MVs
Janaki 52 0 0 14
Masuli 1 25 9 16
Sonamasuli 0 12 0 7
Kanchhimasuli 0 8 0 5
Sabitri 0 1 17 3
Others (Sarju-52, Bhola, Jiri, Lalgulab, Makawanpur-1, etc.)
6 20 9 15
% Total old MVs 59 66 35 60
Total MVs (new + old) 100 100 100 100
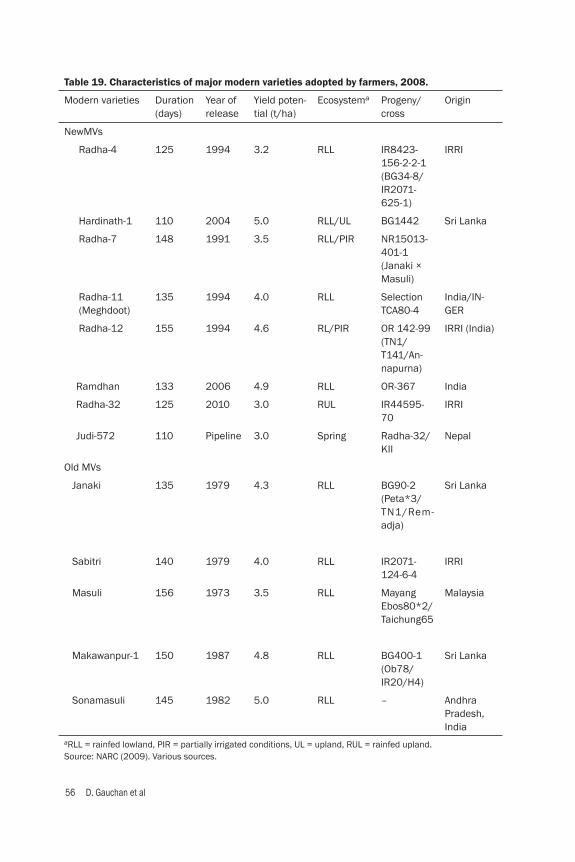
56 D. Gauchan et al
Table 19. Characteristics of major modern varieties adopted by farmers, 2008.
Modern varieties Duration (days)
Year of release
Yield poten-tial (t/ha)
Ecosystema Progeny/cross
Origin
NewMVs
Radha-4 125 1994 3.2 RLL IR8423-156-2-2-1 (BG34-8/IR2071-625-1)
IRRI
Hardinath-1 110 2004 5.0 RLL/UL BG1442 Sri Lanka
Radha-7 148 1991 3.5 RLL/PIR NR15013-401-1 (Janaki × Masuli)
Radha-11 (Meghdoot)
135 1994 4.0 RLL Selection TCA80-4
India/IN-GER
Radha-12 155 1994 4.6 RL/PIR OR 142-99 (TN1/ T141/An-napurna)
IRRI (India)
Ramdhan 133 2006 4.9 RLL OR-367 India
Radha-32 125 2010 3.0 RUL IR44595-70
IRRI
Judi-572 110 Pipeline 3.0 Spring Radha-32/KII
Nepal
Old MVs
Janaki 135 1979 4.3 RLL BG90-2 (Peta*3/TN1/Rem-adja)
Sri Lanka
Sabitri 140 1979 4.0 RLL IR2071-124-6-4
IRRI
Masuli 156 1973 3.5 RLL Mayang Ebos80*2/ Taichung65
Malaysia
Makawanpur-1 150 1987 4.8 RLL BG400-1 (Ob78/IR20/H4)
Sri Lanka
Sonamasuli 145 1982 5.0 RLL – Andhra Pradesh, India
aRLL = rainfed lowland, PIR = partially irrigated conditions, UL = upland, RUL = rainfed upland.Source: NARC (2009). Various sources.

Patterns of adoption of improved rice varieties...of Nepal 57
old-generation MVs that are developed and released by the national and international systems, whose sources, origins, and release years are known from various literature and national research systems. The fi ndings show that old-generation MVs account for about 60% of the MV inbred area (excluding hybrids), whereas new-generation MVs account for 40% of the total MV inbred area. The most popular new-generation varieties mainly adopted by farmers are Radha-4 and Radha-11 (Meghdoot), which are the oldest among the recently released varieties after 1990. Radha-4 is a dominant variety in both Banke (33% of the area) and Tanahun (28% of the area). Radha-11 is a dominant variety in Siraha in eastern Nepal, occupying 23% of the area. This fi nding is similar to the recent fi ndings of Witcombe et al (2009), who reported that Radha-4, Radha-11, and Radha-12 were the most widely grown varieties of the recently released varieties in Nepal’s Terai. Hardinath-1, a recently released (2004) variety, is also grown on a small pro-portion at Banke and Tanahun sites. OR-367, Rambilas (a sister line of Radha-11), Panta-12 (an Indian variety), and Judi-572 (Chaite rice) are some of the newer gen-eration rice varieties grown at the study sites. An important point to note from this fi nding is that farmers still grow a number of varieties that were 20–30 years old, released primarily before 1990. Estimation of average area-weighted age of rice varieties revealed that rice varietal age obtained from the survey was very high, with over 20 years in all three studied districts. This implies that the replacement rate of rice varieties in farmers’ fi elds is currently very low. A study by Witcombe et al (2009) confi rms this fi nding, indicating that old varieties (more than 20 years old) made up half of the adopted rice varieties in the Terai (21 districts including Makawanpur). MV generation by land type. The presence of new and old generations of modern rice varieties varies by land type across the sites (Table 20). Within specifi c land types, a varying proportion of both old- and new-generation MVs is grown. Old-generation
Table 20. Adoption pattern (% area) of MVs by generation and land type.
Percentage adoption Banke Siraha Tanahun All
Upland (upper fi elds)
% New-generation MVs 35 9 79 23
% Old-generation MVs 65 91 21 77
Medium land
% New-generation MVs 30 35 0 34
% Old-generation MVs 70 65 0 66
Lowland
% New-generation MVs 50 44 64 55
% Old-generation MVs 50 56 36 45
All land type
% New-generation MVs 41 34 65 40
% Old-generation MVs 59 66 35 60

58 D. Gauchan et al
MVs persist mostly in uplands (upper fi elds) and medium lands. This was more preva-lent in Banke and Siraha. Old-generation MVs are also dominant in medium lands in Siraha. The highest percentage of new-generation MV area was found in Tanahun. In aggregate of three sites, new-generation MVs are grown more in the lowland. General features of new- and old-generation MVs. The general characteristics of dominant new- and old-generation MVs in terms of their release year, origin, parental sources, and recommended ecosystem are presented in Table 19. Radha-4 and Radha-11 are the most dominant new-generation rice varieties at the study sites. Radha-4 is adopted mainly in Banke and Tanahun and Radha-11 in Siraha were both released in 1994 for rainfed regions of the mid-/far-western and central Terai region, respectively. These two varieties have some tolerance of drought and hence are popular in farmers’ fi elds. Masuli and Janaki are the two dominant old-generation Nepalese rice varieties that were developed and released by the government of Nepal in 1973 and 1979, respectively. The other dominant old-generation rice varieties grown in Siraha in eastern Nepal are Sonamasuli and Kanchhi masuli, which came from India through informal sources and are not yet released in Nepal. Sonamasuli (Sona Mahasuri in India) was released by Andhra Pradesh (state) of India in 1982, whereas the exact source of origin of Kanchhi masuli in India and its release status are not known. Kanchhi masuli has been grown in eastern Nepal since the early 1990s and it is popular among farmers’ fi elds due to its wide adaptation, good yield, and medium grain quality. Most of the dominant new-generation MVs are medium to shorter duration va-rieties with a maturity period ranging from 110 to 135 days (e.g., Radha-4, 125 days; Radha-11, 135 days; OR-367, 133 days; Judi-572, 110 days; Radha-32, 125 days; Hardinath-1, 110 days) and suited to rainfed conditions, they have some tolerance of drought (e.g., Radha-4), or they escape drought due to a short maturity period (e.g., Hardinath-1). However, most of the dominant old-generation MVs have medium to long duration, with a maturity period ranging from 135 to 156 days (e.g., Masuli, 156 days; Sonamasuli, 145 days; Sabitri, 140 days; and Janaki, 135 days). The sources of origin for many of these MVs are either IRRI or neighboring Asian countries. Janaki, Hardinath, and Makawanpur-1 came from Sri Lanka, Radha-4 and Radha-32 came from IRRI, whereas Radha-11 (Meghdoot) and OR-367 (Ram dhan) originated from India, and came through INGER. Masuli is a Malaysian variety introduced in the early 1970s and Sonamasuli came from Andhra Pradesh, India, through informal sources.
Yield effects of modern variety adoptionYield effects of MVs over TVs. The average yield of MV rice across the sites during the survey years was 3.0 t/ha (Table 21). This yield is higher than the national average of 2.9 t/ha for Nepal but lower than in many Asian countries. Between the variety types, yields of MVs are higher than TVs and are statistically signifi cant at all the sites. The yield effects of MVs are relatively higher in Banke and Tanahun. Yield effects of MV adoption by land type. Rice is grown on all three land types except in Tanahun, where rice is grown on two land types (upland and lowland). Yield effects of MV adoption by land type are presented in Table 22. MVs have no superiority
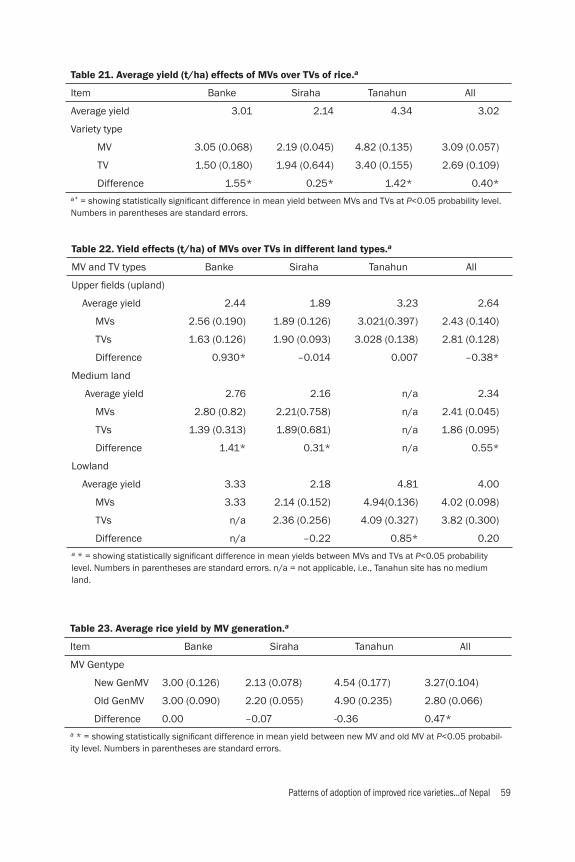
Patterns of adoption of improved rice varieties...of Nepal 59
Table 21. Average yield (t/ha) effects of MVs over TVs of rice.a
Item Banke Siraha Tanahun All
Average yield 3.01 2.14 4.34 3.02
Variety type
MV 3.05 (0.068) 2.19 (0.045) 4.82 (0.135) 3.09 (0.057)
TV 1.50 (0.180) 1.94 (0.644) 3.40 (0.155) 2.69 (0.109)
Difference 1.55* 0.25* 1.42* 0.40*a* = showing statistically signifi cant difference in mean yield between MVs and TVs at P<0.05 probability level. Numbers in parentheses are standard errors.
Table 22. Yield effects (t/ha) of MVs over TVs in different land types.a
MV and TV types Banke Siraha Tanahun All
Upper fi elds (upland)
Average yield 2.44 1.89 3.23 2.64
MVs 2.56 (0.190) 1.89 (0.126) 3.021(0.397) 2.43 (0.140)
TVs 1.63 (0.126) 1.90 (0.093) 3.028 (0.138) 2.81 (0.128)
Difference 0.930* –0.014 0.007 –0.38*
Medium land
Average yield 2.76 2.16 n/a 2.34
MVs 2.80 (0.82) 2.21(0.758) n/a 2.41 (0.045)
TVs 1.39 (0.313) 1.89(0.681) n/a 1.86 (0.095)
Difference 1.41* 0.31* n/a 0.55*
Lowland
Average yield 3.33 2.18 4.81 4.00
MVs 3.33 2.14 (0.152) 4.94(0.136) 4.02 (0.098)
TVs n/a 2.36 (0.256) 4.09 (0.327) 3.82 (0.300)
Difference n/a –0.22 0.85* 0.20 a * = showing statistically signifi cant difference in mean yields between MVs and TVs at P<0.05 probability level. Numbers in parentheses are standard errors. n/a = not applicable, i.e., Tanahun site has no medium land.
Table 23. Average rice yield by MV generation.a
Item Banke Siraha Tanahun All
MV Gentype
New GenMV 3.00 (0.126) 2.13 (0.078) 4.54 (0.177) 3.27(0.104)
Old GenMV 3.00 (0.090) 2.20 (0.055) 4.90 (0.235) 2.80 (0.066)
Difference 0.00 –0.07 -0.36 0.47*a * = showing statistically signifi cant difference in mean yield between new MV and old MV at P<0.05 probabil-ity level. Numbers in parentheses are standard errors.
60 D. Gauchan et al
in yield in upland fi elds in Tanahun and in uplands and lowlands of Siraha. However, yields of MVs are higher in uplands and medium lands in Banke and lowlands in Tanahun. Average yields of both MVs and TVs are higher in Tanahun than at the two Terai sites. Clearly, yield effects of MVs over TVs vary by site. Since many of the MVs adopted in Siraha are not very high yielding compared with the existing adapted TVs in rainfed environments, yield effects of MVs are not distinct at this site. Similarly, yield effects of MVs in upland rice in Tanahun are also not clearly observed. Yield effects of MV generation. There are no clear yield effects of new MVs over old generations by individual site (Table 23). However, in aggregate of all the sties, the yield superiority of new MVs is statistically signifi cant over older genera-tion MVs. The dominant new-generation MVs such as Radha-4 and Radha-11 have yield similar to that of dominant old-generation MVs such as Janaki, Mashuli, Sabitri, Makawanpur-1, etc. Yield effects of MV generation by land type. The yields of new- and old-generation MVs by land type are presented in Table 24. New-generation MVs are not statistically superior to old-generation MVs at each site across different land types. However, in aggregate of sites (pooled data), the performance of new and older MVs varied across land types. For instance, new MVs are superior and better performing in lowlands, whereas older MVs are better performing in medium fi elds. Dominant new and old rice varieties and their productivity. The major rice va-rieties with their average yields are presented in Table 25. The important rice varieties grown at the study sites are Radah-4 at Banke and Tanahun and Masuli, Meghdoot (Rahda-11), and Sonamasuli in Siraha and Janaki at the Banke site. Hybrid rice is also grown on a small proportion of area at the Banke and Tanahun sites. The other impor-tant modern rice varieties grown are Sabitri, Makawanpur-1, and Judi-572 in Tanahun, Shamba masuli, Panta-12 in Banke, and Jiri and Bhola at Siraha sites. Hardinath-1 is also grown by a few farmers in Banke and Tanahun. Among traditional varieties, Chobo is more prevalent in Tanahun and Basmati at the Siraha site. A majority of MVs have an average of 3 t/ha of rice yield, whereas TVs have about 2 t/ha of rice yield. Judi-572 is the only rice variety (MV) grown in the spring (Chaite) season in Tanahun. The yield of most MVs (both inbreds and hybrids) is higher in Tanahun than at Siraha and Banke sites as indicated by the statistical signifi cance of the t-test. Farmers’ perceptions and reasons for adoption of new and old MVs. Radha-4 and Radha-11 (Meghdoot) are popular new-generation varieties whereas Masuli and Janaki are old-generation common varieties at the study sites. Farmers have provided their perceptions on the traits of specifi c new- and old-generation rice varieties (Table 26). Farmers expressed preference for specifi c modern rice varieties for traits such as high yield, resistance to lodging, good taste (eating quality), and tolerance of diseases, pests, and abiotic stresses, including straw yield and quality (other positive traits). Most of the surveyed farmers responded that high yield and good taste (eating quality) are their most preferred traits for adoption. New rice varieties are mainly preferred for higher yield and resistance to lodging (Radha-4), and good taste or eating quality (Radha-11). Farmers’ continued cultivation and preference for older generation MVs
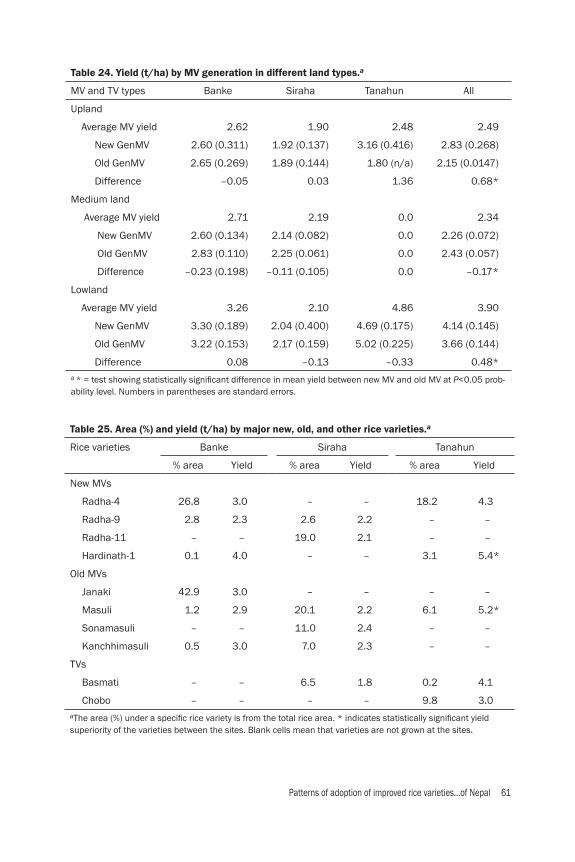
Patterns of adoption of improved rice varieties...of Nepal 61
Table 24. Yield (t/ha) by MV generation in different land types.a
MV and TV types Banke Siraha Tanahun All
Upland
Average MV yield 2.62 1.90 2.48 2.49
New GenMV 2.60 (0.311) 1.92 (0.137) 3.16 (0.416) 2.83 (0.268)
Old GenMV 2.65 (0.269) 1.89 (0.144) 1.80 (n/a) 2.15 (0.0147)
Difference –0.05 0.03 1.36 0.68*
Medium land
Average MV yield 2.71 2.19 0.0 2.34
New GenMV 2.60 (0.134) 2.14 (0.082) 0.0 2.26 (0.072)
Old GenMV 2.83 (0.110) 2.25 (0.061) 0.0 2.43 (0.057)
Difference –0.23 (0.198) –0.11 (0.105) 0.0 –0.17*
Lowland
Average MV yield 3.26 2.10 4.86 3.90
New GenMV 3.30 (0.189) 2.04 (0.400) 4.69 (0.175) 4.14 (0.145)
Old GenMV 3.22 (0.153) 2.17 (0.159) 5.02 (0.225) 3.66 (0.144)
Difference 0.08 –0.13 –0.33 0.48*a * = test showing statistically signifi cant difference in mean yield between new MV and old MV at P<0.05 prob-ability level. Numbers in parentheses are standard errors.
Table 25. Area (%) and yield (t/ha) by major new, old, and other rice varieties.a
Rice varieties Banke Siraha Tanahun
% area Yield % area Yield % area Yield
New MVs
Radha-4 26.8 3.0 – – 18.2 4.3
Radha-9 2.8 2.3 2.6 2.2 – –
Radha-11 – – 19.0 2.1 – –
Hardinath-1 0.1 4.0 – – 3.1 5.4*
Old MVs
Janaki 42.9 3.0 – – – –
Masuli 1.2 2.9 20.1 2.2 6.1 5.2*
Sonamasuli – – 11.0 2.4 – –
Kanchhimasuli 0.5 3.0 7.0 2.3 – –
TVs
Basmati – – 6.5 1.8 0.2 4.1
Chobo – – – – 9.8 3.0aThe area (%) under a specifi c rice variety is from the total rice area. * indicates statistically signifi cant yield superiority of the varieties between the sites. Blank cells mean that varieties are not grown at the sites.
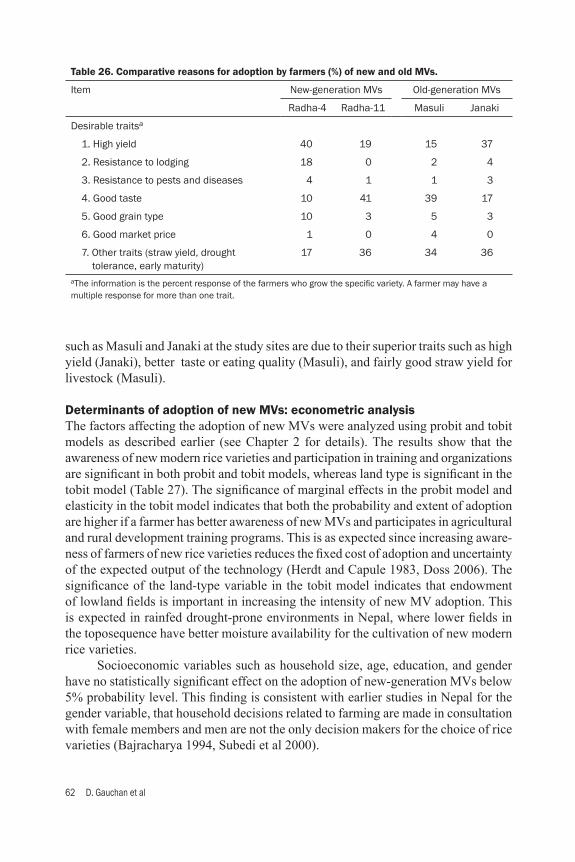
62 D. Gauchan et al
Table 26. Comparative reasons for adoption by farmers (%) of new and old MVs.
Item New-generation MVs Old-generation MVs
Radha-4 Radha-11 Masuli Janaki
Desirable traitsa
1. High yield 40 19 15 37
2. Resistance to lodging 18 0 2 4
3. Resistance to pests and diseases 4 1 1 3
4. Good taste 10 41 39 17
5. Good grain type 10 3 5 3
6. Good market price 1 0 4 0
7. Other traits (straw yield, drought tolerance, early maturity)
17 36 34 36
aThe information is the percent response of the farmers who grow the specifi c variety. A farmer may have a multiple response for more than one trait.
such as Masuli and Janaki at the study sites are due to their superior traits such as high yield (Janaki), better taste or eating quality (Masuli), and fairly good straw yield for livestock (Masuli).
Determinants of adoption of new MVs: econometric analysisThe factors affecting the adoption of new MVs were analyzed using probit and tobit models as described earlier (see Chapter 2 for details). The results show that the awareness of new modern rice varieties and participation in training and organizations are signifi cant in both probit and tobit models, whereas land type is signifi cant in the tobit model (Table 27). The signifi cance of marginal effects in the probit model and elasticity in the tobit model indicates that both the probability and extent of adoption are higher if a farmer has better awareness of new MVs and participates in agricultural and rural development training programs. This is as expected since increasing aware-ness of farmers of new rice varieties reduces the fi xed cost of adoption and uncertainty of the expected output of the technology (Herdt and Capule 1983, Doss 2006). The signifi cance of the land-type variable in the tobit model indicates that endowment of lowland fi elds is important in increasing the intensity of new MV adoption. This is expected in rainfed drought-prone environments in Nepal, where lower fi elds in the toposequence have better moisture availability for the cultivation of new modern rice varieties. Socioeconomic variables such as household size, age, education, and gender have no statistically signifi cant effect on the adoption of new-generation MVs below 5% probability level. This fi nding is consistent with earlier studies in Nepal for the gender variable, that household decisions related to farming are made in consultation with female members and men are not the only decision makers for the choice of rice varieties (Bajracharya 1994, Subedi et al 2000).
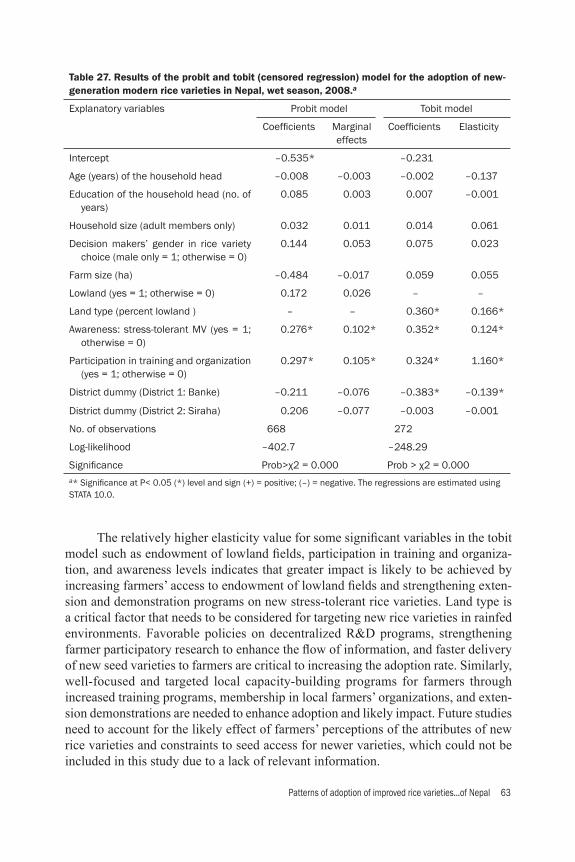
Patterns of adoption of improved rice varieties...of Nepal 63
Table 27. Results of the probit and tobit (censored regression) model for the adoption of new-generation modern rice varieties in Nepal, wet season, 2008.a
Explanatory variables Probit model Tobit model
Coeffi cients Marginal effects
Coeffi cients Elasticity
Intercept –0.535* –0.231
Age (years) of the household head –0.008 –0.003 –0.002 –0.137
Education of the household head (no. of years)
0.085 0.003 0.007 –0.001
Household size (adult members only) 0.032 0.011 0.014 0.061
Decision makers’ gender in rice variety choice (male only = 1; otherwise = 0)
0.144 0.053 0.075 0.023
Farm size (ha) –0.484 –0.017 0.059 0.055
Lowland (yes = 1; otherwise = 0) 0.172 0.026 – –
Land type (percent lowland ) – – 0.360* 0.166*
Awareness: stress-tolerant MV (yes = 1; otherwise = 0)
0.276* 0.102* 0.352* 0.124*
Participation in training and organization (yes = 1; otherwise = 0)
0.297* 0.105* 0.324* 1.160*
District dummy (District 1: Banke) –0.211 –0.076 –0.383* –0.139*
District dummy (District 2: Siraha) 0.206 –0.077 –0.003 –0.001
No. of observations 668 272
Log-likelihood –402.7 –248.29
Signifi cance Prob>χ2 = 0.000 Prob > χ2 = 0.000a* Signifi cance at P< 0.05 (*) level and sign (+) = positive; (–) = negative. The regressions are estimated using STATA 10.0.
The relatively higher elasticity value for some signifi cant variables in the tobit model such as endowment of lowland fi elds, participation in training and organiza-tion, and awareness levels indicates that greater impact is likely to be achieved by increasing farmers’ access to endowment of lowland fi elds and strengthening exten-sion and demonstration programs on new stress-tolerant rice varieties. Land type is a critical factor that needs to be considered for targeting new rice varieties in rainfed environments. Favorable policies on decentralized R&D programs, strengthening farmer participatory research to enhance the fl ow of information, and faster delivery of new seed varieties to farmers are critical to increasing the adoption rate. Similarly, well-focused and targeted local capacity-building programs for farmers through increased training programs, membership in local farmers’ organizations, and exten-sion demonstrations are needed to enhance adoption and likely impact. Future studies need to account for the likely effect of farmers’ perceptions of the attributes of new rice varieties and constraints to seed access for newer varieties, which could not be included in this study due to a lack of relevant information.

64 D. Gauchan et al
Economics of rice production and household economyInput use and costs and returns in rice production. The important inputs used in rice production are seeds, chemical fertilizer, organic fertilizer (FYM/compost), labor, and animal power (Table 28). Some farmers, particularly at Banke and Siraha (Terai) sites, also use tractors for land preparation and threshing. A few farmers also use pesticides (insecticides and fungicides, including herbicides) in controlling diseases, pests, and weeds. The use of irrigation is limited. It is mainly used for supplemental purposes during moisture-scarcity periods. The different types of inputs used are briefl y outlined below.
• SeedsSeed use per hectare varies across sites: the lowest is in Siraha (52 kg/ha), it is inter-mediate in Banke (83 kg/ha), and it is very high in Tanahun (119 kg/ha). The seeding rates are higher in Tanahun largely to compensate for poor germination and stand es-tablishment caused by uncertainty of rainfall and water shortage. For direct-seeded rice (early-season upland rice), the seeding rates are much higher than for transplanted rice.
• FertilizerThe use of chemical fertilizers is widespread among farmers at the study sites. The survey found that 94% of the farmers use chemical fertilizers such as urea, diam-monium phosphate (DAP), and muriate of potash (MOP). The nutrient form in urea is 46% nitrogen, DAP with 18:46:0 (N and P2O5), and MOP with 60% percent K2O. The average use of fertilizer at the study sites ranges from 40 to 48 kg N/ha, 6 to 10 kg P/ha, and 2 to 7 kg K/ha, which is higher in terms of national average use (30 kg
Table 28. Input use in rice production for wet-season rice in Nepal, 2008.
Itema Banke Siraha Tanahun All
Seed (kg/ha) 83 52 119 84
Fertilizer (kg/ha)
N 47 40 48 45
P 6.3 10.0 10.0 8.9
K 1.9 7.5 3.8 3.8
Organic fertilizer (manure) (kg/ha) 3,062 2,108 5,287 3,424
Pesticide use (L/ha) 0 0 0.19 0.06
Labor (days/ha) 178 167 299 212
Power
-Bullock labor (days/ha) 13.4 16.0 39.1 22.3
-Tractor (hours/ha) 2.4 2.8 0.3 1.9
-Thresher (hours/ha) 0.7 0.3 0.0 0.3a*P and K are in the elemental form (they are derived from the conversion of P2O5 and K2O us-ing 0.83 for P2O5 and 0.44 for K2O). The input use comes from the largest parcels.
Patterns of adoption of improved rice varieties...of Nepal 65
N/ha) but much lower than the 78 kg N/ha for India (Indiastat.com), Bangladesh, and other Asian countries (FAOSTAT 2007).
• Organic fertilizerFarmyard manure (FYM), compost, and poultry manure are the most commonly used organic manures at the study sites. The use of organic fertilizer is fairly high, ranging from about 2 t/ha in Siraha to 5 t/ha in Tanahun. Farmers normally use more organic manure in the hills than in the Terai. The low use of organic manure in the Terai is due to limited access to forests for fi rewood and increased use of cow dung (a major source of organic fertilizer) in cooking as the main household energy source.
• LaborLabor use (person-days/hectare) varies across the sites, with higher use in Tanahun in the hills. The higher labor use for rice production in Tanahun is due to shorter working hours (6–7 per day), low use of tractors for production, harvesting, and postharvest activities, and more labor time required for cultivating on small terraces in the hills. Moreover, the use of organic fertilizer (which is bulky and weighty in nature) for transport and application in fi elds through foot trails on hill slopes also signifi cantly increases labor required. Farmers also put more care and management into the rice crop at the site as rice is a prestigious crop compared with maize and millet in the hills. Overall, labor use per hectare is higher in Nepal due to the limited use of machinery for cultivation, threshing, and transport of inputs and outputs for rice farming.
• Animal powerBullocks are mainly used for heavy agricultural operations such as plowing and level-ing fi elds, and transporting output from fi elds to the yard of the homestead (mainly in Terai) and threshing the crop. They are used in pairs and are owned or hired for specifi c operations. The use of animal power is higher in Tanahun (a hill site) due largely to the limited use of tractors for land preparation.
• Mechanical powerThe use of mechanical power is most common in Banke and Siraha. Tractors and threshers are the most common mechanical power used in the cultivation and thresh-ing of rice. Tractors (power tillers and tractors) are used for plowing, land leveling, and transporting inputs (fertilizer, manure) to fi elds and harvested products (grains and straw) to the homestead. Threshers are used for separating grains from the straw after the harvest of the crops. Labor use in different rice production activities. Human labor is used in all rice production activities from land preparation to harvesting and postharvest activities (Table 29). Farmers use more labor (person-days per hectare) for crop establishment (transplanting), harvesting, weeding, and threshing activities as these are the main operations consuming labor for rice farming. Weeding consumes the most person-days/ha in Tanahun (71.9). The proportion of labor use by different rice production activities is presented in Appendix 2, which indicates that crop establishment, weeding,
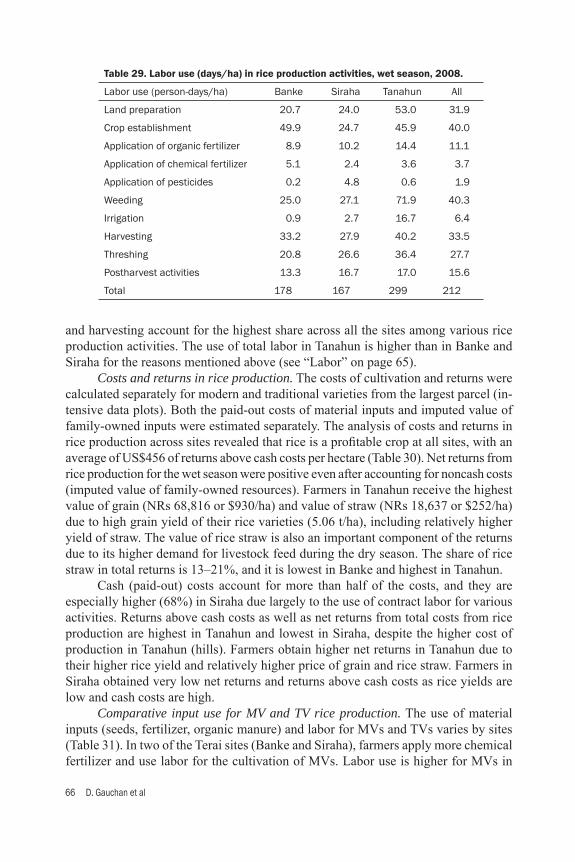
66 D. Gauchan et al
and harvesting account for the highest share across all the sites among various rice production activities. The use of total labor in Tanahun is higher than in Banke and Siraha for the reasons mentioned above (see “Labor” on page 65). Costs and returns in rice production. The costs of cultivation and returns were calculated separately for modern and traditional varieties from the largest parcel (in-tensive data plots). Both the paid-out costs of material inputs and imputed value of family-owned inputs were estimated separately. The analysis of costs and returns in rice production across sites revealed that rice is a profi table crop at all sites, with an average of US$456 of returns above cash costs per hectare (Table 30). Net returns from rice production for the wet season were positive even after accounting for noncash costs (imputed value of family-owned resources). Farmers in Tanahun receive the highest value of grain (NRs 68,816 or $930/ha) and value of straw (NRs 18,637 or $252/ha) due to high grain yield of their rice varieties (5.06 t/ha), including relatively higher yield of straw. The value of rice straw is also an important component of the returns due to its higher demand for livestock feed during the dry season. The share of rice straw in total returns is 13–21%, and it is lowest in Banke and highest in Tanahun. Cash (paid-out) costs account for more than half of the costs, and they are especially higher (68%) in Siraha due largely to the use of contract labor for various activities. Returns above cash costs as well as net returns from total costs from rice production are highest in Tanahun and lowest in Siraha, despite the higher cost of production in Tanahun (hills). Farmers obtain higher net returns in Tanahun due to their higher rice yield and relatively higher price of grain and rice straw. Farmers in Siraha obtained very low net returns and returns above cash costs as rice yields are low and cash costs are high. Comparative input use for MV and TV rice production. The use of material inputs (seeds, fertilizer, organic manure) and labor for MVs and TVs varies by sites (Table 31). In two of the Terai sites (Banke and Siraha), farmers apply more chemical fertilizer and use labor for the cultivation of MVs. Labor use is higher for MVs in
Table 29. Labor use (days/ha) in rice production activities, wet season, 2008.
Labor use (person-days/ha) Banke Siraha Tanahun All
Land preparation 20.7 24.0 53.0 31.9
Crop establishment 49.9 24.7 45.9 40.0
Application of organic fertilizer 8.9 10.2 14.4 11.1
Application of chemical fertilizer 5.1 2.4 3.6 3.7
Application of pesticides 0.2 4.8 0.6 1.9
Weeding 25.0 27.1 71.9 40.3
Irrigation 0.9 2.7 16.7 6.4
Harvesting 33.2 27.9 40.2 33.5
Threshing 20.8 26.6 36.4 27.7
Postharvest activities 13.3 16.7 17.0 15.6
Total 178 167 299 212
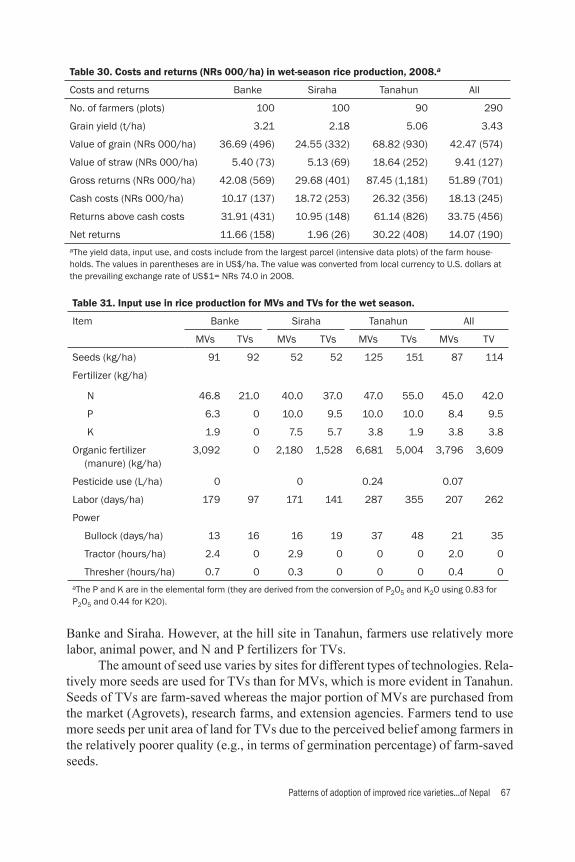
Patterns of adoption of improved rice varieties...of Nepal 67
Banke and Siraha. However, at the hill site in Tanahun, farmers use relatively more labor, animal power, and N and P fertilizers for TVs. The amount of seed use varies by sites for different types of technologies. Rela-tively more seeds are used for TVs than for MVs, which is more evident in Tanahun. Seeds of TVs are farm-saved whereas the major portion of MVs are purchased from the market (Agrovets), research farms, and extension agencies. Farmers tend to use more seeds per unit area of land for TVs due to the perceived belief among farmers in the relatively poorer quality (e.g., in terms of germination percentage) of farm-saved seeds.
Table 30. Costs and returns (NRs 000/ha) in wet-season rice production, 2008.a
Costs and returns Banke Siraha Tanahun All
No. of farmers (plots) 100 100 90 290
Grain yield (t/ha) 3.21 2.18 5.06 3.43
Value of grain (NRs 000/ha) 36.69 (496) 24.55 (332) 68.82 (930) 42.47 (574)
Value of straw (NRs 000/ha) 5.40 (73) 5.13 (69) 18.64 (252) 9.41 (127)
Gross returns (NRs 000/ha) 42.08 (569) 29.68 (401) 87.45 (1,181) 51.89 (701)
Cash costs (NRs 000/ha) 10.17 (137) 18.72 (253) 26.32 (356) 18.13 (245)
Returns above cash costs 31.91 (431) 10.95 (148) 61.14 (826) 33.75 (456)
Net returns 11.66 (158) 1.96 (26) 30.22 (408) 14.07 (190)aThe yield data, input use, and costs include from the largest parcel (intensive data plots) of the farm house-holds. The values in parentheses are in US$/ha. The value was converted from local currency to U.S. dollars at the prevailing exchange rate of US$1= NRs 74.0 in 2008.
Table 31. Input use in rice production for MVs and TVs for the wet season.
Item Banke Siraha Tanahun All
MVs TVs MVs TVs MVs TVs MVs TV
Seeds (kg/ha) 91 92 52 52 125 151 87 114
Fertilizer (kg/ha)
N 46.8 21.0 40.0 37.0 47.0 55.0 45.0 42.0
P 6.3 0 10.0 9.5 10.0 10.0 8.4 9.5
K 1.9 0 7.5 5.7 3.8 1.9 3.8 3.8
Organic fertilizer (manure) (kg/ha)
3,092 0 2,180 1,528 6,681 5,004 3,796 3,609
Pesticide use (L/ha) 0 0 0.24 0.07
Labor (days/ha) 179 97 171 141 287 355 207 262
Power
Bullock (days/ha) 13 16 16 19 37 48 21 35
Tractor (hours/ha) 2.4 0 2.9 0 0 0 2.0 0
Thresher (hours/ha) 0.7 0 0.3 0 0 0 0.4 0aThe P and K are in the elemental form (they are derived from the conversion of P2O5 and K2O using 0.83 for P2O5 and 0.44 for K2O).
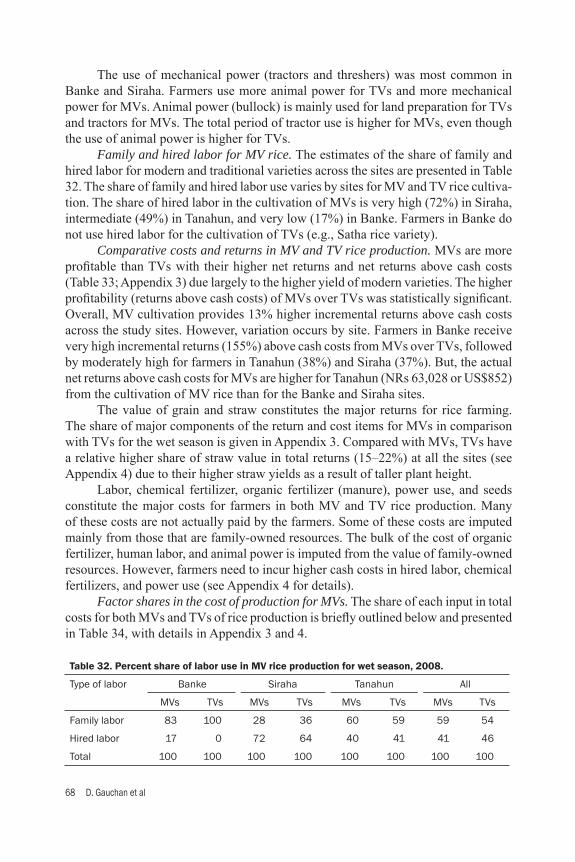
68 D. Gauchan et al
Table 32. Percent share of labor use in MV rice production for wet season, 2008.
Type of labor Banke Siraha Tanahun All
MVs TVs MVs TVs MVs TVs MVs TVs
Family labor 83 100 28 36 60 59 59 54
Hired labor 17 0 72 64 40 41 41 46
Total 100 100 100 100 100 100 100 100
The use of mechanical power (tractors and threshers) was most common in Banke and Siraha. Farmers use more animal power for TVs and more mechanical power for MVs. Animal power (bullock) is mainly used for land preparation for TVs and tractors for MVs. The total period of tractor use is higher for MVs, even though the use of animal power is higher for TVs. Family and hired labor for MV rice. The estimates of the share of family and hired labor for modern and traditional varieties across the sites are presented in Table 32. The share of family and hired labor use varies by sites for MV and TV rice cultiva-tion. The share of hired labor in the cultivation of MVs is very high (72%) in Siraha, intermediate (49%) in Tanahun, and very low (17%) in Banke. Farmers in Banke do not use hired labor for the cultivation of TVs (e.g., Satha rice variety). Comparative costs and returns in MV and TV rice production. MVs are more profi table than TVs with their higher net returns and net returns above cash costs (Table 33; Appendix 3) due largely to the higher yield of modern varieties. The higher profi tability (returns above cash costs) of MVs over TVs was statistically signifi cant. Overall, MV cultivation provides 13% higher incremental returns above cash costs across the study sites. However, variation occurs by site. Farmers in Banke receive very high incremental returns (155%) above cash costs from MVs over TVs, followed by moderately high for farmers in Tanahun (38%) and Siraha (37%). But, the actual net returns above cash costs for MVs are higher for Tanahun (NRs 63,028 or US$852) from the cultivation of MV rice than for the Banke and Siraha sites. The value of grain and straw constitutes the major returns for rice farming. The share of major components of the return and cost items for MVs in comparison with TVs for the wet season is given in Appendix 3. Compared with MVs, TVs have a relative higher share of straw value in total returns (15–22%) at all the sites (see Appendix 4) due to their higher straw yields as a result of taller plant height. Labor, chemical fertilizer, organic fertilizer (manure), power use, and seeds constitute the major costs for farmers in both MV and TV rice production. Many of these costs are not actually paid by the farmers. Some of these costs are imputed mainly from those that are family-owned resources. The bulk of the cost of organic fertilizer, human labor, and animal power is imputed from the value of family-owned resources. However, farmers need to incur higher cash costs in hired labor, chemical fertilizers, and power use (see Appendix 4 for details). Factor shares in the cost of production for MVs. The share of each input in total costs for both MVs and TVs of rice production is briefl y outlined below and presented in Table 34, with details in Appendix 3 and 4.
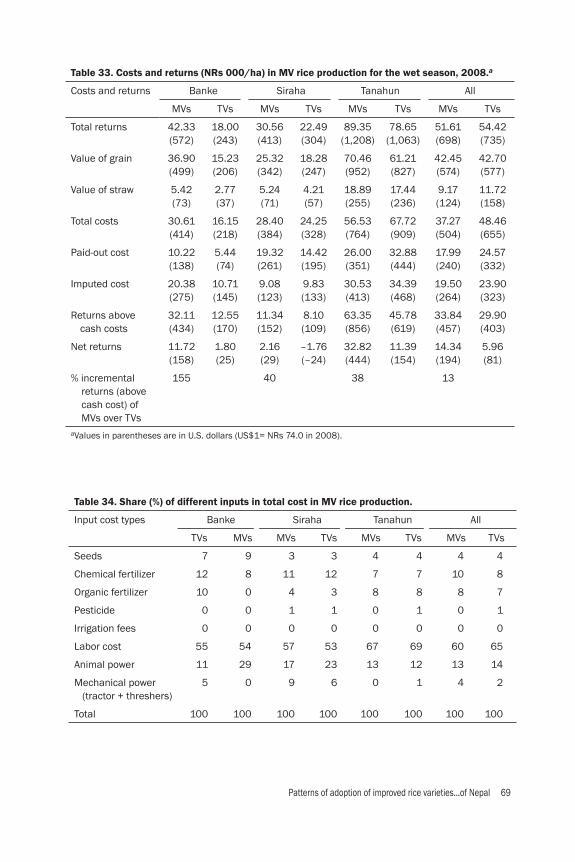
Patterns of adoption of improved rice varieties...of Nepal 69
Table 33. Costs and returns (NRs 000/ha) in MV rice production for the wet season, 2008.a
Costs and returns Banke Siraha Tanahun All
MVs TVs MVs TVs MVs TVs MVs TVs
Total returns 42.33(572)
18.00 (243)
30.56 (413)
22.49 (304)
89.35 (1,208)
78.65 (1,063)
51.61(698)
54.42(735)
Value of grain 36.90(499)
15.23 (206)
25.32 (342)
18.28 (247)
70.46 (952)
61.21 (827)
42.45(574)
42.70 (577)
Value of straw 5.42(73)
2.77 (37)
5.24 (71)
4.21 (57)
18.89 (255)
17.44 (236)
9.17(124)
11.72(158)
Total costs 30.61(414)
16.15(218)
28.40 (384)
24.25 (328)
56.53 (764)
67.72 (909)
37.27(504)
48.46(655)
Paid-out cost 10.22(138)
5.44 (74)
19.32 (261)
14.42 (195)
26.00 (351)
32.88 (444)
17.99(240)
24.57(332)
Imputed cost 20.38 (275)
10.71 (145)
9.08 (123)
9.83 (133)
30.53 (413)
34.39(468)
19.50 (264)
23.90 (323)
Returns above cash costs
32.11 (434)
12.55 (170)
11.34 (152)
8.10 (109)
63.35 (856)
45.78 (619)
33.84 (457)
29.90 (403)
Net returns 11.72 (158)
1.80 (25)
2.16 (29)
–1.76 (–24)
32.82 (444)
11.39 (154)
14.34 (194)
5.96 (81)
% incremental returns (above cash cost) of MVs over TVs
155 40 38 13
aValues in parentheses are in U.S. dollars (US$1= NRs 74.0 in 2008).
Table 34. Share (%) of different inputs in total cost in MV rice production.
Input cost types Banke Siraha Tanahun All
TVs MVs MVs TVs MVs TVs MVs TVs
Seeds 7 9 3 3 4 4 4 4
Chemical fertilizer 12 8 11 12 7 7 10 8
Organic fertilizer 10 0 4 3 8 8 8 7
Pesticide 0 0 1 1 0 1 0 1
Irrigation fees 0 0 0 0 0 0 0 0
Labor cost 55 54 57 53 67 69 60 65
Animal power 11 29 17 23 13 12 13 14
Mechanical power (tractor + threshers)
5 0 9 6 0 1 4 2
Total 100 100 100 100 100 100 100 100
70 D. Gauchan et al
• Seed costsSeed costs account for a small proportion of the total costs (3–9%) and are similar for MVs and TVs across the sites (Table 34). MVs have a relatively higher share of cash costs since farmers need to buy seeds from the market (Appendix 4).
• Fertilizers and other agrochemicalsOn average, the share of the costs of chemical fertilizer in total costs is higher for MVs (10%) than for TVs (8%) across the sites. Agrochemicals other than fertilizers that are used on the rice farm include pesticides (insecticides, fungicides, herbicides). But these account for a very tiny fraction of the total cost of production.
• Cost of organic fertilizersThe proportion of cash costs for organic fertilizer is low at all sites compared with noncash costs as most of these organic fertilizers (mostly farmyard manure and compost) are produced on the farm. The amount of total cost for organic fertilizer is similar for both MVs and TVs.
• Labor costsLabor costs account for the largest share (53–69%) of total costs in both MV and TV rice production at all the sites. The share of labor costs does not vary much between MV and TV rice cultivation. Among the three sites, farmers in Tanahun incur the highest labor costs for both MV and TV rice, which is two-thirds (67–69%) of the total cost of production. This is due largely to the higher use of labor and higher wage rate of labor in Tanahun. The share of hired labor cost is higher in Siraha whereas the share of family labor cost is higher in Banke and Tanahun (Appendix 4). The higher share of hired labor cost in Siraha (eastern Terai) is due to higher contract costs for labor in rice farming.
• Power use costsThe total costs for power use are similar for both MVs and TVs despite differences in the type of power used for cultivation. The cost of animal power is more for TVs, while the cost of mechanical power is more for MVs. In aggregate, the total costs of power use between the types of technologies are not much different across sites.
Comparative input use and costs and returns for new and old MVsInput use by new and old MVs. The data on farmers’ use of material inputs (seeds, fertilizer, organic manure) and labor for the new and old MVs are presented in Table 35. Analysis showed that there are some differences between old and new MVs for the use of inputs (e.g., seeds, N fertilizer, and labor). Farmers use relatively more or fewer inputs for new MVs depending on the nature of the new MVs grown at the site and farmers’ differences in the perceived stress characteristics. Farmers use a higher seed rate for old MVs in Banke, but, in Tanahun, they use it for new MVs. However, the seed rate for both new and old MVs is similar in Siraha. Since old MV seeds (e.g., Janakai

Patterns of adoption of improved rice varieties...of Nepal 71
variety) are mostly farm produced and degenerated, farmers in Banke use higher seed rates for them. But, in Tanahun, the higher seed rate for new MVs is due to farmers planting newer MVs such as Radha-4 in more marginal drought-prone fi elds, where a higher seed rate is used to get more secure plant growth during rainfed conditions. Farmers also use a higher N fertilizer (urea) rate for old MVs in Siraha since many of the old MVs grown at this site are more fertilizer responsive such as Sona-masuli, Kanchhimasuli, and Sabitri. Similarly, farmers in Banke and Tanahun use more compost for old MVs because they perceive that old MVs (Janaki and Masuli) require more nutrients to perform well compared with new MVs such as Radha-4, which can be grown with less added nutrients in marginal fi elds. The use of human labor per hectare is also higher for old MVs in Banke and Siraha as many of the old MVs are longer duration and relatively higher yielding (e.g., Sonamasuli in Siraha and Janaki in Banke) compared with new MVs such as Radha-4 in Banke and Radha-11 in Siraha. Hence, farmers use more human labor due to the longer period of crop cultivation and additional labor for harvesting, transport, and threshing of the additional product due to its relatively higher yield (e.g., Sonamasuli in Siraha). However, in aggregate of the sites, no clear differences were observed on the use of farm power (both animal and machines) and the use of P and K fertilizers between old and new MVs. The comparative costs and returns (in NRs/ha and US$/ha) between old and new MVs for the wet season are given in Table 36 and Appendix 5. New MVs are relatively more profi table than old MVs only in aggregate by providing 33% higher incremental returns (above cash costs) over older MVs. However, they are not profi t-able individually in Banke and Siraha and are only marginally profi table in Tanahun.
Table 35. Input use in rice production for new and old MVs for the wet season.
Item Banke Siraha Tanahun All
NewMVs
Old MVs
NewMVs
Old MVs
New MVs
Old MVs
New MVs
Old MVs
Seeds (kg/ha) 90 101 51 52 130 119 98 87
Fertilizera (kg/ha)
N 50.5 46.0 31.5 45.0 49.7 46.0 44.7 45.0
P 5.1 6.3 8.9 11.0 10.0 10.5 8.6 8.9
K 1.5 1.9 6.2 7.5 3.6 1.9 3.8 3.8
Organic fertilizer (manure) kg/ha
2,438 3,809 2,268 5,472 6,433 3,852 3,530
Pesticide use (L/ha) 12.8 0 0.1 0 0.2 0 0.1 0
Labor (days/ha) 172 185 151 181 297 293 226 201
Bullock labor (days/ha) 12.9 13.1 14.1 16.6 38.5 38.2 25.6 18.6
Tractor use (hours/ha) 2.9 1.6 2.6 3.1 0 0 1.4 2.0
Thresher use (hours/ha) 1.1 0.8 0.4 0.2 0 0 0.4 0.4aThe P and K are in the elemental form (they are derived from the conversion of P2O5 and K2O using 0.83 for P2O5 and 0.44 for K2O).
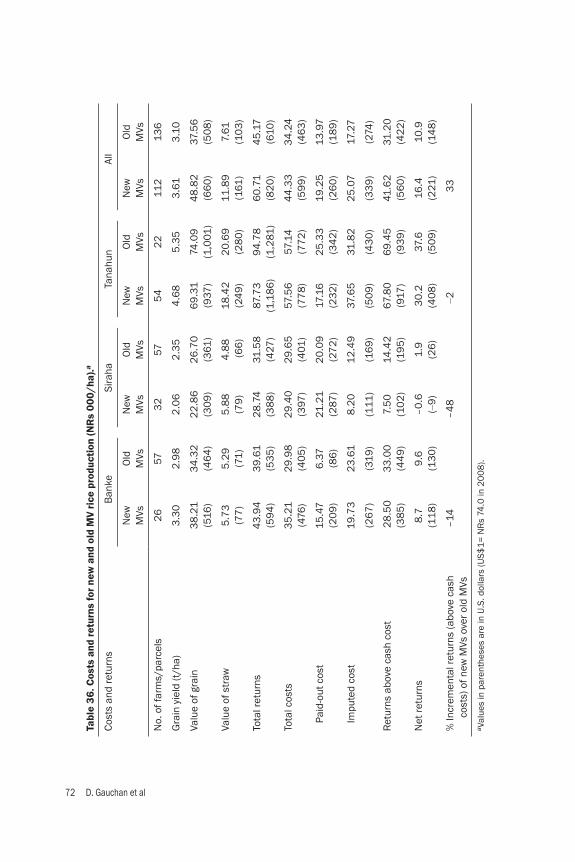
72 D. Gauchan et al
Tabl
e 36
. Cos
ts a
nd r
etur
ns fo
r ne
w a
nd o
ld M
V ri
ce p
rodu
ctio
n (N
Rs
000/
ha).a
Cost
s an
d re
turn
sB
anke
Sira
haTa
nahu
nAl
l
New
M
VsO
ld
MVs
New
M
VsO
ld
MVs
New
M
VsO
ld
MVs
New
M
VsO
ld
MVs
No.
of f
arm
s/pa
rcel
s2
657
32
575
42
211
213
6
Gra
in y
ield
(t/h
a)3
.30
2.9
82
.06
2.3
54
.68
5.3
53
.61
3.1
0
Valu
e of
gra
in
38
.21
(5
16)
34
.32
(4
64
)2
2.8
6
(30
9)
26
.70
(3
61)
69
.31
(9
37)
74.0
9
(1,0
01)
48
.82
(6
60
)37
.56
(5
08
)
Valu
e of
str
aw5
.73
(7
7)
5.2
9
(71
)5
.88
(7
9)
4.8
8 (6
6)
18.4
2
(24
9)
20
.69
(2
80
)11
.89
(1
61)
7.61
(1
03
)
Tota
l ret
urns
43
.94
(5
94
)3
9.6
1
(53
5)
28
.74
(3
88
)31
.58
(4
27)
87.7
3
(1,1
86
)9
4.7
8
(1,2
81)
60
.71
(8
20
)4
5.1
7
(610
)
Tota
l cos
ts3
5.2
1
(476
)2
9.9
8
(40
5)
29
.40
(3
97)
29
.65
(4
01)
57.5
6
(77
8)
57.1
4
(77
2)
44
.33
(5
99
)3
4.2
4
(46
3)
Pa
id-o
ut c
ost
15
.47
(20
9)
6.3
7(8
6)
21.2
1(2
87)
20
.09
(27
2)
17.1
6(2
32
)2
5.3
3(3
42
)19
.25
(26
0)
13.9
7(1
89
)
Im
pute
d co
st19
.73
23
.61
8.2
01
2.4
937
.65
31.8
22
5.0
717
.27
(2
67
)(3
19)
(111
)(1
69
)(5
09
)(4
30
)(3
39
)(2
74)
Ret
urns
abo
ve c
ash
cost
2
8.5
0
(38
5)
33
.00
(4
49
)7.
50
(1
02
)14
.42
(1
95
)6
7.8
0
(917
)6
9.4
5
(93
9)
41.6
2
(56
0)
31.2
0
(42
2)
Net
retu
rns
8.7
(1
18)
9.6
(1
30
)–
0.6
(‒
9)
1.9
(2
6)
30
.2
(40
8)
37.6
(5
09
)16
.4
(221
)10
.9
(14
8)
% In
crem
enta
l ret
urns
(abo
ve c
ash
cost
s) o
f new
MVs
ove
r old
MVs
–14
–4
8‒2
33
a Val
ues
in p
aren
thes
es a
re in
U.S
. dol
lars
(US$
1=
NR
s 74
.0 in
20
08
).

Patterns of adoption of improved rice varieties...of Nepal 73
Paid-out costs are higher for new MVs than for old MVs at the Terai sites (Banke and Siraha), due largely to the higher use of chemical fertilizers and use of more purchased seeds. However, at the hill site in Tanahun, imputed (noncash) cost is relatively higher for new MVs despite total costs for the old and new MVs being the same. This is because farmers allocate a higher share of family labor costs (and lower share of hired labor cost) to the total cost of production for new MVs as against old MVs (Appendix 6).
Costs and returns for major nonrice cropsThe costs and returns for major nonrice crops are analyzed based on cash costs without taking into consideration noncash costs that include the imputed value of family-owned resources (family labor, owned organic fertilizers, seeds, animal power, etc.). Wheat and maize are two important nonrice crops that are important for the food security and livelihood of the farmers at the study sites (Tables 37 and 38). Wheat. Wheat is grown during the dry season after the rice harvest. The sum-mary of costs and returns in wheat production is presented in Table 37. There is a high variation in yield of wheat among sites. The yield of wheat is high in Banke (3.5 t/ha), intermediate in Siraha (2.06 t/ha), and low in Tanahun (1.12 t/ha). Gross returns therefore are highest in Banke (NRs 47,755/ha or $645/ha) and lowest in Tanahun (NRs 18,564 or $251/ha). The cash costs for the wheat crop are very low ($28–58/ha) as a limited amount of hired labor, machinery, and fertilizer is used for wheat production. The returns above cash costs for wheat production (for average of three sites) appear to be fairly high ($473/ha) due to its low cash cost of production. Maize. Farmers at the study site choose to grow a portion of the farm area for the cultivation of maize, particularly in the upper fi elds (uplands) and on hill slopes, where rice cultivation is not possible. However, during the dry season (spring and winter months), maize is mainly grown in rice fi elds. A large portion of farmers (94%) in Tanahun grow maize during both the wet and spring seasons. During the wet season, maize is grown on both unbunded hill slopes in hills (e.g., Tanahun) and in upland fi elds in Terai (e.g., Banke and Siraha), where water availability is not adequate for growing rice. Yield of maize in Siraha is fairly high (4.34 t/ha) since it is being grown during the dry season as a cash crop, and most of it is hybrids. The summary of costs and returns in maize production is given in Table 38. The cash costs incurred for the cultivation of maize are low at all the sites but the gross returns are fairly high, par-ticularly in Siraha (NRs 64,710/ha or $874/ha) due to the cultivation of hybrid maize. The average returns above cash costs for maize are relatively high ($416/ha) due to its very low cash cost of production.
Rice production, consumption, and other usesRice is an important staple crop of the farmers at the study sites, since almost all of the sample households (90–95%) produce rice for their livelihood needs (Table 39). Rice production is mainly semi-subsubsistence in nature, in which most of the rice (71%) produced is consumed in the households. Data showed that a small proportion (12%)
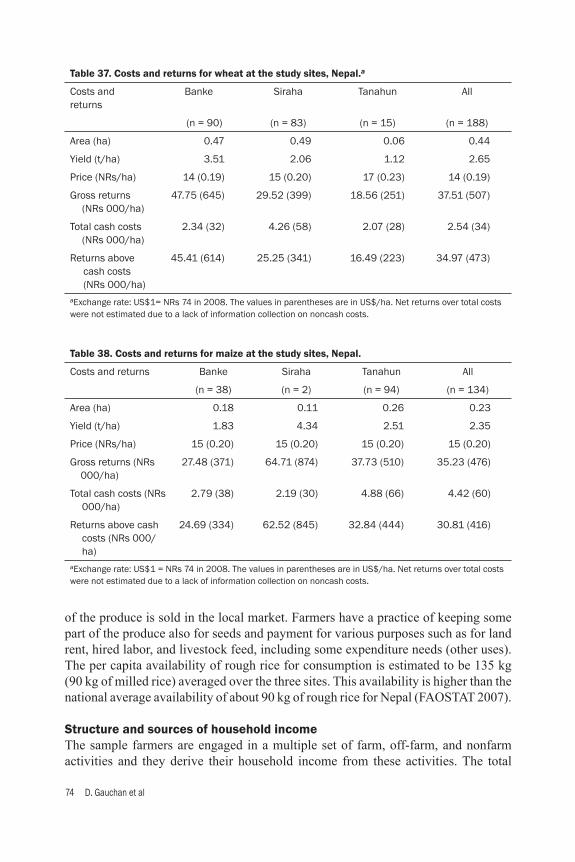
74 D. Gauchan et al
Table 37. Costs and returns for wheat at the study sites, Nepal.a
Costs and returns
Banke Siraha Tanahun All
(n = 90) (n = 83) (n = 15) (n = 188)
Area (ha) 0.47 0.49 0.06 0.44
Yield (t/ha) 3.51 2.06 1.12 2.65
Price (NRs/ha) 14 (0.19) 15 (0.20) 17 (0.23) 14 (0.19)
Gross returns (NRs 000/ha)
47.75 (645) 29.52 (399) 18.56 (251) 37.51 (507)
Total cash costs (NRs 000/ha)
2.34 (32) 4.26 (58) 2.07 (28) 2.54 (34)
Returns above cash costs (NRs 000/ha)
45.41 (614) 25.25 (341) 16.49 (223) 34.97 (473)
aExchange rate: US$1= NRs 74 in 2008. The values in parentheses are in US$/ha. Net returns over total costs were not estimated due to a lack of information collection on noncash costs.
Table 38. Costs and returns for maize at the study sites, Nepal.
Costs and returns Banke Siraha Tanahun All
(n = 38) (n = 2) (n = 94) (n = 134)
Area (ha) 0.18 0.11 0.26 0.23
Yield (t/ha) 1.83 4.34 2.51 2.35
Price (NRs/ha) 15 (0.20) 15 (0.20) 15 (0.20) 15 (0.20)
Gross returns (NRs 000/ha)
27.48 (371) 64.71 (874) 37.73 (510) 35.23 (476)
Total cash costs (NRs 000/ha)
2.79 (38) 2.19 (30) 4.88 (66) 4.42 (60)
Returns above cash costs (NRs 000/ha)
24.69 (334) 62.52 (845) 32.84 (444) 30.81 (416)
aExchange rate: US$1 = NRs 74 in 2008. The values in parentheses are in US$/ha. Net returns over total costs were not estimated due to a lack of information collection on noncash costs.
of the produce is sold in the local market. Farmers have a practice of keeping some part of the produce also for seeds and payment for various purposes such as for land rent, hired labor, and livestock feed, including some expenditure needs (other uses). The per capita availability of rough rice for consumption is estimated to be 135 kg (90 kg of milled rice) averaged over the three sites. This availability is higher than the national average availability of about 90 kg of rough rice for Nepal (FAOSTAT 2007).
Structure and sources of household incomeThe sample farmers are engaged in a multiple set of farm, off-farm, and nonfarm activities and they derive their household income from these activities. The total
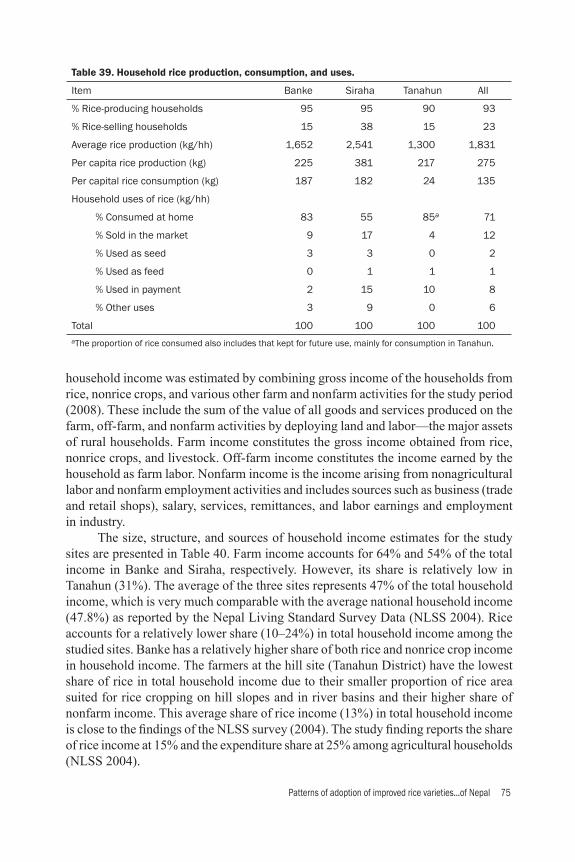
Patterns of adoption of improved rice varieties...of Nepal 75
household income was estimated by combining gross income of the households from rice, nonrice crops, and various other farm and nonfarm activities for the study period (2008). These include the sum of the value of all goods and services produced on the farm, off-farm, and nonfarm activities by deploying land and labor—the major assets of rural households. Farm income constitutes the gross income obtained from rice, nonrice crops, and livestock. Off-farm income constitutes the income earned by the household as farm labor. Nonfarm income is the income arising from nonagricultural labor and nonfarm employment activities and includes sources such as business (trade and retail shops), salary, services, remittances, and labor earnings and employment in industry. The size, structure, and sources of household income estimates for the study sites are presented in Table 40. Farm income accounts for 64% and 54% of the total income in Banke and Siraha, respectively. However, its share is relatively low in Tanahun (31%). The average of the three sites represents 47% of the total household income, which is very much comparable with the average national household income (47.8%) as reported by the Nepal Living Standard Survey Data (NLSS 2004). Rice accounts for a relatively lower share (10–24%) in total household income among the studied sites. Banke has a relatively higher share of both rice and nonrice crop income in household income. The farmers at the hill site (Tanahun District) have the lowest share of rice in total household income due to their smaller proportion of rice area suited for rice cropping on hill slopes and in river basins and their higher share of nonfarm income. This average share of rice income (13%) in total household income is close to the fi ndings of the NLSS survey (2004). The study fi nding reports the share of rice income at 15% and the expenditure share at 25% among agricultural households (NLSS 2004).
Table 39. Household rice production, consumption, and uses.
Item Banke Siraha Tanahun All
% Rice-producing households 95 95 90 93
% Rice-selling households 15 38 15 23
Average rice production (kg/hh) 1,652 2,541 1,300 1,831
Per capita rice production (kg) 225 381 217 275
Per capital rice consumption (kg) 187 182 24 135
Household uses of rice (kg/hh)
% Consumed at home 83 55 85a 71
% Sold in the market 9 17 4 12
% Used as seed 3 3 0 2
% Used as feed 0 1 1 1
% Used in payment 2 15 10 8
% Other uses 3 9 0 6
Total 100 100 100 100aThe proportion of rice consumed also includes that kept for future use, mainly for consumption in Tanahun.
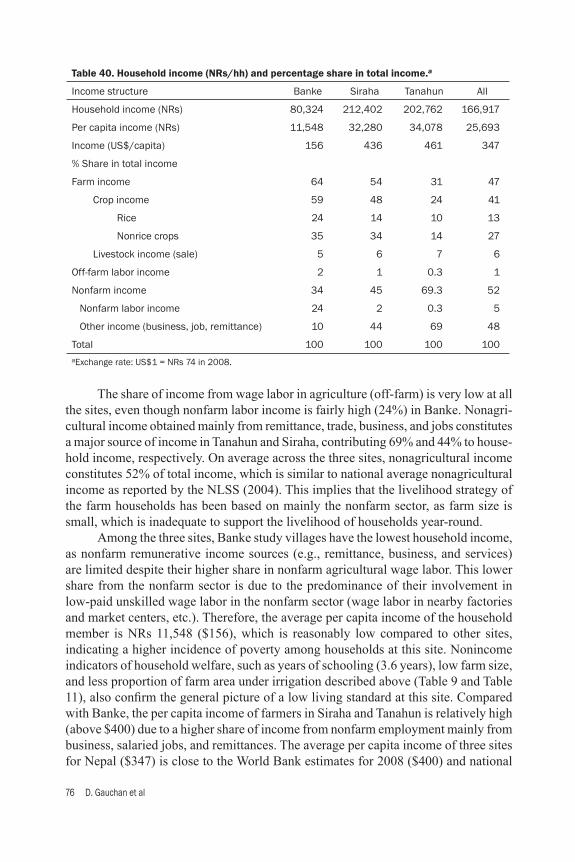
76 D. Gauchan et al
The share of income from wage labor in agriculture (off-farm) is very low at all the sites, even though nonfarm labor income is fairly high (24%) in Banke. Nonagri-cultural income obtained mainly from remittance, trade, business, and jobs constitutes a major source of income in Tanahun and Siraha, contributing 69% and 44% to house-hold income, respectively. On average across the three sites, nonagricultural income constitutes 52% of total income, which is similar to national average nonagricultural income as reported by the NLSS (2004). This implies that the livelihood strategy of the farm households has been based on mainly the nonfarm sector, as farm size is small, which is inadequate to support the livelihood of households year-round. Among the three sites, Banke study villages have the lowest household income, as nonfarm remunerative income sources (e.g., remittance, business, and services) are limited despite their higher share in nonfarm agricultural wage labor. This lower share from the nonfarm sector is due to the predominance of their involvement in low-paid unskilled wage labor in the nonfarm sector (wage labor in nearby factories and market centers, etc.). Therefore, the average per capita income of the household member is NRs 11,548 ($156), which is reasonably low compared to other sites, indicating a higher incidence of poverty among households at this site. Nonincome indicators of household welfare, such as years of schooling (3.6 years), low farm size, and less proportion of farm area under irrigation described above (Table 9 and Table 11), also confi rm the general picture of a low living standard at this site. Compared with Banke, the per capita income of farmers in Siraha and Tanahun is relatively high (above $400) due to a higher share of income from nonfarm employment mainly from business, salaried jobs, and remittances. The average per capita income of three sites for Nepal ($347) is close to the World Bank estimates for 2008 ($400) and national
Table 40. Household income (NRs/hh) and percentage share in total income.a
Income structure Banke Siraha Tanahun All
Household income (NRs) 80,324 212,402 202,762 166,917
Per capita income (NRs) 11,548 32,280 34,078 25,693
Income (US$/capita) 156 436 461 347
% Share in total income
Farm income 64 54 31 47
Crop income 59 48 24 41
Rice 24 14 10 13
Nonrice crops 35 34 14 27
Livestock income (sale) 5 6 7 6
Off-farm labor income 2 1 0.3 1
Nonfarm income 34 45 69.3 52
Nonfarm labor income 24 2 0.3 5
Other income (business, job, remittance) 10 44 69 48
Total 100 100 100 100aExchange rate: US$1 = NRs 74 in 2008.
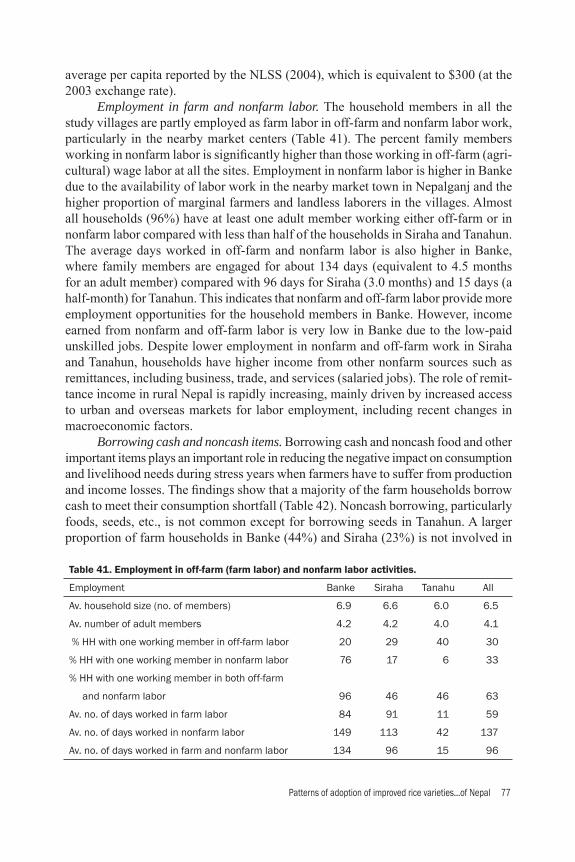
Patterns of adoption of improved rice varieties...of Nepal 77
average per capita reported by the NLSS (2004), which is equivalent to $300 (at the 2003 exchange rate). Employment in farm and nonfarm labor. The household members in all the study villages are partly employed as farm labor in off-farm and nonfarm labor work, particularly in the nearby market centers (Table 41). The percent family members working in nonfarm labor is signifi cantly higher than those working in off-farm (agri-cultural) wage labor at all the sites. Employment in nonfarm labor is higher in Banke due to the availability of labor work in the nearby market town in Nepalganj and the higher proportion of marginal farmers and landless laborers in the villages. Almost all households (96%) have at least one adult member working either off-farm or in nonfarm labor compared with less than half of the households in Siraha and Tanahun. The average days worked in off-farm and nonfarm labor is also higher in Banke, where family members are engaged for about 134 days (equivalent to 4.5 months for an adult member) compared with 96 days for Siraha (3.0 months) and 15 days (a half-month) for Tanahun. This indicates that nonfarm and off-farm labor provide more employment opportunities for the household members in Banke. However, income earned from nonfarm and off-farm labor is very low in Banke due to the low-paid unskilled jobs. Despite lower employment in nonfarm and off-farm work in Siraha and Tanahun, households have higher income from other nonfarm sources such as remittances, including business, trade, and services (salaried jobs). The role of remit-tance income in rural Nepal is rapidly increasing, mainly driven by increased access to urban and overseas markets for labor employment, including recent changes in macroeconomic factors. Borrowing cash and noncash items. Borrowing cash and noncash food and other important items plays an important role in reducing the negative impact on consumption and livelihood needs during stress years when farmers have to suffer from production and income losses. The fi ndings show that a majority of the farm households borrow cash to meet their consumption shortfall (Table 42). Noncash borrowing, particularly foods, seeds, etc., is not common except for borrowing seeds in Tanahun. A larger proportion of farm households in Banke (44%) and Siraha (23%) is not involved in
Table 41. Employment in off-farm (farm labor) and nonfarm labor activities.
Employment Banke Siraha Tanahu All
Av. household size (no. of members) 6.9 6.6 6.0 6.5
Av. number of adult members 4.2 4.2 4.0 4.1
% HH with one working member in off-farm labor 20 29 40 30
% HH with one working member in nonfarm labor 76 17 6 33
% HH with one working member in both off-farm
and nonfarm labor 96 46 46 63
Av. no. of days worked in farm labor 84 91 11 59
Av. no. of days worked in nonfarm labor 149 113 42 137
Av. no. of days worked in farm and nonfarm labor 134 96 15 96

78 D. Gauchan et al
any sort of cash or noncash borrowing. Since access to farm and nonfarm wage labor is more easily available at the Terai sites, small farmers are less involved in borrow-ing from informal sources (e.g., money lenders), who tend to charge a higher interest rate on the borrowed amount. However, poor farmers in Tanahun tend to borrow from informal sources at a high interest rate (36% per annum) to meet their consumption needs. Furthermore, unlike other rural areas of Nepal, the survey data and fi eld obser-vations also indicated that the current survey sites have limited involvement of NGOs and other institutions in providing micro-credit to the rural poor.
Household coping strategiesHouseholds at the study sites adopt different strategies (both short and long term) to reduce, mitigate, and cope with risks and shocks that affect them through drought stress in rice production. The range of strategies available to households depends on their asset portfolio, options available within and outside the communities, and availability of external assistance during the most vulnerable period of the year. Many households in the vulnerable groups alter their rice production, consumption, and expenditure patterns as a short-term strategy to cope with food-defi cit periods and times of hardship. When the drought stress is severe, they are forced to sell their productive and durable assets, change their livelihood strategies, and seek employment in other sectors to cope with the negative effect of the stress. Some of the important production, consumption, and household expenditure strategies to reduce and cope with stress effects are presented below. Rice food-suffi ciency status and food consumption adjustment. Rice is an im-portant component of household income and food intake in the surveyed households. A very high proportion of households use it for their own consumption. In a normal year, half of the sample households across the sites reported being self-suffi cient in rice for a year for their own consumption needs (Table 43). However, during a stress year (drought), 17% can meet their household food requirement only from rice. When rice production fails due to drought and other stresses, farmers become most food insecure and vulnerable. Among the sites in the three districts, farmers in Banke are more food insecure and vulnerable than the farmers in Tanahun (better off). During stress years, only 4% of the households are food secure in Banke, indicating a higher incidence of food insecurity and vulnerability during drought stress. This is because
Table 42. Percentage of households borrowing cash and noncash items, 2008.
% Households borrowing Banke Siraha Tanahun All
Cash borrowers 54 75 73 67
Noncash borrowers of food 1 – 6 3
Noncash borrowers of seed 1 2 20 5
Other noncash borrowers 0 0 0 0
Not involved 44 23 0 25
Total 100 100 100 100

Patterns of adoption of improved rice varieties...of Nepal 79
larger proportions of farmers in Banke (mainly Partbatipur Village) are marginal farmers and sharecroppers who have not only small-size rainfed landholdings but also have to share half of their produce with the landlord as their part of land rent. In addition, they have limited alternative nonfarm occupations and other sources of income (e.g., remittances) compared with the hill site in Tanahun, where farmers are less food insecure despite their small size of landholdings. The number of meals eaten per day is also an indicator of food suffi ciency and consumption status. Generally, lunch, dinner, and snacks/breakfast are the three meals eaten daily for meeting health conditions in rural Nepal. During a normal year, almost all households (98%) eat three meals a day in Tanahun, whereas only 60% of the households eat three meals a day in Banke. Farmers in Siraha are in an intermediate situation, where 86% eat three meals a day during a normal year. During a stress year, Tanahun farmers are better off, with 86% of them eating three meals compared with only 22% in Banke. Households reduce their food intake signifi cantly in terms of both quantity and frequency during stress years. A signifi cant proportion of households, particularly in Banke, consume inferior food that is generally not eaten during normal years. These inferior food items include coarse grains (maize, millet, sorghum, yams, etc.). Adjustment in the type of food intake. Farmers reduce their consumption of rice, pulses, vegetables, and milk during stress years (Table 44) although these are consid-ered standard food items in the Nepalese diet. Wheat is also considered a preferred food item in a major part of the far-western and mid-western region in Nepal. When farmers suffer from production and income loss, they generally switch to socially in-ferior food staples such as maize, millet, and other minor cereals (barley, buckwheat, etc.). Consumption of vegetables also decreases as these are also expensive commodi-ties if not produced on farmers’ own homesteads. The most signifi cant reduction is observed in the consumption of milk as milk is considered an expensive food item for the poor. The use of meat and fi sh is not common in the daily diet of poor farmers in rural Nepal.
Table 43. Decline in rice food suffi ciency and food consumption in stress years.
Household rice food suffi ciency Banke Siraha Tanahun All
% Self-suffi cient for 12 months
Normal year 45 58 72 58
Stress year 4 14 32 17
% HH consuming 3 meals/day
Normal year 60 86 98 81
Stress year 22 66 84 59
% HH eating less food during stress years
35 11 14 20
% HH eating food items not eaten in normal years
67 28 12 36

80 D. Gauchan et al
Households’ other adjustments for food security and production needsSmall and marginal farmers during drought years adopt a range of strategies to se-cure immediate household food needs as well as seed needs for the subsequent crop production cycle. Some of these include distress sale of immediately harvested crops and resorting to increasing food, seed, and cash borrowing from neighbors or relatives (Table 45). Analysis indicated that a small proportion of households opt only for selling more harvested crop (distress sale). The main reason for this is that many of them fear a scarcity of food needs during a later period. However, they opt for other strategies to minimize risk such as increasing their food and cash borrowing from neighbors and relatives in the local community. About one-third of the households, particularly in Banke (38%), increase their food borrowing during stress years, even though this was not a prominent strategy at other sites such as Siraha (16%) and Tanahun (25%). Some 50–70% of the surveyed households also increase their borrowing of cash dur-ing stress years, which was more prominent in Siraha. Similarly, an average of one-fi fth of the households (with a range of 15–33%) are also engaged in borrowing seeds during stress years, which is required for the next cropping cycle. This happens mainly in Banke (33%) because many poor farm households consume reserve seeds during stress years due to immediate household food needs.
Broader household livelihood adjustment strategiesPoor farm households use several strategies to cope with immediate consumption and livelihood needs during drought stress. These include resorting to alternative income sources, deferring loan payments, using household savings, selling/mortgaging pro-ductive and durable household assets, and having children drop out of school (Table 46). The fi ndings show that about 43% of the households resort to alternative income sources to meet their consumption and other immediate livelihood needs. More than one-third of the households also tend to defer their loan payments during a stress year, which was more prominent in Siraha (58%). A large number of households
Table 44. Household adjustment in consumption of food items in a stress year.a
Daily consumption Banke Siraha Tanahun All
NY SY NY SY NY SY NY SY
% HH consuming rice 97 81 100 88 99 99 99 89
% HH consuming wheat 64 60 71 66 0 0 45 40
% HH consuming maize 14 21 0 2 0 3 5 9
% HH consuming minor cereals+ 0 0 2 1 12 0 5 0
% HH consuming pulses 53 41 59 40 71 64 61 48
% HH consuming vegetables 97 77 98 85 94 98 96 87
% HH consuming milk 61 14 54 14 51 2 55 3
% HH consuming meat 2 3 2 0 0 0 1 1aNY = normal year; SY = stress year. +Minor cereals include fi nger millet, barley, buckwheat, oat, etc.
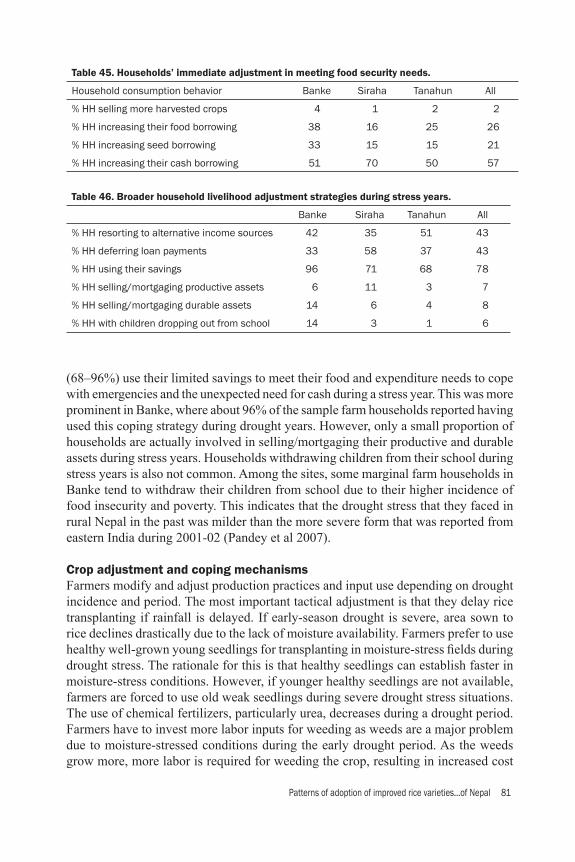
Patterns of adoption of improved rice varieties...of Nepal 81
(68–96%) use their limited savings to meet their food and expenditure needs to cope with emergencies and the unexpected need for cash during a stress year. This was more prominent in Banke, where about 96% of the sample farm households reported having used this coping strategy during drought years. However, only a small proportion of households are actually involved in selling/mortgaging their productive and durable assets during stress years. Households withdrawing children from their school during stress years is also not common. Among the sites, some marginal farm households in Banke tend to withdraw their children from school due to their higher incidence of food insecurity and poverty. This indicates that the drought stress that they faced in rural Nepal in the past was milder than the more severe form that was reported from eastern India during 2001-02 (Pandey et al 2007).
Crop adjustment and coping mechanismsFarmers modify and adjust production practices and input use depending on drought incidence and period. The most important tactical adjustment is that they delay rice transplanting if rainfall is delayed. If early-season drought is severe, area sown to rice declines drastically due to the lack of moisture availability. Farmers prefer to use healthy well-grown young seedlings for transplanting in moisture-stress fi elds during drought stress. The rationale for this is that healthy seedlings can establish faster in moisture-stress conditions. However, if younger healthy seedlings are not available, farmers are forced to use old weak seedlings during severe drought stress situations. The use of chemical fertilizers, particularly urea, decreases during a drought period. Farmers have to invest more labor inputs for weeding as weeds are a major problem due to moisture-stressed conditions during the early drought period. As the weeds grow more, more labor is required for weeding the crop, resulting in increased cost
Table 45. Households’ immediate adjustment in meeting food security needs.
Household consumption behavior Banke Siraha Tanahun All
% HH selling more harvested crops 4 1 2 2
% HH increasing their food borrowing 38 16 25 26
% HH increasing seed borrowing 33 15 15 21
% HH increasing their cash borrowing 51 70 50 57
Table 46. Broader household livelihood adjustment strategies during stress years.
Banke Siraha Tanahun All
% HH resorting to alternative income sources 42 35 51 43
% HH deferring loan payments 33 58 37 43
% HH using their savings 96 71 68 78
% HH selling/mortgaging productive assets 6 11 3 7
% HH selling/mortgaging durable assets 14 6 4 8
% HH with children dropping out from school 14 3 1 6
82 D. Gauchan et al
of production compared with a normal year. In severe cases, farmers have to forego crop yield and they face increased costs of production incurred on the crop. During a severe drought period, when the crop fails, farmers, particularly the small and marginal ones, switch to nonfarm employment in the nearby market area and meet their livelihood needs through rickshaw pulling and wage labor in factories since growing a second crop is limited due to a lack of irrigation facilities. The most recent drought that farmers faced at all the sites occurred in 2006. However, farmers in Tanahun faced a drought situation also in 2007. Early-season and mid-season droughts were more frequent at all the study sites in Nepal. Termi-nal drought was not observed in the severe form. The rice production calendar is extended when early-season drought is severe as farmers have to wait for rainy days to re-transplant the crop. During the drought period, in addition to an area reduction, rice yield also declines signifi cantly, at least 1 t/ha (30% of the normal season). In a severe drought season, however, yield reduction is very high due to partial or complete failure of the crop. During early-season drought, transplanting of paddy becomes late and only part of the cultivable land is planted. The prolonged period of drought in 2006 delayed plant-ing even further, resulting in overmature paddy seedlings, which when transplanted remained more vulnerable to diseases and reduced production (about 20–30% less). Delayed planting and late harvesting also affected the planting of dry-season crops such as wheat, lentils, and mustard. In addition, late transplanting required denser planting of seedlings, which ultimately resulted in higher seedling and labor costs. Some farmers also reported that they grow traditional varieties, particularly at the hill site in Tanahun as they are more adapted to moisture-stressed situations so that they can harvest at least some crops. Farmers modify and adjust production practices and input use depending on drought incidence and period. The most important tactical adjustment is that they delay rice transplanting if rainfall is delayed. Some adjustment in seedling/seed rates (higher amount) and limited use of fertilizer application (e.g., urea) and postponing of weeding are also common. When crops completely fail, the small and marginal farmers switch to nonfarm employment in the nearby market area to cope with the negative impact of drought on livelihood.
Relief and mitigation programsCurrently, no government-sponsored or NGO-initiated relief programs are reported at many of the study sites during drought years. However, some farmers in Siraha reported having received a limited amount of wheat seeds during postmonsoon planting as a relief package during the 2006 drought year after the failure of the rice crop in the monsoon season. The government of Nepal recently formulated and approved the National Strategy for Disaster Risk Management (2009) to manage various disasters, including drought in the country (MOHA 2009). However, the government has yet to formulate specifi c rules, regulations, and procedures and to develop relevant insti-tutional mechanisms to implement the strategies. Currently, the country lacks plans,

Patterns of adoption of improved rice varieties...of Nepal 83
policies, and programs for long-term drought mitigation and adaptation mechanisms, including specifi cally designed relief programs. India has already developed an elabo-rate institutional setup for drought relief, which mainly takes the form of employment generation through public works. Some inputs and credits are provided as well (Pandey et al 2007). However, such a mechanism currently doesn’t exist in Nepal. There is a need for broader policies for water resource development, weather forecasting and preparedness, income diversifi cation, and crop insurance, including research poli-cies for suitable technology design and targeting to mitigate and reduce the impact of drought stress on poor farmers in rainfed and risk-prone environments in Nepal.
Vulnerability to stressMarginal farm households, sharecroppers (mostly landless farm households), and wage earners are most vulnerable as they are the most food insecure and have extremely limited options to cope with drought stress. Small and marginal farmers who have more land area located in the upper toposequence of fi elds (e.g., uplands) are more vulnerable as upland fi elds are the most drought-prone. Similarly, households that have limited nonfarm opportunities and less social connection with the outside world are also more vulnerable. Women and children are the most vulnerable among the household members, as women are the last to eat after meals are left and they rarely go out of the village for securing alternative income and employment. Children also suffer more from less food and malnutrition, including a lack of educational oppor-tunities during severe drought-stress situations. Currently, there are no formal public-sponsored relief programs for mitigating the negative effects of production and welfare loss on the poor and vulnerable people. In addition, local community initiatives and efforts for mitigating the negative effects of drought are not observed at the study sites. As a result, the poorest households from disadvantaged social groups (lower castes, women, children, etc.) and those of marginal farmers who have rice fi elds in the upper drought-prone toposequence tend to be more vulnerable during drought periods.
Awareness and sources of stress-tolerant varietiesThe study tried to capture the level of awareness of farmers of stress-tolerant modern varieties. The reference for stress-tolerant varieties includes new IRRI stress-tolerant varieties being tested in the country, including existing MVs that are being recom-mended that are slightly drought tolerant (e.g., Radha-4, Radha-32, etc.). The fi ndings revealed a wide variation in the amount of awareness of stress-tolerant rice varieties among the farmers at the study sites (Table 47). Farmers in Siraha and Banke have very limited awareness of stress-tolerant rice varieties. However, a fairly high proportion of farmers (81%) in Tanahun reported having some awareness and a good propor-tion of them have already planted varieties that have some drought tolerance such as Radha-4, Radha-32, IR51672, etc. But, very few farmers in Banke and Siraha planted slightly stress-tolerant varieties such as Radha-4 and Radha-11. A relatively higher

84 D. Gauchan et al
farmers’ awareness of stress-tolerant rice varieties in Tanahun was due to farmers’ earlier exposure to some new rice varieties such as IR51672, Radha-4, Radha-32, and Hardinath-1 through the IFAD upland rice project (2005-08), since this site was a part of the up-scaling of the project for the IAAS-Lamjung campus. Since farmers currently have no reliable access to stress-tolerant varieties in Banke and Siraha, a very large proportion of them are willing to plant new promis-ing stress-tolerant varieties. Since their current dominant modern varieties are old, low-yielding, and not tolerant of various stresses, this will provide them with good options for enhancing their rice productivity. However, in Tanahun, only one-third of the surveyed households are willing to plant new ones, as two-thirds have already planted some types of newer modern varieties slightly tolerant of some stresses (e.g., Radha-4, Radha-32, etc.). One-third of the farmers who were aware of stress-tolerant rice varieties have not been growing such varieties for various reasons. First, farmers do not know with certainty the future occurrence of drought in advance during seedling-raising time. So, they do not plan for the production of such varieties. Second, most of the drought-tolerant varieties available in the study are of poor eating quality. Third, some landowners urge tenant-cultivators to grow those varieties, which are good in taste irrespective of their drought-tolerance capacity and yield potential. Reliable sources of agricultural information are critical to enhancing agricultural productivity. The analysis shows that currently a large number of farmers, particularly in Banke (93%) and Siraha (87%), have had no sources of information for stress-tolerant varieties. Local extension and research farms were the major sources of in-formation for 4–20% of the farmers. For those farmers, particularly in Tanahun, who have already planted stress-tolerant varieties, the main sources of the stress-tolerant varieties for them were their own informal sources (58%) such as neighbors, rela-tives, and friends, followed by formal sources (20%), mainly extension workers and researchers. The formal sources of information were extension agencies such as the District Agriculture Development Offi ce (DADO) and its local Agricultural Service Centers, a research institute such as NARC, and its regional research stations and teaching institutes such as the Institute of Agriculture and Animal Sciences (IAAS).
Table 47. Awareness and sources for stress-tolerant varieties (STVs).
Banke Siraha Tanahun All
% Households heard of STVs 17 13 81 37
% Households planted STVs 7 10 65 27
% Households willing to plant STVs 98 95 30 74
Source (%) of information on STVs
Extension workers and researchers 4 10 20 11
Neighbors, relatives, and friends 3 3 58 22
Others (radio, TV, and newspapers) 0 0 2 0
No sources of information 93 87 20 67
Total 100 100 100 100

Patterns of adoption of improved rice varieties...of Nepal 85
Dependency on mass media such as radio and television as a source of information was found much less. These are the sources basically for the acquisition of informa-tion on weather forecasts.
Gender division of responsibility and decision makingGender roles and decision making have an important infl uence on rice farming and the sustenance of farmers’ livelihood in stress-prone rainfed areas. This section outlines gender analyses in relation to division of the labor force and women’s participation in rice production, including decisions on household livelihood and Women’s Em-powerment Index. Gender division of labor force and women’s participation in rice production. Men and women farmers provide a differential share of labor contribution in differ-ent rice production activities. The proportion of total male and female labor force participation in rice production activities is presented in Table 48 and details by sites in Appendix 4. Crop establishment (mainly transplanting), harvesting, and weeding are the major domains of women’s labor at all the sites. Women are more involved in the application of organic fertilizers in fi elds before land preparation. At the hill site in Tanahun, this is a sole activity of the women members. Land preparation is mainly a men’s activity at all the sites as it requires more heavy work such as plowing and leveling fi elds. The application of agro-chemicals is the sole activity of male members. Men are also more involved in threshing of rice (separating grains out of the straw) using both manual beating and animal traction. However, both men and women are involved in a differential proportion in many activities such as harvesting, thresh-ing, postharvest (drying, cleaning grains, transporting, and marketing), weeding, and irrigation, including crop establishment. When labor force participation is segregated by family and hired labor, the pro-portion of women’s and men’s contribution varied by sites (Table 49). The contribution
Table 48. Proportion of male and female labor participation in rice farming.
Rice production activities Males (%) Females (%) All (%)
Land preparation 12 3 15
Crop establishment methods 5 14 19
Application of organic fertilizer 2 3 5
Application of chemical fertilizer 2 0 2
Application of pesticides 1 0 1
Weeding 6 13 19
Irrigation 2 1 3
Harvesting 6 10 16
Threshing 8 5 13
Postharvest activities 4 3 7
Total 48 52 100
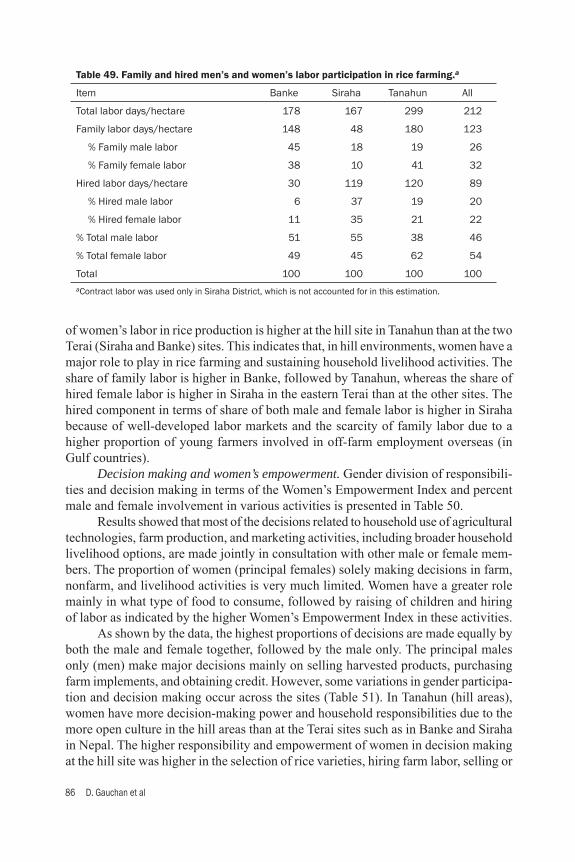
86 D. Gauchan et al
of women’s labor in rice production is higher at the hill site in Tanahun than at the two Terai (Siraha and Banke) sites. This indicates that, in hill environments, women have a major role to play in rice farming and sustaining household livelihood activities. The share of family labor is higher in Banke, followed by Tanahun, whereas the share of hired female labor is higher in Siraha in the eastern Terai than at the other sites. The hired component in terms of share of both male and female labor is higher in Siraha because of well-developed labor markets and the scarcity of family labor due to a higher proportion of young farmers involved in off-farm employment overseas (in Gulf countries). Decision making and women’s empowerment. Gender division of responsibili-ties and decision making in terms of the Women’s Empowerment Index and percent male and female involvement in various activities is presented in Table 50. Results showed that most of the decisions related to household use of agricultural technologies, farm production, and marketing activities, including broader household livelihood options, are made jointly in consultation with other male or female mem-bers. The proportion of women (principal females) solely making decisions in farm, nonfarm, and livelihood activities is very much limited. Women have a greater role mainly in what type of food to consume, followed by raising of children and hiring of labor as indicated by the higher Women’s Empowerment Index in these activities. As shown by the data, the highest proportions of decisions are made equally by both the male and female together, followed by the male only. The principal males only (men) make major decisions mainly on selling harvested products, purchasing farm implements, and obtaining credit. However, some variations in gender participa-tion and decision making occur across the sites (Table 51). In Tanahun (hill areas), women have more decision-making power and household responsibilities due to the more open culture in the hill areas than at the Terai sites such as in Banke and Siraha in Nepal. The higher responsibility and empowerment of women in decision making at the hill site was higher in the selection of rice varieties, hiring farm labor, selling or
Table 49. Family and hired men’s and women’s labor participation in rice farming.a
Item Banke Siraha Tanahun All
Total labor days/hectare 178 167 299 212
Family labor days/hectare 148 48 180 123
% Family male labor 45 18 19 26
% Family female labor 38 10 41 32
Hired labor days/hectare 30 119 120 89
% Hired male labor 6 37 19 20
% Hired female labor 11 35 21 22
% Total male labor 51 55 38 46
% Total female labor 49 45 62 54
Total 100 100 100 100aContract labor was used only in Siraha District, which is not accounted for in this estimation.
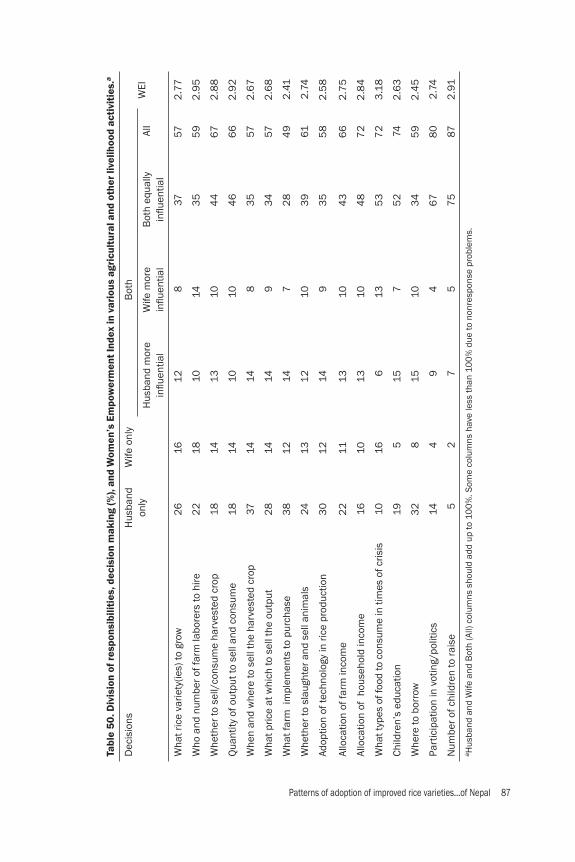
Patterns of adoption of improved rice varieties...of Nepal 87
Tabl
e 50
. Div
isio
n of
resp
onsi
bilit
ies,
dec
isio
n m
akin
g (%
), an
d W
omen
’s E
mpo
wer
men
t Ind
ex in
var
ious
agr
icul
tura
l and
oth
er li
velih
ood
acti
viti
es.a
Dec
isio
nsH
usba
nd
only
Wife
onl
yB
oth
WEI
Hus
band
mor
e infl u
entia
lW
ife m
ore
infl u
entia
lB
oth
equa
lly
infl u
entia
lAl
l
Wha
t ric
e va
riety
(ies)
to g
row
26
161
28
3757
2.7
7
Who
and
num
ber o
f far
m la
bore
rs to
hire
22
1810
143
55
92
.95
Whe
ther
to s
ell/
cons
ume
harv
este
d cr
op18
1413
104
46
72
.88
Qua
ntity
of o
utpu
t to
sell
and
cons
ume
1814
1010
46
66
2.9
2
Whe
n an
d w
here
to s
ell t
he h
arve
sted
cro
p37
1414
83
557
2.6
7
Wha
t pric
e at
whi
ch to
sel
l the
out
put
28
1414
93
457
2.6
8
Wha
t far
m i
mpl
emen
ts to
pur
chas
e3
81
214
72
84
92
.41
Whe
ther
to s
laug
hter
and
sel
l ani
mal
s24
131
210
39
612
.74
Adop
tion
of te
chno
logy
in ri
ce p
rodu
ctio
n3
01
214
93
55
82
.58
Allo
catio
n of
farm
inco
me
22
1113
104
36
62
.75
Allo
catio
n of
hou
seho
ld in
com
e 16
1013
104
87
22
.84
Wha
t typ
es o
f foo
d to
con
sum
e in
tim
es o
f cris
is10
166
135
37
23
.18
Child
ren’
s ed
ucat
ion
195
157
52
742
.63
Whe
re to
bor
row
32
815
103
45
92
.45
Part
icip
atio
n in
vot
ing/
polit
ics
144
94
67
80
2.7
4
Num
ber o
f chi
ldre
n to
rais
e5
27
57
587
2.9
1a H
usba
nd a
nd W
ife a
nd B
oth
(All)
col
umns
sho
uld
add
up to
10
0%
. Som
e co
lum
ns h
ave
less
than
10
0%
due
to n
onre
spon
se p
robl
ems.

88 D. Gauchan et al
consuming harvested crops, and quantity of output to sell as many men are involved in various nonfarm activities and are out of the village for nonfarm employment. Earlier studies related to gender in farming and decision making also indicate that women in the Hills in Nepal have greater decision-making power than the farmers in the Terai, where strict Hindu and Muslim culture provides some restrictions on the involvement of women from higher social status in farming and other livelihood activities (Pradhan 1984, Bajracharya 1994, Subedi et al 2000).
Training and participation in organizationsHouseholds with both male and female members participate in various agricultural and rural skill-oriented training and community-based organizational activities. The training here refers to short-term skill and exposer-oriented training programs on differ-ent aspects of agricultural and rural development activities. Most of them are on crop production, livestock raising, fruit farming, kitchen gardening, and microcredit. Some of the other aspects of skill-oriented and income-generating training include plumbing, driving, tailoring, auto mechanic, weaving, and handicrafts, etc. The organizational activities cover farmers’ (both men and women) membership and participation in vari-ous formal and informal organizations/social institutions that include cooperatives, farmers’ and women’s groups, community water and forest users’ groups, microcredit institutions, local youth clubs, and religious groups, etc. The proportion of farmers participating in training and organizational activities is presented in Table 52. A higher
Table 51. Women’s Empowerment Index in various livelihood activities.
Decision on Banke Siraha Tanahun All
1. What rice variety(ies) to grow 2.54 2.32 3.45 2.77
2. Who and number of farm laborers to hire 2.66 2.71 3.50 2.95
3. Whether to sell/consume harvested crop 2.66 2.61 3.37 2.88
4. Quantity of output to sell and consume 2.68 2.71 3.36 2.92
5. When and where to sell the harvested crop 2.52 2.21 3.28 2.67
6. What price at which to sell the output 2.45 2.23 3.34 2.68
7. What farm implements to purchase 2.38 2.13 2.72 2.41
8. Whether to slaughter and sell animals 2.62 2.25 3.25 2.74
9. Adoption of technology in rice production 2.47 2.15 3.13 2.58
10. Allocation of farm income 2.66 2.53 3.07 2.75
11. Allocation of household income 2.78 2.82 2.90 2.84
12. What types of food to consume in crisis time 2.82 3.21 3.51 3.18
13. Children’s education 2.65 2.56 2.68 2.63
14. Where to borrow 2.58 2.10 2.69 2.45
15. Participation in voting/politics 2.60 2.59 3.05 2.74
16. Number of children to raise 2.77 3.00 3.96 2.91
Overall WEI 2.76

Patterns of adoption of improved rice varieties...of Nepal 89
proportion of farmers’ (principal males and females) members in Tanahun participate in training and organizational activities than the farmers in Siraha and Banke. Nearly half of the household principal male and female members from these Terai sites do not participate in training and organizational activities. When data were analyzed by gender disaggregation, female participation in training was more than male participation in Tanahun. However, in Banke and Sir-aha, male participation was higher than female participation for the same. Women’s participation in local farmers’ organizations was also more in Tanahun at the hill site than at the Terai sites in Banke and Siraha. Higher women’s participation in training and organizational activities is mainly due to local group formation for credit and saving activities among women farmers by the earlier IRRI-IFAD project. In addition, in recent years, there is increased focus of both government and nongovernment orga-nizations on women’s participation and empowerment at the site. Another important reason behind it was women’s staying at home in the village and men’s migration to other places for nonfarm employment (Panta 2010). The fi ndings also showed that males have membership and participation in diversifi ed local community-based or-ganizations, while females were confi ned mainly to credit and savings and vegetable farmers’ groups.
Summary of the fi ndings
• Farm households at the study sites have similar demographic features, pri-mary occupation, and production environment. Access to irrigation, cropping intensity, and production differences is not evident among the sites. However, farm size at the Siraha site (1.3 ha) is relatively bigger than at the Banke and Tanahun sites and also that of national average farm size (0.80 ha) of Nepal.
• Rice is grown only in the wet season at two of the Terai sites while at the hill site (Tanahun) it is also grown in the spring (dry) season as an irrigated crop in a very tiny portion of the area (0.9 ha). This hill site also has upland rice (direct-seeded) cultivated on unbunded terraces during the early season (March-August).
• Early-season drought is a most common feature in Nepal. Currently, farm-ers have limited technological options and fl exibility to cope with drought stress. Uncertainty of monsoon rains and low irrigation potential are the key constraints to improving rice and overall agricultural productivity of the area.
Table 52. Participation (male + female) in training programs and local organizations.
Response Banke Siraha Tanahun All
Participation in organizations Yes 43 52 82 59
No 57 48 18 41
Participation in agricultural and other training Yes 33 20 100 51
No 67 80 0 49
90 D. Gauchan et al
• Farmers have adopted modern varieties on a major part of their rice farm, covering about 71% in Tanahun, 84% in Siraha, and 98% in Banke. However, most of the MVs adopted by the farmers are very old and were released before the 1980s.
• The average area-weighted age of rice varieties obtained from the survey is above 20 years. Both Banke (western Terai) and Tanahun (hills) sites had an average area-weighted age of 21 years for rice varieties, while it was 26 years for Siraha. This implies that, currently, the replacement rate of rice varieties in farmers’ fi elds is very low.
• Yields of MVs are signifi cantly superior to the yields of TVs at all the sites. Yield effects, however, vary by site. The yield effects of MVs are stronger at Tanahun and Banke sites than in Siraha.
• Newer generation MVs account for about 40% of the total MV area at the study sites. The dominant newer generation MVs are Radha-4 in Banke and Tanahun and Radha-11 (Meghdoot) in Siraha.
• Despite the lower extent of adoption of MVs in Tanahun, farmers at this site have adopted more new-generation MVs (e.g., Radha-4, Radha-32, Judi-572, OR-367, etc.) due to their better access to newer materials from the previous IRRI-IFAD project.
• The yield of newer generation rice varieties is not superior to that of old-generation MVs despite their better adaptability to rainfed conditions (e.g., Radha-4 and Radha-11). However, new MVs are relatively better performing in lowland fi elds in moisture-stressed rainfed conditions.
• Econometric analysis revealed that endowment of favorable land type (e.g., lowlands), adult household size, age of farmers, and awareness of new rice varieties and participation in training and local farmers’ organizations are key factors infl uencing the probability and intensity of the adoption of new-generation MVs.
• The profi tability of the rice crop varies across sites, with higher net returns in Tanahun as farmers obtain higher average yields of 5.0 t/ha from their current rice varieties.
• MVs are more profi table (both net returns and higher returns above cash costs) than TVs due to their higher yields. On average, MV cultivation provides 13% higher incremental returns above cash costs at the study sites.
• Labor is the major component of production costs, accounting for more than half of the total costs. Chemical fertilizer accounts for 8–10% of the costs in rice production.
• Compared with MVs, TVs have a relatively higher share of straw value in total returns (15–22%) due to their higher straw yields as a result of their taller plant height.
• New MVs are relatively more profi table than old MVs when data are pooled across the sites. But, profi tability (returns above cash costs) varies by sites, with new MVs marginally superior to old MVs in Tanahun but not in Banke and Siraha.
Patterns of adoption of improved rice varieties...of Nepal 91
• Farm households reduce their food intake in terms of frequency, quantity, and quality during stress years as a result of reduced production and income shortfall. Farmers’ coping strategies include resorting to alternative income sources, off-farm employment, deferring loan payments, using household savings, and selling/mortgaging productive assets.
• Most of the current decisions on choice of technologies, production, market-ing, and livelihood are mainly made by men (principal males) in consultation with female members. Decision-making roles of women regarding farm management are limited.
• Diversifi cation of income and employment sources is one of the prevalent household strategies for coping with drought risk and vulnerability in rural Nepal, where economic and agro-climatic conditions are less favorable for rice production in rainfed environments. Farmers were found to use this strategy where such opportunities exist.
Implications of the fi ndings
• The design of new technologies should consider the development of new rice varieties and management technologies that allow greater fl exibility in plant-ing and timing of input use from drought stress to minimize yield reduction and income losses.
• The low adoption of new MVs in upper fi elds (uplands) implies that efforts are needed to develop new varieties suitable to marginal moisture-stress fi eld conditions and to make them available to farmers. It also implies that land-type differences across locations and households should be considered in defi ning the target domains for technology development and targeting.
• Newer generation MVs with tolerance of drought need to also have better grain quality as returns from improved grain quality (premium market price) are high.
• Econometric results imply that farm and farmer-specifi c variables are critical for explaining adoption behavior, implying that it is important to take farmers’ endowment of land-type conditions and farmers’ socioeconomic circumstances into consideration in the design of an R&D program.
• Increasing farmers’ awareness and training programs on new stress-tolerant rice varieties are more likely to have a greater impact on increasing the adoption rate in Nepal. This requires increased emphasis on information dissemination, extension demonstration, and farmers’ participatory research and training programs to popularize new rice varieties and enhance their adoption rate.
• Land type is a critical factor that needs to be considered for targeting new rice varieties in rainfed environments. Similarly, planners and decision makers need to consider farmers’ availability of an adult family labor force and age of the farmers to enhance and promote the adoption of a newer generation of rice varieties.
• Rice research should focus not only on enhancing yield but also on increas-

92 D. Gauchan et al
ing the income of farmers by developing technologies that increase profi t and reduce the unit cost of production. This requires the development of varieties and crop management technology that facilitates crop diversifi cation and reduces the use of more purchased inputs.
• The high share of labor costs in total costs and high share of nonfarm income in total household income imply that researchers and policymakers should take into account the effect of new technology on labor productivity in addition to crop yield. The adoption of technologies that require more labor may be constrained by the high opportunity costs of labor.
• An important pathway for reducing poverty in the study area is to focus on technological innovations that increase rice productivity in ways that release household labor and land resources for income-generating activities while enabling households to more easily fulfi ll their subsistence demand for rice.
• Future studies need to account for the likely effect of farmers’ perceptions of attributes of the new rice varieties in the adoption models and institutional con-straints to seed access and variety replacement by the more recent generation. A study on institutional bottlenecks and variety replacement may provide more insights and information on the adoption constraints to newer rice varieties.
References
Adesina AA, Zinnah MM. 1993. Technology characteristics, farmers’ perceptions and adoption decisions: a Tobit model application in Sierra Leone. Agric. Econ. 9:297-311.
Adesina A, Seidi S. 1995. Farmers’ perceptions and adoption of new agricultural technology: analysis of modern Mangrove rice varieties in Guinea-Bissau. Quart. J. Int. Agric. 34:358-385.
Bajracharya B. 1994. Gender issues in Nepalese agriculture: a review. Research report no. 25; Winrock International, Kathmandu, Nepal.
Bellon M, Taylor JE. 1993. “Folk” soil taxonomy and the partial adoption of new seed varieties. Econ. Dev. Cultural Change 41:763-786.
CBS (Central Bureau of Statistics). 2001. Sample census in agriculture. National Planning Commission, Kathmandu, Nepal.
Doss CR. 2006. Analyzing technology adoption using micro-studies: limitations, challenges, and opportunities for improvement. Agric. Econ. 34:207-219.
FAO/WFP. 2007. Food security assessment program for Nepal. Special Report. July 2007. Rome (Italy): UN Food and Agriculture Organization and World Food Programme.
FAOSTAT. 2007. FAOSTAT on-line database on different commodities. FAO. http://faostat.fao.org/site/339/default.aspx.
Feder G, Just RE, Zilberman D. 1985. Adoption of agricultural innovations in developing countries: a survey. Econ. Dev. Cultural Change 33:255-298.
Gauchan DY, Ghimire N, Gautam S, Subedi M, Khadka R. 2008. Socioeconomic report on upland rice for ensuring household food security and rural livelihood in Nepal, A Report of Participatory Rural Appraisals, Baseline Survey and Rapid Market Appraisals of IRRI/IFAD NARC Research Project Sites. IRRI/IFAD Project, IRRI.
Herdt RW, Capule C. 1983. Adoption, spread and production impact of modern rice varieties in Asia. Los Baños (Philippines): International Rice Research Institute.
Patterns of adoption of improved rice varieties...of Nepal 93
Hossain M, Bose ML, Ahmad A. 2004. Nature and impact of women’s participation in economic activities in rural Bangladesh: insights from household surveys. CPD-IRRI, Policy Brief 7. Dhaka, Bangladesh, IRRI.
ICIMOD (Central Bureau of Statistics and International Center for Integrated Mountain Develop-ment). 2003. Districts of Nepal: indicators of development. Update 2003. Nepal: ICIMOD.
IRRI (International Rice Research Institute). 2009. World rice statistics derived from FAO 2004-2006 database—three years’ average. Los Baños (Philippines): IRRI.
Langyintuo A, Mungoma C. 2008. The effect of household wealth on the adoption of improved maize varieties in Zambia. Food Policy 33:550-559.
Launio CC, Redondo GO, Beltran JC, Morooka Y. 2008. Adoption and spatial diversity of later generation modern rice varieties in the Philippines. Agron. J. 100(5):1380-1389.
Maddala GS. 1983. In: Limited dependent and qualitative variables in econometrics. Econometric Society Monographs, vol. 3. Cambridge University Press, Cambridge.
Mallick RN. 1981. Rice in Nepal. Kathmandu (Nepal): KalaPrakasan.McDonald JF, Moffi tt RA. 1980. The uses of tobit analysis. Rev. Econ. Stat. 62:318-321. MoAC (Ministry of Agriculture and Cooperatives). 2009. Statistical information on Nepalese
agriculture. MoAC, Government of Nepal, Singh Durbar, Kathamandu, Nepal. MOF (Ministry of Finance). 2009. Economic survey. MOF, Government of Nepal, Kathmandu.MOHA (Ministry of Home Affairs). 2009. Nepal disaster report 2009: the hazardscape and
vulnerability. MOHA, Government of Nepal, with the support of European Commission. DPNet Nepal/Oxfam and UNDP. Kathamndu, Nepal.
MOPE. 2002. Nepal: national action program on land degradation and desertifi cation in the context of United Nations Convention on Combating Desertifi cation (UNCCD). Kath-mandu (Nepal): Ministry of Population and Environment of Nepal.
NARC (Nepal Agricultural Research Council). 2009 and 2010. Released and registered crop varieties for Nepal. Kathmandu (Nepal): NARC.
NLSS (Nepal Living Standard Survey). 2004. Nepal Living Standard Survey 2003/2004, Central Bureau of Statistics, National Planning Commission, Kathmandu, Nepal.
Pandey S, Bhandari H, Hardy B, editors. 2007. Economic costs of drought and rice farmers’ coping mechanisms. Los Baños (Philippines): International Rice Research Institute.
Panta H. 2010. Baseline survey report of Tanahun site, western Mid-Hills, Nepal. A preliminary draft report submitted to Social Sciences Division (STRASA project), IRRI, Philippines.
Paris T, Singh A, Cueno A, Singh VN. 2008. Assessing the impact of participatory research in rice breeding on women farmers: a case study in eastern Uttarpradesh, India. Exp. Agric. 44:97-112.
Subedi A, Gauchan D, Rana B, Vaidya SN, Tiwari PR, Chaudhary P. 2000. Gender roles and decision making in rice production and seed management: experience from different agro-ecological conditions of Nepal. In: Sthapit B, Upadhyaya M, Subedi A, editors. A scientifi c basis of in situ conservation of agrobiodiversity on-farm. Nepal’s contribution to the global project. NP Working Paper No. 1/99. NARC/LIBIRD/IPGRI. p 33-48.
Upadhyay HK. 1996. Rice research in Nepal: current state and future priorities. In: Evenson RE, Herdt RW, Hussain M, editors. Rice research in Asia: progress and priorities. CAB International/International Rice Research Institute.
Witcombe J, Lal KK, Joshi KD. 2009. Scoping study on adoption of rice varieties from client-oriented breeding in the Nepal rice innovation system. UK: CAZS Natural Resources, Bangor University.
World Bank. 2008. Agriculture for development. World Development Report. Washington, D.C. (USA): World Bank.
94 D. Gauchan et al
Notes
Authors’ addresses: D. Gauchan, S. Gautan, and M.B. Nepali, Socioeconomics & Agricultural Research Policy Division, Nepal Agricultural Research Council (NARC), Kathmandu Khumaltar, Lalitpur, Nepal; H.K. Panta, Institute of Agriculture and Animal Science, Lamjung Campus, Lamjung, Nepal.

Patterns of adoption of improved rice varieties...of Nepal 95
Appendix 1. Adoption (% area) of modern varieties by type and generation, 2008.
Item Banke Siraha Tanahun Nepal
Total rice area (ha) 57 120 33 211
Percent area in rice area
NewGenMV 34 29 42 32
OldGenMV 49 55 23 48
MV inbred 82 84 65 81
Hybrid 15 0 7 5
Total MV 98 84 71 86
TV 2 16 29 14
Total all rice 100 100 100 100
Percent in total MV area
NewGenMV 35 34 59 37
OldGenMV 50 66 32 56
MV inbred 84 100 91 94
Hybrid 16 0 9 6
Total MV 100 100 100 100
Percent in MV inbred area
NewGenMV 41 34 65 40
OldGenMV 59 66 35 60
MV inbred 100 100 100 100
Appendix 2. Labor use (% share) in rice production activities, wet season, 2008.
Labor use Banke Siraha Tanahun All
Land preparation 12 14 18 15
Crop establishment 28 15 15 19
Application of organic fertilizer 5 6 5 5
Application of chemical fertilizer 3 1 1 2
Application of pesticide 0 3 0 1
Weeding 14 16 24 19
Irrigation 0 2 6 3
Harvesting 19 17 13 16
Threshing 12 16 12 13
Postharvest activity 7 10 6 7
Total 100 100 100 100

96 D. Gauchan et al
App
endi
x 3.
Det
ails
of c
osts
and
ret
urns
(NR
s/ha
) in
MV
and
TV r
ice
prod
ucti
on, 2
008.
Cost
s an
d re
turn
s(N
Rs/
ha)
Ban
keSi
raha
Tana
hun
All
MVs
TVs
MVs
TVs
MVs
TVs
MVs
TVs
Ret
urns
Gra
in3
6,9
05
15,2
32
25
,32
318
,28
47
0,4
6161
,20
94
2,4
48
42
,70
4
Stra
w5
,42
62
,76
95
,241
4,2
1318
,89
517
,44
59
,16
811
,72
2
Tota
l ret
urns
42
,331
18,0
013
0,5
64
22
,497
89
,35
67
8,6
54
51,6
165
4,4
26
Mat
eria
l inp
ut c
ost
Seed
s
O
wn
847
1,47
72
39
231
1,18
62
,22
37
36
1,41
4
Pu
rcha
sed
1,2
09
05
23
46
79
69
297
90
83
53
Seed
tota
l2
,05
61,
477
762
69
82
,15
52
,52
01,
64
41,
767
Chem
ical
fert
ilize
rs3
,59
91,
29
23
,091
2,8
78
4,0
074
,44
53
,54
23
,717
Org
anic
fert
ilize
r
O
wn
3,1
48
071
041
94
,54
94
,09
42
,715
2,5
04
Pu
rcha
sed
44
03
43
23
613
297
517
16
50
Org
anic
fert
ilize
r tot
al3
,19
20
1,0
53
65
54
,681
5,0
69
2,8
86
3,1
54
Pest
icid
es4
20
188
02
86
176
152
101
Irrig
atio
n fe
es0
00
03
80
110
Labo
r cos
t
Fa
mily
labo
r13
,65
58
,65
53
,88
04
,016
21,7
35
25
,34
81
2,6
1716
,371
H
ired
labo
r3
,114
010
,44
66
,99
916
,19
32
0,8
30
9,2
99
14,6
52
Cont
ract
labo
r0
01,
85
51,
787
00
63
07
02
Tota
l lab
or16
,76
98
,65
516
,181
12
,80
237
,92
84
6,1
78
22
,54
631
,72
5
Cont
inue
d on
nex
t pag
e
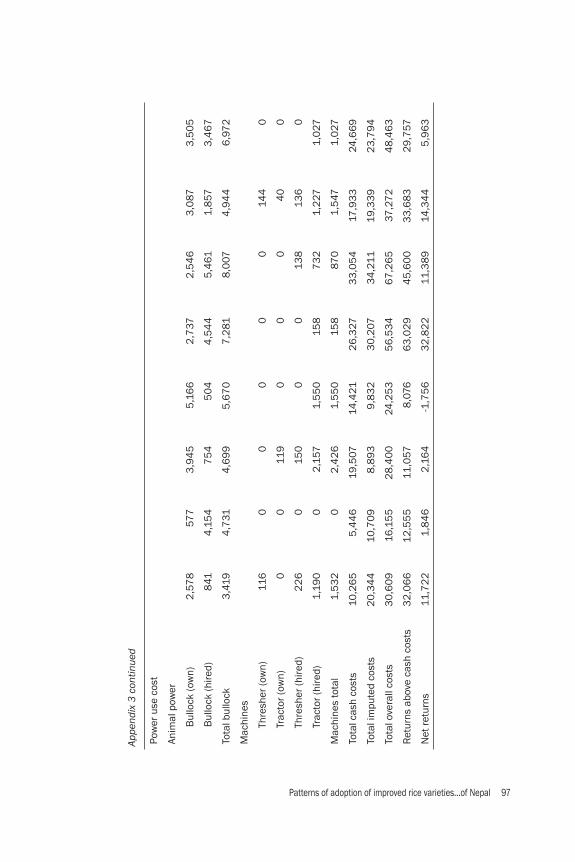
Patterns of adoption of improved rice varieties...of Nepal 97
Pow
er u
se c
ost
Anim
al p
ower
Bul
lock
(ow
n)2
,57
857
73
,94
55
,16
62
,737
2,5
46
3,0
873
,50
5
Bul
lock
(hire
d)8
414
,15
47
54
50
44
,54
45
,461
1,8
573
,46
7
Tota
l bul
lock
3,4
194
,731
4,6
99
5,6
70
7,2
818
,007
4,9
44
6,9
72
Mac
hine
s
Th
resh
er (o
wn)
116
00
00
014
40
Tr
acto
r (ow
n)0
011
90
00
40
0
Th
resh
er (h
ired)
22
60
150
00
138
136
0
Tr
acto
r (hi
red)
1,19
00
2,1
571,
55
015
87
32
1,2
271,
027
Mac
hine
s to
tal
1,5
32
02
,42
61,
55
015
887
01,
547
1,0
27
Tota
l cas
h co
sts
10,2
65
5,4
46
19,5
0714
,421
26
,327
33
,05
417
,93
324
,66
9
Tota
l im
pute
d co
sts
20
,34
410
,70
98
,89
39
,83
23
0,2
073
4,2
1119
,33
92
3,7
94
Tota
l ove
rall
cost
s3
0,6
09
16,1
55
28
,40
024
,25
35
6,5
34
67
,26
537
,27
24
8,4
63
Ret
urns
abo
ve c
ash
cost
s3
2,0
66
12
,55
511
,057
8,0
766
3,0
29
45
,60
03
3,6
83
29
,757
Net
retu
rns
11,7
22
1,8
46
2,1
64
-1,7
56
32
,82
211
,38
914
,34
45
,96
3
Appe
ndix
3 c
ontin
ued
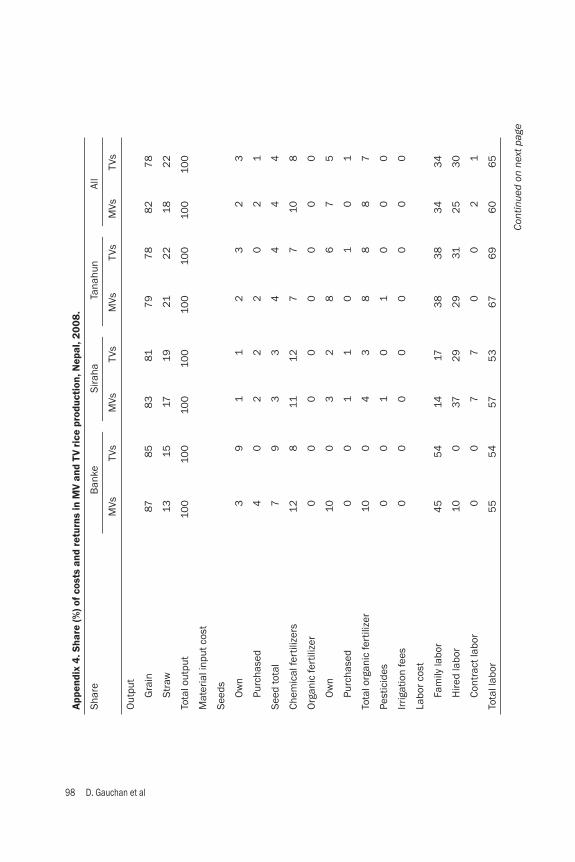
98 D. Gauchan et al
App
endi
x 4.
Sha
re (%
) of c
osts
and
ret
urns
in M
V an
d TV
ric
e pr
oduc
tion
, Nep
al, 2
008.
Shar
eB
anke
Sira
haTa
nahu
nAl
l
MVs
TVs
MVs
TVs
MVs
TVs
MVs
TVs
Out
put
Gra
in87
85
83
817
97
88
27
8
Stra
w13
1517
1921
22
182
2
Tota
l out
put
100
100
100
100
100
100
100
100
Mat
eria
l inp
ut c
ost
Seed
s
Ow
n3
91
12
32
3
Purc
hase
d4
02
22
02
1
Seed
tota
l7
93
34
44
4
Chem
ical
fert
ilize
rs1
28
111
27
710
8
Org
anic
fert
ilize
r0
00
00
00
0
Ow
n10
03
28
67
5
Purc
hase
d0
01
10
10
1
Tota
l org
anic
fert
ilize
r10
04
38
88
7
Pest
icid
es0
01
01
00
0
Irrig
atio
n fe
es0
00
00
00
0
Labo
r cos
t
Fam
ily la
bor
45
54
1417
38
38
34
34
Hire
d la
bor
100
372
92
931
25
30
Cont
ract
labo
r0
07
70
02
1
Tota
l lab
or5
55
457
53
67
69
60
65
Cont
inue
d on
nex
t pag
e

Patterns of adoption of improved rice varieties...of Nepal 99
Anim
al p
ower
Bul
lock
(ow
n)8
414
215
48
7
Bul
lock
(hire
d)3
26
32
88
57
Tota
l ani
mal
pow
er11
29
172
313
12
1314
Mac
hine
pow
er
Thre
sher
(ow
n)0
00
00
00
0
Trac
tor (
owne
d)0
00
00
00
0
Thre
sher
(hire
d)1
01
00
00
0
Trac
tor (
hire
d)4
08
60
13
2
Mac
hine
s to
tal
50
96
01
42
Tota
l ove
rall
cost
s10
010
010
010
010
010
010
010
0
Tota
l im
pute
d co
sts
67
66
32
415
451
52
49
Cash
cos
ts a
s %
of t
otal
ove
rall
cost
s3
33
46
85
94
64
94
851
Appe
ndix
4 c
ontin
ued
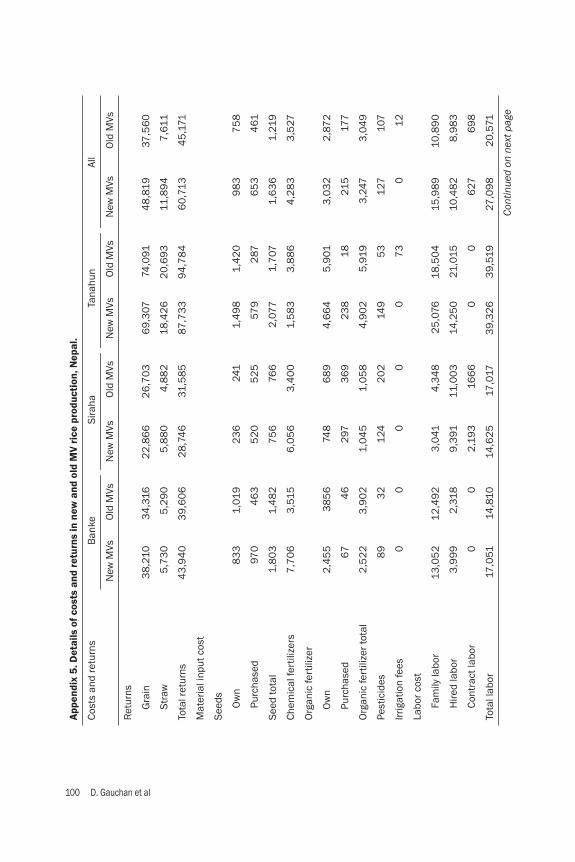
100 D. Gauchan et al
App
endi
x 5.
Det
ails
of c
osts
and
ret
urns
in n
ew a
nd o
ld M
V ri
ce p
rodu
ctio
n, N
epal
.
Cost
s an
d re
turn
sB
anke
Sira
haTa
nahu
nAl
l
New
MVs
Old
MVs
New
MVs
Old
MVs
New
MVs
Old
MVs
New
MVs
Old
MVs
Ret
urns
Gra
in3
8,2
103
4,3
162
2,8
66
26
,70
36
9,3
0774
,091
48
,819
37,5
60
Stra
w5
,73
05
,29
05
,88
04
,88
218
,42
62
0,6
93
11,8
94
7,6
11
Tota
l ret
urns
43
,94
03
9,6
06
28
,74
631
,58
587
,73
39
4,7
84
60
,713
45
,171
Mat
eria
l inp
ut c
ost
Seed
s
Ow
n8
33
1,01
92
36
241
1,4
98
1,4
20
98
37
58
Purc
hase
d97
04
63
52
05
25
579
287
65
34
61
Seed
tota
l1,
80
31,
48
27
56
766
2,0
771,
707
1,6
36
1,21
9
Chem
ical
fert
ilize
rs7
,70
63
,515
6,0
56
3,4
00
1,5
83
3,8
86
4,2
83
3,5
27
Org
anic
fert
ilize
r
Ow
n2
,45
53
85
674
86
89
4,6
64
5,9
013
,03
22
,87
2
Purc
hase
d6
74
62
973
69
23
818
215
177
Org
anic
fert
ilize
r tot
al2
,52
23
,90
21,
04
51,
05
84
,90
25
,919
3,2
473
,04
9
Pest
icid
es8
93
21
242
02
149
53
127
107
Irrig
atio
n fe
es0
00
00
73
01
2
Labo
r cos
t
Fam
ily la
bor
13,0
52
12
,49
23
,041
4,3
48
25
,076
18,5
04
15,9
89
10,8
90
Hire
d la
bor
3,9
99
2,3
189
,391
11,0
03
14,2
50
21,0
1510
,48
28
,98
3
Cont
ract
labo
r0
02
,19
316
66
00
627
69
8
Tota
l lab
or17
,051
14,8
1014
,62
517
,017
39
,32
63
9,5
1927
,09
82
0,5
71
Cont
inue
d on
nex
t pag
e

Patterns of adoption of improved rice varieties...of Nepal 101
Pow
er u
se c
ost
Anim
al p
ower
Bul
lock
(ow
n)2
,78
43
,676
3,3
04
3,2
90
Bul
lock
(hire
d)61
04
98
3,1
111,
78
4
Tota
l bul
lock
3,3
94
04
,174
06
,415
05
,074
0
Mac
hine
s
Thre
shor
(ow
n)0
00
0
Trac
tor (
owne
d)0
00
0
Thre
sher
(hire
d)5
66
165
017
8
Trac
tor (
hire
d)14
70
1,9
64
09
02
Mac
hine
s to
tal
2,0
36
02
,12
90
00
1,0
80
0
Tota
l cas
h co
sts
15,4
767
,83
921
,20
82
0,0
95
19,9
102
8,7
34
20
,17
516
,35
6
Tota
l im
pute
d co
sts
19,7
34
22
,14
38
,19
99
,56
037
,65
32
8,4
102
5,0
78
17,8
83
Tota
l ove
rall
cost
s3
5,2
102
9,9
82
29
,407
29
,65
557
,56
357
,14
44
4,3
30
34
,23
9
Ret
urns
abo
ve c
ash
cost
s2
8,4
62
33
,23
27
,53
814
,42
06
7,8
23
69
,45
241
,46
231
,20
5
Net
retu
rns
8,7
30
9,6
24-6
611,
93
03
0,1
70
37,6
4116
,38
310
,931
Appe
ndix
5 c
ontin
ued

102 D. Gauchan et al
App
endi
x 6.
Sha
re (%
) of c
osts
for
new
and
old
MV
rice
cul
tiva
tion
, Nep
al.
Cost
s an
d re
turn
sB
anke
Sira
haTa
nahu
nAl
l
New
MVs
Old
MVs
New
MVs
Old
MVs
New
MVs
Old
MVs
New
MVs
Old
MVs
Out
put
Gra
in87
878
08
57
97
88
08
3
Stra
w13
132
015
212
22
017
Tota
l out
put
100
100
100
100
100
100
100
100
Mat
eria
l inp
ut c
ost
Seed
s
Ow
n2
31
13
22
2
Purc
hase
d3
22
21
11
1
Seed
tota
l5
53
34
34
4
Chem
ical
fert
ilize
r2
21
221
113
710
10
Org
anic
fert
ilize
r0
00
00
00
0
Ow
n7
133
28
107
8
Purc
hase
d0
01
10
00
1
Org
anic
fert
ilize
r tot
al7
134
49
107
9
Pest
icid
es0
00
10
00
0
Irrig
atio
n fe
es0
00
00
00
0
Labo
r cos
t
Fam
ily la
bor
374
210
154
43
23
63
2
Hire
d la
bor
118
32
372
537
242
6
Cont
ract
labo
r0
07
60
01
2
Cont
inue
d on
nex
t pag
e
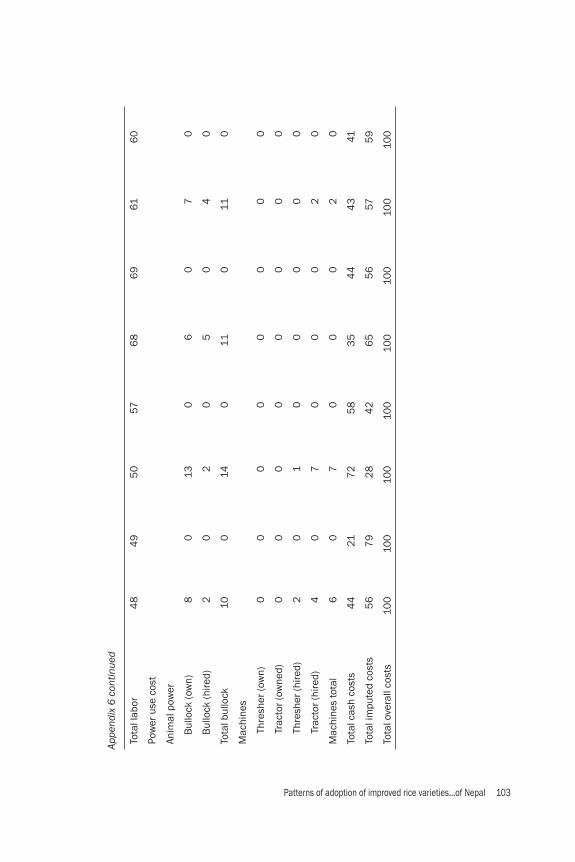
Patterns of adoption of improved rice varieties...of Nepal 103
Tota
l lab
or4
84
95
057
68
69
616
0
Pow
er u
se c
ost
Anim
al p
ower
Bul
lock
(ow
n)8
013
06
07
0
Bul
lock
(hire
d)2
02
05
04
0
Tota
l bul
lock
100
140
110
110
Mac
hine
s
Thre
sher
(ow
n)0
00
00
00
0
Trac
tor (
owne
d)0
00
00
00
0
Thre
sher
(hire
d)2
01
00
00
0
Trac
tor (
hire
d)4
07
00
02
0
Mac
hine
s to
tal
60
70
00
20
Tota
l cas
h co
sts
44
217
25
83
54
44
341
Tota
l im
pute
d co
sts
56
79
28
42
65
56
575
9
Tota
l ove
rall
cost
s10
010
010
010
010
010
010
010
0
Appe
ndix
6 c
ontin
ued

104 D. Gauchan et al
Patterns of adoption of improved rice varieties ... of Assam, India 105
Patterns of adoption of improved rice varieties and farm-level impacts in stress-prone rainfed areas of Assam, India
Chapter 4

106 N. Deka and D. Gauchan
Patterns of adoption of improved rice varieties ... of Assam, India 107
Patterns of adoption of improved rice varieties and farm-level impacts in stress-prone rainfed areas of Assam, India
Introduction
State backgroundAssam is the largest among the seven northeastern states of India. It is located be-tween 24° and 28°18′N latitude and 89°4′ and 96.0°E longitude and endowed with abundant fertile land and water resources. The total area of the state is 78,438 km2, with a population of 26.4 million. A majority of the state’s population (almost 87%) lives in rural areas, where the mainstay of income is from agriculture (Bhowmick et al 2005). Agriculture is the major source of income and employment for the people. After agriculture, industry and mining are the next two important sources of income and employment. However, the agricultural sector is growing marginally at 2–3% per year as compared with the higher growth rate in nonagricultural sectors. In recent years, the economy of Assam in terms of gross state domestic product (GSDP) has been growing at almost the same pace of 7–8% per annum as the national economy of India (Economic Survey Assam 2007-08). The incidence of poverty in the state fell to 19.7% in 2004-05 compared with 40.86% in 1993-94. This population below the poverty line is lower than in many neighboring states of eastern India and the all-India fi gure of 27.50% in 2004-05 (Economic Survey India 2009-10). According to recent estimates, per capita income in Assam at 1993-94 constant prices reached INR 20,000 (US$470) in 2008, which is slightly better than many eastern states of India such as Orissa, Bihar, and Jharkhand but lower than the national average of $739 for all-India in 2008 (World Bank 2008). This report is the outcome of a baseline socioeconomic survey carried out under Objective 7 (Impact assessment and targeting) of the STRASA (Stress-Tolerant Rice for Africa and South Asia) project. The specifi c objectives of the study follow.
N. Deka and D. Gauchan

108 N. Deka and D. Gauchan
Objectives1. To assess farmers’ livelihood systems in the selected submergence-prone
environments2. To analyze the patterns of varietal adoption and factors infl uencing the adop-
tion of modern rice varieties3. To analyze the economics of rice production by the type of variety 4. To document coping strategies of farmers for submergence stress 5. To understand gender roles in rice production and women’s participation in
decision making6. To serve as a baseline for rice technology design, targeting, and policy reforms
in stress-prone areas
Organization of the reportThis report is organized into six major sections. The fi rst section gives a general background of the state and the objectives of the study. This is followed by a short description of the research design and data generation. The third section gives a brief description of the broader trends in rice production in Assam using state-level time-series data. The fourth section provides a general description of the survey sites and stress situations using information gathered from focus group discussions and key informant surveys. Section fi ve provides farm-level analysis of the socioeconomic survey describing the livelihoods of farmers, adoption pattern, economics of rice production, consumption pattern, coping strategies, and gender analysis. The fi nal section provides a summary of the fi ndings and implications.
Research design and data generation
This research was implemented in close collaboration and partnership with Assam Agricultural University (AAU), Assam, India. Data for this study were collected by combining rapid rural appraisals methods, secondary sources, and specifi cally designed household surveys from two representative rainfed rice-producing locations of Assam, India (Fig. 1). The survey was carried out for the 2008 rice cropping season under the STRASA project in South Asia. The prevalence of submergence stress and proportion of rainfed rice area were two major criteria for the selection of districts and study vil-lages. Household surveys were conducted in 200 randomly selected households (100 households in each district) covering representative rainfed districts that are prone to fl ash fl oods. These districts include Golaghat and Sibsagar from the Brahmaputra Valley in Assam. In each district, two villages were selected for the detailed household survey covering 50 households from each village. One of the selected surveyed vil-lages in Sibsagar District was also the on-farm participatory varietal selection (PVS) site for the STRASA project. The survey sites and stress situations were characterized by using focus group discussions and key informant surveys.
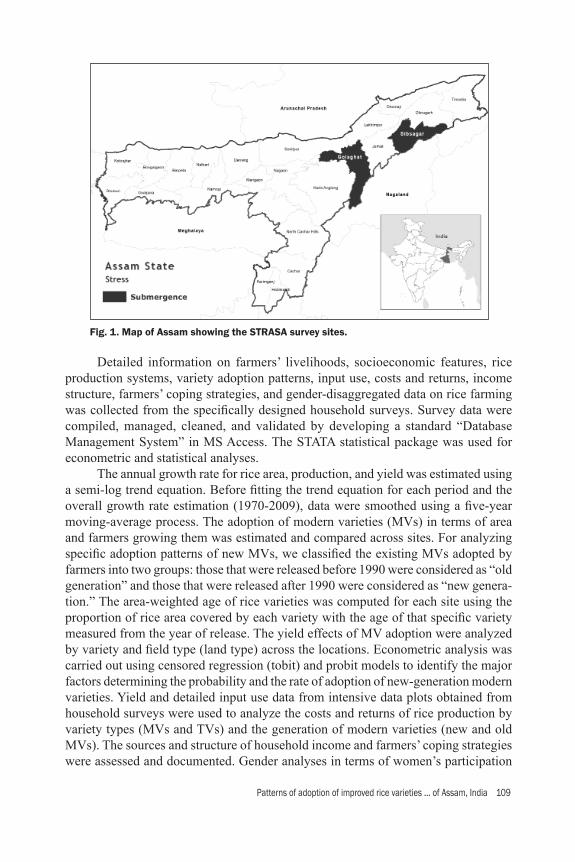
Patterns of adoption of improved rice varieties ... of Assam, India 109
Detailed information on farmers’ livelihoods, socioeconomic features, rice production systems, variety adoption patterns, input use, costs and returns, income structure, farmers’ coping strategies, and gender-disaggregated data on rice farming was collected from the specifi cally designed household surveys. Survey data were compiled, managed, cleaned, and validated by developing a standard “Database Management System” in MS Access. The STATA statistical package was used for econometric and statistical analyses. The annual growth rate for rice area, production, and yield was estimated using a semi-log trend equation. Before fi tting the trend equation for each period and the overall growth rate estimation (1970-2009), data were smoothed using a fi ve-year moving-average process. The adoption of modern varieties (MVs) in terms of area and farmers growing them was estimated and compared across sites. For analyzing specifi c adoption patterns of new MVs, we classifi ed the existing MVs adopted by farmers into two groups: those that were released before 1990 were considered as “old generation” and those that were released after 1990 were considered as “new genera-tion.” The area-weighted age of rice varieties was computed for each site using the proportion of rice area covered by each variety with the age of that specifi c variety measured from the year of release. The yield effects of MV adoption were analyzed by variety and fi eld type (land type) across the locations. Econometric analysis was carried out using censored regression (tobit) and probit models to identify the major factors determining the probability and the rate of adoption of new-generation modern varieties. Yield and detailed input use data from intensive data plots obtained from household surveys were used to analyze the costs and returns of rice production by variety types (MVs and TVs) and the generation of modern varieties (new and old MVs). The sources and structure of household income and farmers’ coping strategies were assessed and documented. Gender analyses in terms of women’s participation
Fig. 1. Map of Assam showing the STRASA survey sites.

110 N. Deka and D. Gauchan
and decision making related to rice production and overall livelihood activities were carried out using gender-disaggregated data. The Women’s Empowerment Index was computed using 16 gender-related indicators to document the status of women’s empowerment at the study sites.
Agriculture and trends in rice production
Agriculture accounts for more than a third of Assam’s income and employs 69% of the total workforce (Economic Survey Assam, 2007-08). Rice is the principal crop in the cropping pattern and is the staple food of the population. It plays a signifi cant role in the state economy by being the single major source of agricultural GDP. Rice occupies nearly 88% of the net area sown of the state and almost 90% of the popula-tion depends on rice as a main food staple. Rice cultivation is gaining importance in the state due to its gradual increase in demand as a result of population growth and migration of people into the state (Bhowmick and Borthakar 2002). Assam is a riverine state, where riverine area covers more than one-fourth
of the
total geographical area. The mighty Brahmaputra River, with more than 120 tributaries and subtributaries, and the Barak River, with nine important tributaries, constitute the two-river system of the state. The Brahmaputra Valley, which makes up more than 75% of Assam’s geographical area, has the most fertile land in the fl ood plains, and it is very densely populated. Assam is administratively divided into 27 districts. These districts fall into three broad physiographic units: (1) the Brahmaputra Valley in the north, (2) the Barak Valley in the south, and (3) the Hills region that lies in between the two valleys. Specifi cally, the state is divided into six broad agro-climatic zones based on geo-hydrological and physiographic characteristics (Bhowmick et al 2005):
1. North Bank Plains Zone (NBPZ) 2. Upper Brahmaputra Valley Zone (UBVZ)3. Central Brahmaputra Valley Zone (CBVZ)4. Lower Brahmaputra Valley Zone (LBVZ)5. Barak Valley Zone (BVZ) 6. Hills Zone (HZ)
Within each ecological region, rice is cultivated in different ecosystems: irri-gated, rainfed lowland, rainfed upland, and deep water. The state has more than 80% of the area under rainfed lowland and deepwater ecosystems, with a high occurrence of natural calamities such as fl oods. Rice can be grown in three seasons: a wet sea-son (sali) in July to December and in dry seasons from January to May (boro) and November to May (ahu). Deepwater rice (bao) is also grown in low-lying areas in deepwater areas (with water stagnation beyond 50 cm for more than a month) during the wet season. Dry-season rice is very much limited in the state. Boro rice currently occupies only 12% of the rice area, despite its great potential for surface-water and groundwater facilities. Some farmers grow it depending upon the availability of irriga-tion and market support facilities. The cropping intensity is moderately low (129%)
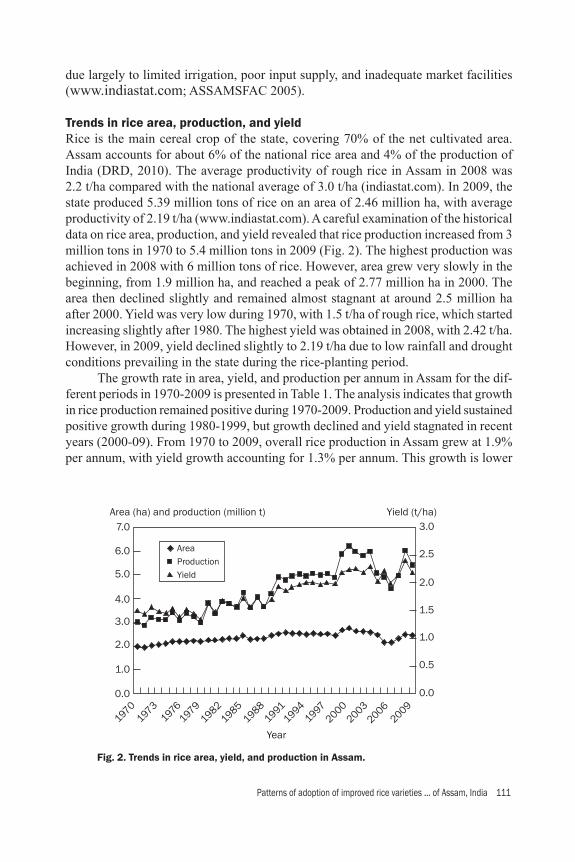
Patterns of adoption of improved rice varieties ... of Assam, India 111
due largely to limited irrigation, poor input supply, and inadequate market facilities (www.indiastat.com; ASSAMSFAC 2005).
Trends in rice area, production, and yieldRice is the main cereal crop of the state, covering 70% of the net cultivated area. Assam accounts for about 6% of the national rice area and 4% of the production of India (DRD, 2010). The average productivity of rough rice in Assam in 2008 was 2.2 t/ha compared with the national average of 3.0 t/ha (indiastat.com). In 2009, the state produced 5.39 million tons of rice on an area of 2.46 million ha, with average productivity of 2.19 t/ha (www.indiastat.com). A careful examination of the historical data on rice area, production, and yield revealed that rice production increased from 3 million tons in 1970 to 5.4 million tons in 2009 (Fig. 2). The highest production was achieved in 2008 with 6 million tons of rice. However, area grew very slowly in the beginning, from 1.9 million ha, and reached a peak of 2.77 million ha in 2000. The area then declined slightly and remained almost stagnant at around 2.5 million ha after 2000. Yield was very low during 1970, with 1.5 t/ha of rough rice, which started increasing slightly after 1980. The highest yield was obtained in 2008, with 2.42 t/ha. However, in 2009, yield declined slightly to 2.19 t/ha due to low rainfall and drought conditions prevailing in the state during the rice-planting period. The growth rate in area, yield, and production per annum in Assam for the dif-ferent periods in 1970-2009 is presented in Table 1. The analysis indicates that growth in rice production remained positive during 1970-2009. Production and yield sustained positive growth during 1980-1999, but growth declined and yield stagnated in recent years (2000-09). From 1970 to 2009, overall rice production in Assam grew at 1.9% per annum, with yield growth accounting for 1.3% per annum. This growth is lower
Fig. 2. Trends in rice area, yield, and production in Assam.
5.0
4.0
3.0
3.0
2.5
1.5
0.5
0.0
2.0
1.02.0
1.0
0.0
6.0
7.0
AreaProductionYield
Area (ha) and production (million t) Yield (t/ha)
Year197
0197
3197
6197
91982
19851988
19911994
19972000
20032006
2009
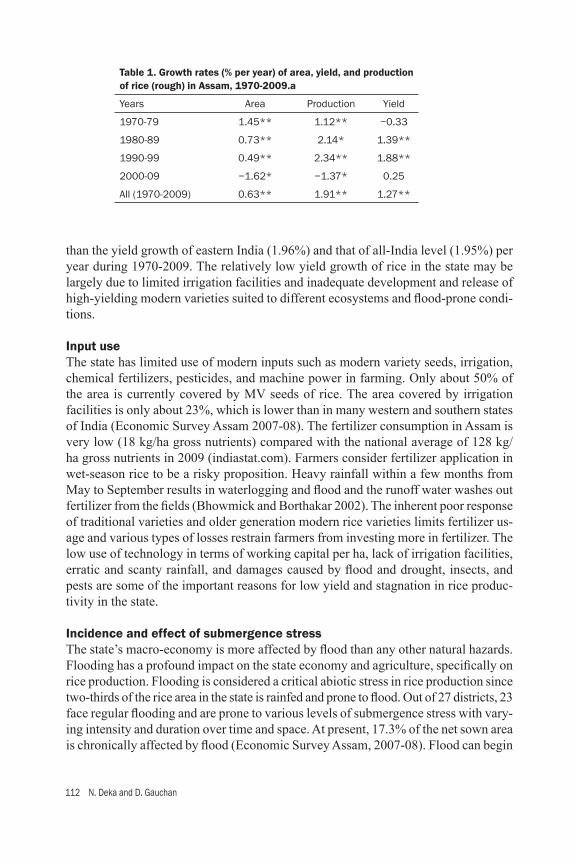
112 N. Deka and D. Gauchan
than the yield growth of eastern India (1.96%) and that of all-India level (1.95%) per year during 1970-2009. The relatively low yield growth of rice in the state may be largely due to limited irrigation facilities and inadequate development and release of high-yielding modern varieties suited to different ecosystems and fl ood-prone condi-tions.
Input useThe state has limited use of modern inputs such as modern variety seeds, irrigation, chemical fertilizers, pesticides, and machine power in farming. Only about 50% of the area is currently covered by MV seeds of rice. The area covered by irrigation facilities is only about 23%, which is lower than in many western and southern states of India (Economic Survey Assam 2007-08). The fertilizer consumption in Assam is very low (18 kg/ha gross nutrients) compared with the national average of 128 kg/ha gross nutrients in 2009 (indiastat.com). Farmers consider fertilizer application in wet-season rice to be a risky proposition. Heavy rainfall within a few months from May to September results in waterlogging and fl ood and the runoff water washes out fertilizer from the fi elds (Bhowmick and Borthakar 2002). The inherent poor response of traditional varieties and older generation modern rice varieties limits fertilizer us-age and various types of losses restrain farmers from investing more in fertilizer. The low use of technology in terms of working capital per ha, lack of irrigation facilities, erratic and scanty rainfall, and damages caused by fl ood and drought, insects, and pests are some of the important reasons for low yield and stagnation in rice produc-tivity in the state.
Incidence and effect of submergence stressThe state’s macro-economy is more affected by fl ood than any other natural hazards. Flooding has a profound impact on the state economy and agriculture, specifi cally on rice production. Flooding is considered a critical abiotic stress in rice production since two-thirds of the rice area in the state is rainfed and prone to fl ood. Out of 27 districts, 23 face regular fl ooding and are prone to various levels of submergence stress with vary-ing intensity and duration over time and space. At present, 17.3% of the net sown area is chronically affected by fl ood (Economic Survey Assam, 2007-08). Flood can begin
Table 1. Growth rates (% per year) of area, yield, and production of rice (rough) in Assam, 1970-2009.a
Years Area Production Yield
1970-79 1.45** 1.12** −0.33
1980-89 0.73** 2.14* 1.39**
1990-99 0.49** 2.34** 1.88**
2000-09 −1.62* −1.37* 0.25
All (1970-2009) 0.63** 1.91** 1.27**

Patterns of adoption of improved rice varieties ... of Assam, India 113
at the onset of monsoon in June to early October every year but the timing, severity, and frequency vary from year to year. Moderate to severe fl ooding occurs every 2–3 years, even though mild fl ooding (for 2–3 days) is common every year. Most of the currently available improved varieties cannot tolerate such prolonged periods under water and farmers face high crop losses. The years 1962, 1988, 1994, 1998, 2004, 2007, and 2009 had major fl oods for the entire Brahmaputra Valley. In recent major events, fl oods have become more devastating, mainly because of breaches in and erosion of the embankments (Das et al 2009). The farming community of the state in general and the rice growers in particular suffer much from damages caused by fl oods in the form of crop losses, human and cattle lives lost, and above all a substantial income loss. The damages caused by fl ood every year in the state are very high. The total economic losses in the state, including those of livestock, human lives, and physical damage, were estimated to be equivalent to US$36 million and the economic losses due to crop damage alone were about $4 million (Economic Survey Assam 2007-08).
Site and stress characterization
Description of survey sitesGeneral features of survey sites. Sibsagar and Golaghat are the two districts out of 27 districts of the state where a socioeconomic baseline survey for submergence stress has been carried out for the STRASA project. These two districts represent part of the Brahmaputra fl ood-prone plains, where fl ooding is a major constraint to increased rice production. These districts are located 300–369 km away to the east of Guwahati City, the capital of Assam. Rice is the main crop of these districts. Two villages from each district representing fl ash-fl ood and water stagnation situations were selected to represent the submergence situations of Assam (Fig. 3). These selected villages are Mogorahat and Gorkasoria from Sibsagar District and Mithamchapori and Kenduguri from Golaghat District (Table 2). Some 80–89% of the cultivated area is under rice cropping and 95% of the rice area has no irrigation facilities. Limited irrigation is available through tube wells, homestead ponds, depressed low-lying areas (beel or nabul), and from nearby river canals. However, the proportion of area irrigated is very small in all the villages. Irrigation is available mainly during the wet season from homestead ponds and beel. Dry-season irrigation is very much limited. A brief profi le of the sites is presented in Table 2. The villages are located 3–5 km away from the main market centers and most of them are accessible by dirt roads. They are located at 100 to 120 meters above mean sea level. The study sites are inhab-ited by different ethnic groups such as Ahom, Hindu with different castes, indigenous people (Adibasi), and Nepali. At the Golaghat site, Hindu caste (Kalita) dominated the population, followed by Adibasi and Nepali, whereas, in Sibsagar, Ahom caste dominated the sample population, followed by Koch and Hindu caste.

114 N. Deka and D. Gauchan
Broadly, there are not many differences in other parameters among the study sites in terms of physical access, farm land types, irrigation infrastructure, and crop-ping systems. However, some internal differences exist between the villages regarding the incidences of fl ooding stress and other parameters.
Fig. 3. Map of (A) Golaghat District and (B) Sibsagar District showing study villages.
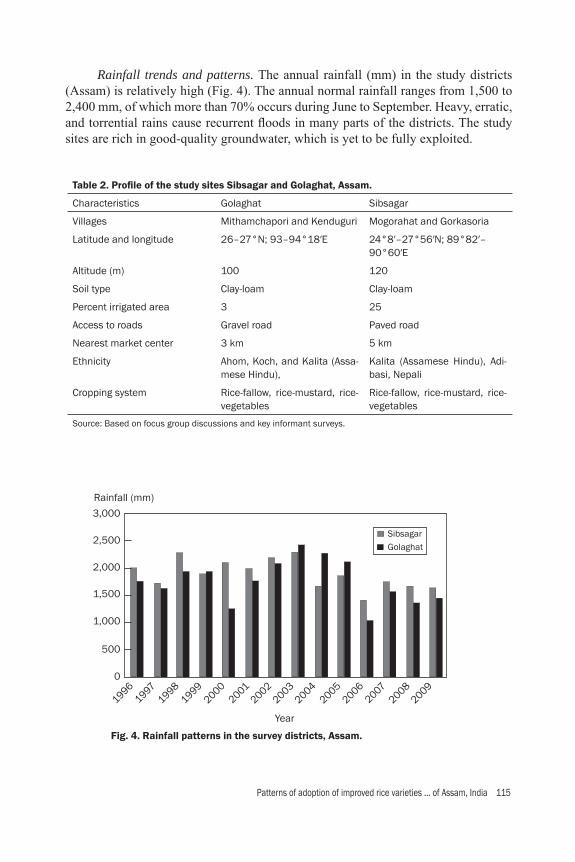
Patterns of adoption of improved rice varieties ... of Assam, India 115
Rainfall trends and patterns. The annual rainfall (mm) in the study districts (Assam) is relatively high (Fig. 4). The annual normal rainfall ranges from 1,500 to 2,400 mm, of which more than 70% occurs during June to September. Heavy, erratic, and torrential rains cause recurrent fl oods in many parts of the districts. The study sites are rich in good-quality groundwater, which is yet to be fully exploited.
Table 2. Profi le of the study sites Sibsagar and Golaghat, Assam.
Characteristics Golaghat Sibsagar
Villages Mithamchapori and Kenduguri Mogorahat and Gorkasoria
Latitude and longitude 26–27°N; 93–94°18′E 24°8′–27°56′N; 89°82′–90°60′E
Altitude (m) 100 120
Soil type Clay-loam Clay-loam
Percent irrigated area 3 25
Access to roads Gravel road Paved road
Nearest market center 3 km 5 km
Ethnicity Ahom, Koch, and Kalita (Assa-mese Hindu),
Kalita (Assamese Hindu), Adi-basi, Nepali
Cropping system Rice-fallow, rice-mustard, rice-vegetables
Rice-fallow, rice-mustard, rice-vegetables
Source: Based on focus group discussions and key informant surveys.
Fig. 4. Rainfall patterns in the survey districts, Assam.
3,000
19961997
19981999
20002001
20022003
20042005
20062007
20082009
2,500
2,000
1,500
1,000
500
0
Rainfall (mm)
Year
SibsagarGolaghat

116 N. Deka and D. Gauchan
Description of stress situationsFlood occurrence, nature, intensity, and trends. The nature of the fl ooding at the study sites is presented in Table 3. Recurrent fl ooding is a common problem at both Sibsagar and Golaghat sites. The recent fl ood that occurred at the study sites was dur-ing 2006 and 2007. Flooding was also observed in 2004, 2000, 1998, and 1994. The occurrence of fl ood starts from the onset of monsoon in June and can occur until early October every year but the timing, severity, and frequency vary from year to year. Moderate to severe fl ooding occurs every 2–3 years, even though mild fl ooding (for 2–3 days) occurs every year. Rice production is delayed when early-season fl ooding is severe and farmers have to wait to transplant the crop after fl ood recedes. During fl ood years, when rice transplanting is delayed due to early fl ooding, harvesting of the crop is also delayed by about a month (e.g., January). During fl ood stress, yield declines substantially and, in some cases, when fl ooding is severe, farmers either fail to plant the crop or the crop is completely damaged with almost complete yield losses. Flooding occurs mostly during July to October in both districts. In some years, fl ood-ing occurs three times. Early fl ooding is during June-July, second fl ooding takes place in July-August, and third fl ooding occurs during late August-September. September (late-season) fl ooding is the most devastating for rice production. The survey year 2008 was a normal year for the area, though some fl ooding occurred for 2 weeks or more during the early part of the season. The duration of fl ooding is 10–15 days in Sibsagar while in Golaghat it is 15–20 days. The depth of fl ooding goes from 60 to 70 cm, which is common in lowland. Flooding is most commonly observed during tillering and panicle initiation stages. Sometimes seedbeds are also damaged by fl oods. The incidence and damage caused by fl ood are severe in Golaghat District as 90–95% of the area and more of the house-
Table 3. Nature of fl ooding stress at Sibsagar and Golaghat sites, Assam.
Flood effects Golaghat Sibsagar
Recent stress years 2004 and 2006 2006 and 2007
Normal year 2008 2008
Duration of fl ood 15–20 days 10–15 days
Flood depth 60–65 cm 60–70 cm
Timing of fl ood June-October July-September
Source of fl ooding Rain and river River
Frequency of fl ood Every 2–3 years Every 2–3 years
Stage of fl ooding Tillering-heading Tillering-heading
Severity of fl ood Severe Moderate
% Flood-affected area 90–95 84–90
% HH affected by fl ood 90–95 61–80
% Yield losses 80–90 60–70
Source: Based on focus group discussions and key informant surveys.

Patterns of adoption of improved rice varieties ... of Assam, India 117
holds (90–95%) are affected by fl ood. Moreover, yield losses caused by fl ooding are also perceived to be high (80–90%) in Golaghat compared with Sibsagar (60–70%). The fl ooding caused by rainwater and river overfl ow is the most common and severe form in the study villages. The major source of river fl ooding is the back fl ow of water coming from rivulets of the Brahmaputra River at both Sibsagar and Golaghat sites (e.g., Dikhow and Namdang in Sibsagar and Dhansir in Golaghat).
Farm-level analysis
Household and farm characteristicsHousehold demographic characteristics. Sample households have almost similar demographic features across the surveyed sites (Table 4). The average family size ranges from 5 members in Golaghat to 6 members in Sibsagar. About 80% of the household members are adults (above 16 years’ age). The respondent farmers are mainly in middle age (47–50 years). The number of years of schooling of the respon-dent farmers is 8–10 at both sites. Primary occupation of the households. Agriculture (mainly rice farming) is the primary occupation for 82% of the household members who are economically active (Table 5). Farmers in Golaghat are fully dependent on agriculture (97%) with very limited engagement in labor wage employment outside agriculture. However, a pro-
Table 4. General characteristics of respondent households.
Household characteristics Golaghat Sibsagar All
No. of households 100 100 200
No. of respondents (household heads)
Males 97 97 97
Females 3 3 3
Average household size 5 6 5
Av. percentage of adult members 82 78 81
Average age of respondents 47 50 49
Av. years of education of respondents 8 10 9
Table 5. Primary occupation of the economically active household members.
Primary occupation Golaghat Sibsagar All
Agriculture (rice-based farming) 97 66 82
Business/local trading 0 11 5
Nonfarm skilled employment 0 1 1
Service (private + public jobs) 0 16 8
Labor wages and others 3 6 4
Total 100 100 100
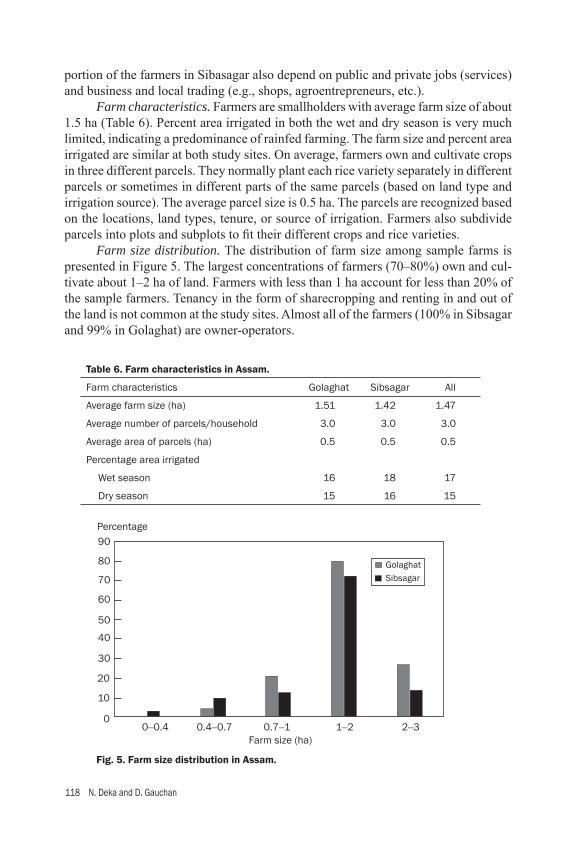
118 N. Deka and D. Gauchan
portion of the farmers in Sibasagar also depend on public and private jobs (services) and business and local trading (e.g., shops, agroentrepreneurs, etc.). Farm characteristics. Farmers are smallholders with average farm size of about 1.5 ha (Table 6). Percent area irrigated in both the wet and dry season is very much limited, indicating a predominance of rainfed farming. The farm size and percent area irrigated are similar at both study sites. On average, farmers own and cultivate crops in three different parcels. They normally plant each rice variety separately in different parcels or sometimes in different parts of the same parcels (based on land type and irrigation source). The average parcel size is 0.5 ha. The parcels are recognized based on the locations, land types, tenure, or source of irrigation. Farmers also subdivide parcels into plots and subplots to fi t their different crops and rice varieties. Farm size distribution. The distribution of farm size among sample farms is presented in Figure 5. The largest concentrations of farmers (70–80%) own and cul-tivate about 1–2 ha of land. Farmers with less than 1 ha account for less than 20% of the sample farmers. Tenancy in the form of sharecropping and renting in and out of the land is not common at the study sites. Almost all of the farmers (100% in Sibsagar and 99% in Golaghat) are owner-operators.
Fig. 5. Farm size distribution in Assam.
Table 6. Farm characteristics in Assam.
Farm characteristics Golaghat Sibsagar All
Average farm size (ha) 1.51 1.42 1.47
Average number of parcels/household 3.0 3.0 3.0
Average area of parcels (ha) 0.5 0.5 0.5
Percentage area irrigated
Wet season 16 18 17
Dry season 15 16 15
70
60
50
40
30
20
10
0–0.4 0.4–0.7 0.7–1 1–2 2–30
80
90Percentage
Farm size (ha)
GolaghatSibsagar

Patterns of adoption of improved rice varieties ... of Assam, India 119
Ethnic composition. Farmers with diverse ethnic composition reside at the survey sites. They include Adibasi (indigenous groups) to different Hindu caste groups and Muslim (Table 7). The composition of the ethnic groups varies by sites. Golaghat site has a larger number of Adibasi (indigenous) and Kalita ethnic groups while Sibsagar has a large proportion of Ahom. Household endowment of land type. Generally, farmers recognize and classify crop fi elds into three different land types based on fi eld hydrology, which is related to toposequence. These include lowland, medium land, and upland (upper fi elds). Farmers cultivate different crops and rice varieties on these different land types to meet their diverse production and consumption needs. The proportion of different land types is presented in Table 8. Lowlands are located in the lower toposequence of the fi elds, where moisture retention capacity is higher. Uplands are located in upper fi elds with lighter soil that has less water retention capacity. Medium land is intermediate between lowland and medium lands. Households own and cultivate a higher proportion of lowland fi eld
Table 7. Ethnic composition of respondent households.
Percent households Golaghat Sibsagar All
Adibasi (indigenous) 22 1 11
Ahom 5 57 31
Brahmin 7 6 7
Gossin 0 2 1
Guggi 2 0 1
Kalita 34 14 24
Koch 2 20 11
Muslim 2 0 1
Nepali 16 0 8
Scheduled caste 10 0 5
All 100 100 100
Table 8. Land endowments by land type (% share).
Land endowments Golaghat Sibsagar All
Average farm size (ha) 1.51 1.42 1.47
Share of different land types (%)
Upland (upper fi elds) 11 18 14
Medium land (medium fi elds) 33 33 33
Lowland (lower fi elds) 56 49 53
All 100 100 100

120 N. Deka and D. Gauchan
types, followed by medium land types. However, the proportion of upland fi eld types is smaller and they are mainly used for the cultivation of nonrice crops such as veg-etables, potato, mustard, and fruit and fodder trees.
Rice-based cropping systemsRice is the dominant crop, occupying 81–89% of the area at the sites in the wet season (Table 9). Dry-season cropping after wet-season rice is very much limited due to a lack of irrigation facilities. As a result, cropping intensity is relatively low (113%) at the study sites compared with the state average of 129% for Assam (indiastat.com). Farmers currently allocate a smaller proportion of their area to nonrice crops. The nonrice crops grown include vegetables, potato, and perennial crops such as betel nut, tea, bamboo, fruit crops, mustard, and legumes. Vegetable crops rank second after rice. Sibsagar has a relatively higher share of area under vegetable crops (15%) than Golaghat (7%). Mustard is the main dry-season crop grown in rainfed conditions. Potato and perennial crops such as fruits, tea, and betel nuts occupy a very small proportion of the current cultivated area. No sample farmers grow rice during the dry season, even though some farmers in nearby villages are known to grow rice during the dry season.
Adoption pattern of modern rice varietiesThe adoption of crop varieties is generally measured by two indicators: the incidence and intensity of adoption. The incidence of adoption is defi ned as the percentage of farmers using an MV (technology) at a specifi c point in time. The intensity of adoption refers to the proportion of area allocated to MVs. The extent of adoption of modern rice varieties in terms of both intensity and incidence is described below. Pattern of MV adoption. The extent of adoption of modern rice varieties in terms of the proportion of area (intensity) is fairly high (59–63%) at both the surveyed sites (Table 10). Almost all of the households (94–99%) grow both MVs and TVs. MV adoption by farmers is very high but the adoption is only on part of their land (partial).
Table 9. Percent gross area under rice and nonrice crops, and cropping intensity.
Major crops (% gross area) Golaghat Sibsagar All
Rice+a 89 81 85
Vegetables 7 15 11
Potato 1 0 1
Perennial cropsb 3 4 3
Total 100 100 100
Cropping intensity (%) 109 118 113a+Rice is grown only during the wet (kharif) season among the sample households.bPerennial crops include betel nut, bamboo, tea, fruits, etc.
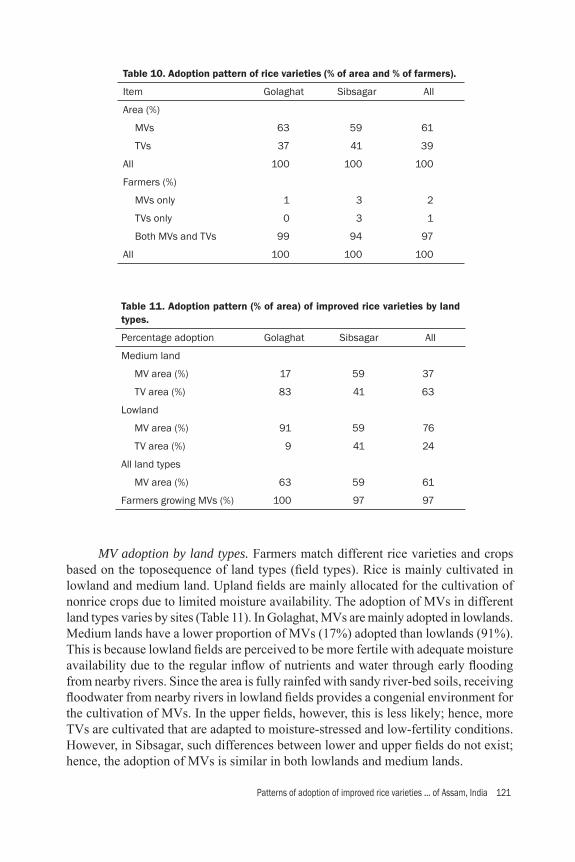
Patterns of adoption of improved rice varieties ... of Assam, India 121
MV adoption by land types. Farmers match different rice varieties and crops based on the toposequence of land types (fi eld types). Rice is mainly cultivated in lowland and medium land. Upland fi elds are mainly allocated for the cultivation of nonrice crops due to limited moisture availability. The adoption of MVs in different land types varies by sites (Table 11). In Golaghat, MVs are mainly adopted in lowlands. Medium lands have a lower proportion of MVs (17%) adopted than lowlands (91%). This is because lowland fi elds are perceived to be more fertile with adequate moisture availability due to the regular infl ow of nutrients and water through early fl ooding from nearby rivers. Since the area is fully rainfed with sandy river-bed soils, receiving fl oodwater from nearby rivers in lowland fi elds provides a congenial environment for the cultivation of MVs. In the upper fi elds, however, this is less likely; hence, more TVs are cultivated that are adapted to moisture-stressed and low-fertility conditions. However, in Sibsagar, such differences between lower and upper fi elds do not exist; hence, the adoption of MVs is similar in both lowlands and medium lands.
Table 10. Adoption pattern of rice varieties (% of area and % of farmers).
Item Golaghat Sibsagar All
Area (%)
MVs 63 59 61
TVs 37 41 39
All 100 100 100
Farmers (%)
MVs only 1 3 2
TVs only 0 3 1
Both MVs and TVs 99 94 97
All 100 100 100
Table 11. Adoption pattern (% of area) of improved rice varieties by land types.
Percentage adoption Golaghat Sibsagar All
Medium land
MV area (%) 17 59 37
TV area (%) 83 41 63
Lowland
MV area (%) 91 59 76
TV area (%) 9 41 24
All land types
MV area (%) 63 59 61
Farmers growing MVs (%) 100 97 97
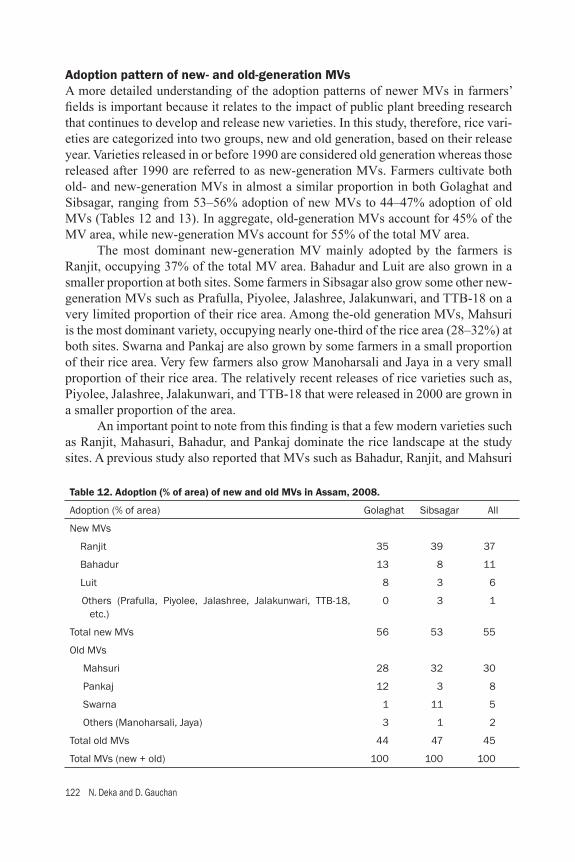
122 N. Deka and D. Gauchan
Adoption pattern of new- and old-generation MVsA more detailed understanding of the adoption patterns of newer MVs in farmers’ fi elds is important because it relates to the impact of public plant breeding research that continues to develop and release new varieties. In this study, therefore, rice vari-eties are categorized into two groups, new and old generation, based on their release year. Varieties released in or before 1990 are considered old generation whereas those released after 1990 are referred to as new-generation MVs. Farmers cultivate both old- and new-generation MVs in almost a similar proportion in both Golaghat and Sibsagar, ranging from 53–56% adoption of new MVs to 44–47% adoption of old MVs (Tables 12 and 13). In aggregate, old-generation MVs account for 45% of the MV area, while new-generation MVs account for 55% of the total MV area. The most dominant new-generation MV mainly adopted by the farmers is Ranjit, occupying 37% of the total MV area. Bahadur and Luit are also grown in a smaller proportion at both sites. Some farmers in Sibsagar also grow some other new-generation MVs such as Prafulla, Piyolee, Jalashree, Jalakunwari, and TTB-18 on a very limited proportion of their rice area. Among the-old generation MVs, Mahsuri is the most dominant variety, occupying nearly one-third of the rice area (28–32%) at both sites. Swarna and Pankaj are also grown by some farmers in a small proportion of their rice area. Very few farmers also grow Manoharsali and Jaya in a very small proportion of their rice area. The relatively recent releases of rice varieties such as, Piyolee, Jalashree, Jalakunwari, and TTB-18 that were released in 2000 are grown in a smaller proportion of the area. An important point to note from this fi nding is that a few modern varieties such as Ranjit, Mahasuri, Bahadur, and Pankaj dominate the rice landscape at the study sites. A previous study also reported that MVs such as Bahadur, Ranjit, and Mahsuri
Table 12. Adoption (% of area) of new and old MVs in Assam, 2008.
Adoption (% of area) Golaghat Sibsagar All
New MVs
Ranjit 35 39 37
Bahadur 13 8 11
Luit 8 3 6
Others (Prafulla, Piyolee, Jalashree, Jalakunwari, TTB-18, etc.)
0 3 1
Total new MVs 56 53 55
Old MVs
Mahsuri 28 32 30
Pankaj 12 3 8
Swarna 1 11 5
Others (Manoharsali, Jaya) 3 1 2
Total old MVs 44 47 45
Total MVs (new + old) 100 100 100
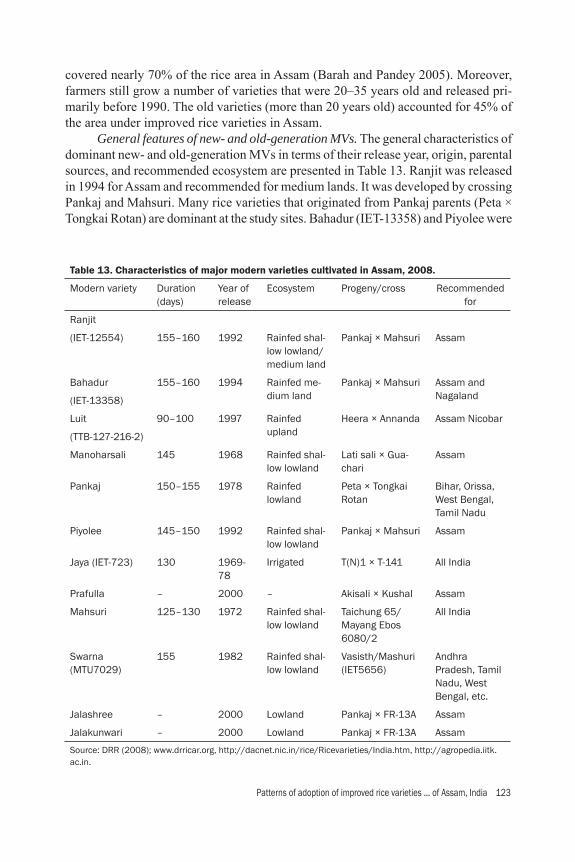
Patterns of adoption of improved rice varieties ... of Assam, India 123
covered nearly 70% of the rice area in Assam (Barah and Pandey 2005). Moreover, farmers still grow a number of varieties that were 20–35 years old and released pri-marily before 1990. The old varieties (more than 20 years old) accounted for 45% of the area under improved rice varieties in Assam. General features of new- and old-generation MVs. The general characteristics of dominant new- and old-generation MVs in terms of their release year, origin, parental sources, and recommended ecosystem are presented in Table 13. Ranjit was released in 1994 for Assam and recommended for medium lands. It was developed by crossing Pankaj and Mahsuri. Many rice varieties that originated from Pankaj parents (Peta × Tongkai Rotan) are dominant at the study sites. Bahadur (IET-13358) and Piyolee were
Table 13. Characteristics of major modern varieties cultivated in Assam, 2008.
Modern variety Duration (days)
Year ofrelease
Ecosystem Progeny/cross Recommended for
Ranjit
(IET-12554) 155–160 1992 Rainfed shal-low lowland/medium land
Pankaj × Mahsuri Assam
Bahadur 155–160 1994 Rainfed me-dium land
Pankaj × Mahsuri Assam and Nagaland(IET-13358)
Luit 90–100 1997 Rainfed upland
Heera × Annanda Assam Nicobar
(TTB-127-216-2)
Manoharsali 145 1968 Rainfed shal-low lowland
Lati sali × Gua-chari
Assam
Pankaj 150–155 1978 Rainfed lowland
Peta × Tongkai Rotan
Bihar, Orissa, West Bengal, Tamil Nadu
Piyolee 145–150 1992 Rainfed shal-low lowland
Pankaj × Mahsuri Assam
Jaya (IET-723) 130 1969-78
Irrigated T(N)1 × T-141 All India
Prafulla – 2000 – Akisali × Kushal Assam
Mahsuri 125–130 1972 Rainfed shal-low lowland
Taichung 65/Mayang Ebos 6080/2
All India
Swarna (MTU7029)
155 1982 Rainfed shal-low lowland
Vasisth/Mashuri (IET5656)
Andhra Pradesh, Tamil Nadu, West Bengal, etc.
Jalashree – 2000 Lowland Pankaj × FR-13A Assam
Jalakunwari – 2000 Lowland Pankaj × FR-13A Assam
Source: DRR (2008); www.drricar.org, http://dacnet.nic.in/rice/Ricevarieties/India.htm, http://agropedia.iitk.ac.in.

124 N. Deka and D. Gauchan
also developed from crosses of Pankaj and Mahsuri and hence they are sister lines of Ranjit. Luit (TTB-127-216-2) is a short-duration MV released in 1997 suited for medium and upland (bunded) fi elds. Jalashree and Jalakunwari are the newest among the new-generation MVs released in 2000 for Assam, particularly in submergence-prone environments. Both of these varieties have been bred for submergence-prone environments by crossing FR-13A (submergence-tolerant TVs from Orissa) with Pankaj. Mahsuri is a dominant very old variety originated in Malaysia. It was released in India in 1972 but is still popular in the study districts in Assam because of its good grain quality, straw yield, and adaptation to rainfed conditions. The other dominant old-generation rice varieties grown at the study sites are Swarna and Pankaj. Swarna was released by Andhra Pradesh in 1982 and many other states of India (West Ben-gal, Kerala, Karnataka, and Tamil Nadu). Similarly, Pankaj was released in 1978 for lowland conditions for many states such as Bihar, Orissa, Tamil Nadu, Kerala, and Karnataka. Swarna matures in 155 days with shorter plant height (95–100 cm), profuse tillering, white short bold grains, and seed dormancy. It is resistant to bacterial leaf blight (BLB) and suited to delayed planting. Most of the dominant MVs are longer duration except Luit, which is adapted to upland situations. The sources of origin for many of these MVs are India, IRRI, or neighboring Asian countries. Adoption of new and old MVs by land types. The adoption of new- and old-generation modern rice varieties varies by land types (fi eld toposequence) across the sites (Table 14). A varying proportion of both old- and new-generation MVs is grown in medium and lowland fi elds at both sites. A higher proportion of old-generation MVs persists in medium lands compared with lowlands. New-generation MVs are more dominant in lowlands at both Golaghat and Sibsagar sites. Ranjit and Bahadur are grown in both medium land and lowlands. Bahadur has a higher proportion of its area in lowlands, while Ranjit was dominant equally in both lowlands and medium lands but has a slighter higher proportion of area in lower lands. Swarna was found relatively more adopted in medium lands than in lowlands. As expected, Jalashree and Jalakunwari were found in lowland fi elds in a small proportion of rice area.
Table 14. Adoption pattern (% of area) of MVs by generation and land types.
Percentage adoption Golaghat Sibsagar All
Medium land
NewGen MVs (%) 40 39 39
OldGen MVs (%) 60 61 61
Lowland
NewGen MVs (%) 58 62 59
OldGen MVs (%) 42 38 41
All land types
NewGen MVs (%) 56 53 55
OldGen MVs (%) 44 47 45
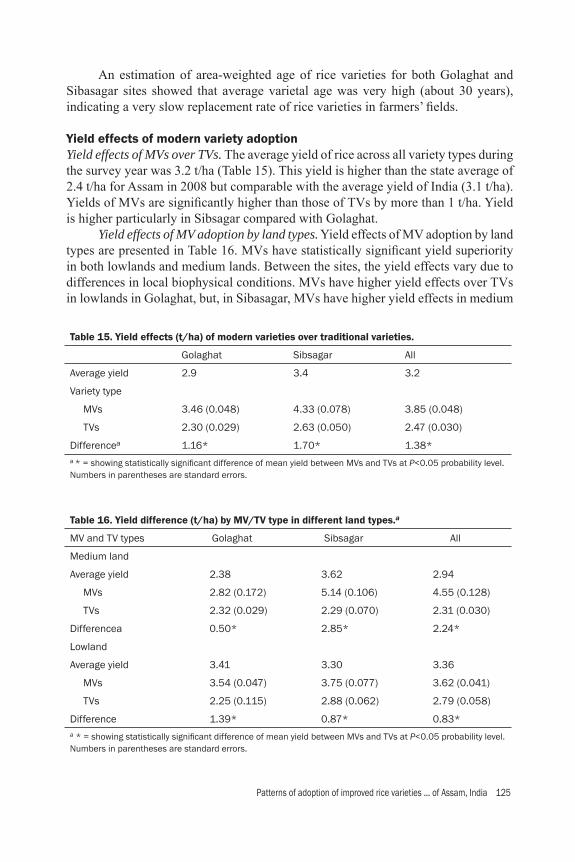
Patterns of adoption of improved rice varieties ... of Assam, India 125
An estimation of area-weighted age of rice varieties for both Golaghat and Sibasagar sites showed that average varietal age was very high (about 30 years), indicating a very slow replacement rate of rice varieties in farmers’ fi elds.
Yield effects of modern variety adoptionYield effects of MVs over TVs. The average yield of rice across all variety types during the survey year was 3.2 t/ha (Table 15). This yield is higher than the state average of 2.4 t/ha for Assam in 2008 but comparable with the average yield of India (3.1 t/ha). Yields of MVs are signifi cantly higher than those of TVs by more than 1 t/ha. Yield is higher particularly in Sibsagar compared with Golaghat. Yield effects of MV adoption by land types. Yield effects of MV adoption by land types are presented in Table 16. MVs have statistically signifi cant yield superiority in both lowlands and medium lands. Between the sites, the yield effects vary due to differences in local biophysical conditions. MVs have higher yield effects over TVs in lowlands in Golaghat, but, in Sibasagar, MVs have higher yield effects in medium
Table 15. Yield effects (t/ha) of modern varieties over traditional varieties.
Golaghat Sibsagar All
Average yield 2.9 3.4 3.2
Variety type
MVs 3.46 (0.048) 4.33 (0.078) 3.85 (0.048)
TVs 2.30 (0.029) 2.63 (0.050) 2.47 (0.030)
Differencea 1.16* 1.70* 1.38*a * = showing statistically signifi cant difference of mean yield between MVs and TVs at P<0.05 probability level. Numbers in parentheses are standard errors.
Table 16. Yield difference (t/ha) by MV/TV type in different land types.a
MV and TV types Golaghat Sibsagar All
Medium land
Average yield 2.38 3.62 2.94
MVs 2.82 (0.172) 5.14 (0.106) 4.55 (0.128)
TVs 2.32 (0.029) 2.29 (0.070) 2.31 (0.030)
Differencea 0.50* 2.85* 2.24*
Lowland
Average yield 3.41 3.30 3.36
MVs 3.54 (0.047) 3.75 (0.077) 3.62 (0.041)
TVs 2.25 (0.115) 2.88 (0.062) 2.79 (0.058)
Difference 1.39* 0.87* 0.83*a * = showing statistically signifi cant difference of mean yield between MVs and TVs at P<0.05 probability level. Numbers in parentheses are standard errors.
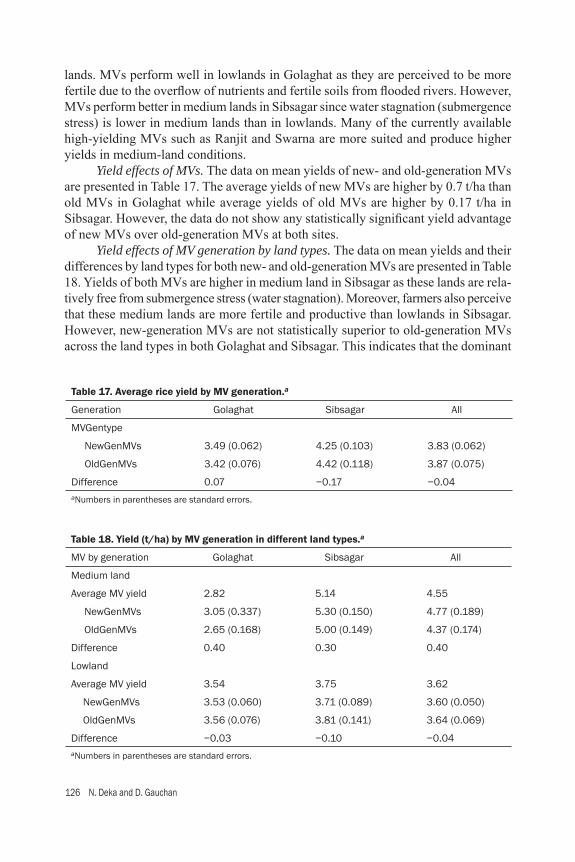
126 N. Deka and D. Gauchan
lands. MVs perform well in lowlands in Golaghat as they are perceived to be more fertile due to the overfl ow of nutrients and fertile soils from fl ooded rivers. However, MVs perform better in medium lands in Sibsagar since water stagnation (submergence stress) is lower in medium lands than in lowlands. Many of the currently available high-yielding MVs such as Ranjit and Swarna are more suited and produce higher yields in medium-land conditions. Yield effects of MVs. The data on mean yields of new- and old-generation MVs are presented in Table 17. The average yields of new MVs are higher by 0.7 t/ha than old MVs in Golaghat while average yields of old MVs are higher by 0.17 t/ha in Sibsagar. However, the data do not show any statistically signifi cant yield advantage of new MVs over old-generation MVs at both sites. Yield effects of MV generation by land types. The data on mean yields and their differences by land types for both new- and old-generation MVs are presented in Table 18. Yields of both MVs are higher in medium land in Sibsagar as these lands are rela-tively free from submergence stress (water stagnation). Moreover, farmers also perceive that these medium lands are more fertile and productive than lowlands in Sibsagar. However, new-generation MVs are not statistically superior to old-generation MVs across the land types in both Golaghat and Sibsagar. This indicates that the dominant
Table 17. Average rice yield by MV generation.a
Generation Golaghat Sibsagar All
MVGentype
NewGenMVs 3.49 (0.062) 4.25 (0.103) 3.83 (0.062)
OldGenMVs 3.42 (0.076) 4.42 (0.118) 3.87 (0.075)
Difference 0.07 −0.17 −0.04aNumbers in parentheses are standard errors.
Table 18. Yield (t/ha) by MV generation in different land types.a
MV by generation Golaghat Sibsagar All
Medium land
Average MV yield 2.82 5.14 4.55
NewGenMVs 3.05 (0.337) 5.30 (0.150) 4.77 (0.189)
OldGenMVs 2.65 (0.168) 5.00 (0.149) 4.37 (0.174)
Difference 0.40 0.30 0.40
Lowland
Average MV yield 3.54 3.75 3.62
NewGenMVs 3.53 (0.060) 3.71 (0.089) 3.60 (0.050)
OldGenMVs 3.56 (0.076) 3.81 (0.141) 3.64 (0.069)
Difference −0.03 −0.10 −0.04aNumbers in parentheses are standard errors.

Patterns of adoption of improved rice varieties ... of Assam, India 127
new-generation MVs such as Ranjit, Bahadur, and Luit have specifi c adaptation but may not perform as well as MVs such as Mahasuri, Pankaj, and Swarna across loca-tions. Dominant new and old modern rice varieties and their productivity. The major rice varieties with their average yields are presented in Table 19. The important im-proved rice varieties grown at both study sites are Ranjit, Bahadur, and Luit that are released after 1990 (new MVs) and Mahsuri, Pankaj, and Swarna (MTU-7029) that are released before 1990 (old MVs). Ranjit and Mahsuri are the two most dominant old and new MVs adopted by the farmers in 37% and 30% of the MV rice area, re-spectively. Bahadur and Pankaj occupy 11% and 8% of the area, respectively. Luit and Swarna are grown on a very small proportion of the MV area. A majority of the MVs have about 3 t/ha of rice yield. Among the MVs, Swarna and Ranjit have higher yield (with above 4.0 t/ha) in Sibsagar than in Golaghat and are statistically signifi cant. These yields of MVs at the study sites are relatively higher than the average of eastern India and all India average yield of 3.0 t/ha. Farmers’ perceptions and reasons for growing new and old MVs. Farmers have provided their perceptions on the traits of specifi c new- and old-generation rice variet-ies. The perceptions on the major traits of dominant new (Ranjit, Bahadur, and Luit) and old (Mahsuri, Pankaj, and Swarna) varieties are presented in Table 20. Farmers expressed preference for specifi c modern rice varieties for traits such as high yield, resistance to lodging, good cooking and grain quality, higher market price, tolerance of diseases, pests, and abiotic stresses, and other positive traits such as straw yield, quality, maturity, and adaptability. Most of the farmers responded that high yield, good taste (eating quality), and a good market price are their most preferred traits for adop-tion. New rice varieties are mainly preferred for their higher stable yield, tolerance of pests and diseases, and many other desirable traits such as good taste, maturity period, and vegetative growth.
Table 19. Area (%) of total MV area and yield (t/ha) by major new and old MVs.a
Rice varieties Golaghat Sibsagar All
% area Yield % area Yielda % area Yield
MVs
New MVs
Ranjit 35 3.54 39 4.61* 37 4.01
Bahadur 13 3.41 8 3.44 11 3.42
Luit 8 3.49 3 3.26 6 3.43
Old MVs
Mahsuri 28 3.51 33 4.36 30 3.85
Swarna 1 3.33 11 5.26* 5 5.19
Pankaj 12 3.51 3 3.29 8 3.47aThe area (%) under specifi c new and old MVs is from the total MV rice area. * indicates statistically signifi cant yield superiority of the varieties between the sites.

128 N. Deka and D. Gauchan
Farmers continue to cultivate older generation MVs such as Mahsuri, Pankaj, and Swarna at the study sites owing to their superior preferred traits such as high yield (Ranjit, Swarna, Mahsuri) and better taste or eating quality (Mahsuri and Ranjit). Mahsuri still occupies about 30% of the rice area at the study sites due to its farmer-preferred grain quality, and it is productive under low-input conditions in addition to its taller plant height that can withstand water up to 70 cm. However, this variety is susceptible to pests and diseases.
Determinants of the adoption of new MVs: econometric analysisThe factors affecting the adoption of new MVs were analyzed using probit and tobit models as described earlier (see Chapter 2 for details). The results of both the probit and tobit estimation (Table 21) indicate that fa-vorable land type (endowment of lowland fi elds) is an important factor determining the adoption decisions of the households as indicated by statistical signifi cance. The probability and the rate of adoption are higher if a farmer has a higher proportion of lowland fi elds. In many fi elds of Golaghat in Assam, farmers’ endowment of lowland is critical as rice could be transplanted only after receiving fl oodwater from a nearby river. In the upper fi elds, it is less likely to get adequate water. In addition, the farm size variable in the tobit model also showed signifi cance, but with a negative sign, indicating that larger farmers are less likely to adopt new-generation MVs. Smaller farmers may likely adopt new-generation MVs, probably because they are likely to be more motivated in searching for new technology due to their subsistence pressure and they may be willing to accept newer varieties in their changing circumstances. This fi nding is supported by earlier studies in many parts of Asia (David and Otsuka 1994, Hossain et al 2006).
Table 20. Perceived reasons for adoption by farmers (%) for new and old MVs.
Reasons for adoption (% of farmers)
New-generation MVs Old-generation MVs
Bahadur Luit Ranjit Mahsuri Pankaj Swarna
Desirable traitsa
1. High yield 34 50 27 27 33 36
2. Resistance to lodging 1 0 0 0 0 0
3. Good taste 27 0 23 23 30 14
4. Good market price 4 0 23 24 3 13
5. Other positive traits
(grain quality, straw yield,
adaptability, maturity) 35 50 27 26 33 36aThe information presented in the table is percent responses and is given only by the farmer who grows that particular variety during the survey year. A farmer has multiple responses for more than one desirable and undesirable trait.
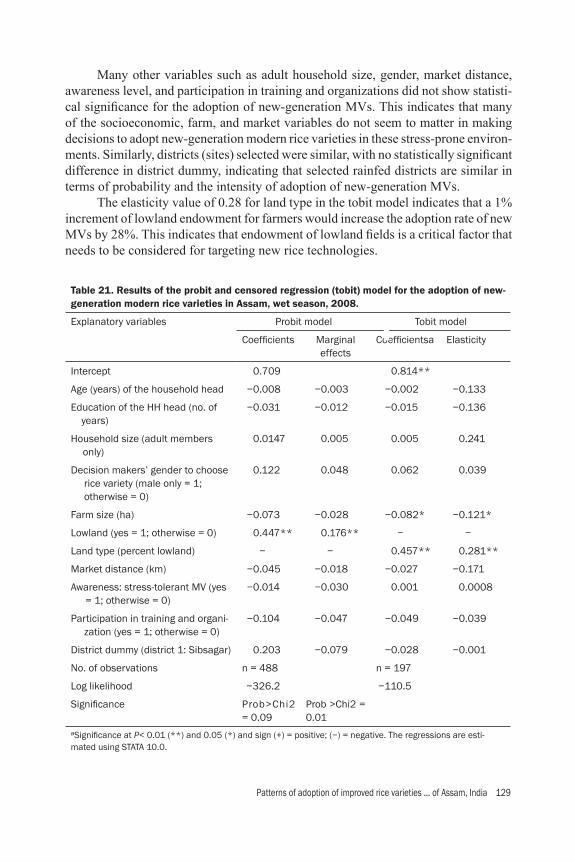
Patterns of adoption of improved rice varieties ... of Assam, India 129
Many other variables such as adult household size, gender, market distance, awareness level, and participation in training and organizations did not show statisti-cal signifi cance for the adoption of new-generation MVs. This indicates that many of the socioeconomic, farm, and market variables do not seem to matter in making decisions to adopt new-generation modern rice varieties in these stress-prone environ-ments. Similarly, districts (sites) selected were similar, with no statistically signifi cant difference in district dummy, indicating that selected rainfed districts are similar in terms of probability and the intensity of adoption of new-generation MVs. The elasticity value of 0.28 for land type in the tobit model indicates that a 1% increment of lowland endowment for farmers would increase the adoption rate of new MVs by 28%. This indicates that endowment of lowland fi elds is a critical factor that needs to be considered for targeting new rice technologies.
Table 21. Results of the probit and censored regression (tobit) model for the adoption of new-generation modern rice varieties in Assam, wet season, 2008.
Explanatory variables Probit model Tobit model
Coeffi cients Marginal effects
Coeffi cientsa Elasticity
Intercept 0.709 0.814**
Age (years) of the household head −0.008 −0.003 −0.002 −0.133
Education of the HH head (no. of years)
−0.031 −0.012 −0.015 −0.136
Household size (adult members only)
0.0147 0.005 0.005 0.241
Decision makers’ gender to choose rice variety (male only = 1; otherwise = 0)
0.122 0.048 0.062 0.039
Farm size (ha) −0.073 −0.028 −0.082* −0.121*
Lowland (yes = 1; otherwise = 0) 0.447** 0.176** − −
Land type (percent lowland) − − 0.457** 0.281**
Market distance (km) −0.045 −0.018 −0.027 −0.171
Awareness: stress-tolerant MV (yes = 1; otherwise = 0)
−0.014 −0.030 0.001 0.0008
Participation in training and organi-zation (yes = 1; otherwise = 0)
−0.104 −0.047 −0.049 −0.039
District dummy (district 1: Sibsagar) 0.203 −0.079 −0.028 −0.001
No. of observations n = 488 n = 197
Log likelihood −326.2 −110.5
Signifi cance Prob>Chi2 = 0.09
Prob >Chi2 = 0.01
aSignifi cance at P< 0.01 (**) and 0.05 (*) and sign (+) = positive; (−) = negative. The regressions are esti-mated using STATA 10.0.

130 N. Deka and D. Gauchan
Economics of rice production and household economyInput use and costs and returns in rice production. The important inputs used in rice production are seeds, chemical fertilizers, organic fertilizer (FYM/compost), labor, and animal power (Table 22). Very few farmers use tractors for land preparation and threshing. The use of pesticides (insecticides, fungicides) in controlling diseases, pests, and weeds is also limited. Irrigation source is limited and is mainly used by a few farmers for supplemental purposes during a moisture-scarcity period. The different types of inputs used are briefl y outlined below. Seed use is similar for both Golaghat and Sibsagar, and ranges from 65 to 68 kg per hectare. Farmers use a limited proportion of chemical fertilizers (N, P, and K). Urea, SSP (single superphosphate), and muriate of potash (MOP) are commonly used chemical fertilizers at the study sites. A few farmers also use DAP (diammonium phosphate). The average use of fertilizer in N form is 8–9 kg/ha, P form is 3–8 kg/ha, and K is 3–4 kg/ha. This amount is very low compared with the national (Indian) average use of 78, 27, and 7 kg N, P, and K per ha, respectively, in 2008-09 (indiastat.com). Since crop cultivation in the wet season faces natural risks such as fl oods, the use of chemical fertilizers at the study sites has been low. Farmyard manure (FYM) and compost are the commonly used organic manures, which are used in a fairly low amount of 0.3 t/ha. Average human labor use (person-days/ha) is low at the study sites, ranging from 73 to 87 days per hectare. The use of animal labor (bullocks) is also low and similar at both sites, with an average of 13 animal pair days per hectare. Animals (bullocks) are mainly used for land preparation (e.g., plowing and leveling fi elds) and threshing to separate grains out of straw. The use of mechanical power is very much limited and found only at Sibsagar site.
Table 22. Input use in rice production for wet-season rice.a
Inputs Golaghat Sibsagar All
Seeds (kg/ha) 65 68 67
Fertilizer (kg/ha)
N 8.0 9.4 8.7
P 2.8 4.1 3.4
K 5.7 7.5 6.6
Organic fertilizer (manure) (kg/ha) 258 253 256
Labor (days/ha) 73 87 80
Power
Animal power (days/ha) 12 14 13
Tractor use (hours/ha) 0 0.2 0.1aThe P and K are in the element form (they are derived from conversion of P2O5 and K2O using 0.83 for P2O5 and 0.44 for K2O).

Patterns of adoption of improved rice varieties ... of Assam, India 131
Labor use in different rice production activities. Human labor is used in all rice production activities from land preparation to harvesting and postharvest activities (Table 23). Farmers use more labor per hectare for land preparation, crop establish-ment, and harvesting, including threshing activities. The total labor use per ha is lower in Golaghat than in Sibsagar, even though farmers at both sites use contract labor in various rice production activities. They use contract labor mainly for land preparation, crop establishment, harvesting, and threshing. Costs and returns in rice production. The costs of cultivation and returns were calculated separately for modern and traditional varieties from the largest parcel (intensive data plots). Both the paid-out (cash) cost of material inputs and imputed value of family-owned inputs were estimated separately. Family-owned resources were valued at prevailing market prices because the estimation of shadow prices for various components was more diffi cult. Analysis of costs and returns in rice produc-tion across sites revealed that rice is a profi table crop at the sites, with an average of Rs 29.5 thousand (US$633) of returns above cash costs per hectare (Table 24). Net returns from rice production were profi table even after accounting for noncash costs (imputed value of family-owned resources). Farmers in Sibsagar received relatively higher value of grain (Rs 39,050 or $835/ha) compared with farmers in Golaghat (Rs 29,619 or $636/ha). The value of rice straw also accounts for a 4% share in the total returns. Cash (paid-out) costs account for more than half of the costs at both sites. Farmers in Sibsagar obtain both higher net returns and returns above cash costs because they obtain higher rice yield (4.4 t/ha).
Table 23. Labor use (days/ha) in rice production activities, wet season, 2008.
Labor use Golaghat Sibsagar All
Land preparation 13.4 14.5 13.9
Crop establishment 15.0 17.3 16.2
Application of organic fertilizer 3.0 3.8 3.4
Application of chemical fertilizer 2.4 3.4 2.9
Application of pesticide 0 0.2 0.1
Weeding 2.8 4.6 3.7
Irrigation 0 0.5 0.3
Harvesting 15.6 18.6 17.1
Threshing 11.8 13.0 12.4
Postharvest activity 8.8 10.8 9.8
Total 73.0 87.0 80.0aBoth the study sites use contract labor in rice production, which is not included in the total labor use but accounted for in the cost of production.
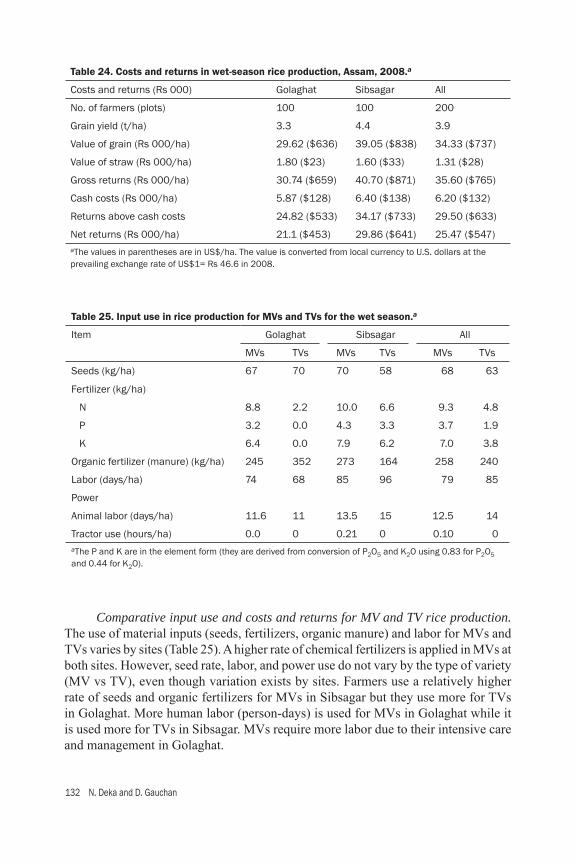
132 N. Deka and D. Gauchan
Comparative input use and costs and returns for MV and TV rice production. The use of material inputs (seeds, fertilizers, organic manure) and labor for MVs and TVs varies by sites (Table 25). A higher rate of chemical fertilizers is applied in MVs at both sites. However, seed rate, labor, and power use do not vary by the type of variety (MV vs TV), even though variation exists by sites. Farmers use a relatively higher rate of seeds and organic fertilizers for MVs in Sibsagar but they use more for TVs in Golaghat. More human labor (person-days) is used for MVs in Golaghat while it is used more for TVs in Sibsagar. MVs require more labor due to their intensive care and management in Golaghat.
Table 24. Costs and returns in wet-season rice production, Assam, 2008.a
Costs and returns (Rs 000) Golaghat Sibsagar All
No. of farmers (plots) 100 100 200
Grain yield (t/ha) 3.3 4.4 3.9
Value of grain (Rs 000/ha) 29.62 ($636) 39.05 ($838) 34.33 ($737)
Value of straw (Rs 000/ha) 1.80 ($23) 1.60 ($33) 1.31 ($28)
Gross returns (Rs 000/ha) 30.74 ($659) 40.70 ($871) 35.60 ($765)
Cash costs (Rs 000/ha) 5.87 ($128) 6.40 ($138) 6.20 ($132)
Returns above cash costs 24.82 ($533) 34.17 ($733) 29.50 ($633)
Net returns (Rs 000/ha) 21.1 ($453) 29.86 ($641) 25.47 ($547)aThe values in parentheses are in US$/ha. The value is converted from local currency to U.S. dollars at the prevailing exchange rate of US$1= Rs 46.6 in 2008.
Table 25. Input use in rice production for MVs and TVs for the wet season.a
Item Golaghat Sibsagar All
MVs TVs MVs TVs MVs TVs
Seeds (kg/ha) 67 70 70 58 68 63
Fertilizer (kg/ha)
N 8.8 2.2 10.0 6.6 9.3 4.8
P 3.2 0.0 4.3 3.3 3.7 1.9
K 6.4 0.0 7.9 6.2 7.0 3.8
Organic fertilizer (manure) (kg/ha) 245 352 273 164 258 240
Labor (days/ha) 74 68 85 96 79 85
Power
Animal labor (days/ha) 11.6 11 13.5 15 12.5 14
Tractor use (hours/ha) 0.0 0 0.21 0 0.10 0aThe P and K are in the element form (they are derived from conversion of P2O5 and K2O using 0.83 for P2O5 and 0.44 for K2O).
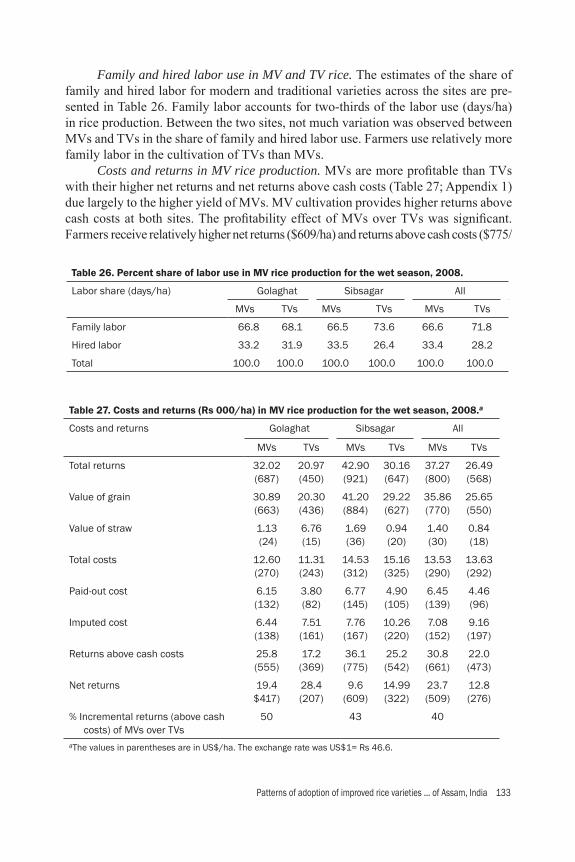
Patterns of adoption of improved rice varieties ... of Assam, India 133
Family and hired labor use in MV and TV rice. The estimates of the share of family and hired labor for modern and traditional varieties across the sites are pre-sented in Table 26. Family labor accounts for two-thirds of the labor use (days/ha) in rice production. Between the two sites, not much variation was observed between MVs and TVs in the share of family and hired labor use. Farmers use relatively more family labor in the cultivation of TVs than MVs. Costs and returns in MV rice production. MVs are more profi table than TVs with their higher net returns and net returns above cash costs (Table 27; Appendix 1) due largely to the higher yield of MVs. MV cultivation provides higher returns above cash costs at both sites. The profi tability effect of MVs over TVs was signifi cant. Farmers receive relatively higher net returns ($609/ha) and returns above cash costs ($775/
Table 27. Costs and returns (Rs 000/ha) in MV rice production for the wet season, 2008.a
Costs and returns Golaghat Sibsagar All
MVs TVs MVs TVs MVs TVs
Total returns 32.02(687)
20.97(450)
42.90(921)
30.16(647)
37.27(800)
26.49(568)
Value of grain 30.89(663)
20.30(436)
41.20(884)
29.22(627)
35.86(770)
25.65(550)
Value of straw 1.13 (24)
6.76(15)
1.69(36)
0.94(20)
1.40(30)
0.84(18)
Total costs 12.60(270)
11.31(243)
14.53(312)
15.16(325)
13.53 (290)
13.63(292)
Paid-out cost 6.15 (132)
3.80 (82)
6.77 (145)
4.90 (105)
6.45 (139)
4.46 (96)
Imputed cost 6.44 (138)
7.51 (161)
7.76 (167)
10.26 (220)
7.08 (152)
9.16 (197)
Returns above cash costs 25.8 (555)
17.2 (369)
36.1 (775)
25.2 (542)
30.8 (661)
22.0 (473)
Net returns 19.4 $417)
28.4 (207)
9.6 (609)
14.99 (322)
23.7 (509)
12.8 (276)
% Incremental returns (above cash costs) of MVs over TVs
50 43 40
aThe values in parentheses are in US$/ha. The exchange rate was US$1= Rs 46.6.
Table 26. Percent share of labor use in MV rice production for the wet season, 2008.
Labor share (days/ha) Golaghat Sibsagar All
MVs TVs MVs TVs MVs TVs
Family labor 66.8 68.1 66.5 73.6 66.6 71.8
Hired labor 33.2 31.9 33.5 26.4 33.4 28.2
Total 100.0 100.0 100.0 100.0 100.0 100.0

134 N. Deka and D. Gauchan
ha) from MV rice production in Sibsagar compared with Golaghat. MVs use higher cash costs (Appendix 2). Total costs for MVs are higher in Golaghat but farmers in Sibsagar incur higher total costs for TVs. Imputed costs are relatively higher for TVs than for MVs at both sites. The value of grain and straw constitutes the major return for rice farming. Cultivation of MVs provides relatively higher (40%) incremental returns (returns above cash costs) aggregate of both sites. Farmers in Golaghat and Sibsagar receive about 53% and 42% higher incremental returns, respectively, by growing MV rice. Factor shares in the cost of production for MVs. The share of each input in total costs for both MVs and TVs is briefl y outlined below and presented in Table 28 and details in Appendix 2.
• Seed costs Seed costs account for 7–11% of the total cost of production. Farmers
normally do not incur any cash costs in TVs as they are home produced. The cash costs are mainly for MVs, which are purchased in local markets or from neighbors.
• Fertilizers and other agrochemicals The share of the costs of chemical fertilizer in total costs is 2.7–3.1% and
0.8–2.6% for MVs and TVs, respectively, at the sites. Pesticides and other agrochemicals do not account for any costs, particularly in Golaghat. A very negligible amount of insecticide use cost was found for MVs in Sibsagar.
• Cost of organic fertilizers Organic fertilizer costs account for only a small proportion (2–6%) of the total
costs at the study sites. Farmers mainly use organic fertilizers from their own farms; hence, they incur no cash costs for them.
• Labor costsLabor costs account for the largest share of total costs in rice production at both sites. About two-thirds of the total costs in rice production are accounted for by labor alone (see Table 28; Appendix 2). Among the type of labor costs, the share of family labor costs is higher for both MVs and TVs than for hired and
Table 28. Share (%) of different inputs in total cost in MV rice production.
Type of input cost Golaghat Sibsagar All
MVs TVs MVs TVs MVs TVs
Seeds 10.5 10.8 9.0 6.9 9.7 8.2
Chemical fertilizer 2.7 0.8 3.1 2.6 2.9 2.0
Organic fertilizer 3.7 5.9 3.7 1.9 3.7 3.2
Pesticide 0 0 0.5 0 0.2 0
Labor 72.6 72.2 72.3 76.2 72.5 74.9
Animal power 9.2 10 9.3 10.3 9.2 10.5
Mechanical power (tractor, threshers) 1.2 0.4 2.2 2.2 1.7 1.6
Total 100.0 100.0 100.0 100.0 100.0 100.0
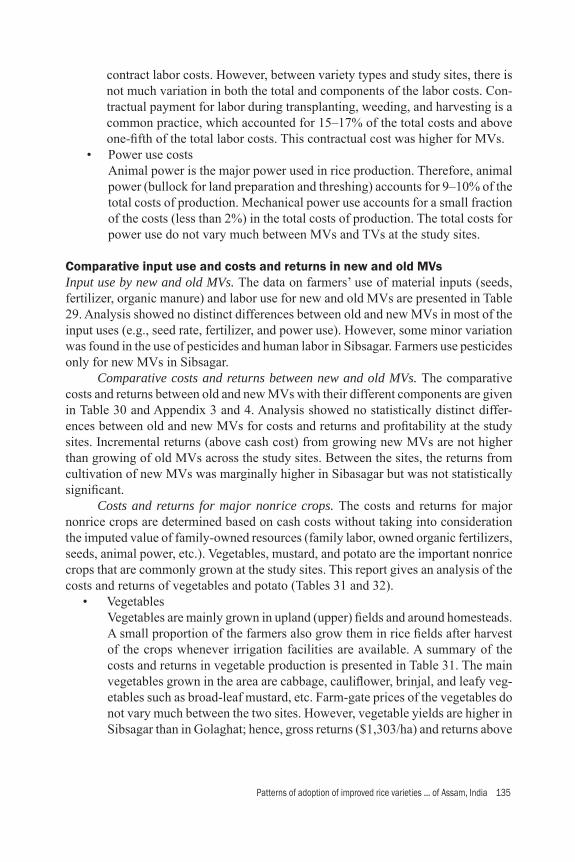
Patterns of adoption of improved rice varieties ... of Assam, India 135
contract labor costs. However, between variety types and study sites, there is not much variation in both the total and components of the labor costs. Con-tractual payment for labor during transplanting, weeding, and harvesting is a common practice, which accounted for 15–17% of the total costs and above one-fi fth of the total labor costs. This contractual cost was higher for MVs.
• Power use costsAnimal power is the major power used in rice production. Therefore, animal power (bullock for land preparation and threshing) accounts for 9–10% of the total costs of production. Mechanical power use accounts for a small fraction of the costs (less than 2%) in the total costs of production. The total costs for power use do not vary much between MVs and TVs at the study sites.
Comparative input use and costs and returns in new and old MVsInput use by new and old MVs. The data on farmers’ use of material inputs (seeds, fertilizer, organic manure) and labor use for new and old MVs are presented in Table 29. Analysis showed no distinct differences between old and new MVs in most of the input uses (e.g., seed rate, fertilizer, and power use). However, some minor variation was found in the use of pesticides and human labor in Sibsagar. Farmers use pesticides only for new MVs in Sibsagar. Comparative costs and returns between new and old MVs. The comparative costs and returns between old and new MVs with their different components are given in Table 30 and Appendix 3 and 4. Analysis showed no statistically distinct differ-ences between old and new MVs for costs and returns and profi tability at the study sites. Incremental returns (above cash cost) from growing new MVs are not higher than growing of old MVs across the study sites. Between the sites, the returns from cultivation of new MVs was marginally higher in Sibasagar but was not statistically signifi cant. Costs and returns for major nonrice crops. The costs and returns for major nonrice crops are determined based on cash costs without taking into consideration the imputed value of family-owned resources (family labor, owned organic fertilizers, seeds, animal power, etc.). Vegetables, mustard, and potato are the important nonrice crops that are commonly grown at the study sites. This report gives an analysis of the costs and returns of vegetables and potato (Tables 31 and 32).
• VegetablesVegetables are mainly grown in upland (upper) fi elds and around homesteads. A small proportion of the farmers also grow them in rice fi elds after harvest of the crops whenever irrigation facilities are available. A summary of the costs and returns in vegetable production is presented in Table 31. The main vegetables grown in the area are cabbage, caulifl ower, brinjal, and leafy veg-etables such as broad-leaf mustard, etc. Farm-gate prices of the vegetables do not vary much between the two sites. However, vegetable yields are higher in Sibsagar than in Golaghat; hence, gross returns ($1,303/ha) and returns above
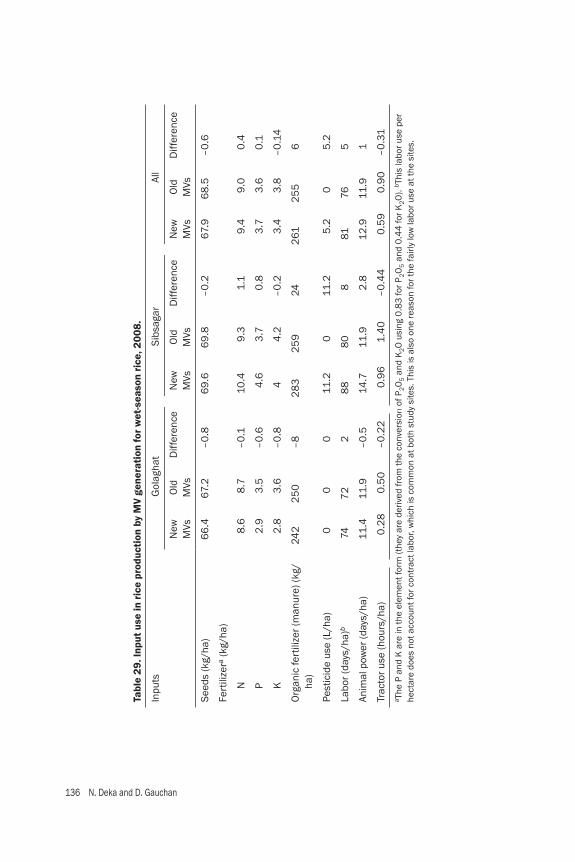
136 N. Deka and D. Gauchan
Tabl
e 29
. Inp
ut u
se in
ric
e pr
oduc
tion
by
MV
gene
rati
on fo
r w
et-s
easo
n ri
ce, 2
008.
Inpu
tsG
olag
hat
Sibs
agar
All
New
M
VsO
ld
MVs
Diff
eren
ceN
ew
MVs
Old
M
VsD
iffer
ence
New
M
VsO
ld
MVs
Diff
eren
ce
Seed
s (k
g/ha
)6
6.4
67.
2–
0.8
69
.66
9.8
–0
.26
7.9
68
.5–
0.6
Fert
ilize
ra (k
g/ha
)
N8
.68
.7–
0.1
10.4
9.3
1.1
9.4
9.0
0.4
P2
.93
.5–
0.6
4.6
3.7
0.8
3.7
3.6
0.1
K2
.83
.6–
0.8
44
.2–
0.2
3.4
3.8
–0
.14
Org
anic
fert
ilize
r (m
anur
e) (k
g/ha
)24
22
50
–8
28
32
59
242
612
55
6
Pest
icid
e us
e (L
/ha)
00
011
.20
11.2
5.2
05
.2
Labo
r (da
ys/h
a)b
747
22
88
80
881
765
Anim
al p
ower
(day
s/ha
)11
.411
.9–
0.5
14.7
11.9
2.8
12
.911
.91
Trac
tor u
se (h
ours
/ha)
0.2
80
.50
–0
.22
0.9
61.
40
–0
.44
0.5
90
.90
–0
.31
a The
P a
nd K
are
in th
e el
emen
t for
m (t
hey
are
deriv
ed fr
om th
e co
nver
sion
of P
2O
5 a
nd K
2O
usi
ng 0
.83
for P
2O
5 a
nd 0
.44
for K
2O
). b T
his
labo
r use
per
he
ctar
e do
es n
ot a
ccou
nt fo
r con
trac
t lab
or, w
hich
is c
omm
on a
t bot
h st
udy
site
s. T
his
is a
lso
one
reas
on fo
r the
fairl
y lo
w la
bor u
se a
t the
site
s.
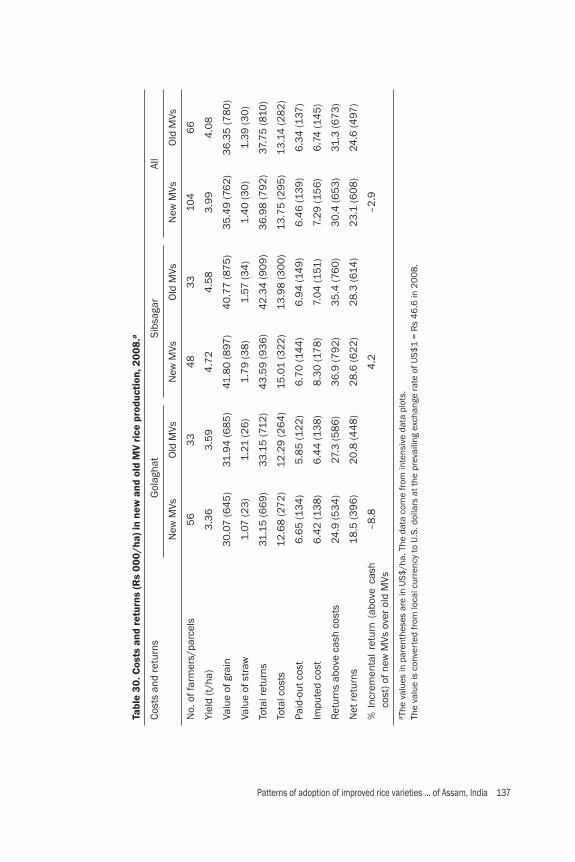
Patterns of adoption of improved rice varieties ... of Assam, India 137
Tabl
e 30
. Cos
ts a
nd r
etur
ns (R
s 00
0/ha
) in
new
and
old
MV
rice
pro
duct
ion,
200
8.a
Cost
s an
d re
turn
sG
olag
hat
Sibs
agar
All
New
MVs
Old
MVs
New
MVs
Old
MVs
New
MVs
Old
MVs
No.
of f
arm
ers/
parc
els
5
63
34
83
310
46
6
Yiel
d (t
/ha)
3.3
63
.59
4.7
24
.58
3.9
94
.08
Valu
e of
gra
in
30
.07
(64
5)
31.9
4 (6
85
)41
.80
(897
)4
0.7
7 (8
75
)3
5.4
9 (7
62
)3
6.3
5 (7
80
)
Valu
e of
str
aw1.
07 (2
3)
1.21
(26
)1.
79
(38
)1.
57 (3
4)
1.4
0 (3
0)
1.3
9 (3
0)
Tota
l ret
urns
31.1
5 (6
69
)3
3.1
5 (7
12
)4
3.5
9 (9
36
)4
2.3
4 (9
09
)3
6.9
8 (7
92
)37
.75
(810
)
Tota
l cos
ts1
2.6
8 (2
72
)1
2.2
9 (2
64
)15
.01
(32
2)
13.9
8 (3
00
)13
.75
(29
5)
13.1
4 (2
82
)
Paid
-out
cos
t6
.65
(13
4)
5.8
5 (1
22
)6
.70
(14
4)
6.9
4 (1
49
)6
.46
(13
9)
6.3
4 (1
37)
Impu
ted
cost
6.4
2 (1
38
)6
.44
(13
8)
8.3
0 (1
78
)7.
04
(151
)7.
29
(15
6)
6.7
4 (1
45
)
Ret
urns
abo
ve c
ash
cost
s24
.9 (5
34
)27
.3 (5
86
)3
6.9
(79
2)
35
.4 (7
60
)3
0.4
(65
3)
31.3
(67
3)
Net
retu
rns
18.5
(39
6)
20
.8 (4
48
)2
8.6
(62
2)
28
.3 (6
14)
23
.1 (6
08
)24
.6 (4
97)
% I
ncre
men
tal
retu
rn (
abov
e ca
sh
cost
) of n
ew M
Vs o
ver o
ld M
Vs–
8.8
4.2
–2
.9
a The
val
ues
in p
aren
thes
es a
re in
US$
/ha.
The
dat
a co
me
from
inte
nsiv
e da
ta p
lots
.Th
e va
lue
is c
onve
rted
from
loca
l cur
renc
y to
U.S
. dol
lars
at t
he p
reva
iling
exc
hang
e ra
te o
f US$
1 =
Rs
46
.6 in
20
08
.

138 N. Deka and D. Gauchan
Table 31. Costs and returns for vegetables in Assam.a
Costs and returns for vegetables
Golaghat Sibsagar All
Area (ha) 0.53 0.55 0.55
Yield (t/ha) 4.96 6.10 5.73
Price (Rs/ha) 10.1 (0.22) 9.9 (0.22) 10 (0.22)
Gross returns (Rs 000/ha)
50.01 (1,074) 60.74 (1,303) 57.26 (1,228)
Total cash costs (Rs 000/ha)
0.81 (17) 1.71 (37) 1.42 (30)
Returns above cash costs (Rs 000/ha)
49.26 (1,057) 59.02 (1,267) 55.85 (1,198)
aExchange rate: US$1= Rs 46.6 in 2008. The values in parentheses are in US$/ha.
Table 32. Costs and returns for potato at the study sites, Assam.a
Costs and returns for potato
Golaghat Sibsagar All
Area (ha) 0.36 0.20 0.32
Yield (t/ha) 5.94 4.13 5.42
Price (Rs/ha) 10.4 (0.23) 10.0 (0.22) 10.3 (0.22)
Gross returns (Rs 000/ha)
61.50 (1,320) 41.31 (887) 56.03 (1,202)
Total cash costs (Rs 000/ha)
0.71 (15) 2.08 (45) 1.10 (24)
Returns above cash costs (Rs 000/ha)
60.79 (1,304) 39.23 (842) 54.92 (1,179)
aExchange rate: US$1= Rs 46.6 in 2008. The values in parentheses are in US$/ha.
variable costs ($1,267/ha) are higher in Sibsagar. The average cash costs for vegetables are very low ($30/ha) as a limited amount of hired labor, machinery, and fertilizer is used for vegetable production.
• PotatoFarmers at the study site choose to grow a small portion of the farm area for potato in the homestead and upper fi elds (uplands) after the harvest of rice (winter crop). A summary of the costs and returns in potato production is given in Table 32. The cash cost for potato is very low and the gross returns are fairly high, particularly in Golaghat (Rs 61,505/ha or $1,320/ha). The average returns above cash costs for vegetables in Golaghat are also relatively high ($1,304/ha). The higher gross returns and net returns in Golaghat are due to farmers’ attainment of higher yield. Farm-gate prices of vegetables do not vary much by site.

Patterns of adoption of improved rice varieties ... of Assam, India 139
Rice production, consumption, and other usesRice is an important staple crop of the farmers at the study sites, as most of the sample households (99%) produce rice for their livelihood needs (Table 33). More than two-thirds of the produce (64–69%) is consumed in the household. A large proportion of the households (79–96%) sell part of their surplus production to meet livelihood and household expenditure needs. Farmers sell about one-fourth of the produce (24%) in the market to meet their expenditure needs. Aside from household consumption and market sales, rice is also used as seed, feed, and for other various uses (e.g., paying for farm labor, gifts to relatives and friends, etc.). Households use the bulk of rice for consumption purposes. The per capita con-sumption of milled rice is estimated to be on average 180 kg (278 kg rough rice). This is higher than the national average per capita consumption of about 71 kg of milled rice for India (FAOSTAT 2009).
Structure and sources of household incomeThe sample farmers are engaged in a multiple set of farm, off-farm, and nonfarm ac-tivities and they derive their household income from these activities. The household income reported here includes the gross income of the households from rice, nonrice crops, and other various farm and nonfarm activities for the study period (2008). These include the sum of the value of all goods and services produced on the farm, off-farm, and nonfarm activities by deploying land and labor—the major assets of rural households. Farm income constitutes the gross income obtained from rice, nonrice crops, and livestock. Off-farm income constitutes the income earned by the household as farm labor. Nonfarm income is the income arising from nonagricultural labor and
Table 33. Household rice production, consumption, and uses.
Item Golaghat Sibsagar All
% Rice-producing households 99 99 99
% Rice-selling households 96 79 88
Average rice production (kg/hh) 3,966 3,996 3,981
Per capita rice production (kg) 793 714 751
Per capita rice consumption (kg) 293 286 278
Household uses of rice (kg/hh)
% Consumed at home 64 69 67
% Sold in the market 25 22 24
% Used as seed 6 3 4
% Used as feed 1 2 1
% Used in payment 1 1 1
% Other uses 3 3 3
Total 100 100 100
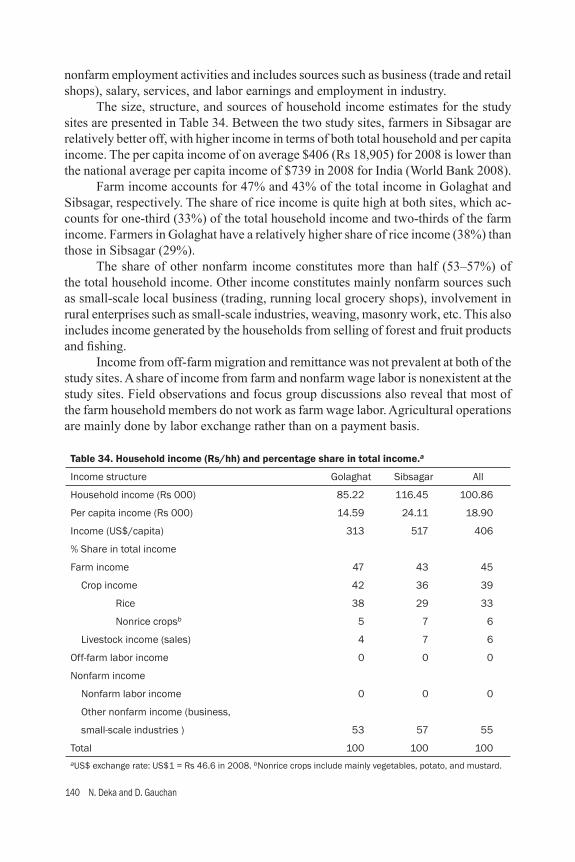
140 N. Deka and D. Gauchan
nonfarm employment activities and includes sources such as business (trade and retail shops), salary, services, and labor earnings and employment in industry. The size, structure, and sources of household income estimates for the study sites are presented in Table 34. Between the two study sites, farmers in Sibsagar are relatively better off, with higher income in terms of both total household and per capita income. The per capita income of on average $406 (Rs 18,905) for 2008 is lower than the national average per capita income of $739 in 2008 for India (World Bank 2008). Farm income accounts for 47% and 43% of the total income in Golaghat and Sibsagar, respectively. The share of rice income is quite high at both sites, which ac-counts for one-third (33%) of the total household income and two-thirds of the farm income. Farmers in Golaghat have a relatively higher share of rice income (38%) than those in Sibsagar (29%). The share of other nonfarm income constitutes more than half (53–57%) of the total household income. Other income constitutes mainly nonfarm sources such as small-scale local business (trading, running local grocery shops), involvement in rural enterprises such as small-scale industries, weaving, masonry work, etc. This also includes income generated by the households from selling of forest and fruit products and fi shing. Income from off-farm migration and remittance was not prevalent at both of the study sites. A share of income from farm and nonfarm wage labor is nonexistent at the study sites. Field observations and focus group discussions also reveal that most of the farm household members do not work as farm wage labor. Agricultural operations are mainly done by labor exchange rather than on a payment basis.
Table 34. Household income (Rs/hh) and percentage share in total income.a
Income structure Golaghat Sibsagar All
Household income (Rs 000) 85.22 116.45 100.86
Per capita income (Rs 000) 14.59 24.11 18.90
Income (US$/capita) 313 517 406
% Share in total income
Farm income 47 43 45
Crop income 42 36 39
Rice 38 29 33
Nonrice cropsb 5 7 6
Livestock income (sales) 4 7 6
Off-farm labor income 0 0 0
Nonfarm income
Nonfarm labor income 0 0 0
Other nonfarm income (business,
small-scale industries ) 53 57 55
Total 100 100 100aUS$ exchange rate: US$1 = Rs 46.6 in 2008. bNonrice crops include mainly vegetables, potato, and mustard.

Patterns of adoption of improved rice varieties ... of Assam, India 141
Household coping strategiesFloods are regular phenomena at the study sites. Hence, farm households adopt dif-ferent strategies to reduce, mitigate, and cope with risks and shocks that affect them from fl ooding stress. The range of strategies available to households depends on their asset portfolio, community support, and availability of external assistance during the most vulnerable period of the year. Many households in the vulnerable groups alter their rice production, consumption, and expenditure patterns as a short-term strategy to cope with food-defi cit periods. When the fl ooding effect is severe, households are forced to adopt a long-term strategy to cope with the stress, which includes selling their productive and durable assets, changing their livelihood strategies, and seeking employment in other sectors. Some of the current farmers’ important production, consumption, and household expenditure strategies to reduce and cope with stress effects are presented below. Adjustment in the type of food intake. Farmers normally do not make an adjust-ment in the amount of rice intake during a stress year as it is the staple diet, which is even eaten during stress years by borrowing and purchasing it from the local market and neighborhood. They may make an adjustment only in other food intake and expenditure patterns. Farmers make some adjustment and reduce slightly their con-sumption of pulses, vegetables, milk, and fi sh during stress years but not of the main staple rice (Table 35). Wheat is also considered a preferred food item and no changes in its intake are observed during stress years among the farming population. Households’ other adjustments for food security and production needs. Small and marginal farmers in fl ood years adopt a range of strategies to secure immediate household food needs in addition to seed needs for the subsequent crop production cycle. Some of these strategies include distress sale of immediately harvested crops and resorting to increasing food, seed, and cash borrowings from neighbors or rela-tives (Table 36). Analysis indicated that a small proportion of households, mainly in Sibsagar, opt for selling more harvested crop (distress sale) and increasing food, seed, and cash borrowing. An average of one-fi fth of the households in Sibsagar are engaged in selling harvested products for livelihood needs. Similarly, about one-fourth of the
Table 35. Household adjustments in consumption of food items in a stress year.
Daily intake Golaghat Sibsagar All
NYa SY NY SY NY SY
% HH consuming rice 100 100 100 100 100 100
% HH consuming wheat 32 32 15 13 24 23
% HH consuming pulses 100 94 99 94 100 94
% HH consuming vegetables 98 94 98 94 98 94
% HH consuming milk 46 43 41 33 44 38
% HH consuming fi sh 1 0 8 3 5 2aNY = normal year; SY = stress year.
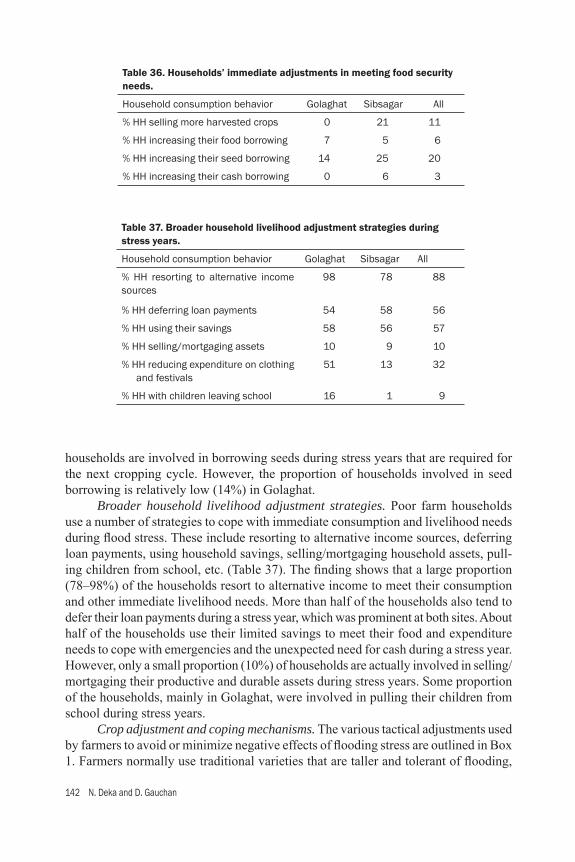
142 N. Deka and D. Gauchan
households are involved in borrowing seeds during stress years that are required for the next cropping cycle. However, the proportion of households involved in seed borrowing is relatively low (14%) in Golaghat. Broader household livelihood adjustment strategies. Poor farm households use a number of strategies to cope with immediate consumption and livelihood needs during fl ood stress. These include resorting to alternative income sources, deferring loan payments, using household savings, selling/mortgaging household assets, pull-ing children from school, etc. (Table 37). The fi nding shows that a large proportion (78–98%) of the households resort to alternative income to meet their consumption and other immediate livelihood needs. More than half of the households also tend to defer their loan payments during a stress year, which was prominent at both sites. About half of the households use their limited savings to meet their food and expenditure needs to cope with emergencies and the unexpected need for cash during a stress year. However, only a small proportion (10%) of households are actually involved in selling/mortgaging their productive and durable assets during stress years. Some proportion of the households, mainly in Golaghat, were involved in pulling their children from school during stress years. Crop adjustment and coping mechanisms. The various tactical adjustments used by farmers to avoid or minimize negative effects of fl ooding stress are outlined in Box 1. Farmers normally use traditional varieties that are taller and tolerant of fl ooding,
Table 36. Households’ immediate adjustments in meeting food security needs.
Household consumption behavior Golaghat Sibsagar All
% HH selling more harvested crops 0 21 11
% HH increasing their food borrowing 7 5 6
% HH increasing their seed borrowing 14 25 20
% HH increasing their cash borrowing 0 6 3
Table 37. Broader household livelihood adjustment strategies during stress years.
Household consumption behavior Golaghat Sibsagar All
% HH resorting to alternative income sources
98 78 88
% HH deferring loan payments 54 58 56
% HH using their savings 58 56 57
% HH selling/mortgaging assets 10 9 10
% HH reducing expenditure on clothing and festivals
51 13 32
% HH with children leaving school 16 1 9

Patterns of adoption of improved rice varieties ... of Assam, India 143
particularly in lower lands, where fl ooding is more severe. When a transplanted crop is fully damaged at the beginning of crop growth, farmers go for replanting/resow-ing of the crop, which is a common adjustment method. Farmers also use a higher seed rate in seedbeds and more seedlings during transplanting to the main fi elds to minimize risks of fl ooding. Aged seedlings are used for transplanting when fl ooding occurs during the early stage. If their seedlings are fully damaged in severe fl ooding, farmers buy seedlings from neighbors who have raised them from upland fi elds. Some time gap fi llings and staggered transplanting of rice seedlings are done in those fi elds where some seedlings (not all) are damaged. When the crop is damaged by late fl ood and there is no time for re-transplanting of the crop, area transplanted or sown to rice declines drastically. Farmers apply fertilizer (mainly nitrogenous fertilizer) to regenerate growth of damaged plants when fl ooding damage is observed during the vegetative stage of crop growth. In case of severe fl ooding, no fertilizer is applied as crops are fully damaged or farmers believe that plants will not recover from fl ood stress. Weeding is delayed when the crop is affected at tillering stage. Farmers prepare for second crops in advance, particularly vegetables, mustard, etc., when replanting is not possible to get good crop yield. If irrigation facilities are available, they favor dry-season rice cropping (in November or December) to compensate for wet-season crop failures. Farmers also have a tendency to store extra seeds to use them for re-sowing/replanting if the fi rst-seeded/transplanted crop is damaged. The maturity period for the rice crop is extended when the crop is affected by fl ood stress or replanted. Hence, instead of harvesting the rice crop during late December, they harvest the crop in January during fl ood years.
Box 1. Tactical adjustments in rice cropping during fl ooding• Use of fl ood-tolerant traditional varieties• Decrease in area planted to rice• Delay in transplanting and seeding • Replanting/re-sowing of crops fully or staggered planting• Increase in seed rate and seedling number in transplanting• Transplanting of aged seedlings • Delayed, limited, or no application of fertilizer• Delayed weeding• Delayed harvesting of the crop
Relief and mitigation programs. Some government-sponsored relief programs are reported during fl ood years, which include the distribution of a limited amount of seeds and food, construction of embankments along the side of rivers, and some provisions for re-settlement for the poorest and most affected people through the es-tablishment of relief camps. Relief and rehabilitation work in Assam is looked after by the district administration with support from the Department of Revenue and Disaster Management. A calamity relief program (fund) exists in both Sibsagar and Golaghat

144 N. Deka and D. Gauchan
districts that is to some extent serving as an important safety net for the local poor and vulnerable people during fl ood years. A crop insurance scheme of the government does exist in the state but it covers many fewer farmers and is not effective in the area. In Golaghat, the government’s “100 Days Youth Employment Scheme” or “Job Card” is in operation particularly for poor and vulnerable people, who are more likely to be affected by various types of disasters and epidemics, including fl oods. Its objective is to provide employment for jobless rural youth who are below the poverty line and are vulnerable. Community-level organized local initiatives and efforts for reducing the negative impact of fl ooding are not very prevalent, even though some support in terms of food and clothes from local friends and relatives appears to occur. Farmers have great expectations from the government to receive more relief support in terms of more cash for buying food and housing materials during a severe fl ooding period. Vulnerability to stress. Poor and marginal farmers who have land area located along river banks and those who have a higher proportion of rice area in lowland fl ood-prone areas are more vulnerable. Women and children are the most vulnerable within the household as women are the last to eat after meals are left and they rarely go out of the village for securing alternative income and employment. Children also suffer more from less food and malnutrition as well as dropping out from school during stress years. Moreover, during fl ood years, school buildings are used as relief camps for fl ood victims and many times the school remains closed, thus negatively impacting the education of children. In terms of ethnic group, the Ahum in Sibsagar, the Nepali in Mithunchapoi, and lower caste Assamese Hindus in Kundugiri of Golaghat are more vulnerable as they are the most food insecure and poor at the study sites.
Awareness and sources of stress-tolerant varietiesRice production in Assam suffers every year from fl ash fl oods and water stagnation during the vegetative stage of crop growth. This study tried to capture the amount of awareness of farmers and their willingness to plant newly developed stress-tolerant modern varieties that survive under short fl ooding (submergence). The reference for stress-tolerant varieties includes new IRRI stress-tolerant varieties (e.g., Sub1) being promoted and tested in the state, including existing stress (submergence)-tolerant MVs that are being recommended in Assam by the Assam Agricultural University and ICAR research institutes (e.g., Jalashree, Jalakunwari, etc.). The fi ndings revealed some variation in the amount of awareness of stress-tolerant rice varieties among farmers between Golaghat and Sibsagar (Table 38). Farmers in Golaghat have less awareness (36%) of stress-tolerant rice varieties than farmers in Sibsagar (83%). A small proportion of the farmers (17–19%) have already planted varieties that have some submergence tolerance such as Jalashree and Jalkunwari in a small proportion of their rice fi elds. The relatively higher awareness of farmers of stress-tolerant rice varieties in Sibsager is due to their current involvement in participatory varietal selec-tion (PVS) testing of Sub1 varieties under the STRASA project. Since farmers currently have no reliable access to stress-tolerant varieties at these sites, a much larger proportion of them are willing to plant promising new stress-tolerant varieties. The proportion of households willing to plant rice varieties

Patterns of adoption of improved rice varieties ... of Assam, India 145
is higher in Sibsager as many farmers are aware of the benefi t of Sub1 varieties as infl uenced by the PVS testing of STRASA Sub1 varieties. Since farmers’ existing dominant modern varieties are old, degenerated, and not tolerant of various stresses, access to new stress-tolerant varieties will provide them with good options to enhance their rice productivity. Reliable sources of agricultural information are critical to enhancing agricul-tural productivity. The analysis shows that a large number of farmers at the study sites have had no regular sources of information on stress-tolerant varieties. A very limited proportion of the farmers in Sibsagar now have some source of information, mainly from researchers and extension offi cials of the State Agricultural University and Department of Agriculture. Dependency on mass media such as radio and televi-sion as a source of information was almost nonexistent. These are the basic sources for the acquisition of information on weather forecasts but not for stress-tolerant rice varieties.
Gender division of responsibility and decision makingGender roles and decision making have an important infl uence on rice farming and sustenance of farmers’ livelihood in stress-prone rainfed areas. This section outlines gender analyses in relation to division of labor force and women’s participation in
Table 38. Awareness of and sources for stress-tolerant varieties (STVs).
Item Golaghat Sibsagar All
% Households heard of STVs
Yes 36 83 60
No 64 17 40
% Households planted STVs
Yes 17 19 18
No 83 81 82
% Households willing to plant STVs
Yes 47 65 56
No 50 23 37
No response 3 12 7
Source (%) of information on STVs
Extension workers (Dept. of Agriculture) 0 7 2
AAU researchers and extensionists 0 4 2
Neighbors, relatives, and friends 0 0 0
Others (radio, TV, and newspapers) 0 1 0
No sources of information 100 88 94
Total 100 100 100
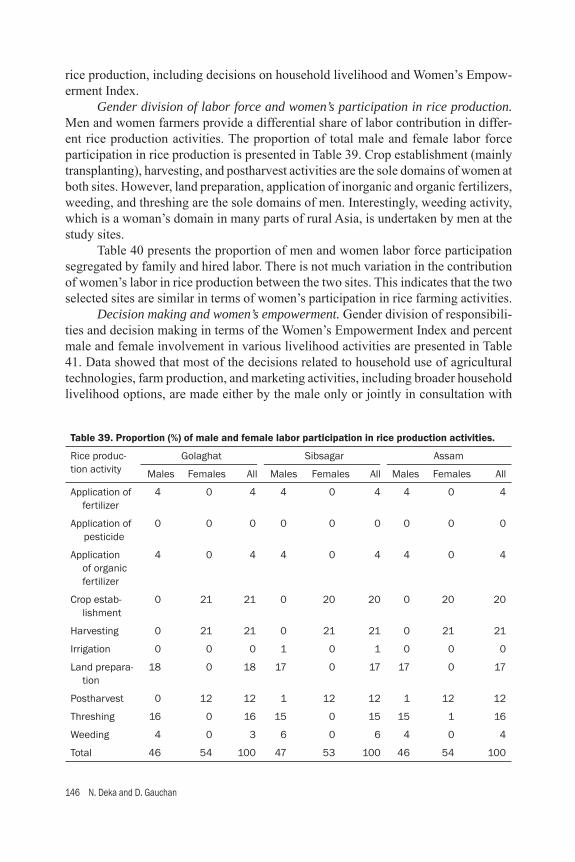
146 N. Deka and D. Gauchan
rice production, including decisions on household livelihood and Women’s Empow-erment Index. Gender division of labor force and women’s participation in rice production. Men and women farmers provide a differential share of labor contribution in differ-ent rice production activities. The proportion of total male and female labor force participation in rice production is presented in Table 39. Crop establishment (mainly transplanting), harvesting, and postharvest activities are the sole domains of women at both sites. However, land preparation, application of inorganic and organic fertilizers, weeding, and threshing are the sole domains of men. Interestingly, weeding activity, which is a woman’s domain in many parts of rural Asia, is undertaken by men at the study sites. Table 40 presents the proportion of men and women labor force participation segregated by family and hired labor. There is not much variation in the contribution of women’s labor in rice production between the two sites. This indicates that the two selected sites are similar in terms of women’s participation in rice farming activities. Decision making and women’s empowerment. Gender division of responsibili-ties and decision making in terms of the Women’s Empowerment Index and percent male and female involvement in various livelihood activities are presented in Table 41. Data showed that most of the decisions related to household use of agricultural technologies, farm production, and marketing activities, including broader household livelihood options, are made either by the male only or jointly in consultation with
Table 39. Proportion (%) of male and female labor participation in rice production activities.
Rice produc-tion activity
Golaghat Sibsagar Assam
Males Females All Males Females All Males Females All
Application of fertilizer
4 0 4 4 0 4 4 0 4
Application of pesticide
0 0 0 0 0 0 0 0 0
Application of organic fertilizer
4 0 4 4 0 4 4 0 4
Crop estab-lishment
0 21 21 0 20 20 0 20 20
Harvesting 0 21 21 0 21 21 0 21 21
Irrigation 0 0 0 1 0 1 0 0 0
Land prepara-tion
18 0 18 17 0 17 17 0 17
Postharvest 0 12 12 1 12 12 1 12 12
Threshing 16 0 16 15 0 15 15 1 16
Weeding 4 0 3 6 0 6 4 0 4
Total 46 54 100 47 53 100 46 54 100

Patterns of adoption of improved rice varieties ... of Assam, India 147
Table 40. Family and hired men’s and women’s labor participation in rice farming.
Labor use by gender Golaghat Sibsagar Assam
Total labor days/hectarea 73 87 80
% Family males 32.98 34.46 33.78
% Family females 33.93 33.47 33.68
% Hired males 12.86 12.40 12.61
% Hired females 20.24 19.67 19.93
% Total male labor 45.84 46.86 46.39
% Total female labor 54.16 53.14 53.61
Total 100 100 100aThis labor days/ha does not include contract labor used in rice farming.
other male or female members. The highest proportion of decisions is made mainly by males in decisions related to farming, technology adoption, and allocation of household income. But, decisions related to food consumption and children’s educa-tion and participation in voting/politics are mainly made jointly by male and female members. Womens have a greater role mainly in children’s education and selling and slaughtering of farm animals, followed by number of children to raise as indicated in the Women’s Empowerment Index for these activities. The proportion of women (principal females) making decisions solely on farm, nonfarm, and livelihood activities is very much limited. The lowest level of the Women’s Empowerment Index was found in activities related to rice farming and marketing decisions such as what price and where to sell outputs as well as what rice varieties to grow, including hiring of farm labor for rice farming. Similarly, women’s participation and decision making were found to be very low in the allocation of farm and household income and what farm implements to purchase for agricultural opera-tions (mainly for rice farming). This fi nding indicates that there is an increasing need for women’s empowerment in rice production and marketing as well as in various household livelihood decisions. Training and participation in organizations. Households with both male and female members are members of various formal and informal local community-based organizations and they participate in agricultural and rural skill-oriented training activities. The organizational activities cover membership and participation in various formal and informal organizations/social institutions that include local farmers’ groups, self-help groups (SGH), cooperatives, women’s groups, community management groups, local youth clubs, religious groups, etc. Men are mainly members of a fi eld management committee (FMC), which is a state-implemented farmers’ organization that is designed for rural development and empowerment to the farming community (NCAP 2007). Women are members of local self-help groups within the village and the community. A very small proportion of farmers in Golaghat are also members of farmers’ organizations such as cooperatives. A women’s self-help group is a common
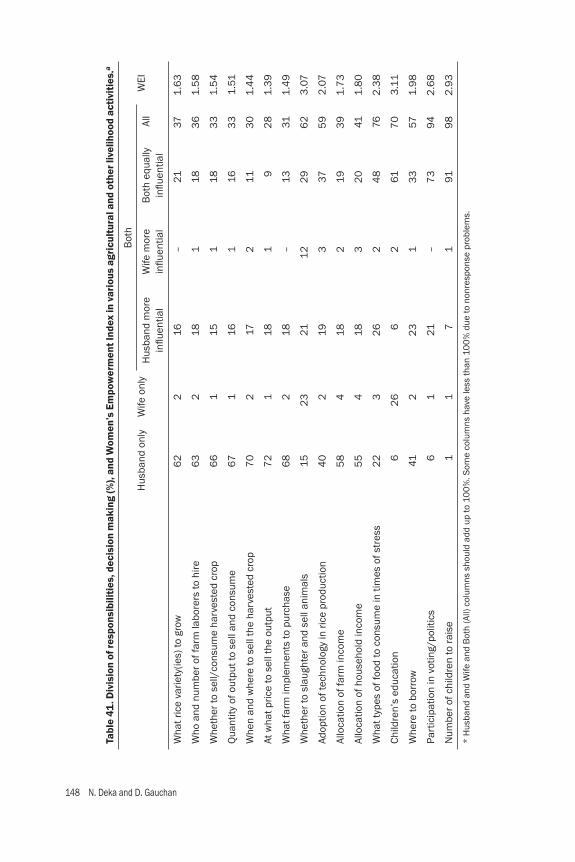
148 N. Deka and D. Gauchan
Tabl
e 41
. Div
isio
n of
resp
onsi
bilit
ies,
dec
isio
n m
akin
g (%
), an
d W
omen
’s E
mpo
wer
men
t Ind
ex in
var
ious
agr
icul
tura
l and
oth
er li
velih
ood
acti
viti
es.a
Hus
band
onl
yW
ife o
nly
Bot
hW
EIH
usba
nd m
ore
infl u
entia
lW
ife m
ore
infl u
entia
lB
oth
equa
lly
infl u
entia
lAl
l
Wha
t ric
e va
riety
(ies)
to g
row
62
216
–21
371.
63
Who
and
num
ber o
f far
m la
bore
rs to
hire
63
218
118
36
1.5
8
Whe
ther
to s
ell/
cons
ume
harv
este
d cr
op6
61
151
183
31.
54
Qua
ntity
of o
utpu
t to
sell
and
cons
ume
67
116
116
33
1.51
Whe
n an
d w
here
to s
ell t
he h
arve
sted
cro
p7
02
172
113
01.
44
At w
hat p
rice
to s
ell t
he o
utpu
t7
21
181
92
81.
39
Wha
t far
m im
plem
ents
to p
urch
ase
68
218
–13
311.
49
Whe
ther
to s
laug
hter
and
sel
l ani
mal
s15
23
211
22
96
23
.07
Adop
tion
of te
chno
logy
in ri
ce p
rodu
ctio
n4
02
193
375
92
.07
Allo
catio
n of
farm
inco
me
58
418
219
39
1.7
3
Allo
catio
n of
hou
seho
ld in
com
e 5
54
183
20
411.
80
Wha
t typ
es o
f foo
d to
con
sum
e in
tim
es o
f str
ess
22
32
62
48
762
.38
Child
ren’
s ed
ucat
ion
62
66
261
70
3.1
1
Whe
re to
bor
row
412
23
13
357
1.9
8
Part
icip
atio
n in
vot
ing/
polit
ics
61
21–
73
942
.68
Num
ber o
f chi
ldre
n to
rais
e1
17
191
98
2.9
3
* H
usba
nd a
nd W
ife a
nd B
oth
(All)
col
umns
sho
uld
add
up to
10
0%
. Som
e co
lum
ns h
ave
less
than
10
0%
due
to n
onre
spon
se p
robl
ems.

Patterns of adoption of improved rice varieties ... of Assam, India 149
feature in all the villages and it is being promoted by the state government for income generation, employment, empowerment, and mobilization of rural women. Credit and saving schemes are common in these self-help groups. Weaving is one of the common schemes used for the employment and income generation of women members. Men mainly participate in training related to agricultural production, rice farming, including seed production, and disease and pest management offered by the District Agricultural Offi ce as well as AAU. Women receive training mainly related to food processing, weaving such as hand loom making, and some income-generating and postharvest activities. The training is designed mainly for short-term skill- and exposure-oriented programs on different aspects of agricultural and rural development activities. The proportion of training and organizational activities participated in either by principal male or female members within the household is presented in Table 42. About one-third or more of the household male and female members participate in organizational activities at both study sites. However, farmers’ participation in train-ing was found only in Golaghat. Men farmers in Golaghat have memberships and participation in diversifi ed local community-based organizations, whereas women farmers are confi ned mainly to self-help groups. Overall, 30–40% of the females are members of local organizations. Women’s memberships are mainly in self-help groups, which are designed for women’s involvement and empowerment.
Summary of the fi ndings
• Farm households at the study sites have similar biophysical and socioeconomic characteristics, including similar stress incidence and effects. Access to irriga-tion, cropping intensity, and soil type differences are not very evident between the sites.
• Agriculture (mainly rice farming) is the primary occupation for 82% of the economically active households across the sites. Farmers’ dependence on agri-culture and rice farming is higher (97%) in Golaghat than in Sibasagar (66%).
• Excess rainfall and overfl ow of river water cause fl ooding at the study sites. Currently, farmers have limited technological options and fl exibility to make adjustments to cope with fl ooding stress. Both excess and uncertainty of mon-soon rains with low irrigation potential are key constraints to improving rice productivity.
Table 42. Farmers’ (males + females) participation in organizations and training.
% Share by gender Golaghat Sibsagar All
Males Females Males Females Males Females
Participation in organizations 38 36 52 41 41 39
Participation in agriculture and other training activities
43 31 0 0 – –
150 N. Deka and D. Gauchan
• Farmers have adopted modern varieties on a major portion of their rice farms. Only a handful of MV rice dominates the rice area at the study sites. The domi-nant MVs are Ranjit, Mahsuri, Bahadur, Luit, and Pankaj. Swarna was also grown by some farmers in a small proportion of the area.
• Newer generation MVs account for about 55% of the total MV area at these sites. The major newer generation MVs are Ranjit (released in 1992), Bahadur (released in 1994), and Luit (released in 1997).
• MVs outyield TVs on all the land types and across the sites. However, the yield of newer generation rice varieties is not signifi cantly superior to that of old MVs despite some of their preferred traits of tolerance of diseases, pests, and some submergence (e.g., Jalashree, Jalakunwari).
• Favorable fi eld type (land type) plays a key role in the adoption of new-gen-eration modern varieties. Both censored regression (tobit) and probit models indicated that the probability and intensity of adoption of new-generation MVs are higher if a farmer has an endowment of more favorable lowland fi elds that have better soil quality.
• Preferred attributes (desirable traits) of a variety are the major reasons cited by farmers for adopting a particular modern variety. High yield, high market price, and good taste (eating quality) are the most preferred traits for the cultivation of MVs.
• Farmers at the study sites now use a limited amount of chemical fertilizers and other modern inputs (e.g., machine power). Cropping intensity is also very low and farmers have limited access to irrigation facilities.
• Most current decisions on choice of technologies, production, marketing, and livelihood are made mainly by men (principal males) or jointly with female members. Women have low sole decision-making power and therefore they have a low Women’s Empowerment Index (less than 2.0) for many rice production, marketing, and income-related decision-making activities.
• Profi tability of the rice crop varies across sites, with higher net returns in Sibsagar as farmers obtain relatively higher average yields from their current rice varieties.
• MVs are more profi table than TVs due to their higher yields. On average, MV cultivation provides relatively higher (40%) incremental returns (returns above cash costs) than TVs across the sites. This profi tability effect of MVs over TVs is statistically signifi cant.
• Labor is the major component of production costs, accounting for more than two-thirds of the total costs. Chemical fertilizer accounts for only 2–3% of the costs in rice production.
• New and old MVs are similar in input use and profi tability (both net returns and returns above cash costs). There are no signifi cant higher incremental benefi ts of growing new MVs over old MVs across the sites. The key drivers of profi tability such as yield and output price were similar for both variety types.
• Farmers derive income from rice, nonrice, and various farm and nonfarm employment activities. Rice is an important component of household income, contributing one-third of the income share in total household income.
Patterns of adoption of improved rice varieties ... of Assam, India 151
• Poor farm households use a number of strategies to cope with immediate con-sumption and livelihood needs during fl ooding stress. These include resorting to alternative income sources, deferring loan payments, using household savings, and selling/mortgaging assets.
• Some farmers are aware of and also cultivate a relatively newer generation of stress-tolerant MVs such as Jalashree and Jalakunwari that are suited to submergence-prone conditions. Few farmers in Sibsagar are aware of new Sub1 lines being tested in PVS. Large-scale on-farm testing and seed dissemination are yet to take place.
References
Adesina AA, Zinnah MM. 1993. Technology characteristics, farmers’ perceptions and adoption decisions: a Tobit model application in Sierra Leone. Agric. Econ. 9:297-311.
Adesina A, Seidi S. 1995. Farmers’ perceptions and adoption of new agricultural technology: analysis of modern Mangrove rice varieties in Guinea-Bissau. Quart. J. Int. Agric. 34:358-385.
ASSAMSFAC. 2005. Assam Small Farmers’ Agribusiness Consortium. Government of As-sam’s Platform for Farmers-Government-Bank-Institution and Private Partnership in Agri Business. http://assamagribusiness.nic.in/agri3.htm.
Barah BC, Pandey S. 2005. Rainfed rice production systems in eastern India: an on-farm diag-nosis and policy alternatives. Indian J. Agric. Econ. 60(1): Jan-March 2005.
Bellon M, Taylor JE. 1993. Folk soil taxonomy and the partial adoption of new seed varieties. Econ. Dev. Cult. Change 41:763-786.
Bhowmick BC, Borthakar N. 2002. Socioeconomic dynamics of changes in rice production systems in Assam. NATP(ICAR)/IRRI Project. Department of Agricultrual Economics, Assam Agricultural University, Jorhat, Assam.
Bhowmick BC, Barah BC, Pandey S, Barthakur N. 2005. Changing pattern of rice production systems and technology in Assam: a spatio-temporal analysis of performance and pros-pects. Policy Paper 22. National Centre for Agricultural Economics and Policy Research (NCAP). Indian Council of Agricultural Research, New Delhi, India.
Brush SB, Taylor JE, Bellon MR. 1992. Biological diversity and technology adoption in Andean potato agriculture. J. Dev. Econ. 39:365-387.
David C, Otsuka K. 1994. Modern rice technology and income distribution in Asia. Los Baños (Philippines): International Rice Research Institute.
Das P, Chutiya D, Hazarika N. 2009. Adjusting to fl oods on the Brahmaputra plains, Assam, India. International Center for Integrated Mountain Development, Kathmandu, Nepal.
Details of Rice Varieties in India (http://dacnet.nic.in/rice/RiceVarieties in India.htm).DRD (Directorate of Rice Development). 2010. Rice in India during Tenth Plan, prepared and
edited by Dr. M.C. Diwakar, director. Government of India, Ministry of Agriculture, (Dept. of Agriculture and Cooperation), Patna, Bihar.
DRR (Directorate of Rice Development). 2008. DRR Newsletter, Vol 6(1) Jan 2008. ICAR. Rajendranagar, Hyderabad, India. (www.drricar.org).
Doss CR. 2006. Analyzing technology adoption using microstudies: limitations, challenges, and opportunities for improvement. Agric. Econ. 34:207-219.

152 N. Deka and D. Gauchan
Economic Survey, Assam 2007-08. State Government of Assam, India. Economic Survey 2009-10. India. http://exim.indiamart.com/economic-survey09-10/.Feder G, Just RE, Zilberman D. 1985. Adoption of agricultural innovations in developing
countries: a survey. Econ. Dev. Cult. Change 33:255-298.FAOSTAT. 2009. FAOSTAT on-line database on different commodities. FAO. http://faostat.
fao.org/site/339/default.aspx.Hossain M, Bose ML, Ahmad A. 2004. Nature and impact of women’s participation in economic
activities in rural Bangladesh: insights from household surveys. CPD-IRRI, Policy Brief 7. Dhaka, Bangladesh, IRRI.
Hosssain M, Bose ML, Mustafi BA. 2006. Adoption and productivity impact of modern rice varieties in Bangladesh. Dev. Economies XLIV-2 (June 2006):149-166.
Indiastatistics (www.indiastat.com), Government of India.Langyintuo A, Mungoma C. 2008. The effect of household wealth on the adoption of improved
maize varieties in Zambia. Food Policy 33(2008):550-559.Maddala GS. 1983. Limited dependent and qualitative variables in econometrics. Econometric
Society Monographs, vol. 3. Cambridge University Press, Cambridge.McDonald JF, Moffi tt RA. 1980. The uses of tobit analysis. Rev. Econ. Stat. 62:318-321.NCAP (National Academy of Agricultural Sciences). 2007. Innovations in rural institutions:
drivers for agricultural prosperity. Policy paper 39. New Delhi: NCAP.Paris T, Singh A, Cueno A, Singh VN. 2008. Assessing the impact of participatory research
in rice breeding on women farmers: a case study in eastern Uttar Pradesh, India. Exp. Agric. 44:97-112.
Rice varieties notifi ed from 1996 to 2007 in different states and their salient features (http://agropedia.iitk.ac.in).
Umatsu H, Mishra AK. 2010. Net effect of education on technology adoption by U.S. farmers. Selected paper prepared for presentation at the Southern Agricultural Economics As-sociation.Annual Meeting, Orlando, FL, 6-9 February 2010.
World Bank. 2008. World development indicators. Washington, D.C. (USA): The World Bank.
Notes
Authors’ addresses: N. Deka, Department of Agricultural Economics, Assam Agricultural University, Jorhat, Assam; D. Gauchan, Socioeconomics & Agricultural Research Policy Division, Nepal Agricultural Research Council (NARC), Kathmandu Khumaltar, Lalitpur, Nepal.
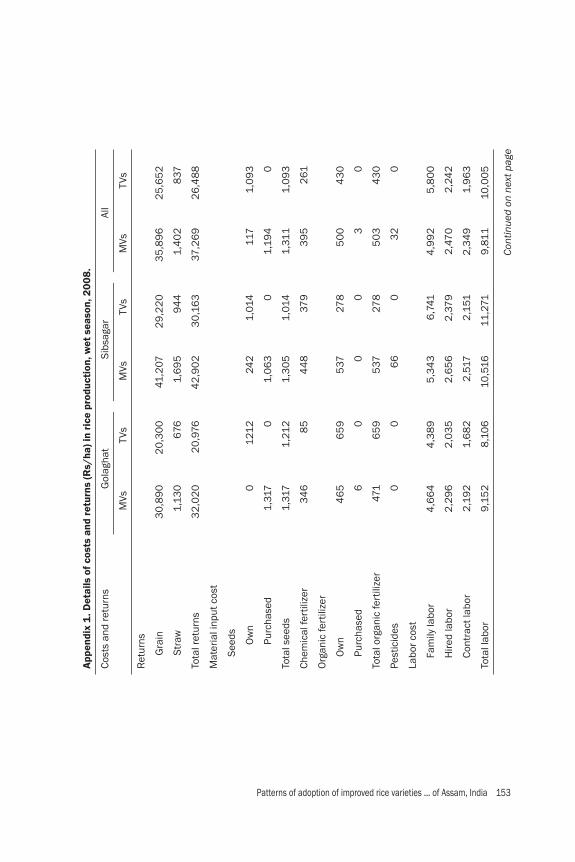
Patterns of adoption of improved rice varieties ... of Assam, India 153
App
endi
x 1
. Det
ails
of c
osts
and
ret
urns
(Rs/
ha) i
n ri
ce p
rodu
ctio
n, w
et s
easo
n, 2
008.
Cost
s an
d re
turn
sG
olag
hat
Sibs
agar
All
MVs
TVs
MVs
TVs
MVs
TVs
Ret
urns
Gra
in3
0,8
90
20
,30
041
,207
29
,22
03
5,8
96
25
,65
2
Stra
w1,
130
676
1,6
95
94
41,
40
28
37
Tota
l ret
urns
32
,02
02
0,9
764
2,9
02
30
,16
337
,26
92
6,4
88
Mat
eria
l inp
ut c
ost
Seed
s
Ow
n0
121
224
21,
014
117
1,0
93
Purc
hase
d1,
317
01,
06
30
1,19
40
Tota
l see
ds1,
317
1,21
21,
30
51,
014
1,31
11,
09
3
Chem
ical
fert
ilize
r3
46
85
44
837
93
95
261
Org
anic
fert
ilize
r
Ow
n4
65
65
95
3727
85
00
43
0
Purc
hase
d6
00
03
0
Tota
l org
anic
fert
ilize
r47
16
59
537
278
50
34
30
Pest
icid
es0
06
60
32
0
Labo
r cos
t
Fam
ily la
bor
4,6
64
4,3
89
5,3
43
6,7
414
,99
25
,80
0
Hire
d la
bor
2,2
96
2,0
35
2,6
56
2,3
79
2,4
70
2,2
42
Cont
ract
labo
r2
,19
21,
68
22
,517
2,1
512
,34
91,
96
3
Tota
l lab
or9
,15
28
,10
610
,516
11,2
719
,811
10,0
05
Cont
inue
d on
nex
t pag
e

154 N. Deka and D. Gauchan
Pow
er u
se c
ost
Anim
al p
ower
Bul
lock
(ow
n)1,
161
1,1
20
1,3
4715
22
1,2
511,
361
Bul
lock
(hire
d)0
00
00
0
Tota
l ani
mal
pow
er1,
161
1,1
20
1,3
471,
52
21,
251
1,3
61
Mac
hine
s
Trac
tor (
owne
d)15
547
29
33
25
221
214
Trac
tor (
hire
d)0
027
013
0
Tota
l mac
hine
cos
ts15
547
32
03
25
23
421
4
Tota
l cas
h co
sts
6,1
56
3,8
02
6,7
774
,90
96
,45
54
,46
6
Tota
l cos
t of o
wn
reso
urce
s6
,44
57
,42
67
,76
39
,881
7,0
818
,881
Tota
l ove
rall
cost
s1
2,6
0111
,22
914
,53
914
,78
913
,53
613
,36
5
Net
retu
rns
19,4
199
,747
28
,36
315
,374
23
,73
313
,12
3
Ret
urns
abo
ve c
ash
cost
s2
5,8
64
17,1
743
6,1
25
25
,25
43
0,8
142
2,0
22
Appe
ndix
1 c
ontin
ued

Patterns of adoption of improved rice varieties ... of Assam, India 155
App
endi
x 2.
Sha
re (%
) of c
ompo
nent
s of
cos
ts a
nd r
etur
ns in
MV
and
TV r
ice
prod
ucti
on.
Shar
e of
com
pone
nts
(%)
Gol
agha
tSi
bsag
arAl
l
MVs
TVs
MVs
TVs
MVs
TVs
Out
put
Gra
in9
697
96
979
697
Stra
w4
34
34
3
Tota
l out
put
100
100
100
100
100
100
Mat
eria
l inp
ut c
ost
Seed
s
Ow
n0
.010
.81.
76
.90
.98
.2
Purc
hase
d10
.50
.07.
30
.08
.80
.0
Tota
l see
ds10
.510
.89
.06
.99
.78
.2
Chem
ical
fert
ilize
r2
.70
.83
.12
.62
.92
.0
Org
anic
fert
ilize
r
Ow
n3
.75
.93
.71.
93
.73
.2
Purc
hase
d0
.00
.00
.00
.00
.00
.0
Tota
l org
anic
fert
ilize
r3
.75
.93
.71.
93
.73
.2
Pest
icid
es0
.00
.00
.50
.00
.20
.0
Labo
r cos
t0
.00
.00
.00
.00
.00
.0
Fam
ily la
bor
37.0
39
.13
6.7
45
.63
6.9
43
.4
Hire
d la
bor
18.2
18.1
18.3
16.1
18.2
16.8
Cont
inue
d on
nex
t pag
e
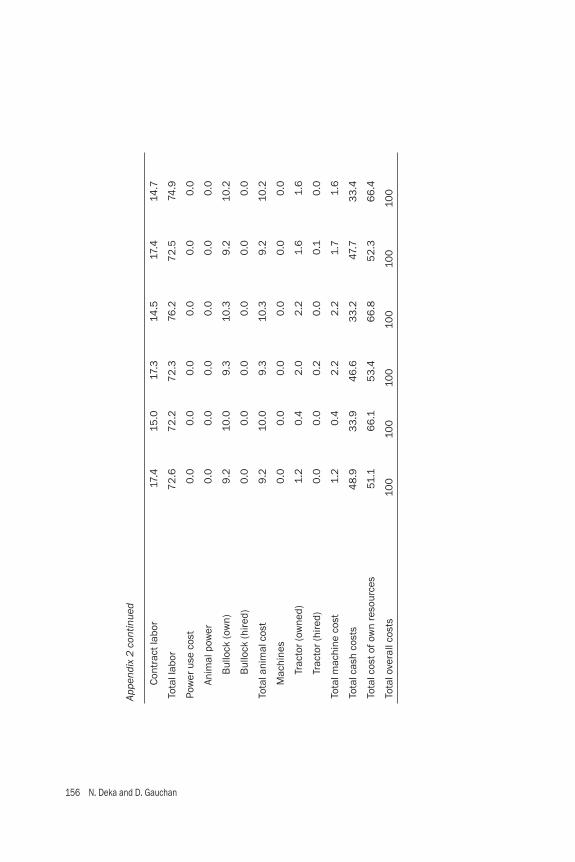
156 N. Deka and D. Gauchan
Cont
ract
labo
r17
.415
.017
.314
.517
.414
.7
Tota
l lab
or7
2.6
72
.27
2.3
76.2
72
.574
.9
Pow
er u
se c
ost
0.0
0.0
0.0
0.0
0.0
0.0
Anim
al p
ower
0.0
0.0
0.0
0.0
0.0
0.0
Bul
lock
(ow
n)9
.210
.09
.310
.39
.210
.2
Bul
lock
(hire
d)0
.00
.00
.00
.00
.00
.0
Tota
l ani
mal
cos
t9
.210
.09
.310
.39
.210
.2
Mac
hine
s0
.00
.00
.00
.00
.00
.0
Trac
tor (
owne
d)1.
20
.42
.02
.21.
61.
6
Trac
tor (
hire
d)0
.00
.00
.20
.00
.10
.0
Tota
l mac
hine
cos
t1.
20
.42
.22
.21.
71.
6
Tota
l cas
h co
sts
48
.93
3.9
46
.63
3.2
47.7
33
.4
Tota
l cos
t of o
wn
reso
urce
s51
.16
6.1
53
.46
6.8
52
.36
6.4
Tota
l ove
rall
cost
s10
010
010
010
010
010
0
Appe
ndix
2 c
ontin
ued

Patterns of adoption of improved rice varieties ... of Assam, India 157
App
endi
x 3.
Det
ails
of c
osts
and
ret
urns
in n
ew a
nd o
ld M
V ri
ce p
rodu
ctio
n (R
s/ha
).
Cost
s an
d re
turn
sG
olag
hat
Sibs
agar
All
New
MVs
Old
MVs
New
MVs
Old
MVs
New
MVs
Old
MVs
Ret
urns
Gra
in3
0,0
75
31,9
4141
,80
54
0,7
69
35
,491
36
,35
5
Stra
w1,
075
1,21
51,
79
31,
573
1,4
071,
39
4
Tota
l ret
urns
31,1
54
33
,15
64
3,5
98
42
,34
23
6,8
9737
,74
9
Mat
eria
l inp
ut c
ost
Seed
s
Ow
n0
36
26
921
11
241
24
Purc
hase
d1,
315
1,2
80
1,01
11,
146
1,17
51,
213
Tota
l see
ds1,
315
1,31
61,
28
01,
357
1,2
99
1,3
37
Chem
ical
fert
ilize
r3
29
36
34
65
42
83
92
39
6
Org
anic
fert
ilize
r
Ow
n47
54
52
527
55
44
99
50
3
Purc
hase
d0
150
00
8
Tota
l org
anic
fert
ilize
r 47
54
67
527
55
44
99
511
Pest
icid
es0
011
20
52
0
Labo
r cos
t
Fam
ily la
bor
4,6
474
,63
05
,727
4,8
08
5,1
46
4,7
19
Hire
d la
bor
2,3
63
2,1
50
2,6
172
,73
62
,48
024
43
Cont
ract
labo
r2
,257
2,0
44
2,4
872
,57
92
,36
32
,31
2
Cont
inue
d on
nex
t pag
e

158 N. Deka and D. Gauchan
Tota
l lab
or
9,2
67
8,8
2410
,831
10,1
23
9,9
89
9,4
74
Pow
er u
se c
ost
Anim
al p
ower
Bul
lock
(ow
n)1,
136
1,18
81,
461
119
21,
28
61,
190
Bul
lock
(hire
d)0
00
00
0
Tota
l ani
mal
cos
t1,
136
1,18
81,
461
1,19
21,
28
61,
190
Mac
hine
s
Trac
tor (
owne
d)16
313
73
072
812
29
20
9
Trac
tor (
hire
d)0
05
26
213
Tota
l mac
hine
cos
t 16
313
731
23
072
31 2
22
Tota
l cas
h co
sts
6,2
65
5,8
52
6,7
03
6,9
43
6,4
67
6,3
98
Tota
l cos
t of o
wn
reso
urce
s6
,42
06
,44
38
,30
2
7,0
45
7,2
89
6,7
44
Tota
l ove
rall
cost
s1
2,6
85
12
,29
515
,00
513
,98
813
,75
613
,141
Ret
urns
abo
ve c
ash
cost
s24
,88
927
,30
43
6,8
95
35
,39
93
0,4
30
31,3
52
Net
retu
rns
18,4
69
2
0,8
612
8,5
92
28
,35
42
3,1
4124
,60
8
Appe
ndix
3 c
ontin
ued
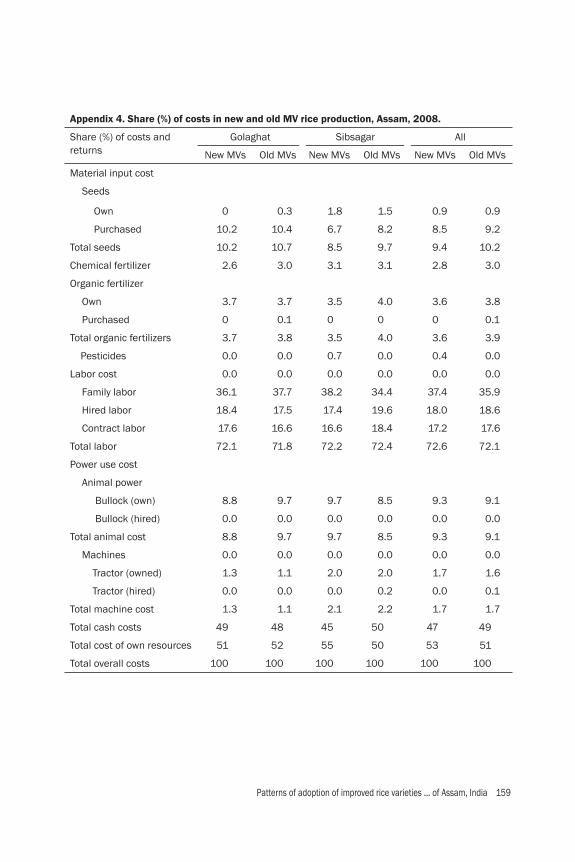
Patterns of adoption of improved rice varieties ... of Assam, India 159
Appendix 4. Share (%) of costs in new and old MV rice production, Assam, 2008.
Share (%) of costs and returns
Golaghat Sibsagar All
New MVs Old MVs New MVs Old MVs New MVs Old MVs
Material input cost
Seeds
Own 0 0.3 1.8 1.5 0.9 0.9
Purchased 10.2 10.4 6.7 8.2 8.5 9.2
Total seeds 10.2 10.7 8.5 9.7 9.4 10.2
Chemical fertilizer 2.6 3.0 3.1 3.1 2.8 3.0
Organic fertilizer
Own 3.7 3.7 3.5 4.0 3.6 3.8
Purchased 0 0.1 0 0 0 0.1
Total organic fertilizers 3.7 3.8 3.5 4.0 3.6 3.9
Pesticides 0.0 0.0 0.7 0.0 0.4 0.0
Labor cost 0.0 0.0 0.0 0.0 0.0 0.0
Family labor 36.1 37.7 38.2 34.4 37.4 35.9
Hired labor 18.4 17.5 17.4 19.6 18.0 18.6
Contract labor 17.6 16.6 16.6 18.4 17.2 17.6
Total labor 72.1 71.8 72.2 72.4 72.6 72.1
Power use cost
Animal power
Bullock (own) 8.8 9.7 9.7 8.5 9.3 9.1
Bullock (hired) 0.0 0.0 0.0 0.0 0.0 0.0
Total animal cost 8.8 9.7 9.7 8.5 9.3 9.1
Machines 0.0 0.0 0.0 0.0 0.0 0.0
Tractor (owned) 1.3 1.1 2.0 2.0 1.7 1.6
Tractor (hired) 0.0 0.0 0.0 0.2 0.0 0.1
Total machine cost 1.3 1.1 2.1 2.2 1.7 1.7
Total cash costs 49 48 45 50 47 49
Total cost of own resources 51 52 55 50 53 51
Total overall costs 100 100 100 100 100 100

160 N. Deka and D. Gauchan

Patterns of adoption of improved rice varieties ... of Bangladesh 161
Patterns of adoption of improved rice varieties and farm-level impacts in stress-prone rainfedareas of Bangladesh
Chapter 5

162 M.R. Islam, M.A. Islam, M.S. Rahman, A. Salam, S. Alam, E. Harun, and M. Bool-Emerick
Patterns of adoption of improved rice varieties ... of Bangladesh 163
Patterns of adoption of improved rice varieties and farm-level impacts in stress-prone rainfed areas of Bangladesh
Introduction
Country backgroundBangladesh is located in the northeastern part of South Asia with India bordering the west, north, and east and Myanmar bordering the southeast. It has a total land area1 of 130,170 km2 with a population of 162 million in 2009. Agriculture is the mainstay of the Bangladeshi economy, contributing 19% to the gross domestic product (GDP). Rice, the main food crop, is grown extensively and can be harvested 2 to 3 times a year. In 2008-09, Bangladesh produced 43.8 million tons of rice with aus, aman, and boro rice accounting for 10%, 42%, and 48%, respectively (Bangladesh Rice Research Institute 2011). Rice is cultivated in different ecosystems that include irrigated, rainfed lowland areas, and uplands. In rainfed areas, rice farms are affected by varied levels of submergence, drought, and salinity. The occurrences of these abiotic stresses cause substantial crop damage in the country. To improve the food security and livelihoods of poor farming households, collaborative efforts with NARES have been made to develop stress-tolerant rice varieties to achieve higher productivity growth in the country.
ObjectivesThis report is an outcome of the baseline socioeconomic survey under Objective 7 (Impact assessment and targeting) of the STRASA project. The objectives of the study are the following:
• To analyze farmers’ livelihood systems in selected drought-prone, submergence-prone, and salinity environments in Bangladesh.
• To analyze the patterns of varietal adoption and the factors that infl uence the adoption of modern rice varieties.
• To analyze the economics of rice production by type of variety and season.• To document farmers’ coping strategies due to different stress situations (drought,
submergence, and salinity).• To understand gender roles in rice production and women’s participation in
decision-making.• To serve as a baseline for rice technology design, targeting, and policy reforms
in the stress-prone areas.
1Land area excludes area under inland water bodies such as major rivers and lakes.
M.R. Islam, M.A. Islam, M.S. Rahman, A. Salam, S. Alam, E. Harun, and M. Bool-Emerick
164 M.R. Islam, M.A. Islam, M.S. Rahman, A. Salam, S. Alam, E. Harun, and M. Bool-Emerick
Organization of the reportThis report is organized into six major sections. The fi rst section gives a general coun-try background and objectives of the study. This is followed by a short description of research design and data generation. The third section provides a brief description of the trends in rice production. The fourth section provides a general description of the survey sites and stresses using information gathered from focus group discussions (FGD) and key informant surveys (KIS). Section fi ve presents the detailed farm-level analyses of the socioeconomic survey describing the livelihood of farmers, adoption of modern varieties, economics of rice production, consumption patterns, coping strategies, and gender analysis. The fi nal section provides a summary of the fi ndings.
Research design and data generation
This research was implemented in partnership with the Bangladesh Rice Research Institute (BRRI) in Gazipur and Bangladesh Agricultural University (BAU) in My-mensingh. Data for this study were collected by combining rapid rural appraisal methods, secondary sources, and specifi cally designed household surveys. The survey was carried out for the 2008 rice cropping season under the STRASA project in South Asia. Prevalence of stress (drought, submergence, and salinity) and proportion of rainfed rice area were two major criteria used in selecting districts and study villages. Household surveys were conducted in 500 randomly selected households covering the representative rainfed districts in Bangladesh. The districts included were Habiganj, Jamalpur, Kurigram (submergence), Rajshahi (drought), and Satkhira (salinity). Within each district, at least two villages were selected for the detailed household survey. The survey sites and stress situations were characterized using information gathered from focus group discussions and key informant surveys. Detailed information on farmers’ livelihoods, socioeconomic features, rice production systems, variety adoption patterns, input use, costs and returns, income structure, farmers’ coping strategies, and gender-disaggregated data on rice farming was collected from the socioeconomic household baseline survey. The basic analytical framework followed is given in Chapter 2. The study used a combination of secondary and primary data. Temporal data on rice area, yield, and production covering 1970 to 2008 were used to provide general trends at the aggregate level. Various statistical and econometric analyses were employed to meet the study objectives. Using time-series data obtained from national statistics, annual growth rates for rice area, production, and yield were estimated using a semi-log trend equa-tion.2 The compound growth rate was estimated for each decade from 1970 to 2008. Before fi tting the trend equation for each period, data were smoothed using a fi ve-year moving-average process.
2 The functional form of the semi-log equation is given by ln Yt = a + bT, where Yt is the series of area/production/yield, a is the constant, b gives the annual exponential growth rate of area/production/yield, and T is the trend term.

Patterns of adoption of improved rice varieties ... of Bangladesh 165
The adoption of improved varieties was measured using various indicators such as the proportion of farmers growing modern varieties (MVs) and the proportion of area under MVs. The incidence and intensity of adoption were compared not only across sites and stress situations but also between aman and boro seasons. The nature of MV adoption3 in Bangladesh did not allow us to use censored regression (tobit) and probit models to identify the major factors determining the probability and the rate of adoption of new-generation modern varieties. Instead, past literature on the dominant rice varieties from 1980 to the present was reviewed.
Agriculture and trends in rice production
Agriculture is one of the major sectors in the Bangladeshi economy, contributing 48% to the country’s total employment (Worldbank Indicators 2010). In 2008, the agricultural sector accounted for 19% of the GDP. More than 70% of the population thrives in rural areas, where agriculture is the major source of livelihood. Agricultural land consists of 70% of the country’s total land area. Farm landhold-ings in the country are characterized as small and fragmented. Of the total number of farm landholdings, 89% are considered marginal or small, where area is below 1.0 ha. More than 60% of the total agricultural land is irrigated. The different sources of irrigation are power pumps, shallow tube wells (STW), deep tube wells (DTW), and traditional sources such as canals. More than 90% of the irrigated area is planted to the country’s major crops such as cereals (rice, wheat) and potato. The country’s land area under cereal production increased from 10.9 million ha in 1992 to 12.4 million ha in 2008 (www.tradingeconomics.com). Expansion in cereal4 production can be attributed to irrigation expansion such as the installation of shallow tube wells. Aside from cereal crops, major cash crops such as jute, sugarcane, cotton, tobacco, tea, and betel leaves are also cultivated. The overall cropping intensity was estimated at 179% in 2008-09 (BRRI 2011).
Trends in rice area, production, and yield
The different cropping seasons for rice in Bangladesh are aus, aman, and boro. The aus season overlaps the boro and aman seasons. Aus rice or early summer rice is planted in April and harvested in August. On the other hand, aman rice (wet-season rice) is usually transplanted in June/July and harvested in November/December while boro rice or dry-season irrigated rice is planted in December/January and harvested in May/June. The total rice area increased from 9.9 million ha in 1971 to 11.7 million ha in 2008. Rice production grew signifi cantly by more than 2% annually from 1974 to 2008,
3MV adoption is very high at selected survey sites and not much variation was observed across sites. During the aman season, most rice areas are grown to old-generation MVs while the reverse is ob-served during the boro season. 4Cereals include wheat, rice, maize, barley, oats, rye, millet, sorghum, and mixed grains.

166 M.R. Islam, M.A. Islam, M.S. Rahman, A. Salam, S. Alam, E. Harun, and M. Bool-Emerick
which was mainly driven by growth in yield (Fig. 1). Growth in production and yield was made possible by the adoption of high-yielding varieties, installation of shallow tube wells, and rapid uptake of fertilizers and pesticides (Hossain et al 2009). The growth rates for different periods are presented in Table 1. Overall, signifi -cant growth in rice area by 0.2% per year was observed from 1974 to 2008. Similarly, dramatic growth in yield is observed for all periods. On average, rice yield increased by 2.4% per annum from 1974 to 2008. The area expansion and improvements in yield caused a signifi cant rice production growth of 2.6% per annum. Some of the growth in production can be explained by the expansion of boro rice cultivation. In 1971, aus rice occupied 32% of the total rice area while boro rice accounted for only 9%. From 1976 to 1988, boro rice area increased slowly while aus area declined gradually (Fig. 2). Boro rice area continued to increase from 1988 to 2008 while aus rice continued to drop. In 2008, boro rice occupied 37% while aus rice accounted for only 13% of the total rice area. Half of the total rice area is planted to aman rice. Despite this, rice yield is highest during the boro season and lowest in aus. Improvements in rice yields for all seasons were very slow until the late 1990s, when yield surpassed 3.0 t/ha nationally. By 2008, rice yield reached 4.05 t/ha with mean boro yield of 5.34 t/ha while aus and aman rice yield averaged 3.08 and 3.36 t/ha, respectively (BRRI 2011). Figures 3, 4, and 5 show the trends in rice area, production, and yield by season from 1971 to 2008. During the 1970s, the majority of the rice area was grown to traditional rice varieties (TVs). Over the years, the shift from low-yielding traditional varieties to
Fig. 1. Rough rice area, production, and yield in Bangladesh, 1970-2008. Data source: World rice statistics (FAO data), 2010.
50
45
4.5
4.0
3.5
3.0
2.5
2.0
1.5
1.0
0.5
0.0
40
35
30
25
20
15
10
5
0
Area (million ha)/production (million tons) Yield (t/ha)
Year
1970
1972
1974
1976
1978
1980
1982
1984
1986
1988
1990
1992
1994
1996
1998
2000
2002
2004
2006
2008
Area
Prod
Yield
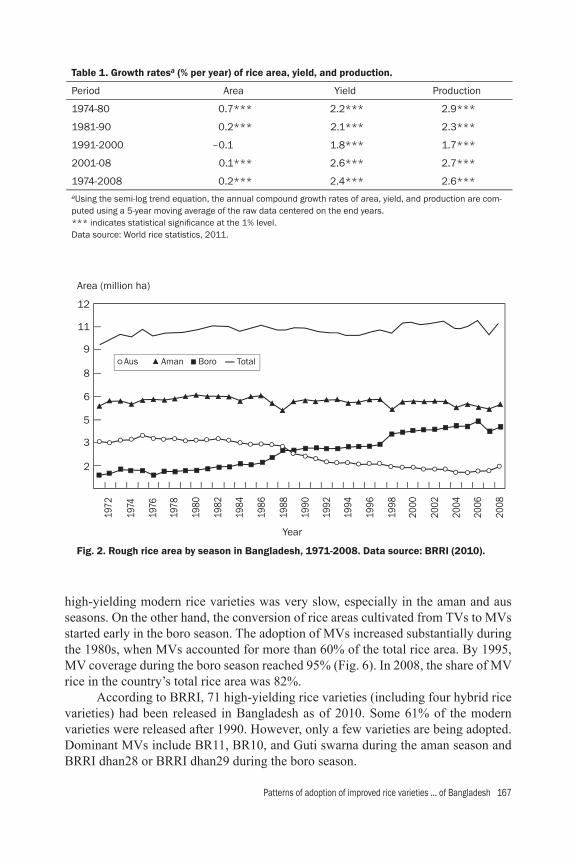
Patterns of adoption of improved rice varieties ... of Bangladesh 167
Aus Aman Boro Total
high-yielding modern rice varieties was very slow, especially in the aman and aus seasons. On the other hand, the conversion of rice areas cultivated from TVs to MVs started early in the boro season. The adoption of MVs increased substantially during the 1980s, when MVs accounted for more than 60% of the total rice area. By 1995, MV coverage during the boro season reached 95% (Fig. 6). In 2008, the share of MV rice in the country’s total rice area was 82%. According to BRRI, 71 high-yielding rice varieties (including four hybrid rice varieties) had been released in Bangladesh as of 2010. Some 61% of the modern varieties were released after 1990. However, only a few varieties are being adopted. Dominant MVs include BR11, BR10, and Guti swarna during the aman season and BRRI dhan28 or BRRI dhan29 during the boro season.
Table 1. Growth ratesa (% per year) of rice area, yield, and production.
Period Area Yield Production
1974-80 0.7*** 2.2*** 2.9***
1981-90 0.2*** 2.1*** 2.3***
1991-2000 –0.1 1.8*** 1.7***
2001-08 0.1*** 2.6*** 2.7***
1974-2008 0.2*** 2.4*** 2.6***aUsing the semi-log trend equation, the annual compound growth rates of area, yield, and production are com-puted using a 5-year moving average of the raw data centered on the end years.*** indicates statistical signifi cance at the 1% level.Data source: World rice statistics, 2011.
Fig. 2. Rough rice area by season in Bangladesh, 1971-2008. Data source: BRRI (2010).
12
11
9
8
6
5
3
2
Area (million ha)
Year
1974
1976
1978
1980
1982
1984
1986
1988
1990
1992
1994
1996
1998
2000
2002
2004
2006
2008
1972

168 M.R. Islam, M.A. Islam, M.S. Rahman, A. Salam, S. Alam, E. Harun, and M. Bool-Emerick
Fig. 3. Area, yield, and production for aus rice, 1971-2008. Data source: BRRI, 2010.
Fig. 4. Area, yield, and production for aman rice, 1971-2008. Data source: BRRI, 2010.
6
20
18
16
14
12
10
8
6
4
2
0
3.5
3.5
2.5
1.5
0.5
4.0
3.0
2.0
1.0
3.0
2.0
2.5
1.5
0.5
0.0
0.0
1.0
5
4
3
2
1
0
Area (million ha)/production (million tons)
Area (million ha)/production (million tons)
Yield (t/ha)
Yield (t/ha)
Year
YearYear
1972
1972
1974
1974
1976
1976
1978
1978
1980
1980
1982
1982
1984
1984
1986
1986
1988
1988
1990
1990
1992
1992
1994
1994
1996
1996
1998
1998
2000
2000
2002
2002
2004
2004
2006
2006
2008
2008
Area
Prod
Yield
Area
Prod
Yield
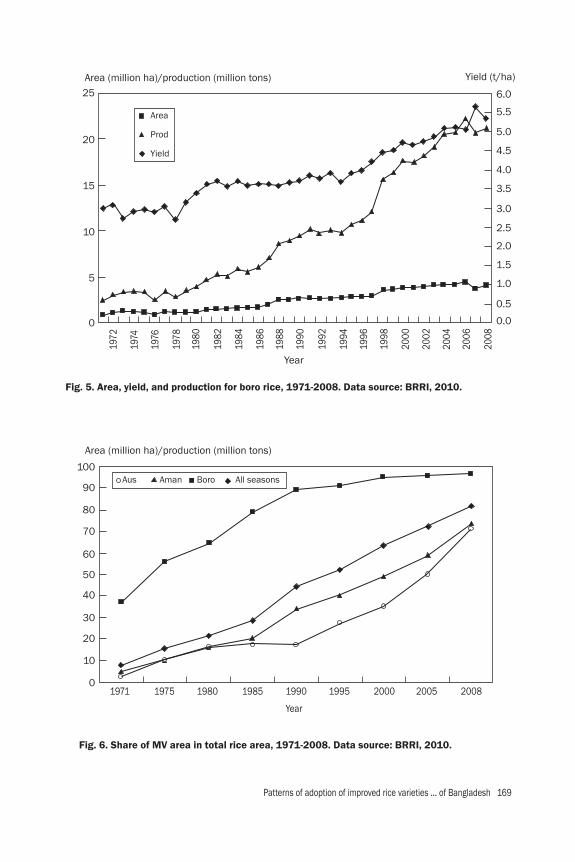
Patterns of adoption of improved rice varieties ... of Bangladesh 169
Aus Aman Boro All seasons
Fig. 5. Area, yield, and production for boro rice, 1971-2008. Data source: BRRI, 2010.
Fig. 6. Share of MV area in total rice area, 1971-2008. Data source: BRRI, 2010.
25
20
15
10
5
0
100
90
80
70
60
50
40
30
20
10
0
6.0
5.5
5.0
4.5
4.0
3.5
3.0
2.5
1.5
1.0
0.5
0.0
2.0
Area (million ha)/production (million tons)
Area (million ha)/production (million tons)
Yield (t/ha)
Year
1972
1974
1976
1978
1980
1982
1984
1986
1988
1990
1992
1994
1996
1998
2000
2002
2004
2006
2008
1971 1975 1980 1985 1990
Year
1995 2000 2005 2008
Area
Prod
Yield
170 M.R. Islam, M.A. Islam, M.S. Rahman, A. Salam, S. Alam, E. Harun, and M. Bool-Emerick
Site and stress characterization
Site and village descriptionLocation of sites. Bangladesh is a low-lying coastal country situated on the deltas of big rivers fl owing from the Himalayas. The large rivers Ganges, Brahmaputra, and Meghna converge in the delta and eventually fl ow into the Bay of Bengal. The major abiotic stresses affecting agriculture are submergence, drought, and salinity. Five key districts, Habiganj, Jamalpur, Kurigram, Rajshahi, and Satkhira, were selected to represent the stress-prone rice areas in Bangladesh (Fig. 7). Habiganj, Jamalpur, and Kurigram represent the submergence-prone rainfed rice environment while Rajshahi and Satkhira represent the drought-prone and saline-affected rice environments, respectively. In each district, two or more villages were selected to represent the rainfed rice production domain. The number of villages covered for each district varies depend-ing on spatial variability in the area. Satkhira, a village not affected by salinity, was identifi ed to allow comparison of rice production, crop management practices, and livelihood strategies between salinity-affected and nonsaline areas. Figure 7 shows the location of the sites representing the stress-prone rice areas in Bangladesh and Table 2 lists the selected districts and corresponding villages covered by the socioeconomic baseline survey. The survey is composed of 500 households from fi ve representative districts in Bangladesh. The households considered are those involved in rainfed rice farming and those that normally face a problem of submergence, drought, or salinity in rice production. In addition, the major occupation of the households selected in these districts is rice farming.
Description of the major abiotic stressThe characteristics of the major abiotic stress in selected districts are presented in Table 3. Submergence-prone areas are represented by three districts. In 2008, farmers in these locations did not experience submergence. The most recent fl ood as reported by farmers was in 2007 for Jamalpur and in 2004 for Habiganj and Kurigram. Sub-mergence often occurs during the aman season in August and September, when rice crops are at the seedling or vegetative stage. The duration and depth of submergence vary across villages as some experience multiple fl ooding. According to farmers’ estimates, the 2007 submergence affected more than 75% of the rice area in selected villages in Jamalpur while the 2004 submergence affected 55–75% of the total rice area in selected villages in Habiganj and Kurigram. The number of households affected by the stress in Habiganj and Kurigram was 40–50% while a majority of the sample households in selected villages of Jamalpur were affected by the 2007 submergence. Rajshahi is located in the northwestern part of Bangladesh where drought often occurs. Most farmers in these drought-prone areas are poor and most rely on rainfall to irrigate their crops. Depending on the degree and timing of drought, crops can be partially or completely damaged, causing signifi cant losses in farmers’ livelihood.
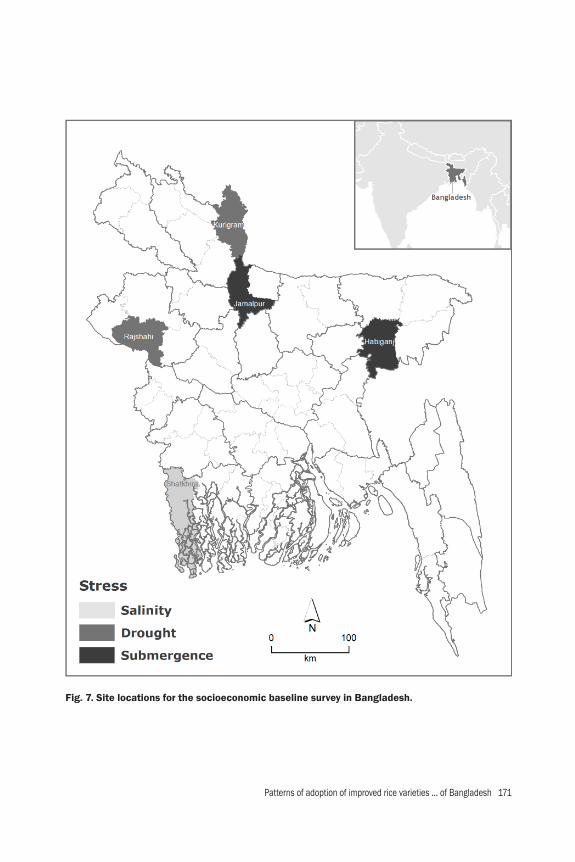
Patterns of adoption of improved rice varieties ... of Bangladesh 171
Fig. 7. Site locations for the socioeconomic baseline survey in Bangladesh.

172 M.R. Islam, M.A. Islam, M.S. Rahman, A. Salam, S. Alam, E. Harun, and M. Bool-Emerick
Table 2. Selected survey sites representing stress-prone rice areas in Bangladesh.
Stress District Villages Sample size
Institution
Submergence Habiganj Suraboi, Nurpur, Purasanda 100 BRRI
Jamalpur Titpolla, Sonakata 100 BAU
Kurigram Harirdanga, Fulbari 100 BRRI
Drought Rajshahi Agolpur, Balia Dung, Biroil, Borgitola, Dolia para, Edulpur, Giolmari, Gohoma-bona, Jaoipara, Kamlapur, Lalmatia, Malompara, Norsingor Adorsho, Sha-hana para, Shreerampur
100 BRRI
Salinity Satkhira Atulia, Beajua, Biralaxmi, Hogla, Joypot-rokati, Sreedharkati
100 BRRI
Total 5 29 500
Table 3. Stress characteristics in survey locations.a
Item Jamalpur Habiganj Kurigram Rajshahi Satkhira
Stress Submergence Submergence Submergence Drought Salinity
Rice produc-tion in 2008
Normal Normal Normal Normal n/a
Most recent stress
2007 2004 2004 2006 n/a
Frequency in 10 years
2 2 2 4 n/a
Season affected
Aman Aman Aman Aman Boro
Duration 40 days 60 days 20‒30 days 15‒30 days n/a
Depth of fl ood (m)
1.8‒2.1 1.8‒2.1 1.8‒2.1 n/a n/a
Stages of crop affected by stress
25 days after transplanting
Seedling Seedling Seedling, fl owering
Panicle initia-tion
% Rice area affected by most recent stress
>75 75 55 70–80 60
% Households affected by stress
90 50 40–45 80 60
aNot applicable is denoted by n/a.Source: STRASA focus group discussion, 2008.
Patterns of adoption of improved rice varieties ... of Bangladesh 173
Drought occurred 4 times in the last 10 years in selected villages in Rajshahi. The most recent drought was experienced in 2006, which affected 70–80% of the villages’ total rice areas and 80% of the households. More than 30% of the net cultivable area in Bangladesh is on the coast. Out of 2.85 million hectares of coastal and off-shore areas, about 0.833 million hectares of arable land are affected by varying degrees of soil salinity (Karim et al 1990). The soil becomes saline as it is exposed to sea water and continues to be inundated during high tides. As cited by Haque (2006), the factors that contribute signifi cantly to the development of saline soils are tidal fl ooding during the wet season (June-October), direct inundation by saline or brackish water, and upward or lateral movement of saline groundwater during the dry season (November-May). Soil salinity limits rice production, especially during the boro season when salinity is high. Rice production is less affected by salinity during the aman season when salts are fl ushed off by the monsoon rains. However, the problem of high salt concentration during the initial stage of crop growth remains a major obstacle to increasing production in rice-growing coastal areas during the boro season. In Satkhira, sample farmers reported that 60% of the total rice area is affected by salinity (focus group discussion, 2008). Depending on the severity of abiotic stresses, the occurrence of these stresses can cause substantial reductions in yield. Based on focus group discussions, sample farmers revealed a 40% to 50% decrease in yield during stress years in submergence-prone areas. During normal years, farmers get 3.5 to 4.2 t/ha of rice during aman, whereas, under stress conditions, farmers can get only 1.7–2.3 t/ha. In drought-prone areas, farmers estimated a 49% yield reduction in the event of drought. On average, rice yield during normal years in aman is 3.5 t/ha and during a stress year is 1.8 t/ha. On the other hand, the yield difference between salinity-affected and nonsaline sites in Satkhira is around 23% during the boro season (Table 4). Cropping calendar and major crops. Based on focus group interviews, rice can be grown in three overlapping seasons (Fig. 8). Planting during the aus season starts in April while harvesting is done around July to August. Farmers grow transplanted aman rice from June to December while boro rice is planted in December and harvested in May/June. Rice is the major crop during aman and boro seasons while nonrice crops such as potato, tomato, jute, and wheat are also grown during the aus season.
Farm-level analysis
Socio-demographic characteristicsEthnicity. A majority of the sample households at the survey sites are Muslims except in Kurigram and Rajshahi, where 30% of the households interviewed belong to Hindu or other ethnic groups (Table 5). Kurigram and Rajshahi are located along the bound-aries of the country, bordering some Indian districts. Migration of people across the border may explain the variety of ethnic groups in the district. Respondents by gender, age, and education. The respondents interviewed are mostly household heads or those who are active and knowledgeable in rice farming
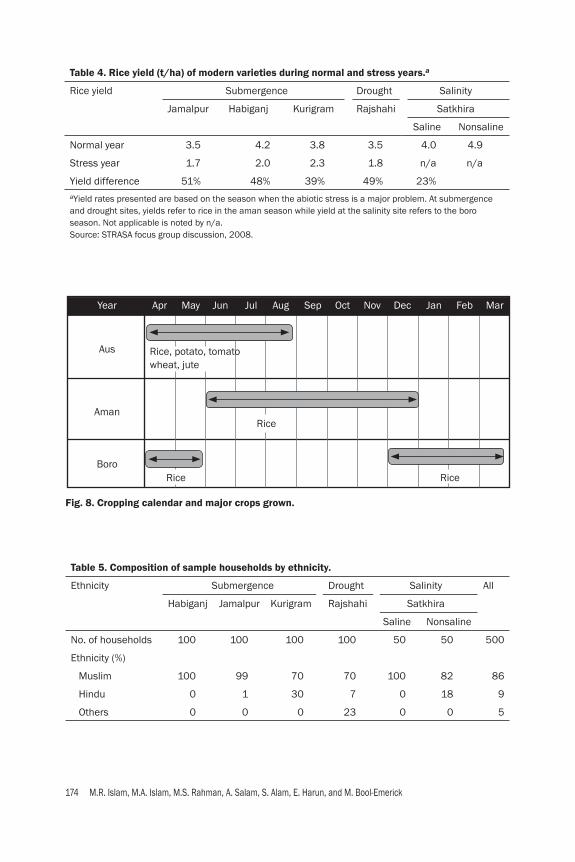
174 M.R. Islam, M.A. Islam, M.S. Rahman, A. Salam, S. Alam, E. Harun, and M. Bool-Emerick
Fig. 8. Cropping calendar and major crops grown.
Table 5. Composition of sample households by ethnicity.
Ethnicity Submergence Drought Salinity All
Habiganj Jamalpur Kurigram Rajshahi Satkhira
Saline Nonsaline
No. of households 100 100 100 100 50 50 500
Ethnicity (%)
Muslim 100 99 70 70 100 82 86
Hindu 0 1 30 7 0 18 9
Others 0 0 0 23 0 0 5
Table 4. Rice yield (t/ha) of modern varieties during normal and stress years.a
Rice yield Submergence Drought Salinity
Jamalpur Habiganj Kurigram Rajshahi Satkhira
Saline Nonsaline
Normal year 3.5 4.2 3.8 3.5 4.0 4.9
Stress year 1.7 2.0 2.3 1.8 n/a n/a
Yield difference 51% 48% 39% 49% 23%aYield rates presented are based on the season when the abiotic stress is a major problem. At submergence and drought sites, yields refer to rice in the aman season while yield at the salinity site refers to the boro season. Not applicable is noted by n/a.Source: STRASA focus group discussion, 2008.
Year
Aus
Aman
Boro
Apr May Jun Jul Aug Sep Oct Nov Dec Jan Feb Mar
Rice
RiceRice
Rice, potato, tomatowheat, jute

Patterns of adoption of improved rice varieties ... of Bangladesh 175
during the survey year. Most of the respondents are men and only 2% are women. On average, the respondents are around 44 years old and have 4–6 years of education for males and 0–3 years of education for females (Table 6). The small number of females representing the households and low average number of schooling years among female respondents refl ect the patriarchy system or male dominance within domestic units in Bangladesh. With the increasing roles of women in agriculture, improvements in educational status could be a stepping stone toward empowerment. Women’s roles and participa-tion in decision-making are presented in the latter section of this report. Household characteristics. Table 7 shows the general characteristics of the selected households. Average household size ranges from 4 to 6 members with the number of male members dominating the number of females by 10%. Seventy percent of the total number of household members are adults (more than 15 years old) with 6 years of formal schooling on average. Moreover, results show an education gap of two years between the male and female adult members of the household. Occupation. More than 65% of the household members are composed of adults 15 to 65 years old. Farming is the major activity of adults, especially in Kurigram and Rajshahi, where more than 80% of the adult members are engaged in farm-related activities (Table 8). Other primary employment as reported in the survey includes salaried jobs, labor services, and small-scale business such as the operation of small shops.
Table 6. General characteristics of the respondents.
Respondents’ characteristics
Submergence Drought Salinity All
Habiganj Jamalpur Kurigram RajshahiSatkhira
Saline Nonsa-line
No. of households 100 100 100 100 50 50 500
Age (years) 46 43 45 43 42 41 44
Gender of respondent
% Males 100 98 100 97 98 96 98
% Females 0 2 0 3 2 4 2
No. of years of schooling
Males 6 5 6 4 6 5 5
Females – 0 – 3 3 0 2
All 6 5 6 4 6 5 5

176 M.R. Islam, M.A. Islam, M.S. Rahman, A. Salam, S. Alam, E. Harun, and M. Bool-Emerick
Tabl
e 7.
Gen
eral
cha
ract
eris
tics
of t
he s
ampl
e ho
useh
olds
.H
ouse
hold
s’ c
hara
cter
istic
s
Subm
erge
nce
Dro
ught
Sal
inity
All
Hab
igan
jJa
mal
pur
Kur
igra
mR
ajsh
ahi
Satk
hira
Salin
eN
onsa
line
No.
of h
ouse
hold
s10
010
010
010
05
05
05
00
Av. h
ouse
hold
siz
e6
54
56
55
Hou
seho
ld c
ompo
sitio
n %
Mal
es5
45
557
55
53
55
55
% F
emal
es4
64
54
34
547
45
45
Age
grou
p (%
)B
elow
16
yea
rs o
ld3
32
927
30
29
29
30
16 to
50
yea
rs o
ld5
56
06
361
58
56
59
> 5
0 y
ears
old
12
1110
913
1511
Year
s of
sch
oolin
ga
Mal
es7
77
67
67
Fem
ales
65
55
54
5Al
l7
66
56
56
a Adu
lt m
embe
rs o
nly
(age
is 1
6 y
ears
and
old
er).
Tabl
e 8.
Em
ploy
men
t (%
) of a
dult
hou
seho
ld m
embe
rs (o
nly
betw
een
16 a
nd 6
5 ye
ars
old)
.Pr
imar
y oc
cupa
tion
Subm
erge
nce
Dro
ught
Salin
ityAl
lH
abig
anj
Jam
alpu
rK
urig
ram
Raj
shah
iSa
tkhi
raSa
line
Non
salin
eFa
rmin
g ac
tiviti
es61
65
95
82
67
80
75
Smal
l-sca
le b
usin
ess
2110
12
1310
9Sa
larie
d jo
bs0
170
02
34
Serv
ices
82
311
137
7O
ther
sa10
61
55
05
Tota
l10
010
010
010
010
010
010
0a O
ther
occ
upat
ions
incl
ude fi s
hing
, liv
esto
ck p
rodu
ctio
n, m
ason
, fac
tory
wor
ker,
woo
d en
grav
er, a
nd d
river
.
Patterns of adoption of improved rice varieties ... of Bangladesh 177
Farm land characteristicsLandholdings. Table 9 shows the general characteristics of the households’ landhold-ings. The average farm sizes of sample households in the districts range from 0.4 to 1.2 ha. Generally, farms are further divided into 3 to 5 parcels based on agroecological characteristics. The parcel area of the sample household ranges from 0.1 to 0.4 ha. Based on Table 9, sample households in Kurigram have the smallest average farm size while sample households in Rajshahi and Satkhira (saline site) have the largest farms, with areas of more than 1.0 ha on average. The farm size distribution of selected households in different stress-prone environments is given in Figure 9. The distribution shows that farm sizes are mostly positively skewed, meaning that the farm size of most households is below the aver-age. Around 80% of the samples at submergence-prone sites have landholding that is less than 1.0 ha while the farm size of sample households at the drought site has a wider distribution. Similarly, farm size distribution among households in saline areas in Satkhira is wider than that of households in the nonsaline group. These fi ndings indicate inequality in land endowments of the sample rice farming households both within and across stress-prone environments. Land tenure. Table 9 shows that most sample households own their farms ex-cept in Rajshahi, where most farmers interviewed are landless. Much of the rice area in Rajshahi is owned by absentee landlords or is sharecropped (73%) while 80% to 90% of the lands are owned by sample farmers in Jamalpur, Kurigram, Habiganj, and Satkhira. Land type. The type of abiotic stress affecting an area may depend on its land type. In submergence areas, the proportion of land under lowland conditions is 32% to 55% while the share of lowland in drought area is only 15%. This is consistent with the conventional wisdom that low-lying lands are prone to submergence while those in relatively higher parts of the toposequence are drought-prone. Medium land consists of 69% of the land at drought-prone sites and only 13% to 49% of the land at submergence-prone sites. In Satkhira, most lands are under medium land conditions, which comprise more than 80% of the total land area of the sample households. Irrigation and land use. Crop cultivation during the boro season is made pos-sible by the availability of irrigation facilities such as low-lift pumps, deep tube wells, and shallow tube wells. Low-lift pumps and shallow/deep tube wells are the common sources of irrigation in Bangladesh. In fact, more than 80% of the total irrigated area in 2008 was irrigated by tube wells. Table 9 shows that sample households in submer-gence and saline areas are able to provide irrigation to most of their farm while only 56% of the farms receive irrigation in drought-prone areas during the boro season. Generally, irrigation is not required in the aman season as there is enough rainfall for farmers to use in watering the crops. Table 10 shows that cropped area during the aman season is about 90% or more at most sites. However, during the boro season, small areas are planted in drought-prone and saline areas. The small area under crops in Rajshahi and Satkhira (saline site) can be attributed to the limited area irrigated during the boro season. Most crops

178 M.R. Islam, M.A. Islam, M.S. Rahman, A. Salam, S. Alam, E. Harun, and M. Bool-Emerick
Tabl
e 9.
Gen
eral
farm
cha
ract
eris
tics
.
Farm
cha
ract
eris
tics
Subm
erge
nce
Dro
ught
Salin
ityAl
l
Hab
igan
jJa
mal
pur
Kur
igra
mR
ajsh
ahi
Satk
hira
Salin
eN
onsa
line
Av. f
arm
siz
e (h
a)0
.80
.90
.41.
21.
10
.50
.8
Av. n
o. o
f par
cels
per h
ouse
hold
45
43
44
4
Av. p
arce
l are
a (h
a)0
.20
.20
.10
.40
.30
.10
.2
Area
by
tenu
re (%
)
Ow
ned
79
90
89
278
38
46
9
Ren
ted-
ina
199
117
317
163
0
Ren
ted-
out
21
00
00
1
Area
by
land
type
(%)
Upl
and
1924
32
160
.111
18
Med
ium
land
49
30
136
99
9.8
85
56
Low
land
32
46
55
150
.14
26
Irrig
ated
are
a (%
)
Aman
sea
son
06
04
80
015
Bor
o se
ason
100
99
100
56
100
100
87a I
nclu
des
shar
ecro
ppin
g, g
over
nmen
t-ow
ned,
and
mor
tgag
ed-in
.

Patterns of adoption of improved rice varieties ... of Bangladesh 179
0
30
30
Percent
Submergence
Salinity
Drought
Nonsaline
20
20
10
10
0
0
02 24 46
Farm size (in ha)
6
Fig. 9. Farm size distribution of sample households by different stress environments. Data source: STRASA baseline survey, 2008.
are grown during the aman season at the saline site because of low salinity during the aman season. During the boro season, the degree of salt accumulation in the soil caused by seawater intrusion becomes severe. As a result, fi elds become less suitable for crop cultivation. During the boro season, cropped area is limited at the salinity-affected site where only 12% of the total area is grown to crops.
Characteristics of the rice-based cropping systemRice is the main crop during aman and boro seasons. Cultivation of a third crop is also reported at some of the survey sites. Cropped area in the aus season accounts for only 1% to 16% of the land area. Major crops grown during aus are rice, potato, wheat, jute, and tomato.
Table 10. Proportion of cropped area (%) to total land area by season.a
Cropped area Submergence Drought Salinity All
Habiganj Jamalpur Kurigram Rajshahi Satkhira
Saline Nonsaline
Aman 89 92 96 91 92 79 91
Boro 88 98 95 56 12 95 72
Aus 0 1 3 16 0 0 5aRemaining areas not cropped are either kept fallow or rented out.

180 M.R. Islam, M.A. Islam, M.S. Rahman, A. Salam, S. Alam, E. Harun, and M. Bool-Emerick
The predominant cropping pattern in most areas is rice-rice while the major cropping pattern at the salt-affected site is rice-fallow. Other cropping sequences observed are rice-rice-potato, rice-rice-jute, rice-rice-tomato, and others. However, rice is the sole crop cultivated in saline-affected areas. The cropping patterns show the importance of rice as the main staple food in Bangladesh. The major nonrice crops in each sample district are potato in Habiganj, potato and jute in Jamalpur and Kurigram, tomato and wheat in Rajshahi, and potato and sugarcane in nonsaline areas in Satkhira. Table 11 shows the cropping intensity (CI) index as given by the proportion of gross cropped area to the total net cropped area. The gross cropped area is the total area planted to crops in all seasons while the net cropped area is the total operational area. Results show that the degree of intensifi cation at all survey sites except for saline-affected areas in Satkhira is more than 160%, which implies that most farm-ers cultivate their land twice a year. On the other hand, the CI index at the saline site shows that most farmers are monocropping and cultivate rice only during the aman season. In fact, only 54% of the farmers are able to grow boro rice.
Patterns of rice varietal adoptionCombination of rice types grown. Farmers may grow a combination of rice varieties such as a modern rice variety (MV) in one parcel and a traditional variety (TV) in another parcel. Results show that most households grow MVs only in all rice parcels during both the aman and boro seasons except in Kurigram, where more than 54% of the farmers grew both MVs and TVs during the aman season (Table 12). In Satkhira, most farmers grew MV rice only during the aman season. Farmers who were able to grow boro rice also grew MVs and 11% of the sample farmers adopted hybrid rice in the boro season in selected saline areas. Rice area by season and land type. Based on Table 13, around 50% of the gross rice area is planted to aman rice and boro rice at submergence-prone and nonsaline sites. In Satkhira, 89% of the gross rice area at the saline site is planted to aman rice while a very small area is planted to boro rice. Salinity is relatively more severe dur-ing the boro season as there is not enough rainfall to fl ush out the salts in the soil. As a result, rice cultivation is constrained and only households with available irrigation sources are able to grow rice during the boro season. On the other hand, 60% of the gross rice area is planted during the aman season in Rajshahi while only 36% is planted during the boro season. Rice is mostly transplanted but a small area under broadcast rice is reported in Rajshahi. Based on Table 14, modern rice varieties dominate the total rice area during the aman season in all districts. On average, MVs cover more than 90% of the total rice area of the selected households except in Kurigram, where MVs cover only about two-thirds of the total rice area during the aman season. In Kurigram, more than 35% of the total aman rice area is grown to Aloi, a traditional variety. However, only a few farmers are growing traditional rice varieties and most are adopting high-yielding rice varieties such as MVs and hybrid rice during the boro season. In Kurigram, rice farmers grow MVs and TVs during aman and MVs and
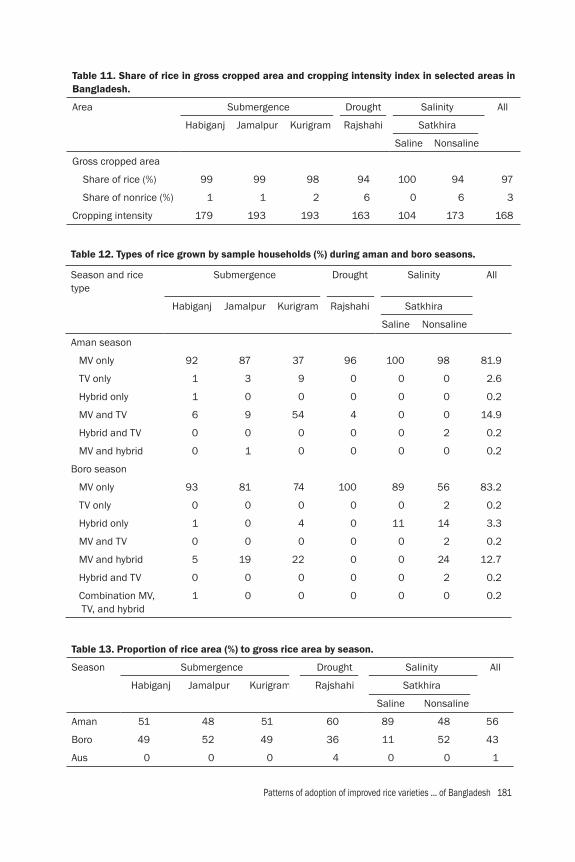
Patterns of adoption of improved rice varieties ... of Bangladesh 181
Table 12. Types of rice grown by sample households (%) during aman and boro seasons.
Season and rice type
Submergence Drought Salinity All
Habiganj Jamalpur Kurigram Rajshahi Satkhira
Saline Nonsaline
Aman season
MV only 92 87 37 96 100 98 81.9
TV only 1 3 9 0 0 0 2.6
Hybrid only 1 0 0 0 0 0 0.2
MV and TV 6 9 54 4 0 0 14.9
Hybrid and TV 0 0 0 0 0 2 0.2
MV and hybrid 0 1 0 0 0 0 0.2
Boro season
MV only 93 81 74 100 89 56 83.2
TV only 0 0 0 0 0 2 0.2
Hybrid only 1 0 4 0 11 14 3.3
MV and TV 0 0 0 0 0 2 0.2
MV and hybrid 5 19 22 0 0 24 12.7
Hybrid and TV 0 0 0 0 0 2 0.2
Combination MV, TV, and hybrid
1 0 0 0 0 0 0.2
Table 13. Proportion of rice area (%) to gross rice area by season.
Season Submergence Drought Salinity All
Habiganj Jamalpur Kurigram Rajshahi Satkhira
Saline Nonsaline
Aman 51 48 51 60 89 48 56
Boro 49 52 49 36 11 52 43
Aus 0 0 0 4 0 0 1
Table 11. Share of rice in gross cropped area and cropping intensity index in selected areas in Bangladesh.
Area Submergence Drought Salinity All
Habiganj Jamalpur Kurigram Rajshahi Satkhira
Saline Nonsaline
Gross cropped area
Share of rice (%) 99 99 98 94 100 94 97
Share of nonrice (%) 1 1 2 6 0 6 3
Cropping intensity 179 193 193 163 104 173 168
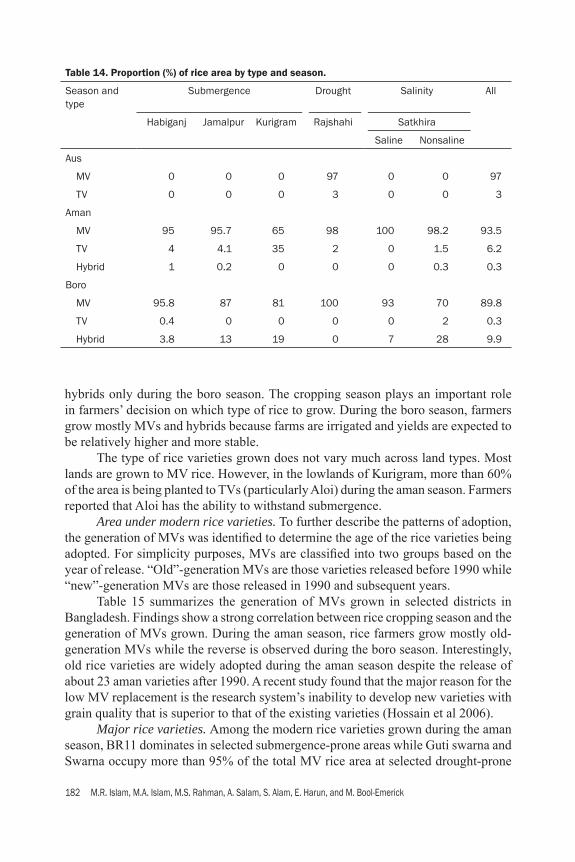
182 M.R. Islam, M.A. Islam, M.S. Rahman, A. Salam, S. Alam, E. Harun, and M. Bool-Emerick
hybrids only during the boro season. The cropping season plays an important role in farmers’ decision on which type of rice to grow. During the boro season, farmers grow mostly MVs and hybrids because farms are irrigated and yields are expected to be relatively higher and more stable. The type of rice varieties grown does not vary much across land types. Most lands are grown to MV rice. However, in the lowlands of Kurigram, more than 60% of the area is being planted to TVs (particularly Aloi) during the aman season. Farmers reported that Aloi has the ability to withstand submergence. Area under modern rice varieties. To further describe the patterns of adoption, the generation of MVs was identifi ed to determine the age of the rice varieties being adopted. For simplicity purposes, MVs are classifi ed into two groups based on the year of release. “Old”-generation MVs are those varieties released before 1990 while “new”-generation MVs are those released in 1990 and subsequent years. Table 15 summarizes the generation of MVs grown in selected districts in Bangladesh. Findings show a strong correlation between rice cropping season and the generation of MVs grown. During the aman season, rice farmers grow mostly old-generation MVs while the reverse is observed during the boro season. Interestingly, old rice varieties are widely adopted during the aman season despite the release of about 23 aman varieties after 1990. A recent study found that the major reason for the low MV replacement is the research system’s inability to develop new varieties with grain quality that is superior to that of the existing varieties (Hossain et al 2006). Major rice varieties. Among the modern rice varieties grown during the aman season, BR11 dominates in selected submergence-prone areas while Guti swarna and Swarna occupy more than 95% of the total MV rice area at selected drought-prone
Table 14. Proportion (%) of rice area by type and season.
Season and type
Submergence
Drought Salinity All
Habiganj Jamalpur Kurigram Rajshahi Satkhira
Saline Nonsaline
Aus
MV 0 0 0 97 0 0 97
TV 0 0 0 3 0 0 3
Aman
MV 95 95.7 65 98 100 98.2 93.5
TV 4 4.1 35 2 0 1.5 6.2
Hybrid 1 0.2 0 0 0 0.3 0.3
Boro
MV 95.8 87 81 100 93 70 89.8
TV 0.4 0 0 0 0 2 0.3
Hybrid 3.8 13 19 0 7 28 9.9

Patterns of adoption of improved rice varieties ... of Bangladesh 183
sites. On the other hand, BR10, a very popular rice variety in the southern region, is the predominant variety in the saline-affected villages in Satkhira (Table 16). BR11 is an old-generation rice variety that has an average growth duration of 145 days and 115-cm plant height (Adhunik Dhaner Chas, BRRI 2007, as cited by Hossain et al 2009). The major boro rice varieties cultivated in selected stress-prone districts are presented in Table 17. During the boro season, new-generation MVs dominate the rice areas in Bangladesh. Rice mega-varieties such as BRRI dhan28 and BRRI dhan29 are very popular, covering 91% of the total MV rice area of the sample farmers. The average growth duration of BRRI dhan28 and BRRI dhan 29 is 140 days and 165 days, respectively. The plant height of these boro rice varieties is 90 to 95 cm (Adhunik Dhaner Chas, BRRI 2007, as cited by Hossain et al 2009). The crop duration of rice mega-varieties BR11 and BR28 is similar. However, plant height characteristics of these varieties are different. During the boro season, the mega-varieties adopted have relatively shorter plant height while taller varieties are grown during the aman season. This may imply that taller varieties are not needed during the boro season when the risk of submergence is very low. Out of 71 modern rice varieties5 released by the different institutions in Ban-gladesh, only 5 dominate during the boro and aman seasons. The major aman rice varieties, BR10, BR11, and Guti swarna, were released in 1980 while the popular boro rice varieties, BRRI dhan28 and BRRI dhan29, were released in 1994. This shows that rice varieties released 30 years ago are still being adopted and the adoption of old varieties is high during the aman season.
Yield effects by type and generationTable 18 shows the yields of different types of rice during the aman and boro season. Generally, rice yields during the boro season are relatively higher than yields in the aman season. High yields can be attributed to the more favorable rice production
5As of 2010, 71 rice varieties were released in Bangladesh. This includes four hybrid rice varieties released by BRRI (Appendix 1).
Table 15. Percent of MV rice area by generation and season.
MV generationa Submergence Drought Salinity All
Habiganj Jamalpur Kurigram Rajshahi Satkhira
Saline Nonsaline
Aman
Old 94 92 98 96 90 83 93
New 6 8 2 4 10 17 7
Boro
Old 1 12 12 5 0 1 7
New 99 88 88 95 100 99 93aNew-generation MVs occupy 59% of the area grown to MV rice during the aus season in Rajshahi.

184 M.R. Islam, M.A. Islam, M.S. Rahman, A. Salam, S. Alam, E. Harun, and M. Bool-Emerick
Table 16. Percent of MV area under new- and old-generation rice varieties in the aman season.
Variety and type Submergence Drought Salinity All
Habiganj Jamalpur Kurigram Rajshahi Satkhira
Saline Nonsaline
Old generation
BR10 0 1 0 0 87 19 14
BR11 63 69 93 0 1 9 35
BR14 0 0 0 0 0 0 0
BR22 22 0 1 0 0 6 4
BR23 0 4 0 0 2 49 4
Guti swarna 0 0 0 88 0 0 27
Swarna 0 0 5 8 0 0 3
Pajam 9 17 0 0 0 0 6
Parijat 0 0 0 0 0 0 0
All 94 92 98 96 90 83 93
New generation
BRRI dhan28 0 0 0 1 0 0 0
BRRI dhan29 0 0 0 0 0 0 0
BRRI dhan30 0 0 0 0 10 17 3
BRRI dhan32 0 0 0 1 0 0 1
BRRI dhan34 2 0 0 0 0 0 0
BRRI dhan39 0 0 0 2 0 0 1
BRRI dhan40 3 4 0 0 0 0 1
BRRI dhan41 0 2 2 0 0 0 1
BRRI dhan50 1 0 0 0 0 0 0
Others 0 2 0 1 0 0 1
All 6 8 2 4 10 17 7

Patterns of adoption of improved rice varieties ... of Bangladesh 185
Table 17. Percent of MV area under new- and old-generation rice varieties in the boro season.
Variety and type Submergence Drought Salinity All
Habiganj Jamalpur Kurigram Rajshahi Satkhira
Saline Nonsaline
Old generation
BR14 0 12 12 0 0 0 5
Others 1 0 0 5 0 1 2
All 1 12 12 5 0 1 7
New generation
BRRI dhan28 8 37 75 88 0 93 52
BRRI dhan29 87 51 13 0 97 6 38
Others 4 0 0 6 3 0 3
All 99 88 88 95 100 99 93
Table 18. Average rice yield (t/ha) by type and season.a
Season and type
Submergence
Drought Salinity All
Habiganj
Jamalpur
Kurigram
Rajshahi
Satkhira
Saline Nonsaline
Aman
MV 3.55 2.22 2.83 3.50 4.00 3.33 3.11
(1.10) (1.50) (1.40) (0.50) (1.00) (1.00) (1.30)
TV 3.57 1.69 1.15 2.58 – 4.98 1.53
(0.90) (1.30) (0.60) (0.80) (0.60) (1.10)
Hybrid 2.51 4.44 – – – 4.67 3.19
(0.20) n/a n/a (1.10)
All 3.54 2.20 2.26 3.48 4.00 3.38 2.96
(1.10) (1.50) (1.40) (0.50) (1.00) (1.10) (1.40)
Boro
MV 4.50 5.06 5.32 4.49 5.50 5.85 5.02
(1.20) (1.00) (0.70) (0.60) (1.60) (1.10) (1.00)
TV 4.12 – – – – 5.00 4.85
n/a (0.50) (0.60)
Hybrid 4.90 6.29 6.39 – 4.97 6.47 6.24
(1.20) (0.80) (0.70) (0.80) (2.20) (1.40)
All 4.52 5.15 5.52 4.49 5.45 5.96 5.14
(1.20) (1.00) (0.80) (0.60) (1.50) (1.50) (1.10)aStandard deviation is given in parentheses. Not applicable or n/a is given when there is only one observation.
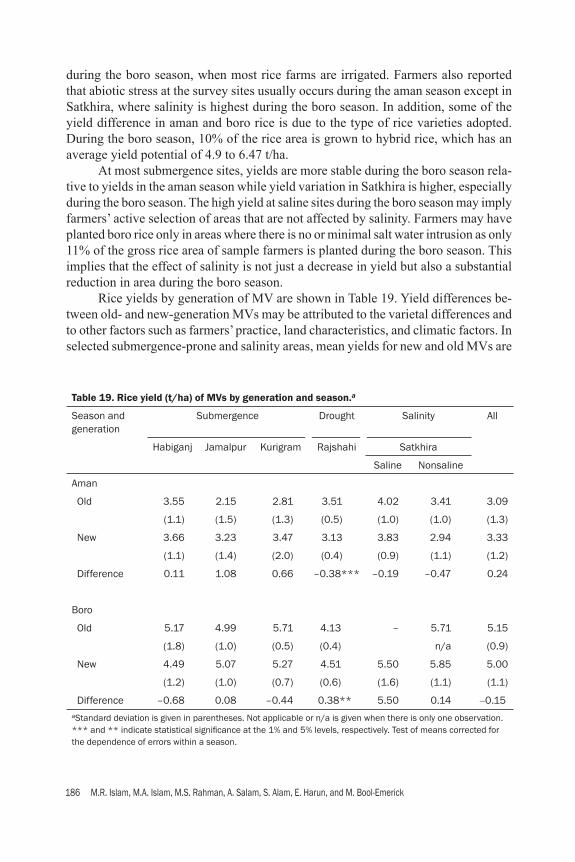
186 M.R. Islam, M.A. Islam, M.S. Rahman, A. Salam, S. Alam, E. Harun, and M. Bool-Emerick
during the boro season, when most rice farms are irrigated. Farmers also reported that abiotic stress at the survey sites usually occurs during the aman season except in Satkhira, where salinity is highest during the boro season. In addition, some of the yield difference in aman and boro rice is due to the type of rice varieties adopted. During the boro season, 10% of the rice area is grown to hybrid rice, which has an average yield potential of 4.9 to 6.47 t/ha. At most submergence sites, yields are more stable during the boro season rela-tive to yields in the aman season while yield variation in Satkhira is higher, especially during the boro season. The high yield at saline sites during the boro season may imply farmers’ active selection of areas that are not affected by salinity. Farmers may have planted boro rice only in areas where there is no or minimal salt water intrusion as only 11% of the gross rice area of sample farmers is planted during the boro season. This implies that the effect of salinity is not just a decrease in yield but also a substantial reduction in area during the boro season. Rice yields by generation of MV are shown in Table 19. Yield differences be-tween old- and new-generation MVs may be attributed to the varietal differences and to other factors such as farmers’ practice, land characteristics, and climatic factors. In selected submergence-prone and salinity areas, mean yields for new and old MVs are
Table 19. Rice yield (t/ha) of MVs by generation and season.a
Season and generation
Submergence
Drought Salinity All
Habiganj
Jamalpur
Kurigram Rajshahi
Satkhira
Saline Nonsaline
Aman
Old 3.55 2.15 2.81 3.51 4.02 3.41 3.09
(1.1) (1.5) (1.3) (0.5) (1.0) (1.0) (1.3)
New 3.66 3.23 3.47 3.13 3.83 2.94 3.33
(1.1) (1.4) (2.0) (0.4) (0.9) (1.1) (1.2)
Difference 0.11 1.08 0.66 –0.38*** –0.19 –0.47 0.24
Boro
Old 5.17 4.99 5.71 4.13 – 5.71 5.15
(1.8) (1.0) (0.5) (0.4) n/a (0.9)
New 4.49 5.07 5.27 4.51 5.50 5.85 5.00
(1.2) (1.0) (0.7) (0.6) (1.6) (1.1) (1.1)
Difference –0.68 0.08 –0.44 0.38** 5.50 0.14 ‒0.15aStandard deviation is given in parentheses. Not applicable or n/a is given when there is only one observation.*** and ** indicate statistical signifi cance at the 1% and 5% levels, respectively. Test of means corrected for the dependence of errors within a season.

Patterns of adoption of improved rice varieties ... of Bangladesh 187
not statistically different for both seasons. On the other hand, old MVs in Rajshahi outperform new-generation MVs by 12% during the aman season while new MVs yield 9% higher than old MVs during the boro season. During the aman season, a majority of the sample farmers in Rajshahi adopt old-generation MVs that yield more than new-generation MVs while, during the boro season, most sample farmers grow new-generation MVs that outperform old-generation MVs. This may imply that the new-generation MVs adopted in the aman season are inferior to the old mega-varieties such as Guti swarna.
Reasons for growing the dominant rice varietiesThe dominant rice varieties are BR10, BR11, and Guti swarna during the aman sea-son and BRRI dhan28 and BRRI dhan29 are the major rice varieties grown in the boro season. Farmers prefer these varieties for various reasons. Table 20 presents the characteristics farmers like about these rice varieties.
Table 20. Characteristics that farmers liked about their rice varieties.a
Season and characteristics Submergence Drought Salinity
Habiganj Jamalpur Kurigram Rajshahi Satkhira
(% of households)
Aman
Dominant rice variety BR11 BR11 BR11 Guti swarna BR10
Desirable characteristics
High yield 59 63 68 84 77
Does not lodge 3 0 4 0 0
Pest-tolerant 1 0 0 8 4
Good taste 0 13 4 9 84
Good grain 43 15 1 20 46
High market price 1 0 31 24 44
Others 3 33 5 50 11
Boro
Dominant rice variety BRRI dhan28 and 29
Desirable characteristics
High yield 72 72 24 35 83
Does not lodge 1 0 1 3 2
Pest-tolerant 14 3 2 0 3
Good taste 17 60 22 64 78
Good grain 23 65 18 34 44
High market price 5 25 71 63 54
Others 54 22 59 43 19aHouseholds were allowed to provide multiple answers. Each value represents the percentage of households reporting each characteristic.

188 M.R. Islam, M.A. Islam, M.S. Rahman, A. Salam, S. Alam, E. Harun, and M. Bool-Emerick
Results show that high yield, good grain quality, and high market price are the characteristics most farmers like about BR11 and Guti swarna. In Satkhira, 84% of the farmers indicated good taste as a desirable characteristic of BR10, a dominant aman rice variety. Similarly, farmers reported the same qualities they like about the major boro rice varieties, BRRI dhan28 and 29.
Adoption of new-generation MVsBased on the survey, MV coverage is at least 90% of the total rice area for all seasons. The pattern of MV adoption shows that rice varieties released before 1990 dominate the MV rice area in the aman season while new-generation MVs dominate the total MV area in the boro season. Moreover, mega-varieties dominate each cropping season, with BR11, BR10, and Guti swarna during the aman season and BRRI dhan28 and BRRI dhan29 during the boro season.6 The dominance of BR11 and BR10 during the aman season shows that rice varieties released 30 years ago are still being grown. Table 21 presents the popular aman and boro varieties from large-scale national sample surveys in 1979-81, 1990, 1995-96-1996-97, and 2000 as cited by Hossain et al (2006). Based on a survey in
6In analyzing technology adoption, two parametric models, probit and tobit, dominate the practice. However, the skewness of data on MV adoption in Bangladesh did not allow us to use such analysis. Instead, previous studies on varietal adoption patterns were reviewed.
Table 21. Popular boro and aman varieties from previous surveys.a
Survey years Institution (source) Popular rice varieties
Aman Boro
1979-81 International Fertilizer Development Corporation
PajamIR20
IR8Purbachi
BR1 BR1
BR3 BR3
1990 Agricultural Economics Division, BRRI BR11 (64%) Purbachi (21%)
Pajam (15%) BR3 (19%)
BR4 (8%) IR8 (12%)
1995-96,1996-97
Department of Agricultural Extension, BRRI
BR11 (52%)Pajam (10%)
BR14 (24%)BR3 (19%)
BR10 (10%) BR1 (9%)
BR23 (5%)
2000 IRRI and Bangladesh Institute of Development Studies
BR11 (42%)Swarna (23%)
BRRI dhan28 (11%)BR14 (11%)
Pajam (13%) BRRI dhan29 (9%)
BR1 (7%)
BR8 (6%)aEstimates were based on a large sample survey as cited by Hossain et al (2006).

Patterns of adoption of improved rice varieties ... of Bangladesh 189
early 1970, the popular aman rice varieties were Pajam and IR20. In a 1990 survey, results showed that BR11 accounted for more than 60% of the total MV area, which may have indicated that some areas cultivated under Pajam and IR20 were replaced by this mega-variety, which has remained popular. Indian varieties such as Swarna and Guti swarna are the second most popular aman varieties in Bangladesh. Swarna was released in 1982 and was reported to enter Bangladesh through informal channels. Prior to the release of BRRI dhan28 and BRRI dhan29, the popular boro rice varieties based on estimates from large sample surveys were IR8, Purbachi, BR1, and BR14. Among the popular boro varieties, BR3 remained the variety with the highest yield potential until the release of BRRI dhan29. The yield potential of the varieties released by BRRI is given in Appendix 1. Because of their high-yield characteristic, BRRI dhan28 and 29 gained popularity among farmers during the boro season. Based on an IRRI-BIDS survey in 2000, the coverage of BRRI dhan28 and BRRI dhan29 reached 20% of the total MV area in the boro season, whereas, in the 2008 survey, these boro rice varieties occupied 90% of the total MV area during the boro season in selected stress-prone areas. The number of rice varieties released has been increasing in the past fi ve decades. In fact, almost 60% of the rice varieties were released after 1990 (Table 22). Despite the continued production of improved rice varieties in Bangladesh, farmers still grow old varieties, especially during the aman season. BR11 is still the mega-variety during the aman season even with the release of more than 40 varieties after 1990 (Table 23), of which 50% were aman varieties. The slow varietal replacement, especially during the aman season, is because none of the new-generation aman varieties has exceeded the 6.5 t/ha yield potential of BR11. This is also supported by the results in Table 19, which show that the difference in mean yields between old- and new-generation MVs are not statistically signifi cant in the aman season. According to Hossain et al (2006), Bangladeshi farmers replace MVs if the new ones are of shorter maturity and the yield surpasses that of the existing ones. Farmers prefer short-duration varieties, especially during the boro season, when there is not enough rainfall and supplemental irrigation is required. In addition, early-maturing rice varieties allow farmers to harvest early and cultivate a third crop. A signifi cant contribution in varietal development for the aman season was made in 2010 when the National Seed Board of the Ministry of Agriculture offi cially released the submergence-tolerant mega-varieties BRRI dhan51 (Swarna-Sub1) and BRRI dhan52 (BR11-Sub1). These Sub1 varieties are expected to replace the old aman varieties in subsequent years, especially in submergence-prone areas.
Economics of MV productionSeeds and chemical fertilizer use are presented in Table 24. Seed use per unit area does not vary by season but across locations. Farmers in selected submergence-prone areas use a relatively lower seed rate than sample farmers in selected drought-prone and salinity-affected areas. Farmers use low seed rates as a management option in
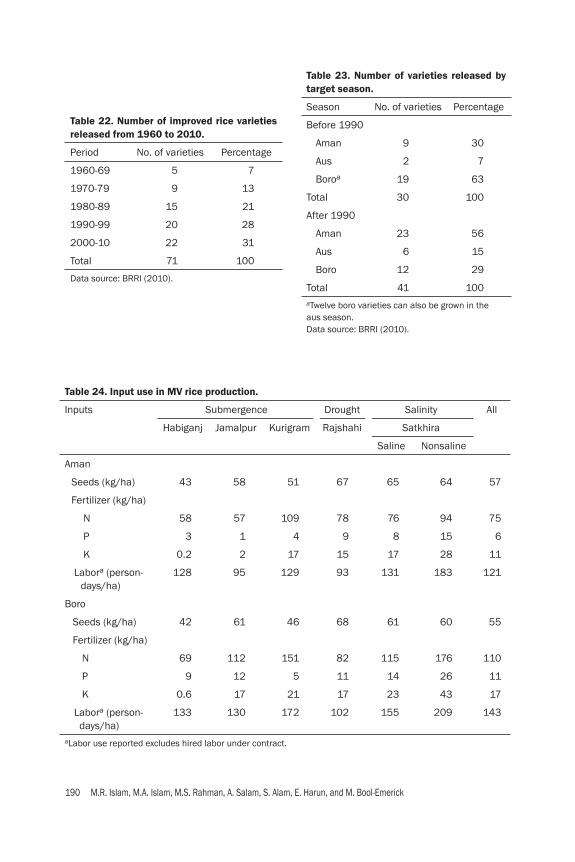
190 M.R. Islam, M.A. Islam, M.S. Rahman, A. Salam, S. Alam, E. Harun, and M. Bool-Emerick
Table 22. Number of improved rice varieties released from 1960 to 2010.
Period No. of varieties Percentage
1960-69 5 7
1970-79 9 13
1980-89 15 21
1990-99 20 28
2000-10 22 31
Total 71 100
Data source: BRRI (2010).
Table 23. Number of varieties released by target season.
Season No. of varieties Percentage
Before 1990
Aman 9 30
Aus 2 7
Boroa 19 63
Total 30 100
After 1990
Aman 23 56
Aus 6 15
Boro 12 29
Total 41 100aTwelve boro varieties can also be grown in the aus season.Data source: BRRI (2010).
Table 24. Input use in MV rice production.
Inputs Submergence Drought Salinity All
Habiganj
Jamalpur
Kurigram
Rajshahi
Satkhira
Saline Nonsaline
Aman
Seeds (kg/ha) 43 58 51 67 65 64 57
Fertilizer (kg/ha)
N 58 57 109 78 76 94 75
P 3 1 4 9 8 15 6
K 0.2 2 17 15 17 28 11
Labora (person-days/ha)
128 95 129 93 131 183 121
Boro
Seeds (kg/ha) 42 61 46 68 61 60 55
Fertilizer (kg/ha)
N 69 112 151 82 115 176 110
P 9 12 5 11 14 26 11
K 0.6 17 21 17 23 43 17
Labora (person-days/ha)
133 130 172 102 155 209 143
aLabor use reported excludes hired labor under contract.

Patterns of adoption of improved rice varieties ... of Bangladesh 191
submergence-prone areas because high seed rates could result in thinner and weaker seedlings that are more prone to early fl ood damage (Ismail 2009). Farmers use various chemical fertilizers such as urea, DAP, TSP, and MP. More-over, farmers also apply micronutrients such as gypsum and zinc. In general, fertilizer rate and labor use during the boro season are higher than in the aman season. Accord-ing to the results, N-fertilizer use is higher by an average of 35 kg/ha. The fertilizer rate for P and K is also higher by 5 kg/ha and 6 kg/ha, respectively, during the boro season. The average fertilizer use reported by the sample is more or less comparable to the fertilizer use cited by Gregory et al (2010). The mean fertilizer rates in 2007 were 103 kg/ha for N, 15 kg/ha for P2O5 (6.5 kg/ha P), and 12 kg/ha for K2O (10 kg/ha K). Aside from higher fertilizer rates during the boro season, labor use is also higher. On average, boro rice cultivation uses an additional 22 person-days/ha. The additional labor is used for activities such as weeding, irrigating crops, harvesting, and postharvest during the boro season (Tables 25 and 26). Appendices 2 and 3 show the input use by generation of MVs during aman and boro seasons, respectively. Based on the results, the average input use between old- and new-generation MVs did not vary much in each season.
Costs and returns analysis of rice production using modern varietiesRice production is the main source of livelihood in selected stress-prone districts. Table 27 presents the costs and returns of MV rice production in boro and aman sea-sons. Most farms are transplanted but there are cases (less than 1%) of direct seeding reported in Rajshahi. Labor costs comprise 30% to 73% of the total costs while power cost is 5% to 13% of the total costs (Appendix 4). Aside from land rent, fertilizer and irrigation costs comprise the bulk of material input costs during the boro season while fertilizer and seeds make up most of material input costs during the aman season. Imputed costs from own inputs and family labor account for 9% to 30% of the total cost of production. Net returns (above cash costs) from MV rice production vary by season and across sites. In general, net returns from rice production during the boro season are signifi cantly higher than in the aman season. This is often attributed to the more favor-able climate during the boro season. The variations in net income across sites could also be explained by various factors such as crop management practices of farmers, severity of stress, land characteristics, and others. Around 6% of the rice area during the aman season is planted to traditional rice varieties. The net returns (above cash costs) from traditional rice varieties average $100/ha during the aman season, whereas returns from MV production are $100/ha more. Table 27 shows the costs and returns of MV rice production. In representative submergence areas, sample households receive average net returns of $250/ha during aman and $600 during the boro season from rice production. On the other hand, sample households receive around $150/ha from aman rice cultivation and $300/ha from boro rice cultivation in selected drought-prone areas of Rajshahi. In saline-affected areas in
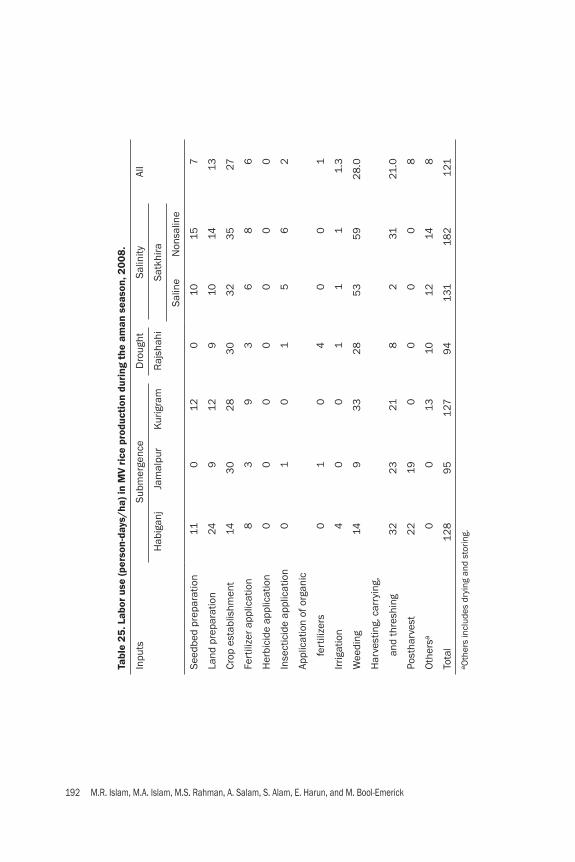
192 M.R. Islam, M.A. Islam, M.S. Rahman, A. Salam, S. Alam, E. Harun, and M. Bool-Emerick
Tabl
e 25
. Lab
or u
se (p
erso
n-da
ys/h
a) in
MV
rice
pro
duct
ion
duri
ng t
he a
man
sea
son,
200
8.
Inpu
tsSu
bmer
genc
eD
roug
htSa
linity
All
Hab
igan
jJa
mal
pur
Kur
igra
mR
ajsh
ahi
Satk
hira
Salin
eN
onsa
line
Seed
bed
prep
arat
ion
110
12
010
157
Land
pre
para
tion
249
12
910
1413
Crop
est
ablis
hmen
t14
30
28
30
32
35
27
Fert
ilize
r app
licat
ion
83
93
68
6
Her
bici
de a
pplic
atio
n0
00
00
00
Inse
ctic
ide
appl
icat
ion
01
01
56
2
Appl
icat
ion
of o
rgan
ic
f
ertil
izer
s0
10
40
01
Irrig
atio
n4
00
11
11.
3
Wee
ding
149
33
28
53
59
28
.0
Har
vest
ing,
car
ryin
g,
a
nd th
resh
ing
32
23
218
231
21.0
Post
harv
est
22
190
00
08
Oth
ersa
00
1310
12
148
Tota
l1
28
95
127
9413
118
21
21a O
ther
s in
clud
es d
ryin
g an
d st
orin
g.

Patterns of adoption of improved rice varieties ... of Bangladesh 193
Tabl
e 26
. Lab
or u
se (p
erso
n-da
ys/h
a) in
MV
rice
pro
duct
ion
duri
ng t
he b
oro
seas
on, 2
008.
a
Inpu
ts
Subm
erge
nce
Dro
ught
Salin
ityAl
l
Hab
igan
jJa
mal
pur
Kur
igra
mR
ajsh
ahi
Satk
hira
Salin
eN
onsa
line
Seed
bed
prep
arat
ion
110
12
01
215
7
Land
pre
para
tion
2410
119
1115
14
Crop
est
ablis
hmen
t14
32
30
313
64
02
8
Fert
ilize
r app
licat
ion
93
132
69
7
Her
bici
de a
pplic
atio
n0
20
10
01
Inse
ctic
ide
appl
icat
ion
02
02
57
2
Appl
icat
ion
of o
rgan
ic
fe
rtili
zers
05
05
00
2
Irrig
atio
n6
618
38
119
Wee
ding
1419
39
28
62
65
30
Har
vest
ing,
car
ryin
g, a
nd
thre
shin
g3
23
02
98
23
52
6
Post
harv
est
2421
20
1313
1419
Tota
l13
313
017
210
215
62
09
143
a Lab
or u
se re
port
ed e
xclu
des
hire
d la
bor u
nder
con
trac
t. Co
ntra
ct la
bor i
s co
mm
on in
Jam
alpu
r and
Raj
shah
i, es
peci
ally
in la
nd
prep
arat
ion,
cro
p es
tabl
ishm
ent,
harv
estin
g, a
nd th
resh
ing.
Low
labo
r use
in h
arve
stin
g ac
tiviti
es in
Raj
shah
i is
due
to c
ontr
act l
abor
. Se
edbe
d pr
epar
atio
n is
incl
uded
in la
nd p
repa
ratio
n in
Jam
alpu
r and
Raj
shah
i.
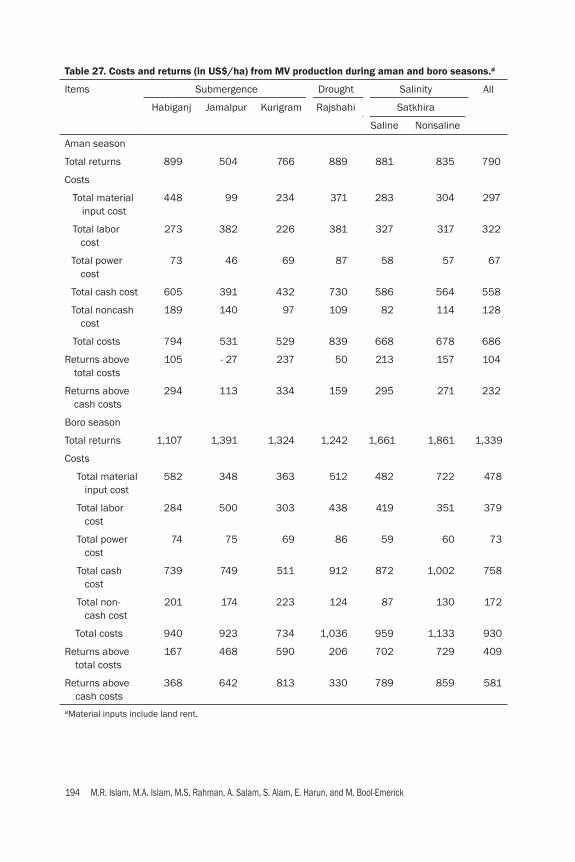
194 M.R. Islam, M.A. Islam, M.S. Rahman, A. Salam, S. Alam, E. Harun, and M. Bool-Emerick
Table 27. Costs and returns (in US$/ha) from MV production during aman and boro seasons.a
Items Submergence Drought Salinity All
Habiganj Jamalpur Kurigram Rajshahi Satkhira
Saline Nonsaline
Aman season
Total returns 899 504 766 889 881 835 790
Costs
Total material input cost
448 99 234 371 283 304 297
Total labor cost
273 382 226 381 327 317 322
Total power cost
73 46 69 87 58 57 67
Total cash cost 605 391 432 730 586 564 558
Total noncash cost
189 140 97 109 82 114 128
Total costs 794 531 529 839 668 678 686
Returns above total costs
105 - 27 237 50 213 157 104
Returns above cash costs
294 113 334 159 295 271 232
Boro season
Total returns 1,107 1,391 1,324 1,242 1,661 1,861 1,339
Costs
Total material input cost
582 348 363 512 482 722 478
Total labor cost
284 500 303 438 419 351 379
Total power cost
74 75 69 86 59 60 73
Total cash cost
739 749 511 912 872 1,002 758
Total non-cash cost
201 174 223 124 87 130 172
Total costs 940 923 734 1,036 959 1,133 930
Returns above total costs
167 468 590 206 702 729 409
Returns above cash costs
368 642 813 330 789 859 581
aMaterial inputs include land rent.
Patterns of adoption of improved rice varieties ... of Bangladesh 195
Satkhira, sample farmers grow only modern rice varieties and profi ts are around $300/ha from aman rice and $850/ha in the boro season. The profi tability of rice production during the boro season is not representative of the saline-affected areas in Satkhira. Rice cultivation is limited in the boro season because of high salinity and only farmers with access to irrigation are able to plant. In fact, only 11% of the sample rice area is grown to boro rice at salinity-affected sites. Table 28 presents the costs and returns by dominant MVs during the aman season. Most rice areas are grown to MVs, particularly old-generation MVs such as BR11, BR10, and Guti swarna. Generally, farmers planting these dominant rice varieties obtain higher gross returns than those farmers growing other MVs. On aver-age, farmers growing BR11, BR10, or Guti swarna during the aman season could get additional net income of around $50/ha. On the other hand, the dominant rice varieties grown are mostly new-generation MVs such as BRRI dhan28 and BRRI dhan29 during the boro season. Table 29 shows the costs and returns for the dominant boro rice varieties and other MVs. Cultivation of dominant MVs such as BRRI dhan28 and BRRI dhan29 during the boro season gives an additional $40/ha compared with other MVs during the boro season. How-ever, the difference in mean profi tability between old- and new-generation MVs is not statistically signifi cant except in salinity-affected areas during the aman season and in Kurigram in the boro season.
Crop production and disposalMost households interviewed sell a portion of their rice ouput in the market. In selected submergence-prone areas, households sell more than 50% of their rice production in the market while 31–43% is used for home consumption (Table 30). In selected drought-prone areas, 32% of the households sell rice in the market while the other 32% is used as payments. Note that most households in Rajshahi are landless farmers and about 73% of the lands are rented-in or sharecropped. A percentage of rice output is usually used as land rent payment. In saline-prone areas, households allocate as much as 65% for food and only 17% for selling. Also, households allocate around 15% as payments while only 17–20% is sold in the market. Because most farmers in selected saline areas cannot grow rice during the boro season, farmers allocate a substantial portion of the harvest for home consumption.
Different sources of incomeAside from crop production, households derive income from various activities. Table 31 summarizes the different sources of income of households in selected districts. At selected sites, 48–75% of the household income comes from rice production. The fairly large share of income coming from rice production highlights the importance of rice farming in the households’ livelihood. This suggests that any shock in rice produc-
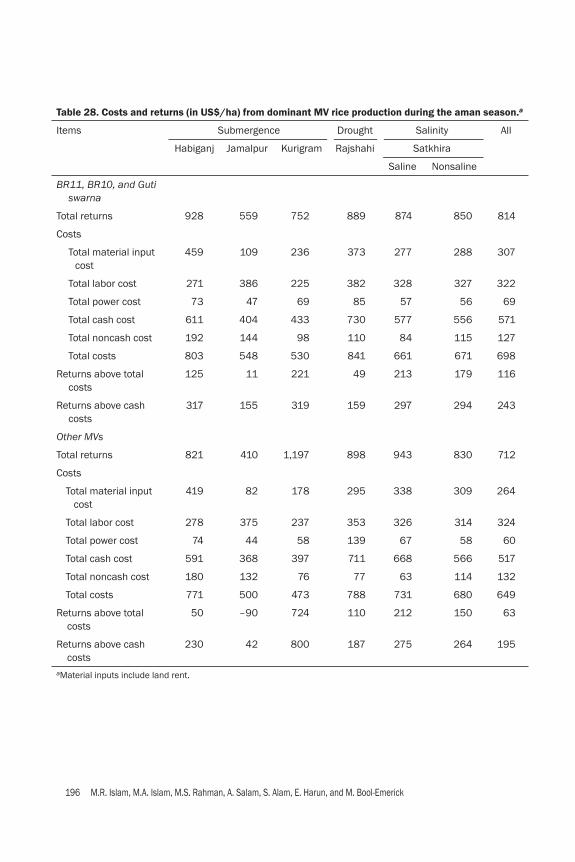
196 M.R. Islam, M.A. Islam, M.S. Rahman, A. Salam, S. Alam, E. Harun, and M. Bool-Emerick
Table 28. Costs and returns (in US$/ha) from dominant MV rice production during the aman season.a
Items Submergence Drought Salinity All
Habiganj Jamalpur Kurigram Rajshahi Satkhira
Saline Nonsaline
BR11, BR10, and Guti swarna
Total returns 928 559 752 889 874 850 814
Costs
Total material input cost
459 109 236 373 277 288 307
Total labor cost 271 386 225 382 328 327 322
Total power cost 73 47 69 85 57 56 69
Total cash cost 611 404 433 730 577 556 571
Total noncash cost 192 144 98 110 84 115 127
Total costs 803 548 530 841 661 671 698
Returns above total costs
125 11 221 49 213 179 116
Returns above cash costs
317 155 319 159 297 294 243
Other MVs
Total returns 821 410 1,197 898 943 830 712
Costs
Total material input cost
419 82 178 295 338 309 264
Total labor cost 278 375 237 353 326 314 324
Total power cost 74 44 58 139 67 58 60
Total cash cost 591 368 397 711 668 566 517
Total noncash cost 180 132 76 77 63 114 132
Total costs 771 500 473 788 731 680 649
Returns above total costs
50 –90 724 110 212 150 63
Returns above cash costs
230 42 800 187 275 264 195
aMaterial inputs include land rent.

Patterns of adoption of improved rice varieties ... of Bangladesh 197
Table 29. Costs and returns (in US$/ha) from dominant MV rice production during boro season.a
Items Submergence Drought Salinity All
Habiganj Jamalpur Kurigram Rajshahi Satkhira
Saline Nonsaline
BRRI dhan28 and 29
Total returns 1,110 1,422 1,315 1,241 1,677 1,861 1,345
Costs
Total material input cost
585 344 365 507 485 722 484
Total labor cost 286 505 302 443 422 351 378
Total power cost 74 74 69 85 60 60 73
Total cash cost 742 744 514 910 880 1,002 762
Total noncash cost 203 178 222 124 87 130 173
Total costs 945 922 736 1,034 967 1,133 935
Returns above total costs
165 500 579 207 710 729 410
Returns above cash costs
368 677 802 331 797 859 583
Other MVs
Total returns 976 1,238 1,399 1,245 1,289 1,268
Costs
Total material input cost
454 370 341 556 397 411
Total labor cost 206 475 313 393 356 396
Total power cost 66 79 72 98 33 79
Total cash cost 605 770 493 922 685 722
Total noncash cost 120 154 234 124 100 164
Total costs 725 924 727 1,046 785 886
Returns above total costs
251 314 672 199 504 382
Returns above cash costs
371 468 906 323 604 546
aMaterial inputs include land rent.
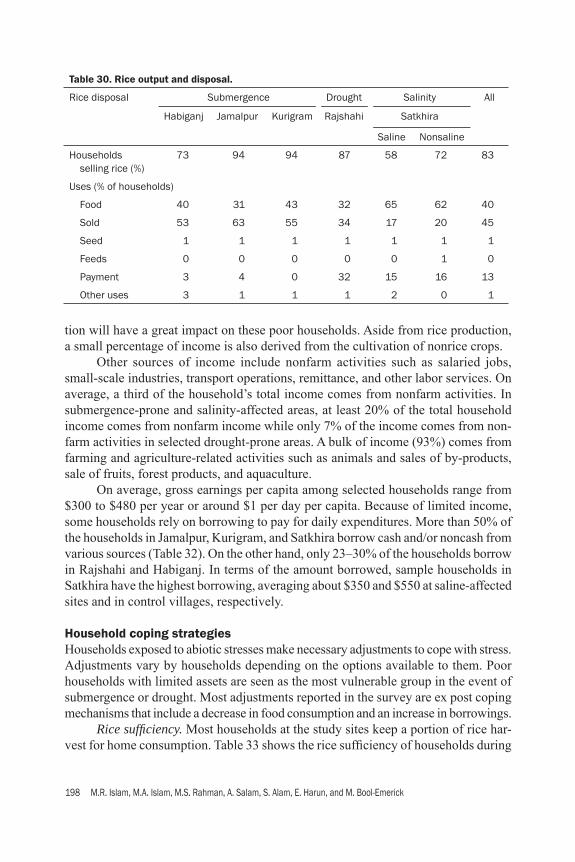
198 M.R. Islam, M.A. Islam, M.S. Rahman, A. Salam, S. Alam, E. Harun, and M. Bool-Emerick
tion will have a great impact on these poor households. Aside from rice production, a small percentage of income is also derived from the cultivation of nonrice crops. Other sources of income include nonfarm activities such as salaried jobs, small-scale industries, transport operations, remittance, and other labor services. On average, a third of the household’s total income comes from nonfarm activities. In submergence-prone and salinity-affected areas, at least 20% of the total household income comes from nonfarm income while only 7% of the income comes from non-farm activities in selected drought-prone areas. A bulk of income (93%) comes from farming and agriculture-related activities such as animals and sales of by-products, sale of fruits, forest products, and aquaculture. On average, gross earnings per capita among selected households range from $300 to $480 per year or around $1 per day per capita. Because of limited income, some households rely on borrowing to pay for daily expenditures. More than 50% of the households in Jamalpur, Kurigram, and Satkhira borrow cash and/or noncash from various sources (Table 32). On the other hand, only 23–30% of the households borrow in Rajshahi and Habiganj. In terms of the amount borrowed, sample households in Satkhira have the highest borrowing, averaging about $350 and $550 at saline-affected sites and in control villages, respectively.
Household coping strategiesHouseholds exposed to abiotic stresses make necessary adjustments to cope with stress. Adjustments vary by households depending on the options available to them. Poor households with limited assets are seen as the most vulnerable group in the event of submergence or drought. Most adjustments reported in the survey are ex post coping mechanisms that include a decrease in food consumption and an increase in borrowings. Rice suffi ciency. Most households at the study sites keep a portion of rice har-vest for home consumption. Table 33 shows the rice suffi ciency of households during
Table 30. Rice output and disposal.
Rice disposal Submergence Drought Salinity All
Habiganj
Jamalpur
Kurigram
Rajshahi
Satkhira
Saline Nonsaline
Households selling rice (%)
73 94 94 87 58 72 83
Uses (% of households)
Food 40 31 43 32 65 62 40
Sold 53 63 55 34 17 20 45
Seed 1 1 1 1 1 1 1
Feeds 0 0 0 0 0 1 0
Payment 3 4 0 32 15 16 13
Other uses 3 1 1 1 2 0 1
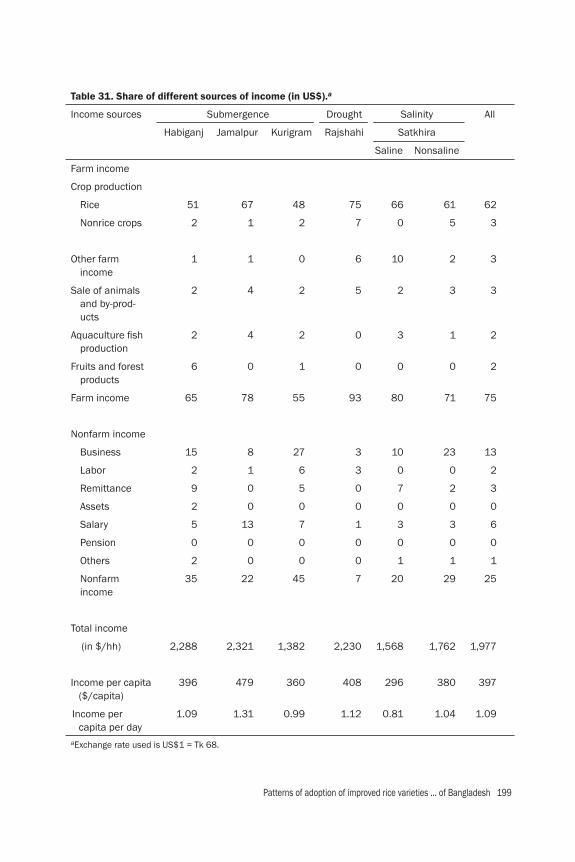
Patterns of adoption of improved rice varieties ... of Bangladesh 199
Table 31. Share of different sources of income (in US$).a
Income sources Submergence Drought Salinity All
Habiganj Jamalpur Kurigram Rajshahi Satkhira
Saline Nonsaline
Farm income
Crop production
Rice 51 67 48 75 66 61 62
Nonrice crops 2 1 2 7 0 5 3
Other farm income
1 1 0 6 10 2 3
Sale of animals and by-prod-ucts
2 4 2 5 2 3 3
Aquaculture fi sh production
2 4 2 0 3 1 2
Fruits and forest products
6 0 1 0 0 0 2
Farm income 65 78 55 93 80 71 75
Nonfarm income
Business 15 8 27 3 10 23 13
Labor 2 1 6 3 0 0 2
Remittance 9 0 5 0 7 2 3
Assets 2 0 0 0 0 0 0
Salary 5 13 7 1 3 3 6
Pension 0 0 0 0 0 0 0
Others 2 0 0 0 1 1 1
Nonfarm income
35 22 45 7 20 29 25
Total income
(in $/hh) 2,288 2,321 1,382 2,230 1,568 1,762 1,977
Income per capita ($/capita)
396 479 360 408 296 380 397
Income per capita per day
1.09 1.31 0.99 1.12 0.81 1.04 1.09
aExchange rate used is US$1 = Tk 68.

200 M.R. Islam, M.A. Islam, M.S. Rahman, A. Salam, S. Alam, E. Harun, and M. Bool-Emerick
Table 32. Household borrowing in selected districts.
Borrowing Submergence Drought Salinity All
Habiganj
Jamalpur
Kurigram
Rajshahi
Satkhira
Saline Nonsaline
No. of households 100 100 100 100 50 50 500
% of households that borrowed
23 61 56 30 64 76 48
Average amount borrowed (in US$)
87 162 141 69 353 549 182
Table 33. Rice suffi ciency of households (%).
Rice suffi ciency (months) Submergence Drought All
Habiganj Jamalpur Kurigram Rajshahi
Normal year
0 to 3 0 1 0 8 2
4 to 6 1 4 0 10 4
7 to 9 1 5 4 4 4
10 2 4 7 6 5
11 8 0 0 1 2
12 88 86 89 71 83
Stress year
0 to 3 1 3 1 24 7
4 to 6 1 16 17 20 14
7 to 9 21 25 32 25 26
10 38 9 21 5 18
11 20 1 0 0 5
12 19 46 29 25 30

Patterns of adoption of improved rice varieties ... of Bangladesh 201
normal and stress years. During a normal year, more than 85% of the households are rice-suffi cient for 12 months at selected submergence-prone sites. However, during a stress year, the percentage of households that are rice suffi cient throughout the year declines to 30% on average as more than 40% of the households become rice-suffi cient for only less than 10 months. Similarly, 71% of the households in selected drought-prone areas in Rajshahi are rice-suffi cient for 12 months during a normal year. In the event of stress, the percent-age drops to as low as 25% and 69% of the households become rice-suffi cient only for less than 10 months. More than 20% of the households reported rice-suffi ciency for less than 4 months. The decrease in rice supply among households during stress years has an ef-fect on the frequency of meals eaten by the households per day. Table 34 shows the frequency of meal consumption of households during normal and stress years. Some 7% to 65% of the households reported a decrease in the frequency of meal intake per day from 3 to 2. Moreover, sample households also reported reductions in the quantity of food eaten per meal. In submergence-prone areas, 38% to 64% of the sample households reported reductions in food intake per meal. Similarly, 40% of the sample households at drought sites claimed reductions in food quantity intake. During stress years, households may opt to decrease food consumption by skipping meals and/or eating less in order to prolong the household’s food supply. This kind of coping strategy or adjustment may cause an adverse effect on health and nutrition of the households. Consumption patterns. The consumption patterns of households between nor-mal and stress years are given in Table 35. Based on the results, the percentage of households consuming rice on a regular basis did not change much between normal and stress years while a notable decline in the percentage of households consuming fi sh and pulses on a regular basis was observed during stress years. A slight change in vegetable consumption can be depicted from Table 35. Normally, most households consume a wide variety of food on a daily basis. However, during stress years, the variety of food consumed becomes limited in some households. Changes in borrowing. Borrowing, in the form of cash or kind, plays an impor-tant role in meeting households’ consumption defi cit. Households borrow cash from formal and informal institutions such as relatives or other social networks. On aver-age, 82% of the sample households in submergence-prone areas reported an increase in cash borrowing during stress years (Table 36). Households also borrow in the form of kind. Households reported an increase in food borrowing during stress years in some submergence-prone areas while food borrowing of most households in the sample in drought-prone areas remained unchanged. An increase in cash borrowing was reported by only 34% of the sample households in Rajshahi during drought years. In addition, a deferred loan payment was reported by some households at the study sites. In Jamalpur, 74% of the households claimed to postpone their loan payments during stress years.

202 M.R. Islam, M.A. Islam, M.S. Rahman, A. Salam, S. Alam, E. Harun, and M. Bool-Emerick
Tabl
e 34
. Num
ber
of m
eals
eat
en p
er d
ay b
y ho
useh
olds
.
No.
of m
eals
Subm
erge
nce
Dro
ught
All
Hab
igan
jJa
mal
pur
Kur
igra
mR
ajsh
ahi
Nor
mal
St
ress
Nor
mal
St
ress
Nor
mal
St
ress
Nor
mal
St
ress
Nor
mal
St
ress
10
20
00
00
00
1
20
65
52
30
70
211
29
39
83
39
577
99
92
100
79
98
70
42
00
01
10
01
0
Tabl
e 35
. Dai
ly c
onsu
mpt
ion
(% o
f hou
seho
lds)
of m
ajor
food
item
s.
Food
item
Subm
erge
nce
Dro
ught
All
Hab
igan
jJa
mal
pur
Kur
igra
mR
ajsh
ahi
Nor
mal
St
ress
Nor
mal
St
ress
Nor
mal
St
ress
Nor
mal
St
ress
Nor
mal
St
ress
Fish
86
45
80
42
96
314
86
92
5
Frui
ts6
215
60
010
98
4
Mai
ze0
00
00
01
30
.31
Mea
t7
13
03
04
34
1
Milk
100
20
76
01
26
12
3
Puls
es9
577
4121
915
39
30
67
33
Ric
e97
100
100
100
99
98
98
92
99
98
Vege
tabl
es9
681
100
100
979
487
73
95
87
Whe
at11
58
71
011
12
86
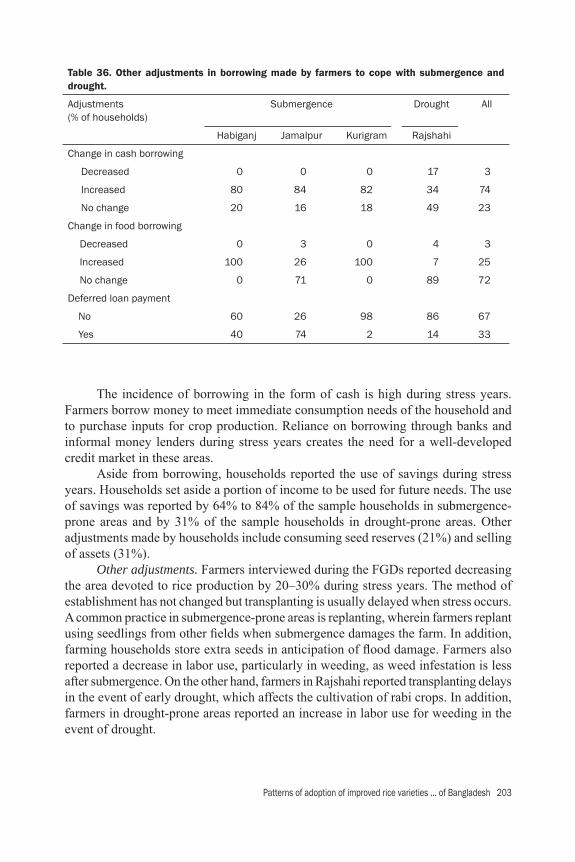
Patterns of adoption of improved rice varieties ... of Bangladesh 203
The incidence of borrowing in the form of cash is high during stress years. Farmers borrow money to meet immediate consumption needs of the household and to purchase inputs for crop production. Reliance on borrowing through banks and informal money lenders during stress years creates the need for a well-developed credit market in these areas. Aside from borrowing, households reported the use of savings during stress years. Households set aside a portion of income to be used for future needs. The use of savings was reported by 64% to 84% of the sample households in submergence-prone areas and by 31% of the sample households in drought-prone areas. Other adjustments made by households include consuming seed reserves (21%) and selling of assets (31%). Other adjustments. Farmers interviewed during the FGDs reported decreasing the area devoted to rice production by 20–30% during stress years. The method of establishment has not changed but transplanting is usually delayed when stress occurs. A common practice in submergence-prone areas is replanting, wherein farmers replant using seedlings from other fi elds when submergence damages the farm. In addition, farming households store extra seeds in anticipation of fl ood damage. Farmers also reported a decrease in labor use, particularly in weeding, as weed infestation is less after submergence. On the other hand, farmers in Rajshahi reported transplanting delays in the event of early drought, which affects the cultivation of rabi crops. In addition, farmers in drought-prone areas reported an increase in labor use for weeding in the event of drought.
Table 36. Other adjustments in borrowing made by farmers to cope with submergence and drought.
Adjustments (% of households)
Submergence
Drought All
Habiganj Jamalpur Kurigram Rajshahi
Change in cash borrowing
Decreased 0 0 0 17 3
Increased 80 84 82 34 74
No change 20 16 18 49 23
Change in food borrowing
Decreased 0 3 0 4 3
Increased 100 26 100 7 25
No change 0 71 0 89 72
Deferred loan payment
No 60 26 98 86 67
Yes 40 74 2 14 33
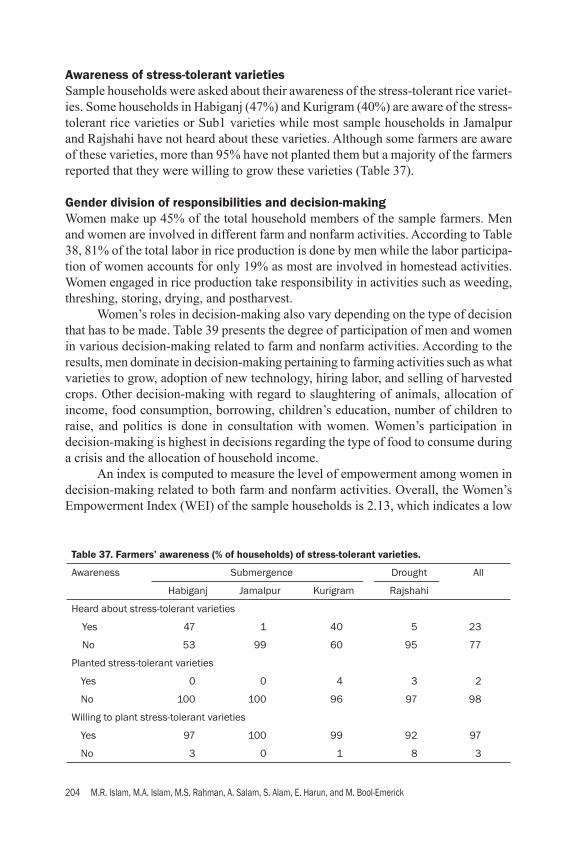
204 M.R. Islam, M.A. Islam, M.S. Rahman, A. Salam, S. Alam, E. Harun, and M. Bool-Emerick
Table 37. Farmers’ awareness (% of households) of stress-tolerant varieties.
Awareness Submergence Drought All
Habiganj Jamalpur Kurigram Rajshahi
Heard about stress-tolerant varieties
Yes 47 1 40 5 23
No 53 99 60 95 77
Planted stress-tolerant varieties
Yes 0 0 4 3 2
No 100 100 96 97 98
Willing to plant stress-tolerant varieties
Yes 97 100 99 92 97
No 3 0 1 8 3
Awareness of stress-tolerant varietiesSample households were asked about their awareness of the stress-tolerant rice variet-ies. Some households in Habiganj (47%) and Kurigram (40%) are aware of the stress-tolerant rice varieties or Sub1 varieties while most sample households in Jamalpur and Rajshahi have not heard about these varieties. Although some farmers are aware of these varieties, more than 95% have not planted them but a majority of the farmers reported that they were willing to grow these varieties (Table 37).
Gender division of responsibilities and decision-makingWomen make up 45% of the total household members of the sample farmers. Men and women are involved in different farm and nonfarm activities. According to Table 38, 81% of the total labor in rice production is done by men while the labor participa-tion of women accounts for only 19% as most are involved in homestead activities. Women engaged in rice production take responsibility in activities such as weeding, threshing, storing, drying, and postharvest. Women’s roles in decision-making also vary depending on the type of decision that has to be made. Table 39 presents the degree of participation of men and women in various decision-making related to farm and nonfarm activities. According to the results, men dominate in decision-making pertaining to farming activities such as what varieties to grow, adoption of new technology, hiring labor, and selling of harvested crops. Other decision-making with regard to slaughtering of animals, allocation of income, food consumption, borrowing, children’s education, number of children to raise, and politics is done in consultation with women. Women’s participation in decision-making is highest in decisions regarding the type of food to consume during a crisis and the allocation of household income. An index is computed to measure the level of empowerment among women in decision-making related to both farm and nonfarm activities. Overall, the Women’s Empowerment Index (WEI) of the sample households is 2.13, which indicates a low

Patterns of adoption of improved rice varieties ... of Bangladesh 205
Table 38. Labor participation (person-days/ha) in rice production.a
Labor Submergence Drought Salinity All
Habiganj Jamalpur Kurigram Rajshahi Satkhira
Saline Nonsaline
Aman season
Total labor 129 95 125 93 131 182 121
% Male labor 85 86 70 71 88 89 81
% Female labor 15 14 30 29 12 11 19
Hired labor 51 48 79 61 92 124 69
% Male labor 93 100 68 67 87 90 82
% Female labor 7 0 32 33 13 10 18
Family labor 78 48 46 33 39 57 51
% Male labor 80 73 73 79 89 87 79
% Female labor 20 27 27 21 11 13 21
Boro season
Total labor 134 130 172 102 156 209 146
% Male labor 85 88 71 72 88 86 80
% Female labor 15 12 29 28 12 14 20
Hired labor 51 69 97 64 103 140 81
% Male labor 92 99 68 67 87 85 82
% Female labor 8 1 32 33 13 15 18
Family labor 82 61 75 38 53 69 65
% Male labor 80 75 74 82 90 89 79
% Female labor 20 25 26 18 10 11 21aLabor use reported excludes labor hired under contract.
empowerment among women. This implies that most decisions are made in consulta-tion with women members of the household but the participation of men in decision-making dominates that of women.
Summary of the fi ndings
• Farming is the primary occupation among adult members of the households. The proportion of employed adults engaged in farming activities ranges from 61% in Habiganj to 95% in Kurigram. This may indicate that households in Kurigram have more limited alternative sources of income as most households rely on farming activities.
• Cropping intensity is lowest in saline areas (104%) and highest in submergence-prone areas in Kurigram and Jamalpur (193%) while the CI of drought-prone areas in Rajshahi is intermediate (163%).
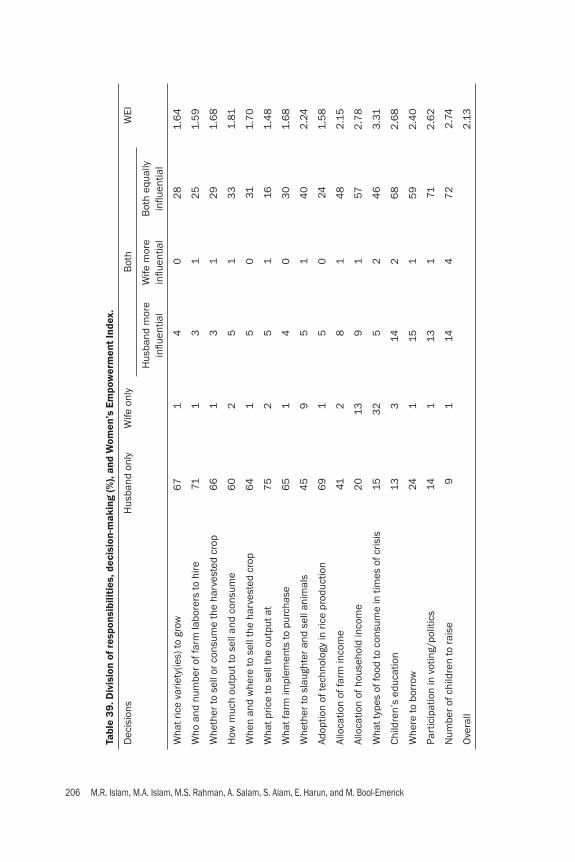
206 M.R. Islam, M.A. Islam, M.S. Rahman, A. Salam, S. Alam, E. Harun, and M. Bool-Emerick
Tabl
e 39
. Div
isio
n of
res
pons
ibili
ties
, dec
isio
n-m
akin
g (%
), an
d W
omen
’s E
mpo
wer
men
t In
dex.
Dec
isio
ns
Hus
band
onl
y W
ife o
nly
Bot
h W
EI
Hus
band
mor
e infl u
entia
lW
ife m
ore
infl u
entia
lB
oth
equa
lly
infl u
entia
l
Wha
t ric
e va
riety
(ies)
to g
row
67
14
02
81.
64
Who
and
num
ber o
f far
m la
bore
rs to
hire
711
31
25
1.5
9
Whe
ther
to s
ell o
r con
sum
e th
e ha
rves
ted
crop
66
13
12
91.
68
How
muc
h ou
tput
to s
ell a
nd c
onsu
me
60
25
13
31.
81
Whe
n an
d w
here
to s
ell t
he h
arve
sted
cro
p6
41
50
311.
70
Wha
t pric
e to
sel
l the
out
put a
t7
52
51
161.
48
Wha
t far
m im
plem
ents
to p
urch
ase
65
14
03
01.
68
Whe
ther
to s
laug
hter
and
sel
l ani
mal
s4
59
51
40
2.2
4
Adop
tion
of te
chno
logy
in ri
ce p
rodu
ctio
n6
91
50
241.
58
Allo
catio
n of
farm
inco
me
412
81
48
2.1
5
Allo
catio
n of
hou
seho
ld in
com
e2
013
91
572
.78
Wha
t typ
es o
f foo
d to
con
sum
e in
tim
es o
f cris
is15
32
52
46
3.3
1
Child
ren’
s ed
ucat
ion
133
142
68
2.6
8
Whe
re to
bor
row
241
151
59
2.4
0
Part
icip
atio
n in
vot
ing/
polit
ics
14
113
171
2.6
2
Num
ber o
f chi
ldre
n to
rais
e9
114
47
22
.74
Ove
rall
2.1
3

Patterns of adoption of improved rice varieties ... of Bangladesh 207
• Salinity is a problem during the boro (dry) season, which may explain the low cropping intensity in Satkhira (coastal belt).
• The type of rice varieties grown does not vary much across land types. Most lands, regardless of the type, are grown to MV rice. However, in the lowlands of Kurigram (submergence site), more than 60% of the area is being planted to TVs that are perceived to have some tolerance of submergence conditions during the aman season.
• MV adoption is very high at all the sites. During aman, the highest adoption of MVs (100%) was found at the saline-prone site in Satkhira and the lowest in submergence-prone areas in Kurigram (65%). The relatively low adoption at the Kurigram site is due to high submergence. Available MVs are not able to tolerate long duration and high depth of submergence situations.
• Hybrid rice is found in selected submergence-prone and saline areas during the dry season but not in the Rajshahi area (drought-prone).
• Adoption of newer generation MVs is low during the aman season and high during the boro season. The predominance of old varieties released during the 1980s such as BR11 and Swarna in submergence- and drought-prone areas and BR10 in salinity-prone areas indicates that rice varieties released 30 years ago are still being adopted during the aman season. The high adoption of old aman varieties such as BR11 is because no new variety has surpassed its yield potential.
• The introduction of the Sub1 version of the mega-varieties is expected to trig-ger varietal replacement in submergence areas during the aman season. This is because these improved Sub1 varieties retain the characteristics of the old-generation mega-variety with improved tolerance of submergence risk.
• On average, the yield of new-generation MVs and old-generation MVs is not statistically different (except in Rajshahi), which may explain the slow varietal replacement in Bangladesh. In addition, the cultivation of old- and new-gener-ation MVs is equally profi table on average.
• The effect of salinity is not just a decrease in yield but also a reduction in area. During the boro season, when salinity is higher, the effect on area is greater than the effect on yield.
• MV rice production is more profi table than using traditional varieties at all the sites even after taking into account family-owned resources (noncash costs). However, the incremental net returns from shifting between old- and new-generation MVs are not statistically signifi cant.
• In general, net returns from rice during the boro season are higher than those of the aman season. This is often attributed to favorable climatic conditions, less stress effect, and better crop management and irrigation availability during the boro season.
• Households in stress-prone areas strongly depend on rice production. The share of rice income in total household income ranges from 48% (Kurigram) to 75% (Rajshahi) in Bangladesh. Nonfarm income is lowest in Rajshahi (7%) and highest in Kurigram (45%).

208 M.R. Islam, M.A. Islam, M.S. Rahman, A. Salam, S. Alam, E. Harun, and M. Bool-Emerick
• Households exposed to abiotic stresses make necessary adjustments to cope with these stresses. Adjustments vary by households depending on the options available to them. Poor households with limited assets are seen as the most vulnerable group in the event of submergence or drought situations. Most ad-justments reported in the survey are ex post coping mechanisms, which include a decrease in food consumption and an increase in borrowings.
• More than 80% of the households are rice self-suffi cient for a year during normal years. However, the percentage of rice-suffi cient households declines drastically during stress years in all areas in Bangladesh. The decrease in rice supply among households during stress years has an effect on the frequency of meals eaten by the households per day.
• At least 40% of the sample households from Kurigram and Habiganj are aware of stress-tolerant varieties. This may be due to PVS and testing of Sub1 varieties at these sites. However, many farmers have not yet planted these stress-tolerant rice varieties.
• Male labor participation in rice farming dominates female participation. The labor participation of women is around 19% of the total labor. Women who are engaged in fi eld work are involved in activities such as weeding, threshing, drying, storing, and other postharvest activities.
• Men dominate in decision-making pertaining to what varieties to grow, adop-tion of new technology, hiring labor, and selling of harvested crops. Women’s participation is reported in decision-making regarding the type of food to con-sume during a crisis and allocation of household income. Overall, the Women’s Empowerment Index of the sample households is 2.13, which indicates low empowerment among women. Women take part in decision-making but men are still considered as the major decision makers in the household.
References
Gregory DJ, Haefele SM, Buresh RJ, Singh U. 2010. Fertilizer use, markets and management. In: Pandey S, Byerlee D, Dawe D, Dobermann A, Mohanty S, Rozelle S, Hardy B, edi-tors. Rice in the global economy: strategic research and policy issues for food security. Los Baños (Philippines): International Rice Research Institute. p 231-265.
Haque SA. 2006. Salinity problems and crop production in coastal regions of Bangladesh. Pakistan J. Bot. 38(5):1359-1365.
Hossain M, Bose M, Mustafi B. 2006. Adoption and productivity impact of modern rice variet-ies in Bangladesh. Dev. Econ. XLIV-2 (June 2006):149-166.
Hossain M, Asaduzzaman M, Sattar Mandal MA, Deb U, Jones S. 2009. Rice technologies: strategic choices and policy options. BIDS Policy Brief. Number 0903. May 2009.
Islam MR, Salam MA, Bhuiyan MAR, Rahman MA, Gregorio GB. 2008. Participatory varietal selection for salt-tolerant rice. Int. J. BioResearch 4(3):21-25.
Ismail A. 2009. Increasing rice productivity in submergence-prone areas of South Asia. Manage-ment options in fl ood-prone areas. Fact Sheet 4. Los Baños (Philippines): International Rice Research Institute. http://archive.irri.org/fl ood-proof-rice/Factsheet_4.pdf.
Karim Z, Hussain SG, Ahmed M. 1990. Salinity problem and crop intensifi cation in the coastal region of Bangladesh. BARC Soil Publication. 33:63.

Patterns of adoption of improved rice varieties ... of Bangladesh 209
Sources of secondary data
BRRI, retrieved in Jan 2011. Rice area, production, yield from 1971-72 to 2008-09. At www.brri.gov.bd/info_services/index.htm.
Bangladesh Bureau of Statistics, retrieved in Jan 2011. At www.bbs.gov.bd/Home.aspx#.Trading Economics, retrieved in Jan 2011. Land area under cereal production. At www trading-
economics.com/bangladesh/land-under-cereal-production-hectares-wb-data.html.World Bank Indicators, retrieved in Jan 2011. At http://data.worldbank.org/indicator.World Rice Statistics, retrieved in Jan 2011. At http://irri.org/our-science/social-science-
economics/world-rice-statistics.
Notes
Authors’ addresses: M.R. Islam, M.A. Islam, A. Salam, S. Alam, and E. Harun, Agricultural Economics Division, Bangladesh Rice Research Institute, Gazipur 1701, Bangladesh; M.S. Rahman, Department of Agricultural Economics, Bangladesh Agricultural Univer-sity, Mymensingh, Bangladesh.
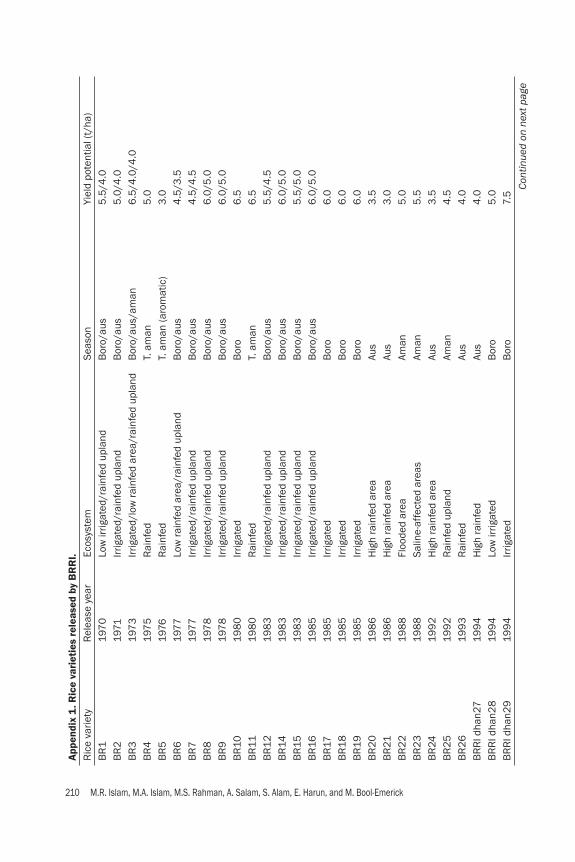
210 M.R. Islam, M.A. Islam, M.S. Rahman, A. Salam, S. Alam, E. Harun, and M. Bool-Emerick
App
endi
x 1
. Ric
e va
riet
ies
rele
ased
by
BR
RI.
Ric
e va
riety
Rel
ease
yea
rEc
osys
tem
Seas
onYi
eld
pote
ntia
l (t/
ha)
BR
119
70
Low
irrig
ated
/rai
nfed
upl
and
Bor
o/au
s5
.5/4
.0B
R2
1971
Irrig
ated
/rai
nfed
upl
and
Bor
o/au
s5
.0/4
.0B
R3
19
73
Irrig
ated
/low
rain
fed
area
/rai
nfed
upl
and
Bor
o/au
s/am
an6
.5/4
.0/4
.0B
R4
197
5R
ainf
edT.
am
an5
.0B
R5
19
76R
ainf
edT.
am
an (a
rom
atic
)3
.0B
R6
19
77Lo
w ra
infe
d ar
ea/r
ainf
ed u
plan
dB
oro/
aus
4.5
/3.5
BR
719
77Irr
igat
ed/r
ainf
ed u
plan
dB
oro/
aus
4.5
/4.5
BR
819
78
Irrig
ated
/rai
nfed
upl
and
Bor
o/au
s6
.0/5
.0B
R9
197
8Irr
igat
ed/r
ainf
ed u
plan
dB
oro/
aus
6.0
/5.0
BR
1019
80
Irrig
ated
Bor
o6
.5B
R11
19
80
Rai
nfed
T. a
man
6.5
BR
12
19
83
Irrig
ated
/rai
nfed
upl
and
Bor
o/au
s5
.5/4
.5B
R14
19
83
Irrig
ated
/rai
nfed
upl
and
Bor
o/au
s6
.0/5
.0B
R15
19
83
Irrig
ated
/rai
nfed
upl
and
Bor
o/au
s5
.5/5
.0B
R16
19
85
Irrig
ated
/rai
nfed
upl
and
Bor
o/au
s6
.0/5
.0B
R17
19
85
Irrig
ated
Bor
o6
.0B
R18
19
85
Irrig
ated
Bor
o6
.0B
R19
19
85
Irrig
ated
Bor
o6
.0B
R2
0
198
6H
igh
rain
fed
area
Aus
3.5
BR
21
198
6H
igh
rain
fed
area
Aus
3.0
BR
22
19
88
Floo
ded
area
Aman
5.0
BR
23
19
88
Salin
e-af
fect
ed a
reas
Aman
5.5
BR
24
199
2H
igh
rain
fed
area
Aus
3.5
BR
25
19
92
Rai
nfed
upl
and
Aman
4.5
BR
26
19
93
Rai
nfed
Au
s4
.0B
RR
I dha
n27
199
4H
igh
rain
fed
Aus
4.0
BR
RI d
han2
819
94
Low
irrig
ated
Bor
o5
.0B
RR
I dha
n29
199
4Irr
igat
edB
oro
7.5
Cont
inue
d on
nex
t pag
e

Patterns of adoption of improved rice varieties ... of Bangladesh 211
BR
RI d
han3
019
94
Rai
nfed
Aman
5.0
BR
RI d
han3
119
94
Rai
nfed
Aman
5.0
BR
RI d
han3
219
94
Rai
nfed
Aman
5.0
BR
RI d
han3
319
97R
ainf
edAm
an4
.5B
RR
I dha
n34
1997
Rai
nfed
Aman
3.5
BR
RI d
han3
519
98
Irrig
ated
Bor
o5
.0B
RR
I dha
n36
199
8Irr
igat
edB
oro
5.0
BR
RI d
han3
719
98
Rai
nfed
Aman
3.5
BR
RI d
han3
819
98
Rai
nfed
Aman
3.5
BR
RI d
han3
919
99
Rai
nfed
Aman
4.5
BR
RI d
han4
02
00
3R
ainf
edAm
an4
.5B
RR
I dha
n41
20
03
Rai
nfed
Aman
4.5
BR
RI d
han4
22
00
4R
ainf
ed u
plan
dAu
s3
.5B
RR
I dha
n43
20
04
Rai
nfed
upl
and
Aus
3.5
BR
RI d
han4
42
00
5Ti
dal s
ubm
erge
d ar
eas
Aman
6.5
BR
RI d
han4
52
00
5Lo
w ir
rigat
edB
oro
6.5
BR
RI d
han4
62
007
Rai
nfed
Aman
4.7
BR
RI d
han4
72
007
Irrig
ated
Bor
o6
.1B
RR
I dha
n48
20
08
Rai
nfed
Aus
5.5
BR
RI d
han4
92
00
8R
ainf
edAm
an5
.0B
RR
I dha
n50
20
08
Irrig
ated
Bor
o6
.0B
RR
I hyb
rid d
han1
20
01Irr
igat
edB
oro
8.5
BR
RI h
ybrid
dha
n22
00
8Irr
igat
edB
oro
8.0
BR
RI d
han5
12
010
Rai
nfed
Aman
4.0
BR
RI d
han5
22
010
Rai
nfed
Aman
4.0
BR
RI d
han5
32
010
Rai
nfed
Aman
4.5
BR
RI d
han5
42
010
Rai
nfed
Aman
4.5
BR
RI h
ybrid
dha
n 3
20
09
Irrig
ated
Bor
o8
.5B
RR
I hyb
rid d
han
42
010
Irrig
ated
Aman
6.0
Sour
ce: B
RR
I (2
010
).
Appe
ndix
1 c
ontin
ued
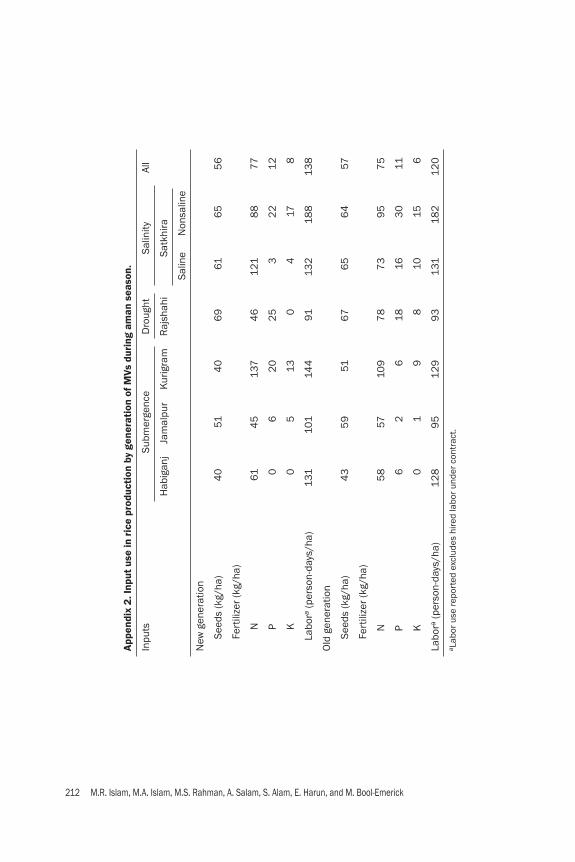
212 M.R. Islam, M.A. Islam, M.S. Rahman, A. Salam, S. Alam, E. Harun, and M. Bool-Emerick
App
endi
x 2.
Inpu
t us
e in
ric
e pr
oduc
tion
by
gene
rati
on o
f MVs
dur
ing
aman
sea
son.
Inpu
tsSu
bmer
genc
e D
roug
htSa
linity
All
Hab
igan
j
Jam
alpu
r
Kur
igra
m
Raj
shah
i
Satk
hira
Salin
eN
onsa
line
New
gen
erat
ion
Seed
s (k
g/ha
)4
051
40
69
616
55
6
Fert
ilize
r (kg
/ha)
N61
45
137
46
121
88
77
P0
62
02
53
22
12
K0
513
04
178
Labo
ra (p
erso
n-da
ys/h
a)13
110
114
491
132
188
138
Old
gen
erat
ion
Seed
s (k
g/ha
)4
35
951
67
65
64
57
Fert
ilize
r (kg
/ha)
N5
857
109
78
73
95
75
P6
26
1816
30
11
K0
19
810
156
Labo
ra (p
erso
n-da
ys/h
a)1
28
95
12
99
313
118
21
20
a Lab
or u
se re
port
ed e
xclu
des
hire
d la
bor u
nder
con
trac
t.

Patterns of adoption of improved rice varieties ... of Bangladesh 213
App
endi
x 3.
Inpu
t us
e in
ric
e pr
oduc
tion
by
gene
rati
on o
f MVs
dur
ing
boro
sea
son.
Inpu
tsSu
bmer
genc
eD
roug
htSa
linity
All
Hab
igan
jJa
mal
pur
Kur
igra
mR
ajsh
ahi
Satk
hira
Salin
eN
onsa
line
New
gen
erat
ion
Seed
s (k
g/ha
)4
261
46
68
616
04
2
Fert
ilize
r (kg
/ha)
N6
911
715
18
311
517
66
9
P17
23
921
26
49
17
K0
810
91
22
30
Labo
ra (p
erso
n-da
ys/h
a)13
313
217
110
215
52
09
133
Old
gen
erat
ion
Seed
s (k
g/ha
)
Fert
ilize
r (kg
/ha)
60
517
5
N P8
915
527
K2
514
31
Labo
ra (p
erso
n-da
ys/h
a)11
157
a Lab
or u
se re
port
ed e
xclu
des
hire
d la
bor u
nder
con
trac
t.
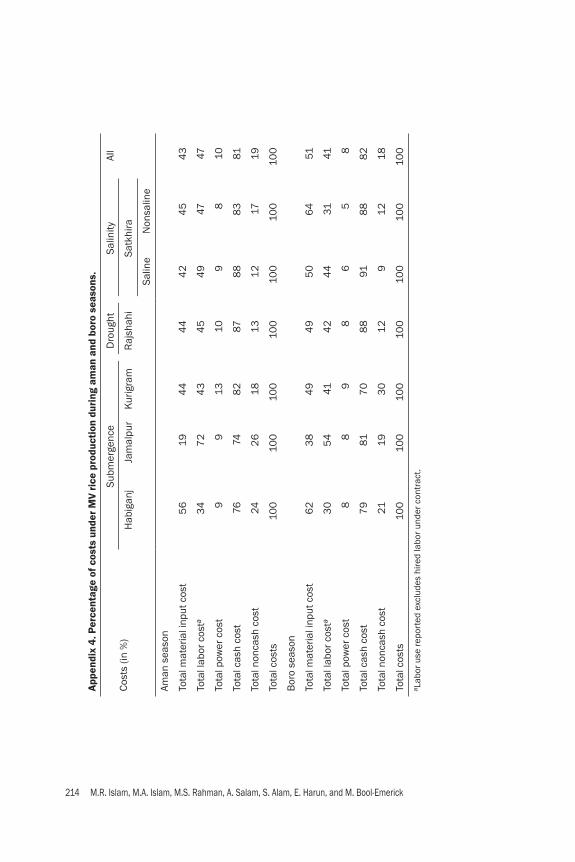
214 M.R. Islam, M.A. Islam, M.S. Rahman, A. Salam, S. Alam, E. Harun, and M. Bool-Emerick
App
endi
x 4.
Per
cent
age
of c
osts
und
er M
V ri
ce p
rodu
ctio
n du
ring
am
an a
nd b
oro
seas
ons.
Cost
s (in
%)
Subm
erge
nce
Dro
ught
Salin
ityAl
l H
abig
anj
Jam
alpu
rK
urig
ram
Raj
shah
iSa
tkhi
ra
Salin
eN
onsa
line
Aman
sea
son
Tota
l mat
eria
l inp
ut c
ost
56
194
44
44
24
54
3
Tota
l lab
or c
osta
34
72
43
45
49
4747
Tota
l pow
er c
ost
99
1310
98
10
Tota
l cas
h co
st76
748
287
88
83
81
Tota
l non
cash
cos
t24
26
1813
12
1719
Tota
l cos
ts10
010
010
010
010
010
010
0
Bor
o se
ason
Tota
l mat
eria
l inp
ut c
ost
62
38
49
49
50
64
51
Tota
l lab
or c
osta
30
54
414
24
431
41
Tota
l pow
er c
ost
88
98
65
8
Tota
l cas
h co
st7
981
70
88
918
88
2
Tota
l non
cash
cos
t21
193
01
29
12
18
Tota
l cos
ts10
010
010
010
010
010
010
0a L
abor
use
repo
rted
exc
lude
s hi
red
labo
r und
er c
ontr
act.
Patterns of adoption of improved rice varieties ... of West Bengal, India 215
Patterns of adoption of improved rice varieties and farm level impacts in stress-prone rainfed areas of West Bengal, India
Chapter 6

216 B. Bagchi and M. Bool-Emerick

Patterns of adoption of improved rice varieties ... of West Bengal, India 217
Introduction
Country backgroundWest Bengal lies in the eastern part of India, bordered by Nepal, Bangladesh, and other Indian states. It has a total land area of 88,752 km2 and a population of 80.2 million, making West Bengal the fourth most populous state in India (Census 2001). West Bengal is the top rice producer in India. Rice, the state’s main staple, is grown extensively. In 2009, India’s total rice production reached 131 million tons and West Bengal accounted for 16% of the country’s production. Rice is cultivated in varying ecosystems that include irrigated areas, rainfed lowland areas, and uplands. In rainfed areas, rice farms are affected by varied amounts of submergence, drought, and salinity. The occurrences of these abiotic stresses cause substantial crop damage. To improve food security and the livelihoods of poor farming households, collaborative efforts with national agricultural research and extension systems (NARES) have been made to develop stress-tolerant rice varieties to achieve higher productivity in India.
ObjectiveThis report is an outcome of the baseline socioeconomic survey under Objective 7 (Impact assessment and targeting) of the STRASA project. The objectives of the study are the following:
• To analyze farmers’ livelihood systems in selected drought-prone, submergence-prone, and salinity environments in Bangladesh.
• To analyze the patterns of varietal adoption and the factors that infl uence the adoption of modern rice varieties.
• To analyze the economics of rice production by type of variety and season.• To document farmers’ coping strategies due to different stress situations (drought,
submergence, and salinity).• To understand gender roles in rice production and women’s participation in
decision-making.• To serve as a baseline for rice technology design, targeting, and policy reforms
in stress-prone areas.
Patterns of adoption of improved rice varieties and farm-level impacts in stress-prone rainfed areas of West Bengal, IndiaB. Bagchi and M. Bool-Emerick
218 B. Bagchi and M. Bool-Emerick
Organization of the reportThis report is organized into six major sections. The fi rst section gives a general country background and objectives of the study. This is followed by a short descrip-tion of the research design and data generation. The third section briefl y describes the trends in rice production. The fourth section provides a general description of the survey sites and stresses using information gathered from focus group discussions and key informant surveys. Section fi ve presents the detailed farm-level analyses of the socioeconomic survey describing the livelihood of farmers, adoption of modern varieties, economics of rice production, consumption patterns, coping strategies, and gender analysis. The fi nal section provides a summary of the fi ndings.
Research design and data generationThis research was implemented in partnership with the Nadia Zilla Farmers Develop-ment Organization (NZFDO). Data for this study were collected by combining rapid rural appraisal methods, secondary sources, and a specifi cally designed household survey. The survey was carried out for the 2008 rice cropping season under the STRASA project in South Asia. The prevalence of stress (drought, submergence, and salinity) and proportion of rainfed rice area were the two major criteria in selecting districts and study villages. Household surveys were conducted in 300 randomly selected households covering the representative rainfed districts in West Bengal. The districts included are the following: Nadia (submergence), Purulia (drought), and North 24 Parganas (salinity). Within each district, at least two villages were selected for the detailed household survey. The survey sites and stress situations were characterized using information gathered from focus group discussions (FGD) and key informant surveys (KIS). Detailed information on farmers’ livelihoods, socioeconomic features, rice production systems, variety adoption patterns, input use, costs and returns, income structure, farmers’ coping strategies, and gender-disaggregated data on rice farming were collected from the socioeconomic baseline household surveys. The basic analytical framework followed is given in Chapter 2. The study used a combination of secondary and primary data. Temporal data on rice area, yield, and production covering 1970 to 2008 were used to provide the general trends at the ag-gregate level. Various statistical and econometric analyses were employed to meet the study objectives. Using time-series data obtained from national statistics, annual growth rates for rice area, production, and yield were estimated using a semi-log trend equation.1 The compound growth rate was estimated for each decade from 1970 to 2008. Before fi tting the trend equation for each period, data were smoothed using a fi ve-year moving-average process. In addition, a 10-year moving growth rate was computed.
1The functional form of the semi-log equation is given by lnYt = a + bT, where Yt is the series of area/production/yield, a is the constant, b gives the annual exponential growth rate of area/production/yield, and T is the trend term.

Patterns of adoption of improved rice varieties ... of West Bengal, India 219
The adoption of improved varieties was measured using various indicators such as the proportion of farmers growing modern varieties and the proportion of area under modern varieties (MVs). The incidence and intensity of adoption were compared not only across sites and stress situations but also between the aman and boro seasons. Econometric analysis was carried out using censored regression (tobit) models to identify the major factors determining the probability and the rate of adoption of new-generation modern varieties.
Agriculture and trends in rice productionThe agricultural sector contributed 17% of the state’s domestic product in 2008 (Central Statistical Organisation 2009). It also generated a substantial amount of employment in rural areas where 72% of the state’s population live (Census 2001). Statistics show that the share of agriculture in gross domestic product has declined in the last few years. However, agriculture still remains the biggest economic sector as it employs around 60% of the total workforce in India. In rural India, 67% of the males and 84% of the females were engaged in agriculture in 2007 (Ministry of Statistics and Program Implementation 2010). The state’s landholdings are generally small, with 81% of the total operational landholdings being less than 1.0 ha. The average landholding size was 0.8 ha in 2005. The total operational land area is 5.5 million ha, of which 96% is cropped, while gross cropped area is 9.5 million ha. From 1995 to 2006, cropping intensity increased from 164% to 182%. This increase in cropping intensity is attributed mainly to irrigation expansion by various means such as canals, tanks, and tube wells (www.indiastat.com). In 2006, almost 60% of the net cropped area was irrigated. Area under food grains (rice, wheat, pulses, and other cereals) occupied around 66% of the gross cropped area (www.indiastat.com). The increase in food grain production between 1990 and 2006 was 42%. Aside from cereal crops, major crops such as jute, potato, and oilseeds are grown. Rice followed by oilseeds and jute are the major crops in terms of area planted. According to Table 1, a slight decrease in rice area was accompanied by an increase in production as rice yields grew by more than 40% between 1990 and 2007. Area under wheat, oilseeds, jute, and potato expanded while improvements in yield rates were observed for all principal crops between 1990 and 2006.
Trends in rice area, production, and yieldAmong the major crops grown in the state, rice is the main food crop that can be cultivated one to three times in a year. The different cropping seasons in West Bengal are aus, aman, and boro. The aus crop is sown in March/April and harvested in July/August. Aman rice, the main rice-growing season in the country, is planted in June/July and harvested in October/November while sowing of boro rice starts in November/December and it is harvested in April/May. The area and production of rice in West Bengal are the highest in the country. Total rice area increased from 5 million ha in 1970 to 5.7 million ha in 2009 (Fig. 1).

220 B. Bagchi and M. Bool-Emerick
On the other hand, rice yield doubled between 1970 and 2009. The increase in rice yield over the years can be attributed to improved crop management practices, the adoption of high-yielding varieties, and irrigation expansion. The growth rates for different periods are presented in Table 2. Overall, a signifi -cant increase in rice area by 0.4% per year is observed from 1974 to 2009. Similarly, a dramatic growth in yield is observed in all periods, especially during 1981 to 1990, when yield growth was 4.3%. On average, rice yield increased signifi cantly from 1970 to 2008, with a growth rate of 2.6% per annum. Moreover, the state’s rice production grew by 3.0% per year during 1970 to 2008.
Table 1. Area, production, and yield rates of principal crops in West Bengal.
Principal crops Area (000 ha) Yield (t/ha) Production (000 tons)
1990-91 2007-08 1990-91 2007-08 1990-91 2007-08
Rice 5,813 5,720 2.69 3.86 15,656 22,079
Wheat 269 353 1.97 2.60 530 917
Other cereals 100 97 1.10 2.33 110 266
Pulses 314 186 0.62 0.80 193 148
Oilseeds 513 707 0.83 1.00 453 705
Jutea 509 617 11 13.44 5,542 8,294
Potato 195 401 22.98 24.69 4,482 9,901aIncludes Mesta. Production is expressed in thousand bales of 180 kg each.Source: Indiastat.com.
Fig. 1. Production, area, and yield of rough rice in West Bengal, 1970-2009. Data source: www.indiastat.com.
25
23
20
18
15
13
10
8
5
3
0
4.5
ProductionAreaYield 3.5
2.5
1.5
0.5
4.0
3.0
2.0
1.0
0.0
Production (million t), area (million ha) Yield (t/ha)
Year
1970 1973 1976 1979 1982 1985 1988 1991 1994 1997 2000 2003 2006 2009

Patterns of adoption of improved rice varieties ... of West Bengal, India 221
Aman, followed by boro, is the major rice-growing season. During 2000-08, aman rice area accounted for around 70% of the total rice area. Table 3 shows the rice area, production, and yield by season for 2000 to 2008. Aus and aman rice account for 5% and 65% of the state’s rice production from 2000 to 2008. Over the years, aus and aman rice yield improved. Aus yield increased from 2.6 to 3.11 t/ha from 2000 to 2008 while aman yield increased by around 25%.
Site and stress characterization
Site and village descriptionLocation of sites. West Bengal is located in the eastern part of India, with Bangladesh lying on its eastern border. Abiotic stresses such as submergence, drought, and salinity are known to limit rice production, particularly in the rainfed areas. Three districts, Nadia, Purulia, and North 24 Parganas, were selected to represent the state’s stress-prone rice areas. Nadia represents the submergence-prone rainfed rice
Table 2. Growth ratesa (% per year) of rice area, yield, and production in West Bengal.
Period Area Yield Production
1974-80 −0.1*** 1.7*** 1.6***
1981-90 1.1*** 4.3*** 5.4***
1991-2000 0.5*** 1.8*** 2.3***
2001-09 −0.8*** 1.3*** 0.5***
All 0.4*** 2.6*** 3.0***aUsing a semi-log trend equation, the annual compound growth rates of area, yield, and production are computed using a 5-year moving average of the raw data centered on the end years. *** indicates statistical signifi cance at the 1% level.Data source: www.indiastat.com.
Table 3. Rice area, production, and yield by season from 2000 to 2008.
Year Area (000 ha) Yield (t/ha) Production (000 tons)
Aus Aman Boro Aus Aman Boro Aus Aman Boro
2000 394 3,640 1,402 2.60 2.97 4.86 1,026 10,804 6,812
2001 403 4,212 1,455 3.13 3.56 4.55 1,263 15,000 6,622
2002 385 4,051 1,406 3.10 3.48 4.48 1,195 14,091 6,298
2003 340 4,127 1,390 3.17 3.51 4.63 1,079 14,480 6,434
2004 321 4,086 1,376 3.05 3.66 4.64 980 14,962 6,386
2005 288 4,113 1,382 3.16 3.60 4.39 909 14,787 6,071
2006 284 4,002 1,401 3.04 3.62 4.84 863 14,470 6,781
2007 282 3,927 1,512 3.49 3.52 4.89 985 13,841 7,389
2008 292 4,087 1,557 3.11 3.70 4.20 908 15,111 6,537
Data source: www.indiastat.com.

222 B. Bagchi and M. Bool-Emerick
environment while Purulia and North 24 Parganas represent the drought-prone and saline-affected rice environments, respectively. In each district, at least two villages were selected for the study. The number of villages covered in each district varies depending on spatial variability in the area. Figure 2 shows the location of the survey sites in West Bengal while Table 4 lists the selected districts and the corresponding villages covered by the socioeconomic baseline survey. Only rice farming households that normally face the problem of submergence, drought, or salinity in rice production are considered in the survey. A total of 300 households were interviewed.
Fig. 2. Site locations for the socioeconomic baseline survey in West Bengal.

Patterns of adoption of improved rice varieties ... of West Bengal, India 223
Description of the major abiotic stressThe characteristics of the major abiotic stress in selected districts are presented in Table 5. The state has a long recorded history of fl ood. About 50% of the total area of the state is susceptible to fl oods. According to Appendix 1, several years are identifi ed as fl ood-free years during 1971 to 2009. Among the fl ood years, the fl ood in 1978 affected around 30,000 km2, the highest recorded fl ood-affected area yet. The state suffered consecutively from fl ood in 1998, 1999, and 2000. Based on focus group discussions conducted at the village level, the most recent fl ood was in 2007, affect-ing 60% of the total rice area in Nadia. The fl ood was around 1 m deep and lasted for 3 weeks. Based on farmers’ experience, fl ooding occurs four times in every 10 years and usually begins around September and October. In West Bengal, 60 blocks from 4 districts are considered as drought-prone, with 20 blocks located in Purulia District. The state faced severe drought in 1972, 1979, 1987, and 2009 (Appendix 1). According to focus group discussions conducted
Table 4. Selected sites representing stress-prone rice areas in West Bengal, India.
Stress District Villages Sample size Institution
Submergence Nadia Byaspur, Ekperepara, Shibpur 100 NZFDO
Drought Purulia Dhuliapara, Ghastoria, Kumardih 100 NZFDO
Salinitya North 24 Parganas
Darirjangal, Kumarjole (control) 100 NZFDO
Total 3 8 300aUnlike submergence and drought, salinity is prevalent year-round. To be able to compare livelihood and rice production practices, Kumarjole, a nonsaline village in Satkhira, is included in the survey.
Table 5. Stress characteristics in survey locations.
Item Nadia Purulia North 24 Parganas
Stress Submergence Drought Salinity
Rainfall in 2008 Normal Normal n/a
Most recent stress year 2007 2006 –
Frequency in 10 years 4 3 –
Season affected Aman Aman Boro
Duration 20–25 days > 30 days –
Depth of fl ood 1–1.5 m n/aa –
Stages of crop affected by stress Booting stage (Sep/Oct)
Booting stage (Sep/Oct)
–
% Rice area affected by most recent stress
60 n/aa n/a
% Households affected by stress 65 100 n/aa n/a = data not available.Source: STRASA focus group discussion, 2008.

224 B. Bagchi and M. Bool-Emerick
at the village level, farmers in Purulia reported that drought usually occurs during the booting stage of the rice crop. The frequency is three times in every 10 years and the most recent drought was in 2006, which affected all the farming households. The saline zone of West Bengal is composed of 77 blocks from various locations in South 24 Parganas, North 24 Praganas, and Midnapur East districts comprising 17.7% of the state’s area. A large area comprising 13 blocks of South 24 Parganas and 5 blocks of North 24 Parganas is popularly known as Sundarban. Soil becomes saline as it is exposed to sea water and continues to be inundated during high tides. The tidal saline water from the sea comes from the rivers Matla, Ichhamati, Piyali, Vidyadhari, Gosaba, and Saptamukhi. Soil salinity limits rice production, especially during the boro season, when salinity is high. Rice production is less affected by salinity during the aman season, when salts are fl ushed off by the monsoon rain. Depending on the severity and timing of abiotic stresses, the occurrence of these stresses can cause substantial reductions in yield (Table 6). Based on STRASA focus group discussions conducted at the village level, sample farmers revealed a 27% decrease in yield in Nadia (submergence-prone) during a stress year and a 69% reduction in yield in Purulia (drought-prone) relative to normal years. The reduction in yield is the result of stress in addition to other stochastic factors that affect yield. Average yields in these selected stress-prone locations were found to be lower than the district-level average yields. In Nadia and Purulia, average district-level yields during the wet season were 3.9 and 3.70 t/ha, respectively. Cropping calendar and major crops. According to the focus group interviews, farmers grow aus or aman rice during June and it is harvested in October/November while sowing of boro rice (rabi) starts in November to February and is harvested in April/May. Aside from rice, households grow jute, sesame, wheat, and mustard, except in Purulia and saline areas in North 24 Parganas, where rice is the sole crop cultivated by the sample farmers.
Farm-level analysis
Socio-demographic characteristicsEthnicity. The Indian caste system describes the social stratifi cation that refers to the concept of classifying individuals into groups based on power and wealth in society. Most households interviewed belong to the low caste categories or backward caste,
Table 6. Yield (t/ha) during normal and stress years in survey locations.
Item Nadia Purulia
Normal year 3.0 2.6
Stress year 2.2 0.8
% Difference –27 –69
Source: STRASA focus group discussion, 2008.
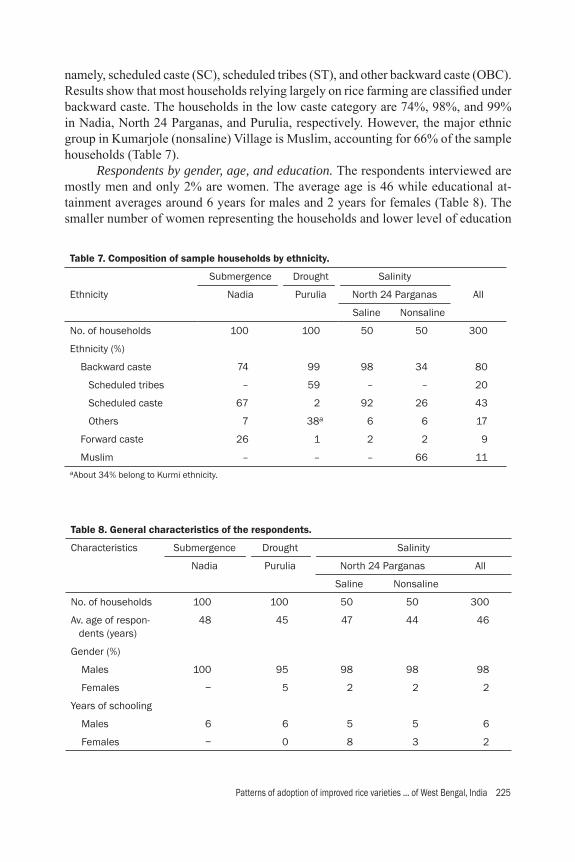
Patterns of adoption of improved rice varieties ... of West Bengal, India 225
namely, scheduled caste (SC), scheduled tribes (ST), and other backward caste (OBC). Results show that most households relying largely on rice farming are classifi ed under backward caste. The households in the low caste category are 74%, 98%, and 99% in Nadia, North 24 Parganas, and Purulia, respectively. However, the major ethnic group in Kumarjole (nonsaline) Village is Muslim, accounting for 66% of the sample households (Table 7). Respondents by gender, age, and education. The respondents interviewed are mostly men and only 2% are women. The average age is 46 while educational at-tainment averages around 6 years for males and 2 years for females (Table 8). The smaller number of women representing the households and lower level of education
Table 7. Composition of sample households by ethnicity.
Submergence Drought Salinity
Ethnicity Nadia Purulia North 24 Parganas All
Saline Nonsaline
No. of households 100 100 50 50 300
Ethnicity (%)
Backward caste 74 99 98 34 80
Scheduled tribes – 59 – – 20
Scheduled caste 67 2 92 26 43
Others 7 38a 6 6 17
Forward caste 26 1 2 2 9
Muslim – – – 66 11aAbout 34% belong to Kurmi ethnicity.
Table 8. General characteristics of the respondents.
Characteristics Submergence Drought Salinity
Nadia Purulia North 24 Parganas All
Saline Nonsaline
No. of households 100 100 50 50 300
Av. age of respon- dents (years)
48 45 47 44 46
Gender (%)
Males 100 95 98 98 98
Females − 5 2 2 2
Years of schooling
Males 6 6 5 5 6
Females − 0 8 3 2
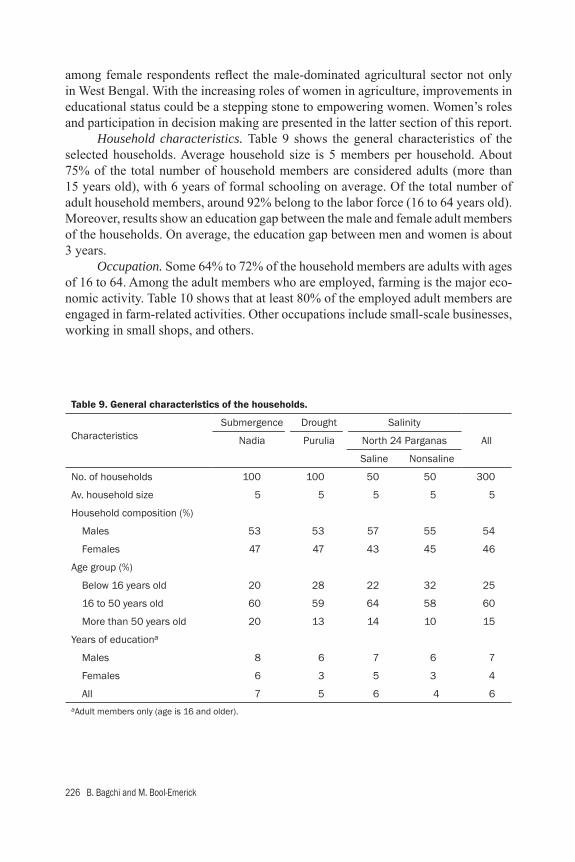
226 B. Bagchi and M. Bool-Emerick
among female respondents refl ect the male-dominated agricultural sector not only in West Bengal. With the increasing roles of women in agriculture, improvements in educational status could be a stepping stone to empowering women. Women’s roles and participation in decision making are presented in the latter section of this report. Household characteristics. Table 9 shows the general characteristics of the selected households. Average household size is 5 members per household. About 75% of the total number of household members are considered adults (more than 15 years old), with 6 years of formal schooling on average. Of the total number of adult household members, around 92% belong to the labor force (16 to 64 years old). Moreover, results show an education gap between the male and female adult members of the households. On average, the education gap between men and women is about 3 years. Occupation. Some 64% to 72% of the household members are adults with ages of 16 to 64. Among the adult members who are employed, farming is the major eco-nomic activity. Table 10 shows that at least 80% of the employed adult members are engaged in farm-related activities. Other occupations include small-scale businesses, working in small shops, and others.
Table 9. General characteristics of the households.
CharacteristicsSubmergence Drought Salinity
Nadia Purulia North 24 Parganas All
Saline Nonsaline
No. of households 100 100 50 50 300
Av. household size 5 5 5 5 5
Household composition (%)
Males 53 53 57 55 54
Females 47 47 43 45 46
Age group (%)
Below 16 years old 20 28 22 32 25
16 to 50 years old 60 59 64 58 60
More than 50 years old 20 13 14 10 15
Years of educationa
Males 8 6 7 6 7
Females 6 3 5 3 4
All 7 5 6 4 6aAdult members only (age is 16 and older).
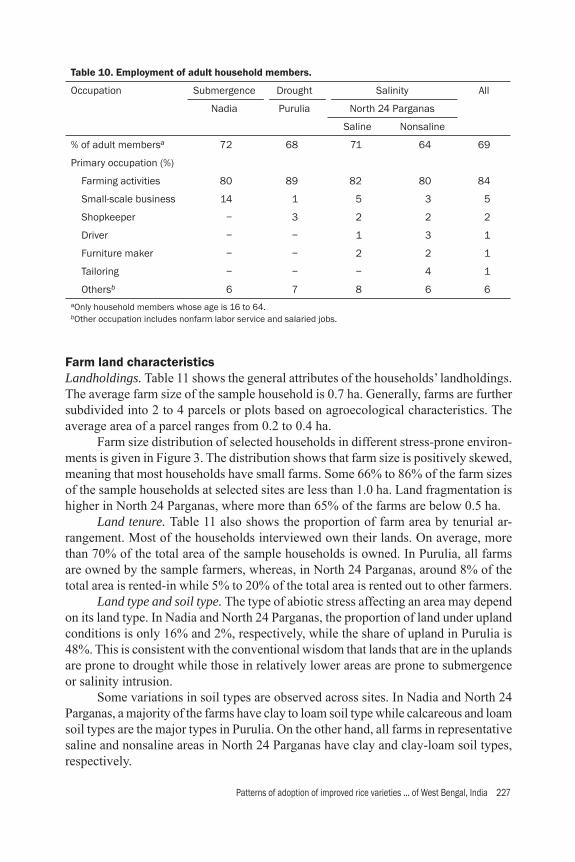
Patterns of adoption of improved rice varieties ... of West Bengal, India 227
Farm land characteristicsLandholdings. Table 11 shows the general attributes of the households’ landholdings. The average farm size of the sample household is 0.7 ha. Generally, farms are further subdivided into 2 to 4 parcels or plots based on agroecological characteristics. The average area of a parcel ranges from 0.2 to 0.4 ha. Farm size distribution of selected households in different stress-prone environ-ments is given in Figure 3. The distribution shows that farm size is positively skewed, meaning that most households have small farms. Some 66% to 86% of the farm sizes of the sample households at selected sites are less than 1.0 ha. Land fragmentation is higher in North 24 Parganas, where more than 65% of the farms are below 0.5 ha. Land tenure. Table 11 also shows the proportion of farm area by tenurial ar-rangement. Most of the households interviewed own their lands. On average, more than 70% of the total area of the sample households is owned. In Purulia, all farms are owned by the sample farmers, whereas, in North 24 Parganas, around 8% of the total area is rented-in while 5% to 20% of the total area is rented out to other farmers. Land type and soil type. The type of abiotic stress affecting an area may depend on its land type. In Nadia and North 24 Parganas, the proportion of land under upland conditions is only 16% and 2%, respectively, while the share of upland in Purulia is 48%. This is consistent with the conventional wisdom that lands that are in the uplands are prone to drought while those in relatively lower areas are prone to submergence or salinity intrusion. Some variations in soil types are observed across sites. In Nadia and North 24 Parganas, a majority of the farms have clay to loam soil type while calcareous and loam soil types are the major types in Purulia. On the other hand, all farms in representative saline and nonsaline areas in North 24 Parganas have clay and clay-loam soil types, respectively.
Table 10. Employment of adult household members.
Occupation Submergence Drought Salinity All
Nadia Purulia North 24 Parganas
Saline Nonsaline
% of adult membersa 72 68 71 64 69
Primary occupation (%)
Farming activities 80 89 82 80 84
Small-scale business 14 1 5 3 5
Shopkeeper − 3 2 2 2
Driver − − 1 3 1
Furniture maker − − 2 2 1
Tailoring − − − 4 1
Othersb 6 7 8 6 6aOnly household members whose age is 16 to 64.bOther occupation includes nonfarm labor service and salaried jobs.
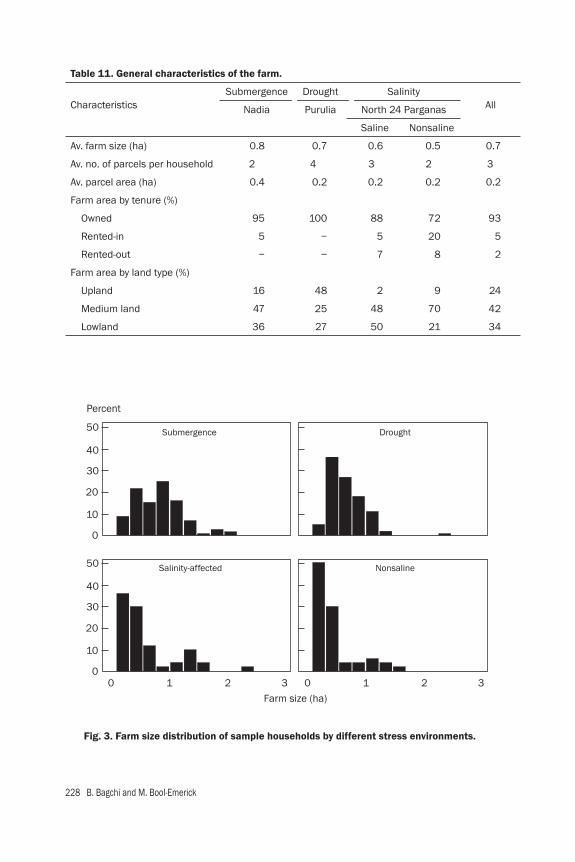
228 B. Bagchi and M. Bool-Emerick
50
50
40
40
30
30
20
20
10
10
0 01 12 23 30
0
Percent
Farm size (ha)
Submergence
Salinity-affected
Drought
Nonsaline
Table 11. General characteristics of the farm.
CharacteristicsSubmergence Drought Salinity
AllNadia Purulia North 24 Parganas
Saline Nonsaline
Av. farm size (ha) 0.8 0.7 0.6 0.5 0.7
Av. no. of parcels per household 2 4 3 2 3
Av. parcel area (ha) 0.4 0.2 0.2 0.2 0.2
Farm area by tenure (%)
Owned 95 100 88 72 93
Rented-in 5 − 5 20 5
Rented-out − − 7 8 2
Farm area by land type (%)
Upland 16 48 2 9 24
Medium land 47 25 48 70 42
Lowland 36 27 50 21 34
Fig. 3. Farm size distribution of sample households by different stress environments.
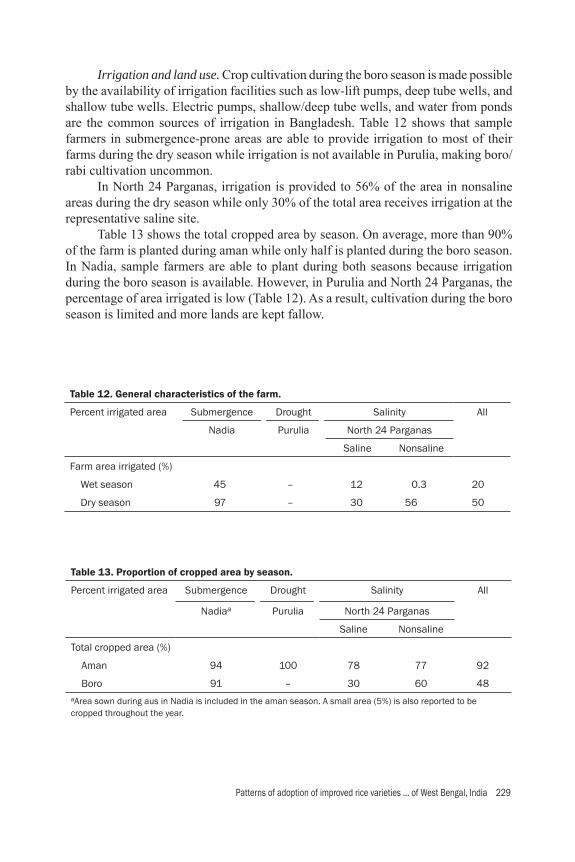
Patterns of adoption of improved rice varieties ... of West Bengal, India 229
Irrigation and land use. Crop cultivation during the boro season is made possible by the availability of irrigation facilities such as low-lift pumps, deep tube wells, and shallow tube wells. Electric pumps, shallow/deep tube wells, and water from ponds are the common sources of irrigation in Bangladesh. Table 12 shows that sample farmers in submergence-prone areas are able to provide irrigation to most of their farms during the dry season while irrigation is not available in Purulia, making boro/rabi cultivation uncommon. In North 24 Parganas, irrigation is provided to 56% of the area in nonsaline areas during the dry season while only 30% of the total area receives irrigation at the representative saline site. Table 13 shows the total cropped area by season. On average, more than 90% of the farm is planted during aman while only half is planted during the boro season. In Nadia, sample farmers are able to plant during both seasons because irrigation during the boro season is available. However, in Purulia and North 24 Parganas, the percentage of area irrigated is low (Table 12). As a result, cultivation during the boro season is limited and more lands are kept fallow.
Table 12. General characteristics of the farm.
Percent irrigated area Submergence Drought Salinity All
Nadia Purulia North 24 Parganas
Saline Nonsaline
Farm area irrigated (%)
Wet season 45 – 12 0.3 20
Dry season 97 – 30 56 50
Table 13. Proportion of cropped area by season.
Percent irrigated area Submergence Drought Salinity All
Nadiaa Purulia North 24 Parganas
Saline Nonsaline
Total cropped area (%)
Aman 94 100 78 77 92
Boro 91 – 30 60 48aArea sown during aus in Nadia is included in the aman season. A small area (5%) is also reported to be cropped throughout the year.
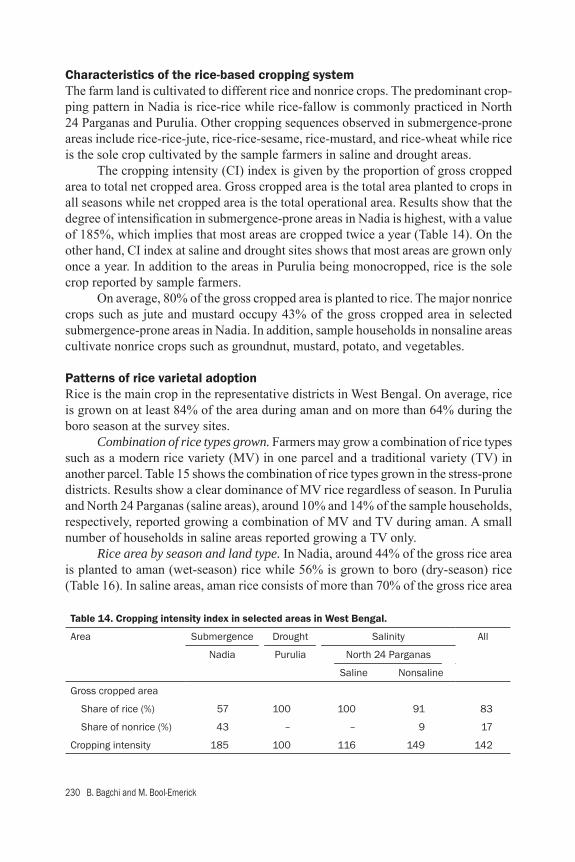
230 B. Bagchi and M. Bool-Emerick
Characteristics of the rice-based cropping systemThe farm land is cultivated to different rice and nonrice crops. The predominant crop-ping pattern in Nadia is rice-rice while rice-fallow is commonly practiced in North 24 Parganas and Purulia. Other cropping sequences observed in submergence-prone areas include rice-rice-jute, rice-rice-sesame, rice-mustard, and rice-wheat while rice is the sole crop cultivated by the sample farmers in saline and drought areas. The cropping intensity (CI) index is given by the proportion of gross cropped area to total net cropped area. Gross cropped area is the total area planted to crops in all seasons while net cropped area is the total operational area. Results show that the degree of intensifi cation in submergence-prone areas in Nadia is highest, with a value of 185%, which implies that most areas are cropped twice a year (Table 14). On the other hand, CI index at saline and drought sites shows that most areas are grown only once a year. In addition to the areas in Purulia being monocropped, rice is the sole crop reported by sample farmers. On average, 80% of the gross cropped area is planted to rice. The major nonrice crops such as jute and mustard occupy 43% of the gross cropped area in selected submergence-prone areas in Nadia. In addition, sample households in nonsaline areas cultivate nonrice crops such as groundnut, mustard, potato, and vegetables.
Patterns of rice varietal adoptionRice is the main crop in the representative districts in West Bengal. On average, rice is grown on at least 84% of the area during aman and on more than 64% during the boro season at the survey sites. Combination of rice types grown. Farmers may grow a combination of rice types such as a modern rice variety (MV) in one parcel and a traditional variety (TV) in another parcel. Table 15 shows the combination of rice types grown in the stress-prone districts. Results show a clear dominance of MV rice regardless of season. In Purulia and North 24 Parganas (saline areas), around 10% and 14% of the sample households, respectively, reported growing a combination of MV and TV during aman. A small number of households in saline areas reported growing a TV only. Rice area by season and land type. In Nadia, around 44% of the gross rice area is planted to aman (wet-season) rice while 56% is grown to boro (dry-season) rice (Table 16). In saline areas, aman rice consists of more than 70% of the gross rice area
Table 14. Cropping intensity index in selected areas in West Bengal.
Area Submergence Drought Salinity All
Nadia Purulia North 24 Parganas
Saline Nonsaline
Gross cropped area
Share of rice (%) 57 100 100 91 83
Share of nonrice (%) 43 – – 9 17
Cropping intensity 185 100 116 149 142

Patterns of adoption of improved rice varieties ... of West Bengal, India 231
while only 28% is planted to boro rice. On the other hand, 100% of the gross rice area is planted to aman rice in Purulia. Cultivation of rice in each season strongly depends on the availability of water for irrigation. Farmers in Nadia are able to grow rice in both seasons because enough irrigation water is available. In contrast, rice monocropping is common in Purulia and saline areas in North 24 Parganas due to the limited supply of irrigation water. The type of rice varieties grown is presented in Table 17. Modern rice varieties dominate the total rice area during aman and boro seasons for all selected districts.
Table 15. Combination of TV and MV rice grown during aman and boro seasons.
Percent of households Submergence Drought Salinity All
Nadia Purulia North 24 Parganas
Saline Nonsaline
Season and rice type
Aman (wet) season
MV only 100 86 86 100 92
TV only – – 4 – 1
MV and TV – 14 10 – 7
Boro (dry) season
MV only 100 – 100 100 100
Table 16. Proportion of rice area to total cropped area by season in selected areas in West Bengal.
Rice area Submergence Drought Salinity All
Nadia Purulia North 24 Parganas
Saline Nonsaline
Percent rice area
Aman 44 100 72 60 67
Boro 56 – 28 40 33
Table 17. Proportion of rice area by type and season.
Percent rice area Submergence Drought Salinity All
Nadia Purulia North 24 Parganas
Saline Nonsaline
Aman (wet) season
MV 93 92 90 100 93
TV 7 8 10 – 7
Boro (dry) season
MV 100 100 100 100 100
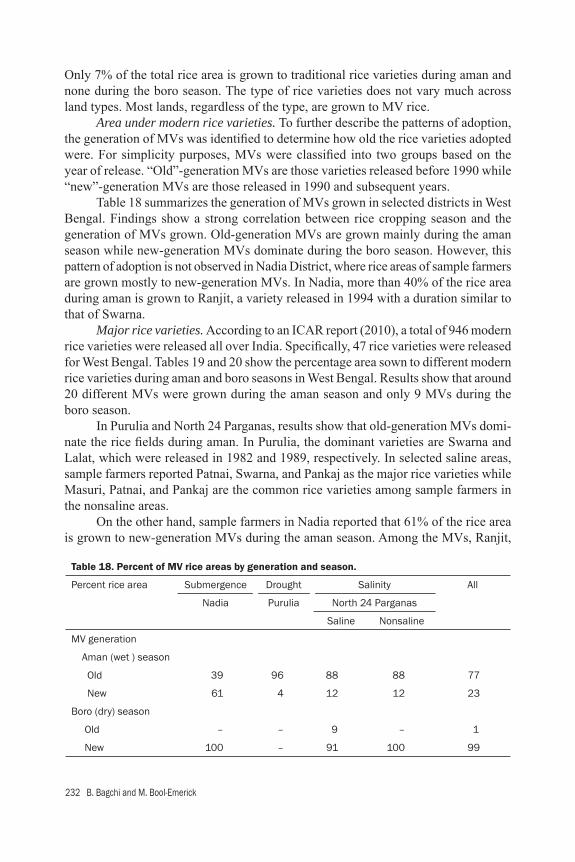
232 B. Bagchi and M. Bool-Emerick
Only 7% of the total rice area is grown to traditional rice varieties during aman and none during the boro season. The type of rice varieties does not vary much across land types. Most lands, regardless of the type, are grown to MV rice. Area under modern rice varieties. To further describe the patterns of adoption, the generation of MVs was identifi ed to determine how old the rice varieties adopted were. For simplicity purposes, MVs were classifi ed into two groups based on the year of release. “Old”-generation MVs are those varieties released before 1990 while “new”-generation MVs are those released in 1990 and subsequent years. Table 18 summarizes the generation of MVs grown in selected districts in West Bengal. Findings show a strong correlation between rice cropping season and the generation of MVs grown. Old-generation MVs are grown mainly during the aman season while new-generation MVs dominate during the boro season. However, this pattern of adoption is not observed in Nadia District, where rice areas of sample farmers are grown mostly to new-generation MVs. In Nadia, more than 40% of the rice area during aman is grown to Ranjit, a variety released in 1994 with a duration similar to that of Swarna. Major rice varieties. According to an ICAR report (2010), a total of 946 modern rice varieties were released all over India. Specifi cally, 47 rice varieties were released for West Bengal. Tables 19 and 20 show the percentage area sown to different modern rice varieties during aman and boro seasons in West Bengal. Results show that around 20 different MVs were grown during the aman season and only 9 MVs during the boro season. In Purulia and North 24 Parganas, results show that old-generation MVs domi-nate the rice fi elds during aman. In Purulia, the dominant varieties are Swarna and Lalat, which were released in 1982 and 1989, respectively. In selected saline areas, sample farmers reported Patnai, Swarna, and Pankaj as the major rice varieties while Masuri, Patnai, and Pankaj are the common rice varieties among sample farmers in the nonsaline areas. On the other hand, sample farmers in Nadia reported that 61% of the rice area is grown to new-generation MVs during the aman season. Among the MVs, Ranjit,
Table 18. Percent of MV rice areas by generation and season.
Percent rice area Submergence Drought Salinity All
Nadia Purulia North 24 Parganas
Saline Nonsaline
MV generation
Aman (wet ) season
Old 39 96 88 88 77
New 61 4 12 12 23
Boro (dry) season
Old – – 9 – 1
New 100 – 91 100 99
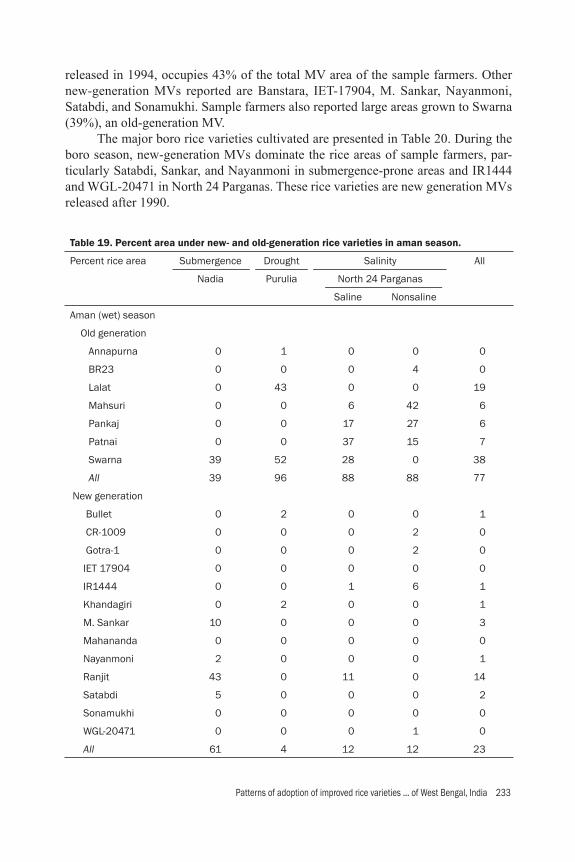
Patterns of adoption of improved rice varieties ... of West Bengal, India 233
released in 1994, occupies 43% of the total MV area of the sample farmers. Other new-generation MVs reported are Banstara, IET-17904, M. Sankar, Nayanmoni, Satabdi, and Sonamukhi. Sample farmers also reported large areas grown to Swarna (39%), an old-generation MV. The major boro rice varieties cultivated are presented in Table 20. During the boro season, new-generation MVs dominate the rice areas of sample farmers, par-ticularly Satabdi, Sankar, and Nayanmoni in submergence-prone areas and IR1444 and WGL-20471 in North 24 Parganas. These rice varieties are new generation MVs released after 1990.
Table 19. Percent area under new- and old-generation rice varieties in aman season.
Percent rice area Submergence Drought Salinity All
Nadia Purulia North 24 Parganas
Saline Nonsaline
Aman (wet) season
Old generation
Annapurna 0 1 0 0 0
BR23 0 0 0 4 0
Lalat 0 43 0 0 19
Mahsuri 0 0 6 42 6
Pankaj 0 0 17 27 6
Patnai 0 0 37 15 7
Swarna 39 52 28 0 38
All 39 96 88 88 77
New generation
Bullet 0 2 0 0 1
CR-1009 0 0 0 2 0
Gotra-1 0 0 0 2 0
IET 17904 0 0 0 0 0
IR1444 0 0 1 6 1
Khandagiri 0 2 0 0 1
M. Sankar 10 0 0 0 3
Mahananda 0 0 0 0 0
Nayanmoni 2 0 0 0 1
Ranjit 43 0 11 0 14
Satabdi 5 0 0 0 2
Sonamukhi 0 0 0 0 0
WGL-20471 0 0 0 1 0
All 61 4 12 12 23
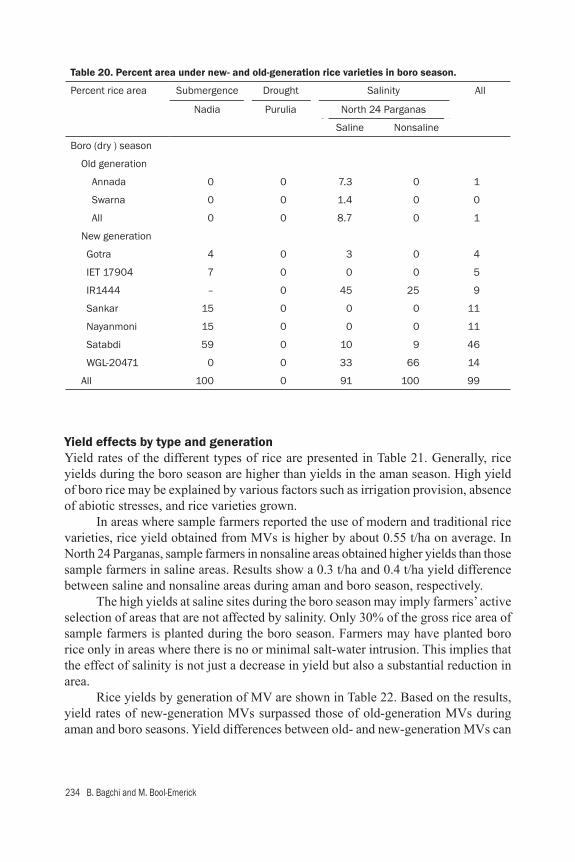
234 B. Bagchi and M. Bool-Emerick
Table 20. Percent area under new- and old-generation rice varieties in boro season.
Percent rice area Submergence Drought Salinity All
Nadia Purulia North 24 Parganas
Saline Nonsaline
Boro (dry ) season
Old generation
Annada 0 0 7.3 0 1
Swarna 0 0 1.4 0 0
All 0 0 8.7 0 1
New generation
Gotra 4 0 3 0 4
IET 17904 7 0 0 0 5
IR1444 – 0 45 25 9
Sankar 15 0 0 0 11
Nayanmoni 15 0 0 0 11
Satabdi 59 0 10 9 46
WGL-20471 0 0 33 66 14
All 100 0 91 100 99
Yield effects by type and generationYield rates of the different types of rice are presented in Table 21. Generally, rice yields during the boro season are higher than yields in the aman season. High yield of boro rice may be explained by various factors such as irrigation provision, absence of abiotic stresses, and rice varieties grown. In areas where sample farmers reported the use of modern and traditional rice varieties, rice yield obtained from MVs is higher by about 0.55 t/ha on average. In North 24 Parganas, sample farmers in nonsaline areas obtained higher yields than those sample farmers in saline areas. Results show a 0.3 t/ha and 0.4 t/ha yield difference between saline and nonsaline areas during aman and boro season, respectively. The high yields at saline sites during the boro season may imply farmers’ active selection of areas that are not affected by salinity. Only 30% of the gross rice area of sample farmers is planted during the boro season. Farmers may have planted boro rice only in areas where there is no or minimal salt-water intrusion. This implies that the effect of salinity is not just a decrease in yield but also a substantial reduction in area. Rice yields by generation of MV are shown in Table 22. Based on the results, yield rates of new-generation MVs surpassed those of old-generation MVs during aman and boro seasons. Yield differences between old- and new-generation MVs can

Patterns of adoption of improved rice varieties ... of West Bengal, India 235
Table 22. Rice yield (t/ha) of MVs by generation and season.a
Rice yield Submergence Drought Salinity All
Nadia Purulia North 24 Parganas
Saline Nonsaline
Aman (wet) season
Old 3.67 2.94 2.70 3.05 2.98
(0.71) (0.36) (0.40) (0.50) (0.48)
New 3.96 2.35 3.24 3.13 3.51
(0.28) (0.40) (0.25) (0.52) (0.68)
Difference 0.29 −0.59*** 0.54*** 0.08 0.53*
Boro (dry) season
Old – – 4.48 – 4.48
– – (0.13) – (0.13)
New 5.69 – 4.67 5.06 5.34
(0.32) – (0.22) (0.53) (0.56)
Difference – – 0.19* – 0.86**a ***, **, and * indicate statistical signifi cance at the 1%, 5%, and 10% levels, respectively. Standard devia-tion is in parentheses.
Table 21. Average rice yield (t/ha) by type and season.
Rice yield Submergence Drought Salinity All
Nadia Purulia North 24 Parganas
Saline Nonsaline
Aman (wet) season
MV 3.85 2.92 2.77 3.07 3.07
(0.51) (0.39) (0.42) (0.50) (0.55)
TV 3.33 2.61 2.39 2.70
(0.83) (0.4) (0.34) (0.60)
Difference 0.52 0.31** 0.38*** – 0.37**
Boro (dry) season
MV 5.69 – 4.64 5.06 5.32
(0.32) – (0.22) (0.53) (0.57)
*** and ** indicate statistical signifi cance at the 1% and 5% levels, respectively. Standard deviation is in parentheses.
236 B. Bagchi and M. Bool-Emerick
be attributed not only to the seed being new or old but also to other factors such as farmers’ practices, land characteristics, and climate. Similarly, the yield differences found by this study between MVs and TVs are not solely attributed to seed performance itself but also to other factors inherent to the farmers and the environment. However, aman rice yield was found to be 20% lower for new-generation MVs in Purulia. The low yield is attributed to the very short duration rice varieties grown such as Khandagiri and Bullet. On average, yields from areas grown to Khandagiri and Bullet were 2.2 and 2.4 t/ha, respectively, during the aman season.
Reasons for growing the dominant rice varietiesThe major rice varieties grown vary by season and location. The dominant rice varieties are Lalat, Masuri, Pankaj, Patnai, Ranjit, and Swarna during the aman season while IR1444, Sankar, Nayanmani, Satabdi, and WGL-20471 are the major rice varieties grown in the boro season. The characteristics of these major rice varieties as perceived by farmers are summarized in Tables 23 and 24. Based on the results, high yield, good taste, and high grain quality are the characteristics most farmers like about these aman rice varieties. For Patnai, a major rice variety in saline areas, only a few farmers recognized its high yield quality while 59% cited its low yield as undesirable. Similarly, 97%, 88%, and 86% of the sample farmers growing the major boro rice varieties indicated high yield, good grain, and good taste as the varieties’ good attributes. In addition, the high market price of IR1444, Satabdi, and WGL-20471 during the boro season is desired by the farmers. Low tolerance of pests and diseases and the poor ability of a variety to withstand lodging are the undesirable characteristics cited by farmers. Lodging is more common in Nadia during aman because of frequent fl ooding. On the other hand, poor pest toler-ance is the major undesirable attribute of the popular boro and aman rice varieties in the representative areas in West Bengal.
Adoption of new-generation MVs—econometric analysisAccording to previous results, old-generation MVs dominate during the aman season while most rice areas are grown to new-generation MVs during the boro season. Tobit analysis was done for Nadia District only because the adoption rates of old-generation MVs were very high in Purulia (96%) and North 24 Parganas (88%). This resulted in a highly unbalanced data set with little variation in the dependent variables for Purulia and North 24 Parganas. In Nadia, 39% of the aman rice area is grown to old-generation MVs while the remaining 61% is grown to new-generation MVs. Using cross-sectional data with 82 observations, the probability and intensity of adoption of new-generation MVs during the wet season are analyzed using a censored regression model or tobit model, which is discussed in Chapter 2 (see Chapter 2 for details) while summary statistics are presented in Table 25. Independent variables such as awareness of stress-tolerant varieties and women’s participation in decision making on what rice variety to grow were omitted due to a lack of variation in the data.

Patterns of adoption of improved rice varieties ... of West Bengal, India 237
Tabl
e 23
. Far
mer
s’ p
erce
ptio
ns r
egar
ding
pre
ferr
ed t
rait
s of
the
maj
or im
prov
ed v
arie
ties
.a
Ric
e va
rietie
sM
V ge
nera
tion
Ecos
yste
mH
igh
yiel
dPe
st-to
lera
ntG
ood
tast
eG
ood
grai
nH
igh
mar
ket p
rice
(% o
f hou
seho
lds)
Aman
sea
son
L
alat
Old
Dro
ught
97–
84
30
2
M
asur
iO
ldN
onsa
line
85
89
24
24
P
anka
jO
ldSa
line,
non
salin
e97
–9
03
2–
P
atna
iO
ldSa
line,
non
salin
e2
910
88
78
27
R
anjit
New
Subm
erge
nce
100
89
58
3–
S
war
na
Old
Subm
erge
nce,
dr
ough
t, sa
line
96
18
44
61
Bor
o se
ason
IR
144
4N
ewSa
line,
non
salin
e97
–8
06
937
N
ayan
mon
iN
ewSu
bmer
genc
e10
04
84
96
–
S
anka
rN
ewSu
bmer
genc
e10
0–
100
100
–
S
atab
diN
ewSu
bmer
genc
e97
–9
99
997
W
GL-
20
471
New
Salin
e, n
onsa
line
92
45
86
96
2a H
ouse
hold
s w
ere
allo
wed
to p
rovi
de m
ultip
le a
nsw
ers.
Eac
h va
lue
repr
esen
ts th
e pe
rcen
tage
of h
ouse
hold
s re
port
ing
each
cha
ract
eris
tic.
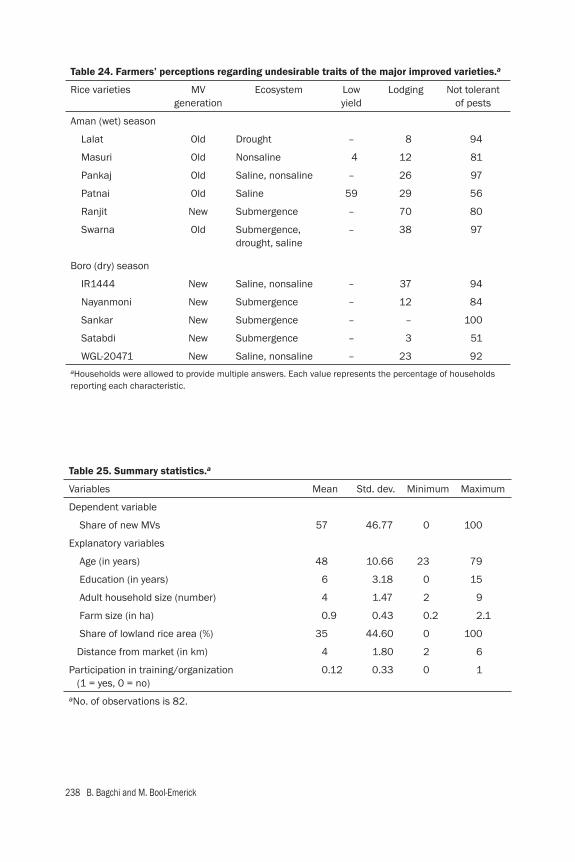
238 B. Bagchi and M. Bool-Emerick
Table 24. Farmers’ perceptions regarding undesirable traits of the major improved varieties.a
Rice varieties MV generation
Ecosystem Low yield
Lodging Not tolerant of pests
Aman (wet) season
Lalat Old Drought – 8 94
Masuri Old Nonsaline 4 12 81
Pankaj Old Saline, nonsaline – 26 97
Patnai Old Saline 59 29 56
Ranjit New Submergence – 70 80
Swarna Old Submergence, drought, saline
– 38 97
Boro (dry) season
IR1444 New Saline, nonsaline – 37 94
Nayanmoni New Submergence – 12 84
Sankar New Submergence – – 100
Satabdi New Submergence – 3 51
WGL-20471 New Saline, nonsaline – 23 92aHouseholds were allowed to provide multiple answers. Each value represents the percentage of households reporting each characteristic.
Table 25. Summary statistics.a
Variables Mean Std. dev. Minimum Maximum
Dependent variable
Share of new MVs 57 46.77 0 100
Explanatory variables
Age (in years) 48 10.66 23 79
Education (in years) 6 3.18 0 15
Adult household size (number) 4 1.47 2 9
Farm size (in ha) 0.9 0.43 0.2 2.1
Share of lowland rice area (%) 35 44.60 0 100
Distance from market (in km) 4 1.80 2 6
Participation in training/organization (1 = yes, 0 = no)
0.12 0.33 0 1
aNo. of observations is 82.

Patterns of adoption of improved rice varieties ... of West Bengal, India 239
Results from tobit model. Adoption of new-generation MVs is estimated us-ing censored regression (tobit) for the aman season only2 as this is the only season in which both new and old MVs co-exist. In the boro season, farmers grow mainly new-generation MVs. Empirical results are presented in Table 26. Surprisingly, the socioeconomic variables were found to be not correlated with the adoption of new MVs. Among the variables used to explain adoption, only the share of lowland rice area in total rice area is found signifi cant. The negative correlation means that a high share of lowland rice area is associated with low adoption of new MVs. The results show that the biophysical characteristics of the farm infl uence farmers to adopt new-generation MVs. Land type is a critical factor that needs to be considered for targeting new rice varieties in rainfed environments.
Economics of MV productionSeed and fertilizer use of the sample farmers in MV rice production is presented in Table 27. Seed use per unit area varies by location, with the average ranging from 61 to 72 kg per ha during aman and boro seasons. Transplanting is the major crop establishment practice. Farmers use various chemical fertilizers and micronutrients. In general, fertilizer and labor use during the boro season is higher than in the aman season. According to the results, N-fertilizer use is higher by an average of 40 kg/ha. The fertilizer rates for P and K are also higher by 7 and 17 kg/ha, respectively, during the boro season. However, it is important to note that fertilizer use reported by the sample farmers is much lower than the average fertilizer use in India. As cited by Gregory et al (2010), the mean fertilizer use on rice in India was 100 kg/ha for N, 33 kg/ha for P2O5 (or 14 kg/ha P), and 21 kg/ha for K2O (or 17 kg/ha K) in 2007. This indicates that farmers in stress-prone rice environments use less N fertilizer, especially during the aman season. The low adoption level of fertilizer is caused by the high production risk in
2Most rice area is grown to new-generation MVs during the boro season.
Table 26. Results from tobit model with robust standard errors.
Independent variables Tobit
Marginal effects Elasticity
Distance from market –5.07 –0.32
Farm size –12.58 –0.19
Adult household size 0.85 0.07
Education –2.56 –0.27
Age 0.16 0.13
Participation in training/organization (1 = yes, 0 = no) 0.73 0.001
Share of lowland rice area (%) –0.49***a –0.29a*** indicates statistical signifi cance at the 1% level.

240 B. Bagchi and M. Bool-Emerick
these areas where farmers tend to underuse fertilizer because of the high probability of fl ood or drought damage. Aside from higher fertilizer rates during the boro season, labor use is also higher. On average, boro rice cultivation requires an additional 21 person-days/ha. The ad-ditional labor is required for irrigating crops and weeding during the boro season (Tables 28 and 29).
Costs and returns analysis of rice productionRice production is the main source of livelihood in selected stress-prone districts. Table 30 presents the costs and returns of MV rice production during boro and aman seasons. On average, labor costs during the aman season comprise about 60% of the total costs while power cost comprises only about 16% of the total costs (Appendix 2). Family labor plays an important role in rice production as it shares more than 60% of the labor cost. Net returns from MV rice production vary by season and across sites. In general, net income from rice during the boro season is signifi cantly higher than that of the aman season. This is often attributed to the more favorable climate during the boro season. The variations in net income across sites may also be explained by various factors such as crop management practices, the performance of a rice variety, severity of stress, and others.
Table 27. Input use in MV rice production.
Inputs Submergence Drought Salinity All
Nadia Purulia North 24 Parganas
Saline Nonsaline
Aman
Seeds (kg/ha) 61 72 70 69 67
Fertilizer (kg/ha)
N 59 25 25 26 35
P 11 7 5 4 7
K 26 5 4 9 11
Labor (person-days/ha) 172 151 137 145 153
Boro
Seeds (kg/ha) 74 76 73 74
Fertilizer (kg/ha)
N 91 58 44 75
P 13 18 9 14
K 32 21 24 28
Labor (person-days/ha) 178 180 161 174
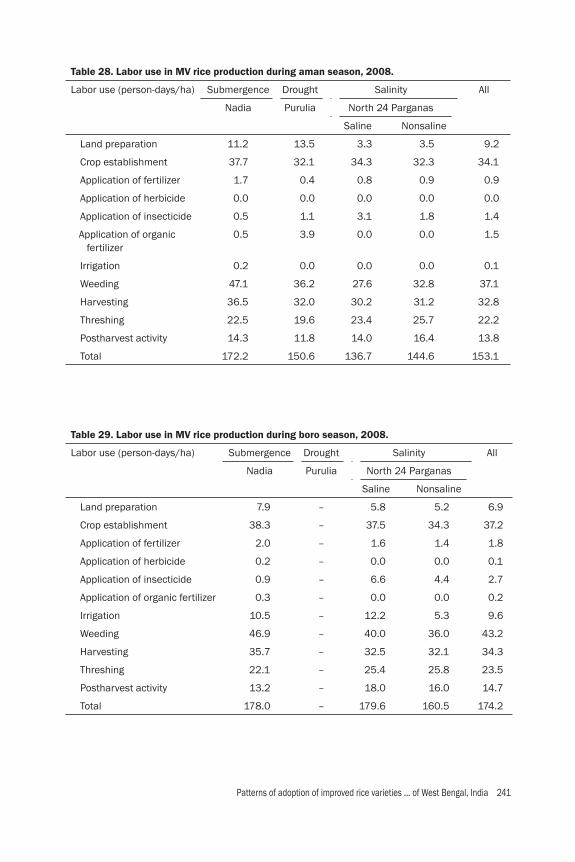
Patterns of adoption of improved rice varieties ... of West Bengal, India 241
Table 28. Labor use in MV rice production during aman season, 2008.
Labor use (person-days/ha) Submergence Drought Salinity All
Nadia Purulia North 24 Parganas
Saline Nonsaline
Land preparation 11.2 13.5 3.3 3.5 9.2
Crop establishment 37.7 32.1 34.3 32.3 34.1
Application of fertilizer 1.7 0.4 0.8 0.9 0.9
Application of herbicide 0.0 0.0 0.0 0.0 0.0
Application of insecticide 0.5 1.1 3.1 1.8 1.4
Application of organic fertilizer
0.5 3.9 0.0 0.0 1.5
Irrigation 0.2 0.0 0.0 0.0 0.1
Weeding 47.1 36.2 27.6 32.8 37.1
Harvesting 36.5 32.0 30.2 31.2 32.8
Threshing 22.5 19.6 23.4 25.7 22.2
Postharvest activity 14.3 11.8 14.0 16.4 13.8
Total 172.2 150.6 136.7 144.6 153.1
Table 29. Labor use in MV rice production during boro season, 2008.
Labor use (person-days/ha) Submergence Drought Salinity All
Nadia Purulia North 24 Parganas
Saline Nonsaline
Land preparation 7.9 – 5.8 5.2 6.9
Crop establishment 38.3 – 37.5 34.3 37.2
Application of fertilizer 2.0 – 1.6 1.4 1.8
Application of herbicide 0.2 – 0.0 0.0 0.1
Application of insecticide 0.9 – 6.6 4.4 2.7
Application of organic fertilizer 0.3 – 0.0 0.0 0.2
Irrigation 10.5 – 12.2 5.3 9.6
Weeding 46.9 – 40.0 36.0 43.2
Harvesting 35.7 – 32.5 32.1 34.3
Threshing 22.1 – 25.4 25.8 23.5
Postharvest activity 13.2 – 18.0 16.0 14.7
Total 178.0 – 179.6 160.5 174.2
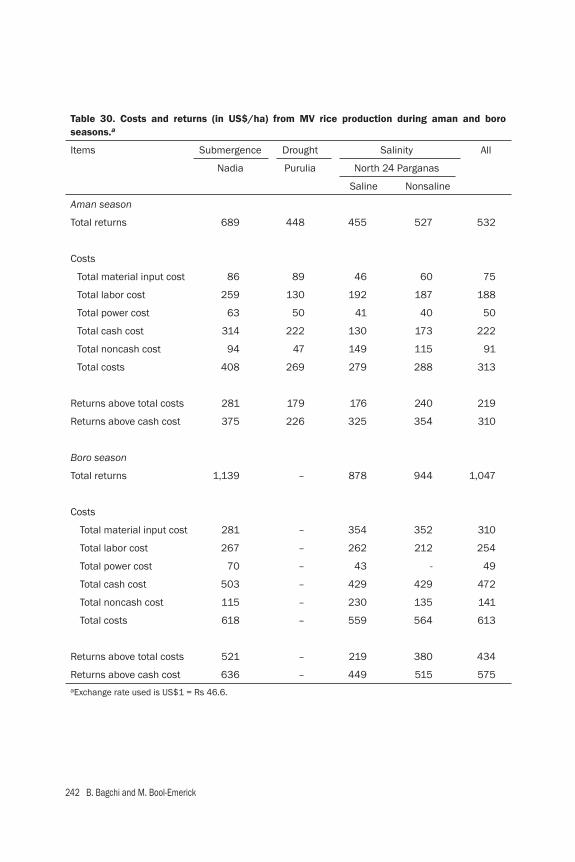
242 B. Bagchi and M. Bool-Emerick
Table 30. Costs and returns (in US$/ha) from MV rice production during aman and boro seasons.a
Items Submergence Drought Salinity All
Nadia Purulia North 24 Parganas
Saline Nonsaline
Aman season
Total returns 689 448 455 527 532
Costs
Total material input cost 86 89 46 60 75
Total labor cost 259 130 192 187 188
Total power cost 63 50 41 40 50
Total cash cost 314 222 130 173 222
Total noncash cost 94 47 149 115 91
Total costs 408 269 279 288 313
Returns above total costs 281 179 176 240 219
Returns above cash cost 375 226 325 354 310
Boro season
Total returns 1,139 – 878 944 1,047
Costs
Total material input cost 281 – 354 352 310
Total labor cost 267 – 262 212 254
Total power cost 70 – 43 - 49
Total cash cost 503 – 429 429 472
Total noncash cost 115 – 230 135 141
Total costs 618 – 559 564 613
Returns above total costs 521 – 219 380 434
Returns above cash cost 636 – 449 515 575 aExchange rate used is US$1 = Rs 46.6.

Patterns of adoption of improved rice varieties ... of West Bengal, India 243
Rice production using modern varieties is found profi table among sample house-holds in selected rainfed areas. The incremental benefi t from growing MVs relative to TVs is around $90 or 40%. In addition, a comparison of the profi tability of old- and new-generation MVs is presented in Tables 31 and 32. According to Tables 31 and 32, rice production under new-generation MVs dur-ing the aman season is more profi table than that of old-generation MVs. On average, net returns from new MVs are higher by 9% to 66%, depending on location. However, more areas are cultivated to old-generation MVs during aman despite this result. The choice to adopt old-generation MVs during the aman season can also be attributed to other factors such as farmers’ preferences in rice varieties as indicated in Table 23. Input uses by generation of MVs are presented in Appendix 3 and 4.
Crop production and disposalMore than 50% of the sample households in stress-prone areas sell a portion of their rice output in the market. On average, 44% of the total rice output is sold in Nadia and 24% and 23% is sold in Purulia and saline areas in North 24 Parganas, respec-tively. In Purulia, the relatively low rice allocation to the market can be attributed to the low cropping intensity as most farmers can grow rice during the aman season only. In effect, more than 70% of the rice production is secured by the household for food consumption. A similar pattern is observed in North 24 Parganas, where boro cultivation can be problematic due to high salinity (Table 33).
Different sources of incomeTable 34 summarizes the different sources of income3 of the sample households. Income from crop production is 18% to 58% of the total income. In Nadia, 34% of the income from crop production comes from nonrice crops such as jute, banana, cabbage, and mustard while rice is the only crop grown by the sample farmers in Purulia. Similarly, rice is the only crop grown by the sample farmers in saline areas of North 24 Parganas while, in nonsaline areas, sample farmers are able to grow nonrice crops. On average, 19% of the total income from crop production is derived from nonrice crops such as vegetables, mustard, and sesame in selected nonsaline areas. Aside from crop production, households derive income from various activities. Other income sources include farm and nonfarm income-generating activities. In Nadia, a portion of the income of the sample households is derived from other farm activities such as selling of animals and animal by-products (2.5%), fi sh production (0.6%), and farm labor services (2.6%) while nonfarm income also comprises 36% of the total income of the sample households. More than 90% of the income from nonfarm activities is derived mostly from small-scale businesses and salaried jobs. On the other hand, farm labor services are important sources of income in Purulia District. On average, 31% of the total income of the sample households comes from farm labor services. Sample farmers are able to render labor services during the boro
3Income is defi ned as the gross income derived from crop production (including the value of produce consumed at home), animal sales, and other farm and nonfarm activities.
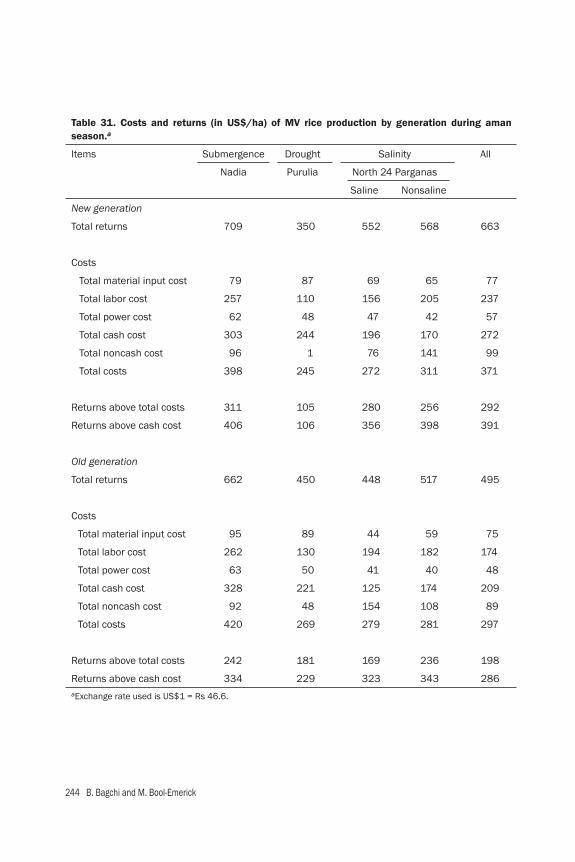
244 B. Bagchi and M. Bool-Emerick
Table 31. Costs and returns (in US$/ha) of MV rice production by generation during aman season.a
Items Submergence Drought Salinity All
Nadia Purulia North 24 Parganas
Saline Nonsaline
New generation
Total returns 709 350 552 568 663
Costs
Total material input cost 79 87 69 65 77
Total labor cost 257 110 156 205 237
Total power cost 62 48 47 42 57
Total cash cost 303 244 196 170 272
Total noncash cost 96 1 76 141 99
Total costs 398 245 272 311 371
Returns above total costs 311 105 280 256 292
Returns above cash cost 406 106 356 398 391
Old generation
Total returns 662 450 448 517 495
Costs
Total material input cost 95 89 44 59 75
Total labor cost 262 130 194 182 174
Total power cost 63 50 41 40 48
Total cash cost 328 221 125 174 209
Total noncash cost 92 48 154 108 89
Total costs 420 269 279 281 297
Returns above total costs 242 181 169 236 198
Returns above cash cost 334 229 323 343 286 aExchange rate used is US$1 = Rs 46.6.
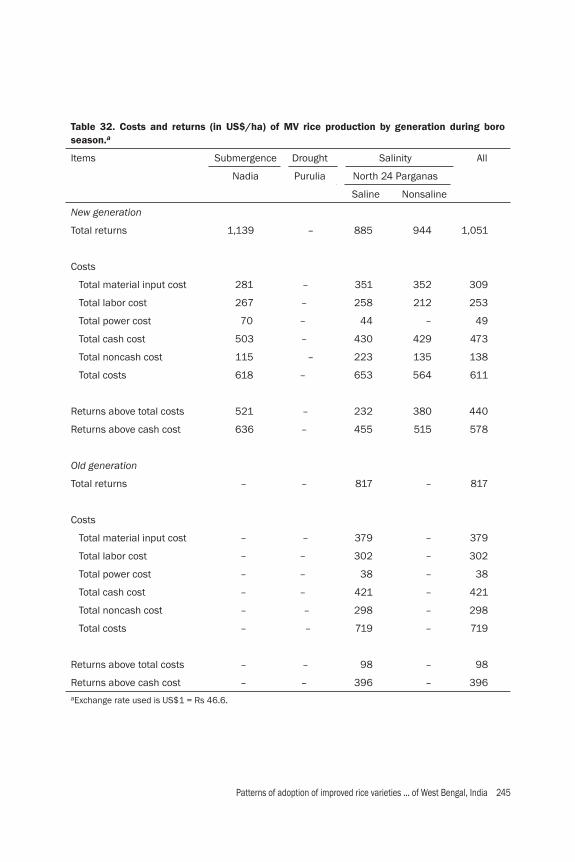
Patterns of adoption of improved rice varieties ... of West Bengal, India 245
Table 32. Costs and returns (in US$/ha) of MV rice production by generation during boro season.a
Items Submergence Drought Salinity All
Nadia Purulia North 24 Parganas
Saline Nonsaline
New generation
Total returns 1,139 – 885 944 1,051
Costs
Total material input cost 281 – 351 352 309
Total labor cost 267 – 258 212 253
Total power cost 70 – 44 – 49
Total cash cost 503 – 430 429 473
Total noncash cost 115 – 223 135 138
Total costs 618 – 653 564 611
Returns above total costs 521 – 232 380 440
Returns above cash cost 636 – 455 515 578
Old generation
Total returns – – 817 – 817
Costs
Total material input cost – – 379 – 379
Total labor cost – – 302 – 302
Total power cost – – 38 – 38
Total cash cost – – 421 – 421
Total noncash cost – – 298 – 298
Total costs – – 719 – 719
Returns above total costs – – 98 – 98
Returns above cash cost – – 396 – 396 aExchange rate used is US$1 = Rs 46.6.

246 B. Bagchi and M. Bool-Emerick
Table 33. Rice output and disposal.
Crop disposal Submergence Drought Salinity All
Nadia Purulia North 24 Parganas
Saline Nonsaline
Percent of households that sold 85 58 52 38 63
Uses (%)
Food 55 73 75 67 62
Sold 44 24 23 31 36
Seed 1 3 1 2 2
Payment 0 0 1 0 0
Others 0 0 0 0 0
Table 34. Share (%) of different sources of income.a
Income sources Submergence Drought Salinity All
Nadia Purulia North 24 Parganas
Saline Nonsaline
Farm income
Crop production 58.0 24.4 26.1 18.2 38.3
Rice 38.1 24.4 26.1 14.9 28.7
Nonrice crops 19.9 0.0 0.0 3.4 9.6
Other farm income 5.8 34.8 21.5 27.1 18.7
Farm labor 2.6 31.2 10.5 5.9 10.7
Sale of animals and by-products 2.5 3.2 0.8 0.2 2.0
Aquaculture/fi sh production 0.6 0.0 10.3 21.0 5.9
Fruits and forest products 0.0 0.4 0.0 0.0 0.1
Nonfarm income 36.2 40.8 52.4 54.7 43.0
Small-scale business 25.4 5.6 15.6 27.9 20.3
Salary 9.0 23.6 10.3 14.9 13.7
Renting out of assets 0.0 1.2 3.9 0.4 0.8
Remittance 0.1 0.0 0.0 0.2 0.1
Nonfarm labor 1.6 10.5 22.6 11.3 8.0
Total income (Rs/household/year) 109,785 54,460 58,576 107,811 82,479
Income per capita per day (US$) 1.38 0.71 0.69 1.31 1.03aExchange rate used is $1 = Rs 46.6.

Patterns of adoption of improved rice varieties ... of West Bengal, India 247
season when none of the farmers in the sample area are able to grow rice. Aside from farm labor, nonfarm labor activities and salaried jobs are other important sources of income in Purulia. Rice farming accounts for 26% of the total income in saline areas of North 24 Parganas. In addition, households derive income from fi shing or aquaculture, which represents 10% of the total income while more than 50% of the income is derived from various nonfarm activities such as operating small-scale businesses, rendering nonfarm labor services, and working in salaried jobs. Income per capita ranges from Rs 11,700 to 23,000 per year or $0.70–$1.40 per day. Per capita income in submergence-prone and nonsaline areas averages at least $1.30 per day while sample households in drought-prone and saline areas earn less ($0.70 per capita per day). Income is low in drought and saline areas because most farmers practice monocropping.
Household coping strategiesHouseholds exposed to abiotic stresses make necessary adjustments to cope with stress. Adjustments vary by households depending on the options available to them. Poor households with limited assets are expected to be the most vulnerable group in the event of submergence or drought. Most adjustments reported in the survey are ex post coping mechanisms, which include a decrease in food consumption and an increase in borrowing. Rice suffi ciency. Most households at the study sites grow rice or keep a portion of rice harvest for home consumption. Table 35 shows rice suffi ciency of households during normal and stress years. During normal years, 86% of the households are rice suffi cient for 12 months at selected sites. However, during stress years, the percentage of households that are rice suffi cient for 12 months declines to 47%. The decrease in rice suffi ciency is more prominent in Purulia than in Nadia. This is because a major-ity of the farmers is Purulia grow rice crops only in the aman season while farmers in Nadia can grow two rice crops per year. In terms of rice suffi ciency, households in drought-prone areas are considered more vulnerable in the event of abiotic shocks.
Table 35. Rice suffi ciency of households (%).
Rice suffi ciency(no. of months)
Submergence Drought All Submergence Drought All
Nadia Purulia Nadia Purulia
Normal year Stress year
0 to 3 0 0 0 0 12 6
4 to 6 1 6 4 5 44 25
7 to 9 3 12 8 6 28 17
10 0 5 3 2 7 5
11 0 0 0 0 1 1
12 96 76 86 87 7 47

248 B. Bagchi and M. Bool-Emerick
The decrease in rice supply among households during stress years has an ef-fect on the frequency of meals eaten by the households per day. Table 36 shows the frequency of meal consumption of households during normal and stress years. Similar to the pattern of rice suffi ciency, the change in the number of meals eaten per day is more in Purulia. During normal years, sample households eat 3 meals a day. In the event of drought, 47% of the sample households reduce the frequency of meals to 2 per day. On the other hand, the change in meal consumption of the sample households in Nadia did not vary much. During stress years, households may opt to decrease food consumption by skipping meals and/or eating less in order to prolong the household’s food supply. This kind of adjustment may have an adverse effect on the health and nutrition of the household. Consumption patterns. Consumption patterns of households between normal and stress years are given in Table 37. According to the results, the percentage of households consuming rice on a regular basis did not change much between normal and stress years while a slight change in fi sh, meat, and milk consumption was reported during stress years by sample households in Purulia. Changes in borrowing. Borrowing, in the form of cash or kind, plays an important role in meeting households’ consumption defi cit. Households borrow cash from formal and informal institutions such as relatives or other social networks. On average, 89% of the sample households reported an increase in cash borrowing during stress years (Table 38). On the other hand, borrowing in the form of food and seed did not change much. In addition, deferred loan payments were reported by some households at the study sites. In Purulia, 90% of the households claimed to defer on loan payments during stress years while only 42% deferred on loan payments in Nadia. The incidence of borrowing in the form of cash is high during stress years. Farmers borrow money to meet immediate consumption needs of the household and to purchase inputs for crop production. Reliance on borrowing through banks and informal money lenders during stress years creates the need for a well-developed credit market in these areas. Aside from borrowing, households reported the use of savings during stress years. The use of savings was reported by 47% of the sample households. Other adjustments made by sample households in Purulia were consumption of seed reserves (81%) and selling of assets (69%). Other adjustments. Farmers interviewed during the FGD reported that there is no major adjustment in areas devoted to rice in the event of fl ood or drought. However, the time of occurrence of such a stress is important in farmers’ decision on how much rice area to plant. Generally, if drought comes early, farmers delay transplanting or reduce their rice area until enough water becomes available to grow rice crops. Similarly, if fl ood comes early, farmers may reduce area devoted to rice or delay transplanting if possible. In addition, farmers reported the application of more urea to help rice crops recover after suffering from a stress.

Patterns of adoption of improved rice varieties ... of West Bengal, India 249
Table 38. Other adjustments in borrowing made by farmers to cope with fl ood and drought.
Adjustments Submergence Drought All
Nadia Purulia
Change in cash borrowing
Decreased – 1 1
Increased 89 90 89
No change 11 9 10
Deferred loan payment
No 58 10 36
Yes 42 90 64
Table 36. Number of meals eaten per day by the household.
No. of meals Submergence DroughtAllNadia Purulia
Normal Stress Normal Stress Normal Stress
2 0 2 0 47 0 25
3 100 98 100 53 100 75
Table 37. Daily consumption (% of households) of major food items.
Item Submergence DroughtAllNadia Purulia
Normal Stress Normal Stress Normal Stress
Egg 1 0 1 1 1 1
Fish 0 0 6 1 3 1
Meat 0 0 13 2 7 1
Milk 8 5 9 1 9 3
Pulses 98 100 7 7 53 54
Rice 98 98 100 100 99 99
Vegetables 97 95 100 98 99 97
Wheat 52 58 0 0 26 29
250 B. Bagchi and M. Bool-Emerick
In addition, various drought mitigation programs are available in the state depending on the severity of drought. Short-term mitigation measures are develop-ment programs such as a food for work program, tube-well construction, high prior-ity of water storage projects, transportation of drinking water from other areas, and high priority for drought-resistant crops. On the other hand, medium-term measures include rainwater harvesting and watershed management, early completion of irriga-tion and water supply projects, regional planning for better use of water, developing early-maturing crop varieties, dry-land farming techniques, and the introduction of water-saving crops.
Awareness of stress-tolerant varietiesSample households were asked about their awareness of stress-tolerant rice variet-ies. All sample households have not heard of or planted stress-tolerant rice varieties. However, all respondents are willing to grow these varieties.
Gender division of responsibility and decision-makingWomen make up 46% of the total household members of the sample. Men and women are involved in different farm and nonfarm activities and the degree of participation of women in decision-making varies depending on the activity. Table 39 shows the labor participation of women in rice production. Labor participation of men and women varies across sites. In selected submergence-prone areas in Nadia, women’s partici-pation in farming activities is very low and close to zero. Nadia is located along the border of Bangladesh, where most women are involved in homestead activities and participation in farming activities is rare. On the other hand, the reverse is observed in selected areas in Purulia and North 24 Parganas (saline area), where more than 60% of the hired labor is provided by women. Table 40 presents the degree of participation of men and women in various ac-tivities. An index is computed to measure the level of empowerment among women in decision-making related to both farm and nonfarm activities. A high index implies high empowerment among women. According to the results, men dominate in most decision-making pertaining to farming activities. More than 90% of the decisions about what varieties to grow, adop-tion of new technology, hiring farm labor, marketing of harvested crops, purchasing of farm implements, allocation of income, and borrowing are made by men. Women participate in decisions regarding which food to consume in times of crisis, children’s education, and the number of children to raise. On average, more than 60% of the decisions regarding food to consume and children’s education are equally participated in by men and women. Moreover, 92% of the decisions about the number of children to raise are made jointly by men and women. Variations in the degree of women’s participation in decision-making are also observed. In nonsaline areas, sample respondents reported the dominance of men in decision-making with regard to food items to consume (72% by men only), children’s education (63% by men only), and the number of children to raise (71% by men
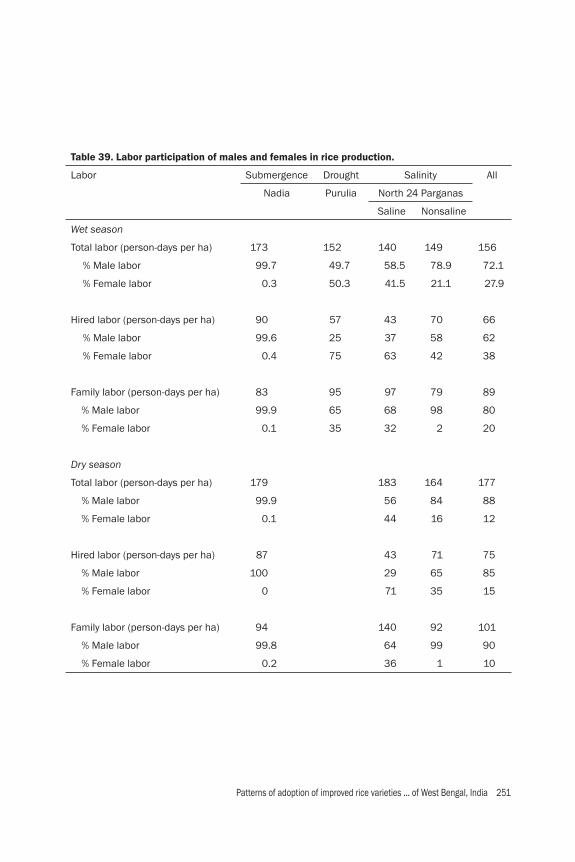
Patterns of adoption of improved rice varieties ... of West Bengal, India 251
Table 39. Labor participation of males and females in rice production.
Labor Submergence Drought Salinity All
Nadia Purulia North 24 Parganas
Saline Nonsaline
Wet season
Total labor (person-days per ha) 173 152 140 149 156
% Male labor 99.7 49.7 58.5 78.9 72.1
% Female labor 0.3 50.3 41.5 21.1 27.9
Hired labor (person-days per ha) 90 57 43 70 66
% Male labor 99.6 25 37 58 62
% Female labor 0.4 75 63 42 38
Family labor (person-days per ha) 83 95 97 79 89
% Male labor 99.9 65 68 98 80
% Female labor 0.1 35 32 2 20
Dry season
Total labor (person-days per ha) 179 183 164 177
% Male labor 99.9 56 84 88
% Female labor 0.1 44 16 12
Hired labor (person-days per ha) 87 43 71 75
% Male labor 100 29 65 85
% Female labor 0 71 35 15
Family labor (person-days per ha) 94 140 92 101
% Male labor 99.8 64 99 90
% Female labor 0.2 36 1 10

252 B. Bagchi and M. Bool-Emerick
Table 40. Division of responsibilities, decision making (%), and Women’s Empowerment Index in various agricultural and other livelihood activities.
Decisions Husband only
Wife only
Both WEI
Husband more
infl uential
Both equally
infl uential
Wife more infl uential
What rice variety(ies) to grow 95 2 – – 3 1.16
Who and number of farm laborers to hire
96 2 1 – 1 1.16
Whether to sell/consume harvested crop
94 2 1 – 3 1.31
Quantity of output to sell and consume
95 2 – – 3 1.28
When and where to sell the harvested crop
97 2 – – 1 1.35
At what price to sell the output
97 2 – – 1 1.31
What farm implements to purchase
98 2 – – – 1.15
Whether to slaughter and sell animals
78 2 – – 20 1.57
Adoption of technology in rice production
97 2 – – 1 1.17
Allocation of farm income 97 2 – – 1 1.23
Allocation of household income
94 2 – 1 3 1.22
What types of food to con-sume in times of stress
36 2 – 1 61 2.33
Children’s education 32 2 – 1 65 2.48
Where to borrow 92 1 – – 7 1.35
Participation in voting/politics 69 2 – – 29 2.28
Number of children to raise 8 – – – 92 4.45
Overall 1.67
Patterns of adoption of improved rice varieties ... of West Bengal, India 253
only). In Nadia, 92% of the sample households reported equal participation of men and women in voting/politics. Overall, women’s participation is found visible only on decisions regarding the type of food to consume, children’s education, and the number of children to raise. The general WEI of the sample households is 1.67, which indicates very low empowerment among women in decision-making.
Summary of the fi ndings• Farming is the main occupation of the households in selected areas in West Ben-
gal. At least 80% of the total number of adults who are employed cited farming as their primary occupation.
• Cropping intensity is lowest in Purulia (100%) due to a lack of irrigation water, causing farmers to practice monocropping. On the other hand, cropping inten-sity is highest in Nadia, where farmers are able to cultivate crops twice a year.
• In North 24 Parganas, the saline site (116%) has lower cropping intensity than nonsaline areas (149%). This is due to the high salinity, which limits crop pro-duction during the boro season.
• MV adoption is very high at the selected survey sites. Most lands regardless of type and season are grown to MVs. During the boro season, the total rice area of the sample households is planted to MVs while 7% to 10% of the rice area is planted to TVs during the aman season.
• Old-generation MVs dominate during the aman season while new-generation MVs occupy most rice areas during the boro season in North 24 Parganas (saline and nonsaline areas). However, new-generation MVs are predominant in Nadia regardless of season.
• The major rice varieties at the submergence site (Nadia) are Ranjit (new) and Swarna (old) during aman and Nayanmoni, Sankar, and Satabdi (new MVs) dur-ing boro season. At the drought-prone site (Purulia), old-generation MVs such as Lalat and Swarna are the major aman rice varieties. In selected saline areas in North 24 Parganas, old-generation MVs such as Patnai, Pankaj, and Swarna are the major aman rice varieties. At nonsaline sites, Pankaj and Mahsuri dominate. During the boro season, IR1444 (new) and WGL-20471 (new) are the major rice varieties in both saline and nonsaline areas. The varietal attributes desired by sample farmers include high yield, good taste, and good quality of grains.
• Overall, the yield of MVs (3.07 t/ha) is higher than that of traditional varieties (2.70 t/ha) during the aman season. Similarly, the yield of new-generation MVs is signifi cantly higher than that of old-generation MVs during the aman season, except in Purulia, where very short duration new-generation MVs are grown.
• The yield of MV rice is higher at submergence sites (3.85 t/ha) than at drought sites (2.92 t/ha) during the aman season. In North 24 Parganas, the yield in areas that are nonsaline is higher by 9–11%.
• The effect of salinity is not just a decrease in yield but also a reduction in area. During the boro season, when salinity is higher, the effect on area is greater than the effect on yield.

254 B. Bagchi and M. Bool-Emerick
• Fertilizer rate during the boro season is relatively higher than in the aman season. On average, N-fertilizer use is higher by 40 kg/ha, P-fertilizer is higher by 7 kg/ha, and K-fertilizer is higher by 17 kg/ha during the boro season. However, fertilizer rates in the selected stress-prone environments are very low when compared with the national average.
• MV rice production is profi table even after taking into account noncash costs such as family-owned resources. Among the stress-prone areas, profi t is highest in Nadia (submergence) and lowest in Purulia (drought). In general, net returns from boro rice cultivation are higher than in aman rice cultivation due to more favorable climatic conditions coupled with irrigation provision to rice crops during the boro season.
• During aman, the incremental benefi t from growing MVs instead of TVs is $90 or 40% while the incremental gains from growing new-generation MVs in place of old-generation MVs is $100 or 37% on average.
• In drought and saline areas, more than 70% of the rice output is consumed while 44% of the rice is sold in Nadia (submergence). In Nadia, 85% of the sample households are rice sellers. Households are able to sell rice because of higher production.
• Rice production contributes 38%, 24%, and 26% to total household income in Nadia, Purulia, and North 24 Parganas, respectively. In Nadia, production of nonrice crops (20%) and operation of a small-scale business (25%) are the other major sources of income. In Purulia, rendering farm labor (31%), nonfarm labor services (11%), and salaried jobs (24%) are the other major sources of income. In North 24 Parganas, sources of income of the household are relatively more diverse.
• The effect on rice suffi ciency of abiotic stress is substantial in Purulia. During normal years, 76% of the households claimed to be rice suffi cient for the whole year. However, during stress years, the percentage of households declines to 7%. In addition, the number of meals eaten per day by the household decreased in Purulia during stress years.
• Farmers have low awareness of stress-tolerant rice varieties but most households are willing to try these rice varieties.
• In Purulia and North 24 Parganas (saline area), more than 60% of the total hired labor is provided by women while the involvement of women in selected areas in Nadia is very rare.
• Men dominate in most decision-making. Women’s participation is visible only on decisions regarding the type of food to consume, children’s education, and the number of children to raise. Women’s Empowerment Index in decision-making among sample households was low (1.67).

Patterns of adoption of improved rice varieties ... of West Bengal, India 255
References
Gregory DJ, Haefele SM, RJ Buresh, Singh U. 2010. Fertilizer use, markets and management. In: Pandey S, Byerlee D, Dawe D, Dobermann A, Mohanty S, Rozelle S, Hardy B, edi-tors. Rice in the global economy: strategic research and policy issues for food security. Los Baños (Philippines): International Rice Research Institute. p 231-264.
Ministry of Statistics and Program Implementation. www.mospi.gov.in/.Statistical Handbook West Bengal. 2007. http://wbplan.gov.in/htm/ReportPub/wbhand-
book2007.pdf. Statistical Handbook West Bengal., 2009. http://wbplan.gov.in/htm/ReportPub/EcoRev09-10/
Econ_Review_2009-10.pdf.
Notes
Authors’ addresses: B. Bagchi, Nadia Zilla Farmers Development Organization (NZFDO); M. Bool-Emerick, Social Sciences Division, International Rice Research Institute, Los Baños, Philippines.
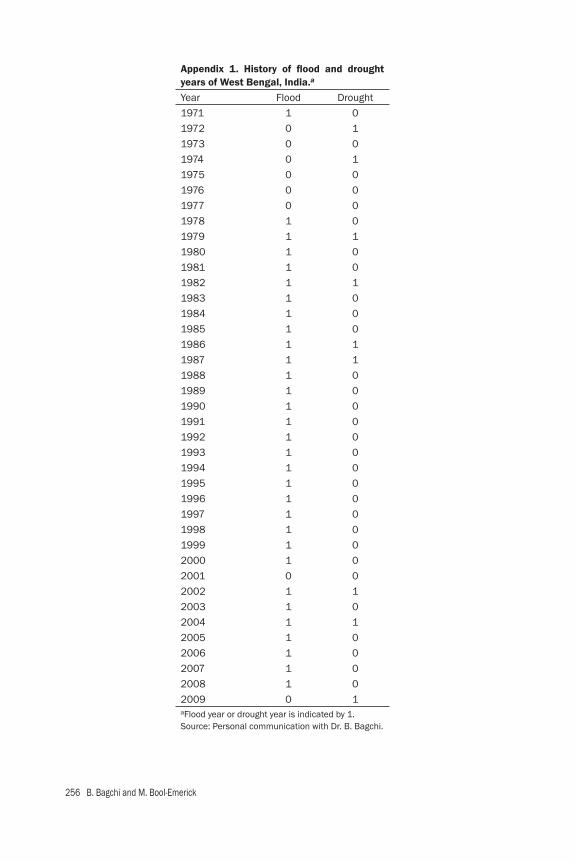
256 B. Bagchi and M. Bool-Emerick
Appendix 1. History of fl ood and drought years of West Bengal, India.a
Year Flood Drought1971 1 01972 0 11973 0 01974 0 11975 0 01976 0 01977 0 01978 1 01979 1 11980 1 01981 1 01982 1 11983 1 01984 1 01985 1 01986 1 11987 1 11988 1 01989 1 01990 1 01991 1 01992 1 01993 1 01994 1 01995 1 01996 1 01997 1 01998 1 01999 1 02000 1 02001 0 02002 1 12003 1 02004 1 12005 1 02006 1 02007 1 02008 1 02009 0 1aFlood year or drought year is indicated by 1.Source: Personal communication with Dr. B. Bagchi.

Patterns of adoption of improved rice varieties ... of West Bengal, India 257
Appendix 2. Percentage of cost under MV rice production during aman and boro seasons.
Cost Submergence Drought Salinity All
Nadia Purulia North 24 Parganas
Saline Nonsaline
Aman season
Total material input cost 21 33 16 21 24
Total labor cost 64 48 69 65 60
Total power cost 15 19 15 14 16
Total cash cost 77 82 47 60 71
Total noncash cost 23 18 53 40 29
Total costs 100 100 100 100 100
Boro season
Total material input cost 45 54 62 51
Total labor cost 43 40 38 41
Total power cost 11 7 0 8
Total cash cost 81 65 76 77
Total noncash cost 19 35 24 23
Total costs 100 100 100 100
Appendix 3. Input use in rice production by generation of MV during aman season.
Input use Submergence Drought Salinity All
Nadia Purulia North 24 Parganas
Saline Nonsaline
New generation
Seeds (kg/ha) 61 71 64 69 63
Fertilizer (kg/ha)
N 60 17 46 31 53
P 21 15 19 9 19
K 15 0 3 6 12
Labor (days/ha) 171 128 137 151 164
Old generation
Seeds (kg/ha) 61 72 71 69 68
Fertilizer (kg/ha)
N 59 25 24 25 30
P 22 13 9 8 13
K 12 3 2 5 4
Labor (days/ha) 173 151 137 143 150

258 B. Bagchi and M. Bool-Emerick
Appendix 4. Input use in rice production by generation of MV during boro season.
Input use Submergence Drought Salinity All
Nadia Purulia North 24 Parganas
Saline Nonsaline
New generation
Seeds (kg/ha) 74 76 73 74
Fertilizer (kg/ha)
N 91 61 44 75
P 27 35 17 26
K 17 12 13 15
Labor (days/ha) 178 178 161 174
Old generation
Seeds (kg/ha) 74 74
Fertilizer (kg/ha)
N 37 37
P 39 39
K 8 8
Labor (days/ha) 192 192
Source: STRASA baseline survey, 2008.
Patterns of adoption of improved rice varieties...of Chhattisgarh and Orissa 259
Patterns of adoption of improved rice varieties and farm-level impacts in stress-prone rainfed areas of Chhattisgarh and Orissa
Chapter 7

260 D. Behura, A. Koshta, D. Naik, P. Samal, and M. Malabayabas
Patterns of adoption of improved rice varieties...of Chhattisgarh and Orissa 261
Patterns of adoption of improved rice varieties and farm-level impacts in stress-prone rainfed areas of Chhattisgarh and Orissa
Introduction
State backgroundOrissa and Chhattisgarh are two of the six states in eastern India. Orissa has a total land area of 15.5 million ha and is considered the ninth-largest state in India, with an estimated population of 42 million according to the 2011 Census of India. It is bounded to the north by Jharkhand, to the northeast by West Bengal, to the south by Andhra Pradesh, to the west by Chhattisgarh, and to the east by the coast of the Bay of Bengal. Chhattisgarh, on the other hand, borders Orissa and is one of the youngest states in India. It has a total land area of 13.7 million ha and a population of 26 million according to the 2011 Census of India.1 Of the total land area, 55% is considered to be cultivated and the rest is forest area (Koshta 2010). Rice is the major crop in Orissa and Chhattisgarh, accounting for 35% of the gross cropped rice area and 28% of the total rice produced in eastern India.2 Rainfed rice is also very prominent in these states, with approximately 70% of the estimated rice area under rainfed farming (www.irri.org). These areas are characterized by vulnerability to abiotic stresses such as drought, fl ood, and salinity, which result in a substantial reduction in rice production and adversely affect the livelihoods of poor farmers. For example, Bhandari et al (2007) estimated that the 2002 drought in India caused a 22% drop in rice production and an overall decrease in agricultural GDP by 5.3%. These abiotic stresses not only affect productivity per se but also induce costly coping mechanisms such as asset sales and even distress migration.
ObjectivesThis report is an outcome of the baseline socioeconomic survey under Objective 7 (Impact assessment and targeting) of the STRASA project. The objectives of the study are the following:
• To analyze farmers’ livelihood systems in the selected drought-prone, submer-gence-prone, and salinity-affected environments in Orissa and Chhattisgarh.
1Below the poverty line/level in India and poverty population statistics. India statistics—statistical analysis, data information, and facts about India. www.indiastat.com/table/economy/8/ incidence of poverty/221/348040/data.aspx. Accessed on 14 July 2010.
2Eastern India consists of the following states: Assam, West Bengal, Bihar, Jharkand, eastern Uttar Pradesh, Orissa, and Chhattisgarh.
D. Behura, A. Koshta, D. Naik, P. Samal, and M. Malabayabas

262 D. Behura, A. Koshta, D. Naik, P. Samal, and M. Malabayabas
• To analyze the patterns of varietal adoption and the factors that determine the adoption of modern rice varieties.
• To analyze the economics of rice production.• To document farmers’ strategies for coping with different stress situations
(drought, submergence, and salinity).• To understand gender roles in rice production and women’s participation in
decision-making.• To serve as a baseline for future impact assessment and for technology tar-
geting.
Organization of the reportThis report is organized into six major sections. The fi rst section gives the background of the states and the objectives of the study. This is followed by a short description of the research design and data generation. The third section provides a brief description of the trends in rice production. The fourth section provides a general description of the survey sites and abiotic stresses such as drought, submergence, and salinity using information gathered from focus group discussions and key informant surveys. The fi fth section presents a detailed analysis of the farm-level data describing the liveli-hood of the farmers, the adoption of new-generation modern varieties, economics of rice production, consumption patterns, coping strategies, and gender analysis. The fi nal section summarizes the fi ndings.
Research design and data generationThis research was implemented in partnership with Orissa University of Agriculture and Technology (OUAT), the Central Rice Research Institute (CRRI), and Indira Gandhi Agricultural University (IGAU). Data for this study were collected by com-bining rapid rural appraisal methods, secondary sources, and specifi cally designed household surveys. A survey was carried out for the 2008 rice cropping season under the STRASA project. The prevalence of stress (drought, submergence, and salinity) and the propor-tion of rainfed rice area were the two major criteria used for the selection of districts and study villages. Household surveys included 608 households covering the repre-sentative rainfed districts in Orissa and Chhattisgarh (Table 1). In Orissa, the districts that were included were Jajpur (submergence), Dhenkanal and Bolangir (drought), and Bhadrak and Kendrapara (salinity). Raipur (drought) District was included for Chhattisgarh. Within each district, at least two villages were selected for the detailed household survey covering 50 randomly selected households from each village. Some of these selected surveyed villages were also the sites for “on-farm participatory varietal selection” (PVS). The survey sites and stress situations were characterized by using focus group discussions (FGDs) and key informant surveys (KIS). Detailed information on farmers’ livelihoods, socioeconomic features, rice production systems, variety adoption patterns, input use, costs and returns, income structure, farmers’ cop-
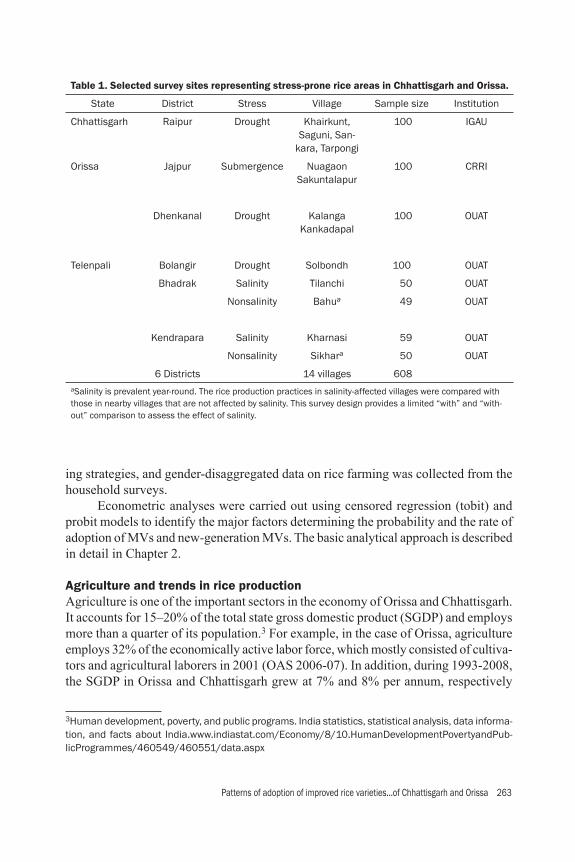
Patterns of adoption of improved rice varieties...of Chhattisgarh and Orissa 263
ing strategies, and gender-disaggregated data on rice farming was collected from the household surveys. Econometric analyses were carried out using censored regression (tobit) and probit models to identify the major factors determining the probability and the rate of adoption of MVs and new-generation MVs. The basic analytical approach is described in detail in Chapter 2.
Agriculture and trends in rice productionAgriculture is one of the important sectors in the economy of Orissa and Chhattisgarh. It accounts for 15–20% of the total state gross domestic product (SGDP) and employs more than a quarter of its population.3 For example, in the case of Orissa, agriculture employs 32% of the economically active labor force, which mostly consisted of cultiva-tors and agricultural laborers in 2001 (OAS 2006-07). In addition, during 1993-2008, the SGDP in Orissa and Chhattisgarh grew at 7% and 8% per annum, respectively
3Human development, poverty, and public programs. India statistics, statistical analysis, data informa-tion, and facts about India.www.indiastat.com/Economy/8/10.HumanDevelopmentPovertyandPub-licProgrammes/460549/460551/data.aspx
Table 1. Selected survey sites representing stress-prone rice areas in Chhattisgarh and Orissa.
State District Stress Village Sample size Institution
Chhattisgarh Raipur Drought Khairkunt, Saguni, San-
kara, Tarpongi
100 IGAU
Orissa Jajpur Submergence Nuagaon Sakuntalapur
100 CRRI
Dhenkanal Drought Kalanga Kankadapal
100 OUAT
Telenpali Bolangir Drought Solbondh 100 OUAT
Bhadrak Salinity Tilanchi 50 OUAT
Nonsalinity Bahua 49 OUAT
Kendrapara Salinity Kharnasi 59 OUAT
Nonsalinity Sikhara 50 OUAT
6 Districts 14 villages 608aSalinity is prevalent year-round. The rice production practices in salinity-affected villages were compared with those in nearby villages that are not affected by salinity. This survey design provides a limited “with” and “with-out” comparison to assess the effect of salinity.
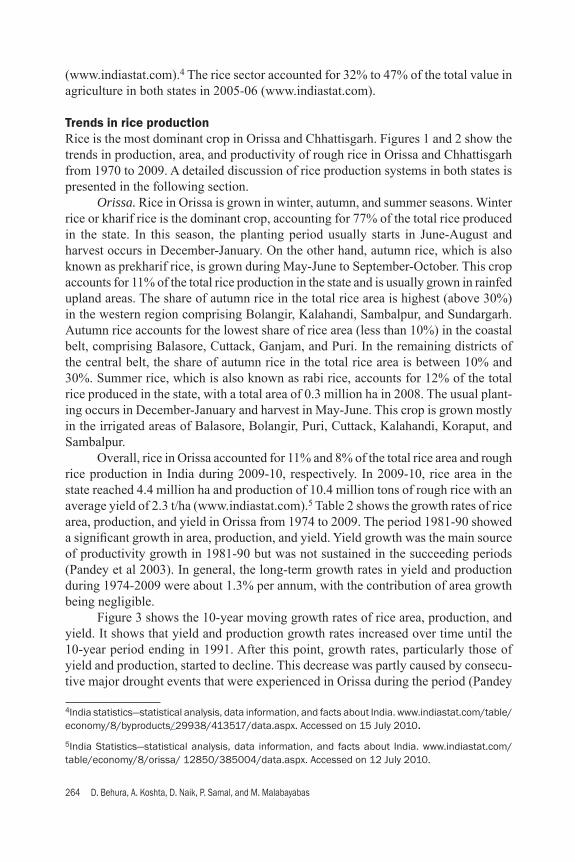
264 D. Behura, A. Koshta, D. Naik, P. Samal, and M. Malabayabas
(www.indiastat.com).4 The rice sector accounted for 32% to 47% of the total value in agriculture in both states in 2005-06 (www.indiastat.com).
Trends in rice productionRice is the most dominant crop in Orissa and Chhattisgarh. Figures 1 and 2 show the trends in production, area, and productivity of rough rice in Orissa and Chhattisgarh from 1970 to 2009. A detailed discussion of rice production systems in both states is presented in the following section. Orissa. Rice in Orissa is grown in winter, autumn, and summer seasons. Winter rice or kharif rice is the dominant crop, accounting for 77% of the total rice produced in the state. In this season, the planting period usually starts in June-August and harvest occurs in December-January. On the other hand, autumn rice, which is also known as prekharif rice, is grown during May-June to September-October. This crop accounts for 11% of the total rice production in the state and is usually grown in rainfed upland areas. The share of autumn rice in the total rice area is highest (above 30%) in the western region comprising Bolangir, Kalahandi, Sambalpur, and Sundargarh. Autumn rice accounts for the lowest share of rice area (less than 10%) in the coastal belt, comprising Balasore, Cuttack, Ganjam, and Puri. In the remaining districts of the central belt, the share of autumn rice in the total rice area is between 10% and 30%. Summer rice, which is also known as rabi rice, accounts for 12% of the total rice produced in the state, with a total area of 0.3 million ha in 2008. The usual plant-ing occurs in December-January and harvest in May-June. This crop is grown mostly in the irrigated areas of Balasore, Bolangir, Puri, Cuttack, Kalahandi, Koraput, and Sambalpur. Overall, rice in Orissa accounted for 11% and 8% of the total rice area and rough rice production in India during 2009-10, respectively. In 2009-10, rice area in the state reached 4.4 million ha and production of 10.4 million tons of rough rice with an average yield of 2.3 t/ha (www.indiastat.com).5 Table 2 shows the growth rates of rice area, production, and yield in Orissa from 1974 to 2009. The period 1981-90 showed a signifi cant growth in area, production, and yield. Yield growth was the main source of productivity growth in 1981-90 but was not sustained in the succeeding periods (Pandey et al 2003). In general, the long-term growth rates in yield and production during 1974-2009 were about 1.3% per annum, with the contribution of area growth being negligible. Figure 3 shows the 10-year moving growth rates of rice area, production, and yield. It shows that yield and production growth rates increased over time until the 10-year period ending in 1991. After this point, growth rates, particularly those of yield and production, started to decline. This decrease was partly caused by consecu-tive major drought events that were experienced in Orissa during the period (Pandey
4India statistics—statistical analysis, data information, and facts about India. www.indiastat.com/table/economy/8/byproducts/29938/413517/data.aspx. Accessed on 15 July 2010.5India Statistics—statistical analysis, data information, and facts about India. www.indiastat.com/table/economy/8/orissa/ 12850/385004/data.aspx. Accessed on 12 July 2010.

Patterns of adoption of improved rice varieties...of Chhattisgarh and Orissa 265
Year
Year
Fig. 1. Trend in area, production, and yield of rough rice in Orissa, 1970-2009. Data source: www.indiastat.com.
Fig. 2. Trend in area, production, and yield of rough rice in Chhattisgarh, 1970-2009. Data source: www.indiastat.com
14 3.0
2.5
2.0
1.5
1.0
0.5
0
12
10
8
6
4
2
0
Production (million tons), area (million ha) Yield (t/ha)
1970
1972
1974
1976
1978
1980
1982
1984
1986
1988
1990
1992
1994
1996
1998
2000
2002
2004
2006
2008
AreaProductionYield
10 3.0
2.5
2.0
1.5
1.0
0.5
0
9
8
7
6
4
5
2
3
1
0
Production (million tons), area (million ha) Yield (t/ha)
1970
1972
1974
1976
1978
1980
1982
1984
1986
1988
1990
1992
1994
1996
1998
2000
2002
2004
2006
2008
AreaProductionYield

266 D. Behura, A. Koshta, D. Naik, P. Samal, and M. Malabayabas
et al 2003). The growth rates of yield and production have increased after that, with production growth in the recent decade being about 3% per year. Chhattisgarh. Rice is mainly produced during the kharif season. The rice area in this state increased slightly from 3.2 million ha in 1981 to 3.7 million ha in 2009 (www.indiastat.com).6 The main source of irrigation is the Gangrel Dam (through its canals), making it possible for farmers to produce rice more than once a year. However, only 8% of the total rice area is under double cropping (Koshta 2010). In general, rice in Chhattisgarh accounted for 9% and 4% of the total rice area and rough rice production in India during 2009, respectively. Rice area in the state has reached 3.7 million ha with production of 5.6 million tons of rough rice (www.indiastat.com).7 Long-term growth rates from 1974 to 2009 show signifi cant growth in area, production, and yield of rice of 0.62%, 1.4%, and 2.0% per annum, respectively (Table 2, Fig. 2). The positive rate of growth in rice in this state may be due to an increase in the use of high-yielding varieties (HYVs) and an expansion of irrigation facilities. It was estimated that the area under HYVs increased substantially from 35% in 1981-83 to 75% in 2005-07 (Koshta 2010). The same is true with irrigated areas, which increased from 21% in 1981-83 to 35% in 2005-07 (Koshta 2010). Figure 4 shows the 10-year moving growth rates in area, production, and yield during 1970-2009. Results show that growth rates in yield and production increased over time until the 10-year period ending in 1991, after which they started to decline. Although yield and production growth rates were increasing toward the latter part, growth rates are still low and unstable.
6India statistics—statistical analysis, data information, and facts about India. www.indiastat.com/table/economy/8/chhatisgarh/332874/332875/data.aspx. Accessed on 12 July 2010.
7Chhattisgarh growth statistics details fi gures. www.chhattisgarhstat.com/table/agriculture/2/hyvp-crops/28982/72700/data.aspx. Accessed on 15 July 2010.
Table 2. Growth rates (% per year) of area, yield, and production of rice in Chhattisgarh and Orissa, 1974-2009.a
Period Chhattisgarh Orissa
Area Yield Production Area Yield Production
1974-80 0.7*** −0.5 0.2 −1.0*** 1.4*** 0.4
1981-90 0.8*** 3.9*** 4.7*** 0.3** 3.1*** 3.4***
1991-2000 0.7*** −0.4 0.3 0.3** −1.0 −0.7
2001-09 0.1* 2.2* 2.3** −0.1* 1.2 1.1
1974-2009 0.6*** 1.4*** 2.0*** 0.06 1.3** 1.3**a***, **, and * indicate statistical signifi cance at 1%, 5%, and 10%, respectively.Data were adjusted using 5-year moving averages of the end point. Growth rates were computed using a semi-log trend equation.Data source: www.indiastat.com.
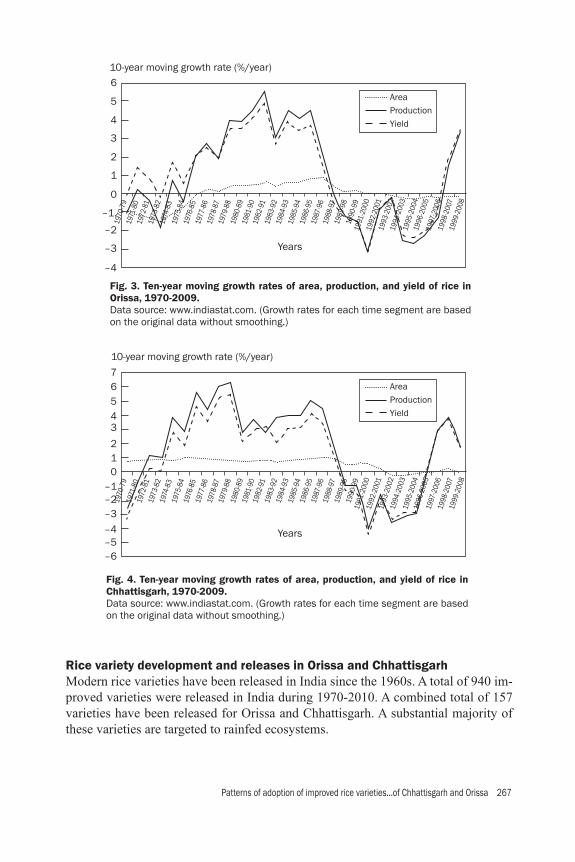
Patterns of adoption of improved rice varieties...of Chhattisgarh and Orissa 267
Rice variety development and releases in Orissa and ChhattisgarhModern rice varieties have been released in India since the 1960s. A total of 940 im-proved varieties were released in India during 1970-2010. A combined total of 157 varieties have been released for Orissa and Chhattisgarh. A substantial majority of these varieties are targeted to rainfed ecosystems.
6
5
4
3
2
1
–1.
–2
–3
–4
0
10-year moving growth rate (%/year)
Years
AreaProductionYield
1970
-79
1971
-80
1972
-81
1973
-82
1974
-83
1975
-84
1976
-85
1977
-86
1978
-87
1979
-88
1980
-89
1981
-90
1982
-91
1983
-92
1984
-93
1985
-94
1986
-95
1987
-96
1988
-97
1989
-98
1990
-99
1991
-200
019
92-2
001
1993
-200
219
94-2
003
1995
-200
419
96-2
005
1997
-200
619
98-2
007
1999
-200
8
67
543
21
–1–2–3
–4–5–6
0
10-year moving growth rate (%/year)
Years
AreaProductionYield
1970
-79
1971
-80
1972
-81
1973
-82
1974
-83
1975
-84
1976
-85
1977
-86
1978
-87
1979
-88
1980
-89
1981
-90
1982
-91
1983
-92
1984
-93
1985
-94
1986
-95
1987
-96
1988
-97
1989
-98
1990
-99
1991
-200
019
92-2
001
1993
-200
219
94-2
003
1995
-200
419
96-2
005
1997
-200
619
98-2
007
1999
-200
8
Fig. 4. Ten-year moving growth rates of area, production, and yield of rice in Chhattisgarh, 1970-2009.Data source: www.indiastat.com. (Growth rates for each time segment are based on the original data without smoothing.)
Fig. 3. Ten-year moving growth rates of area, production, and yield of rice in Orissa, 1970-2009.Data source: www.indiastat.com. (Growth rates for each time segment are based on the original data without smoothing.)
268 D. Behura, A. Koshta, D. Naik, P. Samal, and M. Malabayabas
Site and stress characterization
Description of the survey siteOrissa. The study included fi ve representative villages in Orissa where a prevalence of abiotic stresses such as drought, submergence, and salinity can be observed. These include the following: Jajpur, Bolangir, Dhenkanal, Bhadrak, and Kendrapara. Bolangir and Dhenkanal districts were selected as representative of drought areas. According to statistics of the Agricultural Department of the government of Orissa, these districts had a total rice area of 0.8 million ha in 2008, with only about one-third of this rice area being under irrigated conditions during the kharif season. Among the rice varieties, Swarna, Lalat, MTU-1001, and Parijat are the popular ones. Also, traditional rice varieties such as Bernagali, Baikani, and Mayurkantha are grown in limited areas. Aside from rice, farmers in Dhenkanal and Bolangir districts grow nonrice crops such as groundnut, sesamum, pigeon pea, green gram, and black gram (in normal years) during kharif (May-December). Jajpur was selected as representative of a submergence-prone district in Orissa (Fig. 5). The total rice area in this district reached 0.13 million ha during 2008 (Statis-tics of the Agriculture Department of the government of Orissa). Two representative villages of this district were surveyed for the study: Nuagaon and Sakuntulapur. These villages are considered to be submergence-prone areas and both are situated on the bank of the river sana-Genuti. Average rainfall in these villages is 1,500 mm. The cropping patterns consist of rice-urdbean-mungbean. Modern rice varieties such as Swarna, Parijat, Lalat, and Pooja are commonly grown in these villages. In addition, traditional varieties such as Sarchuna, Banki Sarua, and Betanasia are popular in these areas. For the salinity area, the districts of Bhadrak and Kendrapara were selected out of seven coastal districts in Orissa. These districts were considered due to the large proportion of rice area affected by coastal salinity (Fig. 5). In Bhadrak District, the villages of Tilanchi and Bahu were included in the survey and represent saline-prone and non-saline-prone environments (control), respectively. These villages are situated within 20°47′N latitude and 86°46′E longitude. On the other hand, in Kendrapara Dis-trict, the saline village of Kharnasi and non-saline-prone village (control) of Sikhar were selected for the study. These villages are situated within 20°30′N latitude and 86°25′E longitude with an average rainfall of 1,556 mm. Rice is mostly grown in the area during the kharif season that lasts from mid-June up to mid-January. Traditional rice varieties such as Pateni, Raspanjar, and Sula are commonly grown in the area. Yield of these varieties ranges from 2.5 to 3.5 t/ha during a normal season and can drop to 1.2–1.5 t/ha when salinity is very high. Chhattisgarh. Raipur8 was selected as a representative drought-prone district in Chhattisgarh (Fig. 6). A total of four villages (Khairkut, Saguni, Sankara, and Tarpongi)
8This district serves as an example of a district that is less drought-affected than the selected districts in Orissa. Expansion of irrigation in Raipur in recent years has reduced the impact of drought relative to earlier periods.
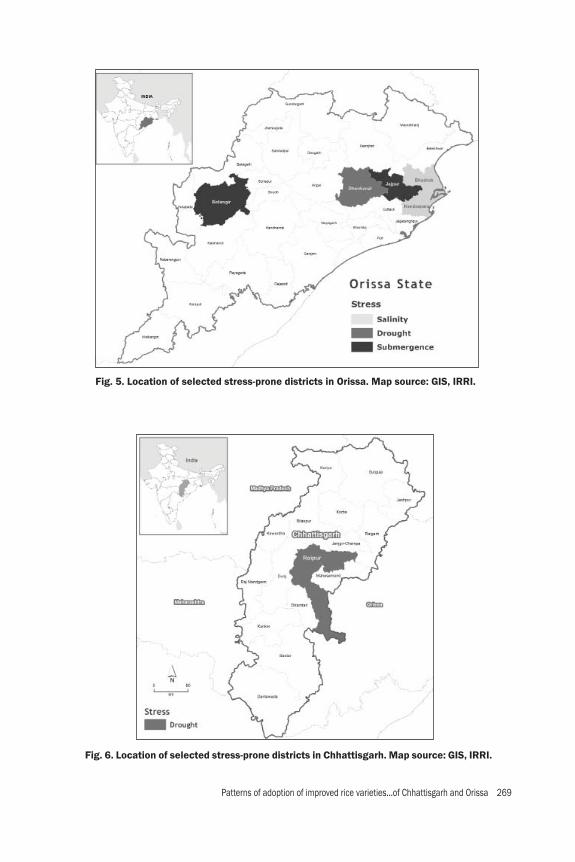
Patterns of adoption of improved rice varieties...of Chhattisgarh and Orissa 269
Fig. 5. Location of selected stress-prone districts in Orissa. Map source: GIS, IRRI.
Fig. 6. Location of selected stress-prone districts in Chhattisgarh. Map source: GIS, IRRI.
270 D. Behura, A. Koshta, D. Naik, P. Samal, and M. Malabayabas
of Tarpongi block were included in the survey. All of these villages have an average rainfall of 1,000 to 1,100 mm. Farmers usually grow crops in two seasons: kharif (June-November) and rabi (January-May). Rice is the major crop during the kharif season while wheat, arhar, vegetables, and soybean are grown during the rabi season. A similar cropping pattern was observed during drought years but with relatively fewer crops planted during the rabi season. In all of the villages, modern rice varieties such as MTU-1010, Mahamaya, Tapashwini, and Swarna are commonly grown.
Description of the major abiotic stressesFlood. During the last ten years, fl ood occurred six times in the villages of Nuagon and Sakuntalapur, with 2008 being the most recent fl ood year (Table 3). July to September were the months when the recent fl ood occurred and it lasted for 11 days, with fl ood depth reaching 210–215 cm. This high fl ood depth affected almost all rice-farming households. Flood usually occurs during both the vegetative and reproductive stages of rice. During normal years, rice is grown during May and harvested in December. However, during a severe fl ood year, it is not possible to plant rice since fl ood prevents successful crop establishment. In such situations, farmers forego the rice crop completely and plant crops such as urdbean and mungbean in September-December and January-March, respectively. Salinity. Coastal salinity is one of the major problems affecting rice production in the coastal parts of India. In Orissa, Bhadrak and Kendrapara are two of the seven districts that are severely affected by coastal salinity (Behura 2010). Salinity usually occurs during the kharif season due to tidal water intrusion that goes directly to rice fi elds. The saline water infi ltrates through creeks, surface channels, and rivers during high tide and cyclonic storms and becomes worse during the dry season. Salinity is a continuous phenomenon at the study sites (Table 3). However, in the last 10 years, Kharnasi (Kendrapara) experienced fi ve major salinity years due to sea-water intru-sion, with 2008 being the most severe. On the other hand, Bhadrak District experi-enced severe salinity problems in 2002. Compared with Kendrapara (which has high incidence of salinity during June to September), Bhadrak experiences salinity during March to June. In 2008, it damaged most of the rice area, affecting more than 1,000 households. Drought. Drought is a recurrent stress that affects the districts of Raipur and Orissa (Bolangir and Dhenkanal). In the last 20 years, drought occurred 6 to 7 times in these areas. The most recent droughts were in 2005 and 2006 in Orissa and Raipur, respectively (Table 3). Late-season drought is usually experienced in Orissa, and it normally occurs during September and October and lasts for at least 30 days. However, in Chhattisgarh, both early and terminal droughts are common, which usually occur during the early stage and during the maturity stage of crop growth. In the recent stress year, it was estimated that more than 70% of the total rice area and 7–100% of the households were affected in the sample villages. In addition, these districts normally face terminal droughts that affect a long-duration paddy crop, particularly during its

Patterns of adoption of improved rice varieties...of Chhattisgarh and Orissa 271
Tabl
e 3.
Occ
urre
nce
and
char
acte
rist
ics
of s
tres
s in
Chh
atti
sgar
h an
d O
riss
a, 2
008.
Item
Dro
ught
Subm
erge
nce
Salin
e
Chha
ttis
garh
Oris
saO
rissa
Oris
sa
Rai
pur
Dhe
nkan
alB
olan
gir
Jajp
urB
hadr
akK
endr
apar
a
Rec
ent
maj
or s
tres
s ye
ar2
00
62
00
52
00
52
00
82
00
2a
20
08
a
Mon
ths
whe
n st
ress
oft
en
occu
rsJu
ne-O
ctob
erSe
ptem
ber-O
ctob
erSe
ptem
ber-O
ctob
erJu
ly-S
epte
mbe
rM
arch
-Jun
eAp
ril-J
une,
Se
ptem
ber
Dur
atio
n (d
ays)
35
–4
53
03
011
aa
Dep
th o
f wat
er (c
m)
––
–21
0–
215
––
Ric
e ar
ea a
ffec
ted
(%)
29
–61
82
–8
371
–9
210
08
881
Hou
seho
lds
affe
cted
(%)
7–
90
81–
919
5–
99
90
–9
976
80
Stag
e of
cro
p gr
owth
w
hen
stre
ss o
ften
oc
curs
Early
(sow
ing)
, m
atur
ing
Tille
ring,
pan
icle
in
itiat
ion
Tille
ring,
pan
icle
in
itiat
ion
Vege
tativ
e, re
pro-
duct
ive,
pan
icle
in
itiat
ion
Seed
ling,
tille
ring,
pa
nicl
e in
itiat
ion
Tille
ring,
pan
icle
in
itiat
ion
a Coa
stal
sal
inity
pre
vails
eve
ry y
ear (
cont
inuo
usly
). H
owev
er, t
he y
ears
repo
rted
her
e in
the
tabl
e w
ere
cons
ider
ed to
be
the
mos
t sev
ere
year
s du
e to
sea
-wat
er in
trus
ion.
Info
r-m
atio
n of
this
tabl
e is
bas
ed o
n fo
cus
grou
p di
scus
sion
s an
d ke
y in
form
ant s
urve
ys.
272 D. Behura, A. Koshta, D. Naik, P. Samal, and M. Malabayabas
fl owering stage. The expansion of irrigation in Raipur in recent years, however, has reduced the impact of drought relative to the earlier years.
Farm-level analysis
Socio-demographic characteristicsThe characteristics of the farmers interviewed are summarized in Table 4. The average household size ranges from 6 to 7 across locations. Most of the respondents are males and had at least 4 years of schooling. Agriculture is regarded as the major occupation by most of the households. Aside from agriculture, employment in a nonagricultural sector such as company work, service, business, and skilled labor also exists in the districts under study.
Farm characteristicsLandholdings. Raipur has an average farm size of 2.8 ha, which is higher than Orissa’s average farm size of only 1.5 ha (Table 5). Saline-affected areas, particularly in Ken-drapara (Kharnasi), have an average of two parcels per household, which is smaller than in other villages in the study that range from three to six parcels. Farm size distribution across locations is positively skewed as shown in Figure 7. Most of the farms are very small (less than 1.5 ha). In addition, farms can be cat-egorized as marginal (less than 1 ha), small (1–2 ha), medium (2–10 ha), and large (more than 10 ha) according to the Ministry of Agriculture in India (www.indiastat.com).9 Marginal farms are dominant in Jajpur, Dhenkanal, and Kendrapara (Fig. 8). The average farm size under this category ranges from 0.57 ha to 0.72 ha. On the other hand, medium farms are considered to be common in Raipur, with an average of 4.10 ha, while small farms are common in Bolangir and Bhadrak, with an average farm size of 1.46 ha. Land tenure. Most of the farmers are owner-operators (Table 5). However, in the salinity-affected areas of Bhadrak, renting of land is a common practice and accounts for 42% of the total land. Scarcity of labor is one of the problems in the area, causing most of the large farmers to rent out their land to tenants in adjacent villages. This practice is also common in Raipur, wherein farmers rent out their land in two types of tenurial arrangement: land rented out on a fi xed-rent basis (called locally regha) and sharecropping (Koshta 2010). Area irrigated. The proportion of the gross cropped area irrigated in the kharif season is higher than in the rabi season in all of the districts (Table 5). The proportion of irrigated area (51% of the gross cropped area) is higher in the saline-prone areas of Bhadrak. Water from creeks is the main source of irrigation in these areas. However, these creeks are also one of the major sources of salinity in the areas. But, during kharif, rainwater serves as the major source of fresh water in the area, offsetting the effect of saline water. Raipur also has a relatively higher proportion of irrigated area (36%
9Operational landholding category. www.indiastat.com/table/agriculture/2/agriculturallandholdings/153/496067/data.aspx. Accessed on 14 February 2011.

Patterns of adoption of improved rice varieties...of Chhattisgarh and Orissa 273
Tabl
e 4.
Gen
eral
cha
ract
eris
tics
of t
he h
ouse
hold
s in
Chh
atti
sgar
h an
d O
riss
a, 2
008.
Hou
seho
ld c
hara
cter
istic
sD
roug
htSu
bmer
genc
eSa
line
Non
salin
eAl
l Oris
saCh
hatt
isga
rhO
rissa
Oris
saO
rissa
Oris
sa
Rai
pur
Dhe
nkan
alB
olan
gir
Jajp
urB
hadr
akK
endr
apar
aB
hadr
akK
endr
apar
a
Tota
l num
ber o
f hou
seho
lds
100
100
100
100
50
59
49
50
50
8
Aver
age
hous
ehol
d si
ze7
65
66
77
56
Aver
age
age
of re
spon
dent
s (y
ears
)5
35
24
55
24
64
847
50
49
Year
s of
edu
catio
n of
re-
spon
dent
s (a
vera
ge)
64
57
45
68
5
Gen
der o
f res
pond
ents
(%)
Fem
ale
32
20
05
00
1
Mal
e97
98
98
100
100
95
100
100
99
Prim
ary
occu
patio
n (%
)
Agric
ultu
re8
47
09
06
78
56
76
25
474
Non
agric
ultu
rea
163
010
33
153
33
84
62
6a N
onag
ricul
tura
l occ
upat
ions
incl
ude
com
pany
wor
k, b
usin
ess,
gov
ernm
ent,
hous
e co
nstr
uctio
n, s
ervi
ce jo
bs, a
nd s
kille
d la
bor.
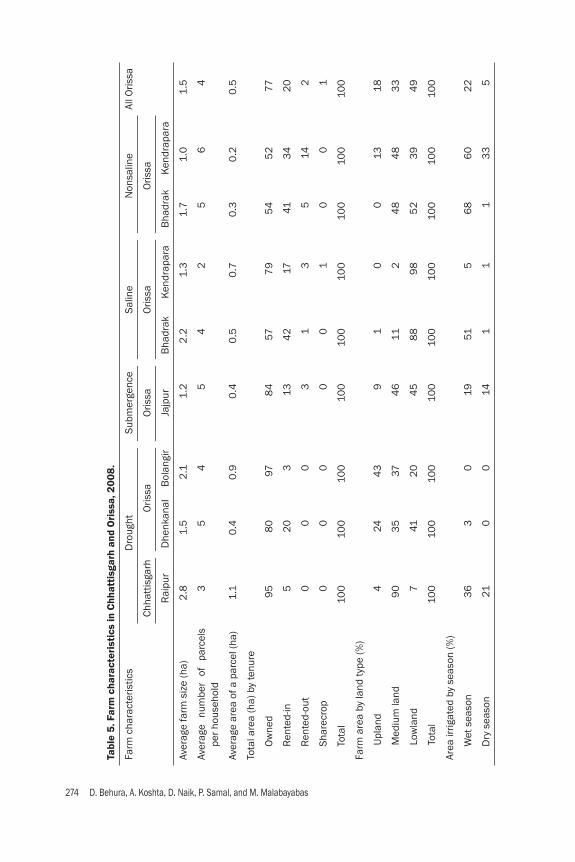
274 D. Behura, A. Koshta, D. Naik, P. Samal, and M. Malabayabas
Tabl
e 5.
Far
m c
hara
cter
isti
cs in
Chh
atti
sgar
h an
d O
riss
a, 2
008.
Farm
cha
ract
eris
tics
Dro
ught
Subm
erge
nce
Salin
eN
onsa
line
All O
rissa
Chha
ttis
garh
Oris
saO
rissa
Oris
saO
rissa
Rai
pur
Dhe
nkan
alB
olan
gir
Jajp
urB
hadr
akK
endr
apar
aB
hadr
akK
endr
apar
a
Aver
age
farm
siz
e (h
a)2
.81.
52
.11.
22
.21.
31.
71.
01.
5
Aver
age
num
ber
of
parc
els
per h
ouse
hold
35
45
42
56
4
Aver
age
area
of a
par
cel (
ha)
1.1
0.4
0.9
0.4
0.5
0.7
0.3
0.2
0.5
Tota
l are
a (h
a) b
y te
nure
Ow
ned
95
80
978
457
79
54
52
77
Ren
ted-
in5
20
313
42
1741
34
20
Ren
ted-
out
00
03
13
514
2
Shar
ecro
p0
00
00
10
01
Tota
l10
010
010
010
010
010
010
010
010
0
Farm
are
a by
land
type
(%)
Upl
and
424
43
91
00
1318
Med
ium
land
90
35
374
611
24
84
83
3
Low
land
741
20
45
88
98
52
39
49
Tota
l10
010
010
010
010
010
010
010
010
0
Area
irrig
ated
by
seas
on (%
)
Wet
sea
son
36
30
1951
56
86
02
2
Dry
sea
son
210
014
11
13
35
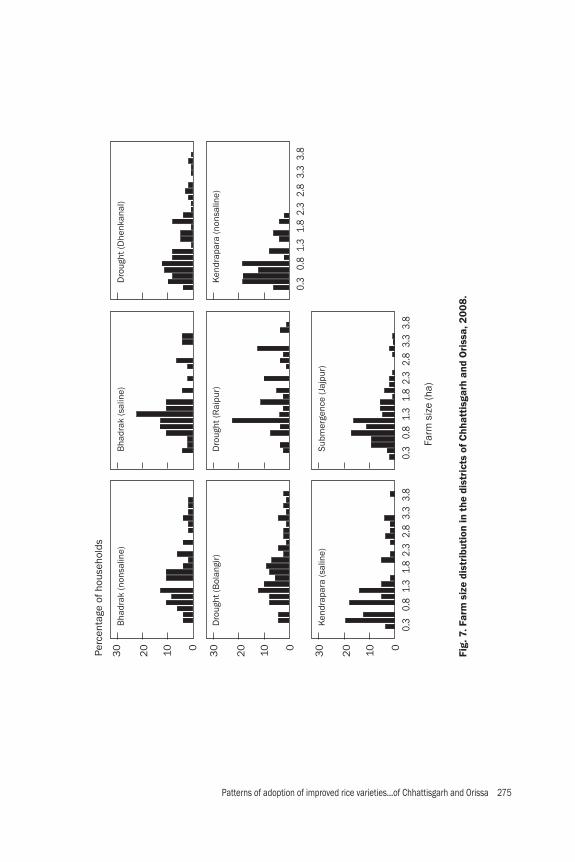
Patterns of adoption of improved rice varieties...of Chhattisgarh and Orissa 275
Fig.
7. F
arm
siz
e di
stri
buti
on in
the
dis
tric
ts o
f Chh
atti
sgar
h an
d O
riss
a, 2
008.
30
30
30
20
20
2010 10 100 0 0Pe
rcen
tage
of h
ouse
hold
s
Farm
siz
e (h
a)
Bha
drak
(non
salin
e)
Dro
ught
(Bol
angi
r)
Ken
drap
ara
(sal
ine)
Bha
drak
(sal
ine)
Dro
ught
(Rai
pur)
Subm
erge
nce
(Jaj
pur)
Dro
ught
(Dhe
nkan
al)
Ken
drap
ara
(non
salin
e)
0.3
0.3
0.3
0.8
0.8
0.8
1.3
1.3
1.3
1.8
1.8
1.8
2.3
2.3
2.3
2.8
2.8
2.8
3.3
3.3
3.3
3.8
3.8
3.8
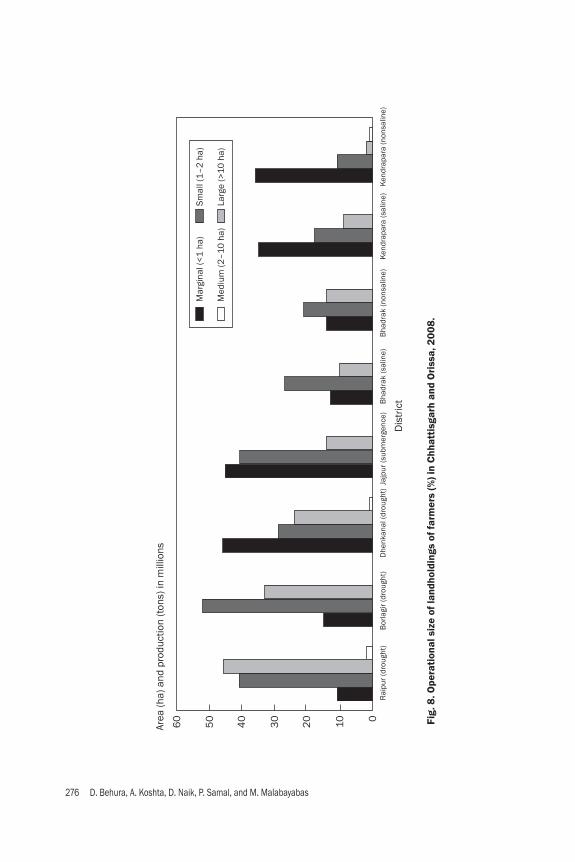
276 D. Behura, A. Koshta, D. Naik, P. Samal, and M. Malabayabas
Fig.
8. O
pera
tion
al s
ize
of la
ndho
ldin
gs o
f far
mer
s (%
) in
Chh
atti
sgar
h an
d O
riss
a, 2
008.
60
50
40
30
20 10 0
Area
(ha)
and
pro
duct
ion
(ton
s) in
mill
ions
Dis
tric
t
Mar
gina
l (<
1 h
a)
Smal
l (1
–2
ha)
Med
ium
(2–
10 h
a)
Larg
e (>
10 h
a)
Rai
pur (
drou
ght)
Bor
lagi
r (dr
ough
t)D
henk
anal
(dro
ught
)Ja
jpur
(sub
mer
genc
e)B
hadr
ak (s
alin
e)B
hadr
ak (n
onsa
line)
Ken
drap
ara
(sal
ine)
Ken
drap
ara
(non
salin
e)
Patterns of adoption of improved rice varieties...of Chhattisgarh and Orissa 277
and 21% of the total area during kharif and rabi seasons, respectively). Tube wells are the major source of supplemental irrigation in most of the villages. In Bolangir, rice production is mainly rainfed, with irrigated area being very small.
Characteristics of the rice-based cropping systemCropping system. Rice is the major crop that accounts for the lion’s share of the gross cropped area during kharif (Table 6). The major cropping pattern consists of rice-pulses except in nonsaline areas of Bhadrak, in which farmers grow rice only in kharif. Rice is also planted during rabi in Raipur and Kendrapara but only in small areas. Cropping intensity. A cropping intensity index measures the intensity of land use and this can be measured as the ratio of gross cropped area to net cropped area. Cropping intensity in most of the villages ranges from 100% to 160% except in saline areas of Kendrapara, which have a cropping intensity of 95% (Table 6). This low crop intensity in the area can be explained by the fact that farmers in saline areas mostly plant rice during the kharif season, when there is an abundant supply of water. Lands are usually kept fallow while only small areas are planted to rice and some pulses during the rabi season due to a lack of fresh water for irrigation.
Patterns of rice varietal adoptionAdoption of modern varieties (MVs). Farmers can be classifi ed as growers of MVs only, growers of TVs only, or growers of both types of varieties (or partial adopters of MVs). A high proportion of farmers in the study adopted MVs only in drought-prone areas of Raipur and Bolangir (Table 7). Farmers in the saline areas mostly grow TVs only due to constraints of salinity. However, many farmers grow both MVs and TVs, particularly in submergence-prone areas of Jajpur. Stress-tolerant varieties, particularly fl ood-tolerant varieties, just started to spread in 2008 and are not yet widely available to farmers. Rice area by variety type. Modern rice varieties cover almost all of the rice areas in all districts except in saline-prone areas and drought-prone areas of Dhenkanal in Orissa, wherein TVs covered 90–97% and 59% of the total rice area, respectively (Table 8). In the case of saline areas, particularly in parcels that are affected by salin-ity, farmers mostly grow TVs because the MVs that are available are not adapted to the amount of salinity in the area. In addition, these areas consist mostly of lowland fi elds that are very vulnerable to salt-water intrusion (Table 9). On the other hand, in the drought-prone areas of Dhenkanal, the dominance of TVs can be associated with their crop duration and the timing of the monsoon season. This district is basically characterized by a large lowland rice area and dependence on monsoon. Method of establishment. Transplanting (TPR) and direct seeding (DSR) for rice are both practiced in the study area (Table 10). DSR is the common practice in drought- and submergence-prone areas while TPR is common in salinity-affected areas. TPR is common in saline areas since seedlings at the germination stage are very sensitive to salinity. On the other hand, DSR is practiced in submergence-prone areas of Jajpur and drought-prone areas of Dhenkanal and Raipur. In drought-prone areas of Dhenkanal,
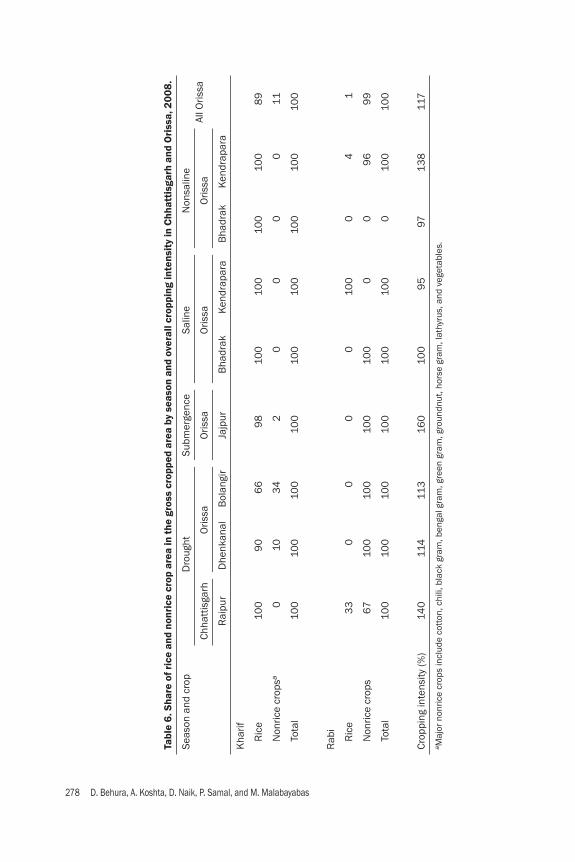
278 D. Behura, A. Koshta, D. Naik, P. Samal, and M. Malabayabas
Tabl
e 6.
Sha
re o
f ric
e an
d no
nric
e cr
op a
rea
in th
e gr
oss
crop
ped
area
by
seas
on a
nd o
vera
ll cr
oppi
ng in
tens
ity
in C
hhat
tisg
arh
and
Ori
ssa,
200
8.
Seas
on a
nd c
rop
Dro
ught
Subm
erge
nce
Salin
eN
onsa
line
All O
rissa
Chha
ttis
garh
Oris
saO
rissa
Oris
saO
rissa
Rai
pur
Dhe
nkan
alB
olan
gir
Jajp
urB
hadr
akK
endr
apar
aB
hadr
akK
endr
apar
a
Kha
rif
R
ice
100
90
66
98
100
100
100
100
89
N
onric
e cr
opsa
010
34
20
00
011
To
tal
100
100
100
100
100
100
100
100
100
Rab
i
R
ice
33
00
00
100
04
1
N
onric
e cr
ops
67
100
100
100
100
00
96
99
To
tal
100
100
100
100
100
100
010
010
0
Crop
ping
inte
nsity
(%)
140
114
113
160
100
95
9713
811
7a M
ajor
non
rice
crop
s in
clud
e co
tton
, chi
li, b
lack
gra
m, b
enga
l gra
m, g
reen
gra
m, g
roun
dnut
, hor
se g
ram
, lat
hyru
s, a
nd v
eget
able
s.
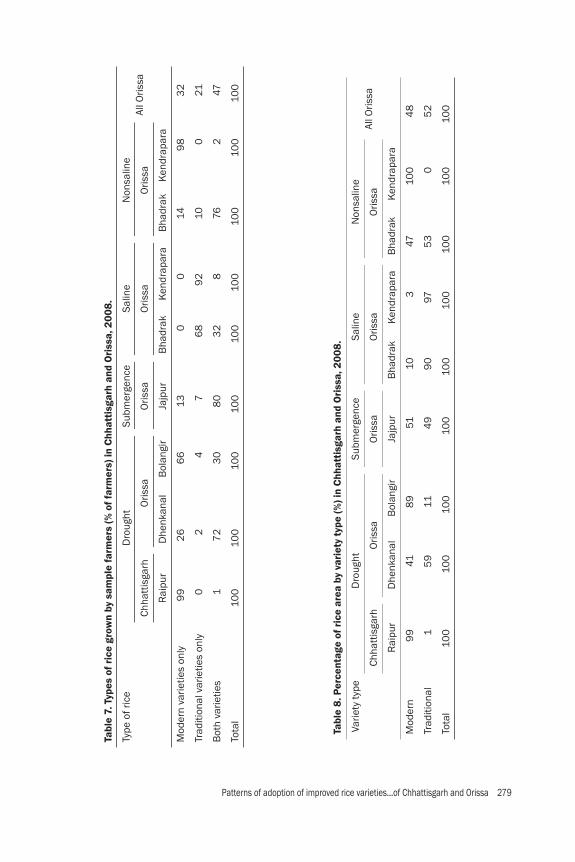
Patterns of adoption of improved rice varieties...of Chhattisgarh and Orissa 279
Tabl
e 7.
Typ
es o
f ric
e gr
own
by s
ampl
e fa
rmer
s (%
of f
arm
ers)
in C
hhat
tisg
arh
and
Ori
ssa,
200
8.
Type
of r
ice
Dro
ught
Subm
erge
nce
Salin
eN
onsa
line
All O
rissa
Chha
ttis
garh
Oris
saO
rissa
Oris
saO
rissa
Rai
pur
Dhe
nkan
alB
olan
gir
Jajp
urB
hadr
akK
endr
apar
aB
hadr
akK
endr
apar
a
Mod
ern
varie
ties
only
99
26
66
130
014
98
32
Trad
ition
al v
arie
ties
only
02
47
68
92
100
21
Bot
h va
rietie
s1
72
30
80
32
876
247
Tota
l10
010
010
010
010
010
010
010
010
0
Tabl
e 8.
Per
cent
age
of r
ice
area
by
vari
ety
type
(%) i
n C
hhat
tisg
arh
and
Ori
ssa,
200
8.
Varie
ty ty
peD
roug
htSu
bmer
genc
eSa
line
Non
salin
eAl
l Oris
saCh
hatt
isga
rhO
rissa
Oris
saO
rissa
Oris
sa
Rai
pur
Dhe
nkan
alB
olan
gir
Jajp
urB
hadr
akK
endr
apar
aB
hadr
akK
endr
apar
a
Mod
ern
99
418
951
103
4710
04
8
Trad
ition
al1
59
114
99
097
53
05
2
Tota
l10
010
010
010
010
010
010
010
010
0
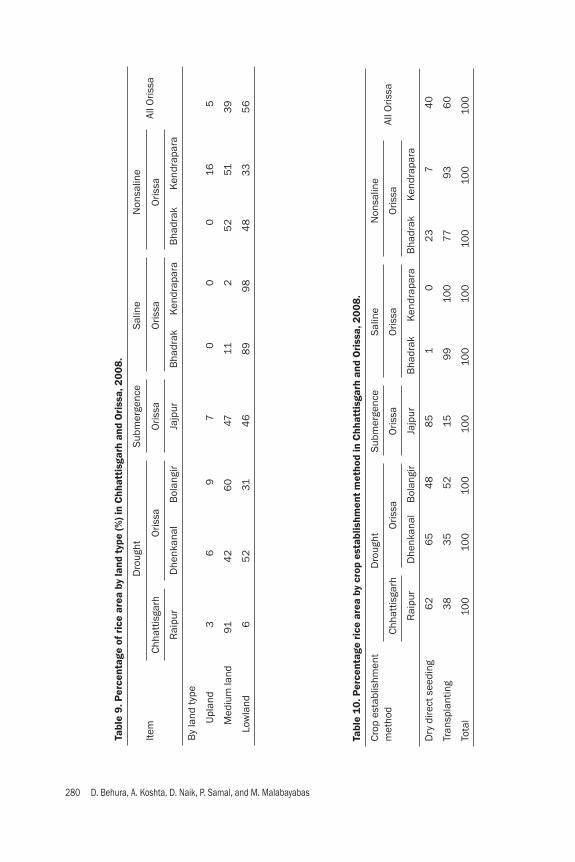
280 D. Behura, A. Koshta, D. Naik, P. Samal, and M. Malabayabas
Tabl
e 9.
Per
cent
age
of r
ice
area
by
land
typ
e (%
) in
Chh
atti
sgar
h an
d O
riss
a, 2
008.
Item
Dro
ught
Subm
erge
nce
Salin
eN
onsa
line
All O
rissa
Chha
ttis
garh
Oris
saO
rissa
Oris
saO
rissa
Rai
pur
Dhe
nkan
alB
olan
gir
Jajp
urB
hadr
akK
endr
apar
aB
hadr
akK
endr
apar
a
By
land
type
U
plan
d3
69
70
00
165
Med
ium
land
914
26
047
112
52
513
9
Lo
wla
nd6
52
314
68
99
84
83
35
6
Tabl
e 10
. Per
cent
age
rice
are
a by
cro
p es
tabl
ishm
ent
met
hod
in C
hhat
tisg
arh
and
Ori
ssa,
200
8.
Crop
est
ablis
hmen
t m
etho
dD
roug
htSu
bmer
genc
eSa
line
Non
salin
eAl
l Oris
saCh
hatt
isga
rhO
rissa
Oris
saO
rissa
Oris
sa
Rai
pur
Dhe
nkan
alB
olan
gir
Jajp
urB
hadr
akK
endr
apar
aB
hadr
akK
endr
apar
a
Dry
dire
ct s
eedi
ng
62
65
48
85
10
23
74
0
Tran
spla
ntin
g3
83
55
215
99
100
779
36
0
Tota
l10
010
010
010
010
010
010
010
010
0

Patterns of adoption of improved rice varieties...of Chhattisgarh and Orissa 281
farmers usually begin direct seeding by taking advantage of the moisture brought by the early rains. In Jajpur, farmers practice DSR ahead of the rains to prevent dam-age due to possible early submergence. Another reason why farmers practice DSR particularly in Raipur is the limited availability of labor and higher wage rate in the area since DSR requires less labor than TPR. Major rice varieties. A total of 103 rice varieties were recorded during the survey. A majority (63%) of the total number of varieties consisted of traditional varieties (TVs). The popular TVs are the following: Pateni and Raspanjar (saline); Bergahali and Sarchunamali (drought-prone Orissa); Jangalijhata and Rajmali (submergence-prone Orissa); and Safri (drought-prone Chhattisgarh). In terms of MVs, farmers allocate a large proportion of MV area to old-generation varieties10 (varieties released before 1990) in Chhattisgarh and Orissa during kharif (Table 11). These constitute 45% to 88% of the total MV area. This fi nding is similar to that of Janaiah et al (2006) that MVs that were released in the early 1980s are still popular among farmers in India, which indicates slow varietal replacement. Among the old-generation MVs, Swarna, which was released in 1982, occupies 15% to 59% of the total MV rice area. There are also other old-generation MVs in drought-prone areas of Dhenkanal and Bolangir, where Lalat is the second most popular old-generation variety. In terms of new-generation MVs (varieties released after 1990), Mahamaya oc-cupies 25% of the total MV area in Raipur. On the other hand, Khandagiri was mainly adopted in Jajpur. This short-duration variety was released in 1992 and is suited for the rainfed upland ecosystem. In the drought-prone areas of Bolangir and Dhenkanal, MTU-1010 is a popular new-generation MV. The extent of adoption of MVs by generation varies depending on the land type (Table 12). Generally, old-generation MVs are dominant in lowland and medium land, with the new-generations MVs being dominant in uplands. The exception is in saline-prone areas, where new-generation MVs are equally as important as old-generation MVs. However, the adoption of MVs in general (old- plus new-generation MVs combined) is very low in saline-prone areas. The major characteristics of the dominant new- and old-generation MVs are presented in Table 13. Swarna is the most adopted old-generation MV that was re-leased in 1982 in the state of Andhra Pradesh. This variety is recommended for the rainfed shallow lowland ecosystem and is adapted to the rainfed areas of Orissa and Chhattisgarh. Popular new-generation MVs that were adopted by farmers include Mahamaya, MTU-1010, and MTU-1001, which mostly also originated in Andhra Pradesh. These varieties are of shorter to medium duration. However, most of these new-generation MVs are recommended only for the irrigated ecosystem and are not grown widely under purely rainfed conditions.
10In the analysis, varieties released before 1990 were considered as old-generation MVs while those released after 1990 were considered as new-generation MVs. For details of this classifi cation, see Chapter 2.

282 D. Behura, A. Koshta, D. Naik, P. Samal, and M. Malabayabas
Tabl
e 1
1. A
dopt
ion
of m
oder
n ri
ce v
arie
ties
(% t
otal
MV
area
) dur
ing
khar
if in
Chh
atti
sgar
h an
d O
riss
a, 2
008.
Varie
ties
Dro
ught
Subm
erge
nce
Salin
eN
onsa
line
All
Oris
saCh
hatt
isga
rhO
rissa
Oris
saO
rissa
Oris
sa
Rai
pur
Dhe
nkan
alB
olan
gir
Jajp
urB
hadr
akK
endr
apar
aB
hadr
akK
endr
apar
a
Old
-gen
erat
ion
MVs
a61
88
79
615
44
547
68
Sw
arna
59
49
5737
48
45
154
5
Pa
rijat
170
G
ayat
ri18
146
La
lat
28
20
61
2
So
na M
asur
i2
O
ther
s11
26
15
New
-gen
erat
ion
MVs
a3
91
221
39
46
100
55
53
32
Jar
awa
67
0
Kha
ndag
iri2
41
24
Lun
ishr
ee (S
R-2
6B
)3
30
MTU
-10
013
65
58
MTU
-101
01
26
74
Poo
ja8
35
7
Sar
ala
172
Sar
ia4
2
Mah
amay
a2
50
Dur
ga11
2
Sw
arna
-Sub
14
1
Mah
alak
shm
i4
64
100
Oth
ers
21
2a V
arie
ties
rele
ased
bef
ore
199
0 a
re c
onsi
dere
d he
re a
s ol
d-ge
nera
tion
MVs
and
thos
e re
leas
ed d
urin
g 19
90
and
onw
ard
are
cons
ider
ed a
s ne
w-g
ener
atio
n M
Vs.
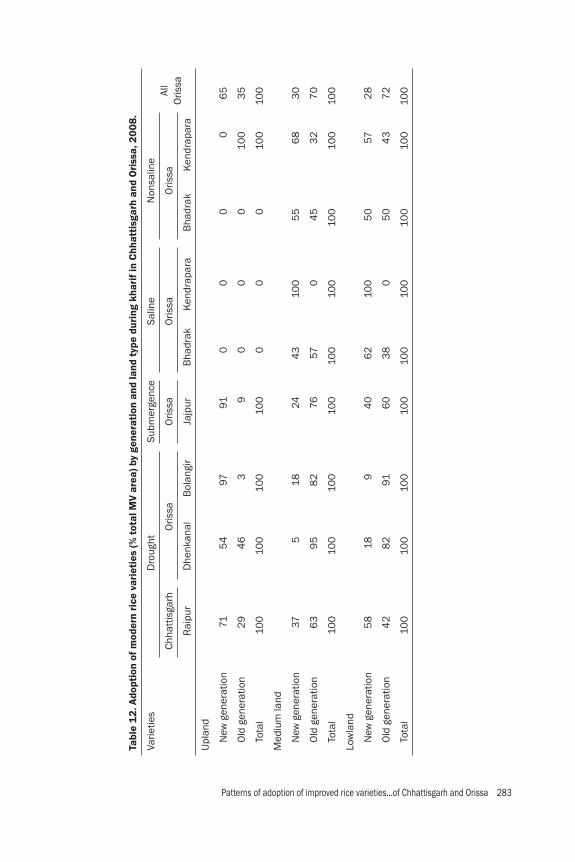
Patterns of adoption of improved rice varieties...of Chhattisgarh and Orissa 283
Tabl
e 1
2. A
dopt
ion
of m
oder
n ri
ce v
arie
ties
(% t
otal
MV
area
) by
gene
rati
on a
nd la
nd t
ype
duri
ng k
hari
f in
Chh
atti
sgar
h an
d O
riss
a, 2
008.
Varie
ties
Dro
ught
Subm
erge
nce
Salin
eN
onsa
line
All
Oris
saCh
hatt
isga
rhO
rissa
Oris
saO
rissa
Oris
sa
Rai
pur
Dhe
nkan
alB
olan
gir
Jajp
urB
hadr
akK
endr
apar
aB
hadr
akK
endr
apar
a
Upl
and
N
ew g
ener
atio
n71
54
9791
00
00
65
O
ld g
ener
atio
n2
94
63
90
00
100
35
To
tal
100
100
100
100
00
010
010
0
Med
ium
land
N
ew g
ener
atio
n37
518
244
310
05
56
83
0
O
ld g
ener
atio
n6
39
58
276
570
45
32
70
To
tal
100
100
100
100
100
100
100
100
100
Low
land
N
ew g
ener
atio
n5
818
94
06
210
05
057
28
O
ld g
ener
atio
n4
28
291
60
38
05
04
37
2
To
tal
100
100
100
100
100
100
100
100
100

284 D. Behura, A. Koshta, D. Naik, P. Samal, and M. Malabayabas
Tabl
e 1
3. In
form
atio
n on
the
maj
or m
oder
n ri
ce v
arie
ties
in O
riss
a an
d C
hhat
tisg
arh,
200
8.
Ric
e va
riety
Year
of r
elea
seEc
osys
tem
Stat
e/co
mm
ittee
rele
ase
Dur
atio
n (d
ays)
Gra
in ty
pe
Old
-gen
erat
ion
MVs
Sw
arna
198
2R
ainf
ed s
hallo
w lo
wla
ndAn
dhra
Pra
desh
12
5M
ediu
m s
lend
er
Gay
atri
198
8R
ainf
ed s
hallo
w lo
wla
nd
Oris
sa1
25
Smal
l bol
d
Lal
at19
88
Irrig
ated
med
ium
land
Oris
sa9
5Lo
ng s
lend
er
Par
ijat
1976
Rai
nfed
upl
and
Oris
sa7
0M
ediu
m s
lend
er
New
-gen
erat
ion
MVs
Kha
ndag
iri19
92
Rai
nfed
upl
and
Oris
sa7
0M
ediu
m s
lend
er
Mah
amay
a19
95
Irrig
ated
med
ium
land
Cent
ral V
arie
ty R
elea
se
C
omm
ittee
(CR
VC)
101
Long
bol
d
MTU
-10
0119
95
Irrig
ated
med
ium
land
Andh
ra P
rade
sh11
0M
ediu
m s
lend
er
Poo
ja19
99
Rai
nfed
sha
llow
low
land
Cent
ral V
arie
ty R
elea
se
C
omm
ittee
(CR
VC)
115
Med
ium
sle
nder
MTU
-101
02
00
0Irr
igat
ed m
ediu
m la
ndAn
dhra
Pra
desh
90
Long
sle
nder
Sar
ala
20
00
Wat
erlo
gged
situ
atio
nO
rissa
135
Med
ium
sle
nder
Sour
ces:
htt
p://
dacn
et.n
ic.in
/ric
e/R
ice%
20
Varie
ties%
20
-%2
00
9.h
tm a
nd R
hani
et a
l (2
010
).
Patterns of adoption of improved rice varieties...of Chhattisgarh and Orissa 285
Yield effectsRice yield by land type and season. The average yield across the districts varies from 1.0 to 4.0 t/ha during kharif (Table 14). Among the districts, Raipur has average yield of 3.2 t/ha, which is higher than the state (Chhattisgarh) average of 1.7 t/ha (www.indiastat.com). Overall, the difference between the yields of MVs and TVs in Chhat-tisgarh and Orissa is 0.4 t/ha and 0.6 t/ha, respectively. Yields of MVs and TVs differ signifi cantly in all land types in Orissa, particularly in medium lands, wherein the estimated average yield of MVs is 1.3 t/ha higher than that of TVs (Table 15). Among the varieties, Swarna covers a majority of the medium land, reaching 49% of the total MV area (Appendix 1). Yield effects of MVs by generation. New-generation MVs are performing well, particularly on medium lands of Orissa. New-generation MVs on medium land showed a signifi cantly higher yield than old MVs by 1.3 t/ha (Table 16). The common new-generation MVs that can be found on medium lands are MTU-1010, MTU-1001, and Pooja (Table 17). These varieties recorded an average yield of 1.5 to 3.9 t/ha. In general, Swarna is the major rice variety in all of the areas covering most of the total area under modern varieties (Table 17). However, aside from Swarna, there are other important MVs, which vary depending on the location. In Raipur District, Mahamaya is widely grown, having an average yield of 3.0 t/ha. On the other hand, Khandagari, Gayatri, and Durga are considered to be important MVs in submergence areas, covering 41% of the total MV area. In drought-prone areas of Orissa, Lalat is an important MV that has an average yield of 0.9 to 1.4 t/ha.
Reasons for growing dominant rice variety SwarnaA large area is being allocated to Swarna in most of the drought and submergence areas. Table 18 shows the reasons why farmers prefer this variety. In all of the districts, farmers highly preferred this variety for the following reasons: high yield, resistance to lodging, good taste of the cooked rice, bold grains, and good market price. In addition, farmers in Dhenkanal found Swarna to have a high market demand. On the other hand, farmers also enumerated the following major undesirable traits of Swarna: susceptible to lodging, susceptible to pests, and poor grain quality. In addition, farmers considered this variety to not be fl ood resistant in submergence-prone areas.
Adoption of varieties: an econometric analysisDescriptive summary statistics. The factors determining cross-sectional variations in the incidence and intensity of adoption of improved varieties were analyzed us-ing probit and tobit models. Two types of comparison were made. The fi rst analysis involved the identifi cation of the factors that determine the adoption of improved varieties relative to traditional varieties. The second analysis involved the identifi ca-tion of the factors that determine the adoption of new-generation improved varieties relative to old-generation improved varieties. Chapter 2 (methodology) provides a full discussion of the approaches used.
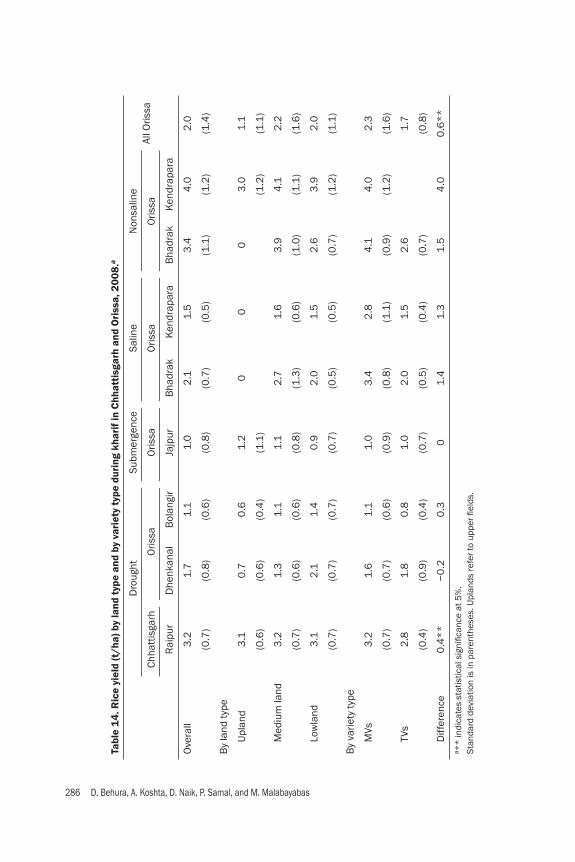
286 D. Behura, A. Koshta, D. Naik, P. Samal, and M. Malabayabas
Tabl
e 1
4. R
ice
yiel
d (t
/ha)
by
land
typ
e an
d by
var
iety
typ
e du
ring
kha
rif i
n C
hhat
tisg
arh
and
Ori
ssa,
200
8.a
Dro
ught
Subm
erge
nce
Salin
eN
onsa
line
All O
rissa
Chha
ttis
garh
Oris
saO
rissa
Oris
saO
rissa
Rai
pur
Dhe
nkan
alB
olan
gir
Jajp
urB
hadr
akK
endr
apar
aB
hadr
akK
endr
apar
a
Ove
rall
3.2
1.7
1.1
1.0
2.1
1.5
3.4
4.0
2.0
(0.7
)(0
.8)
(0.6
)(0
.8)
(0.7
)(0
.5)
(1.1
)(1
.2)
(1.4
)
By
land
type
Upl
and
3.1
0.7
0.6
1.2
00
03
.01.
1
(0.6
)(0
.6)
(0.4
)(1
.1)
(1.2
)(1
.1)
Med
ium
land
3.2
1.3
1.1
1.1
2.7
1.6
3.9
4.1
2.2
(0.7
)(0
.6)
(0.6
)(0
.8)
(1.3
)(0
.6)
(1.0
)(1
.1)
(1.6
)
Low
land
3.1
2.1
1.4
0.9
2.0
1.5
2.6
3.9
2.0
(0.7
)(0
.7)
(0.7
)(0
.7)
(0.5
)(0
.5)
(0.7
)(1
.2)
(1.1
)
By
varie
ty ty
pe
MVs
3.2
1.6
1.1
1.0
3.4
2.8
4.1
4.0
2.3
(0.7
)(0
.7)
(0.6
)(0
.9)
(0.8
)(1
.1)
(0.9
)(1
.2)
(1.6
)
TVs
2.8
1.8
0.8
1.0
2.0
1.5
2.6
1.7
(0.4
)(0
.9)
(0.4
)(0
.7)
(0.5
)(0
.4)
(0.7
)(0
.8)
Diff
eren
ce0
.4*
*−
0.2
0.3
01.
41.
31.
54
.00
.6*
*a *
* in
dica
tes
stat
istic
al s
ignifi c
ance
at 5
%.
Stan
dard
dev
iatio
n is
in p
aren
thes
es. U
plan
ds re
fer t
o up
per fi
eld
s.
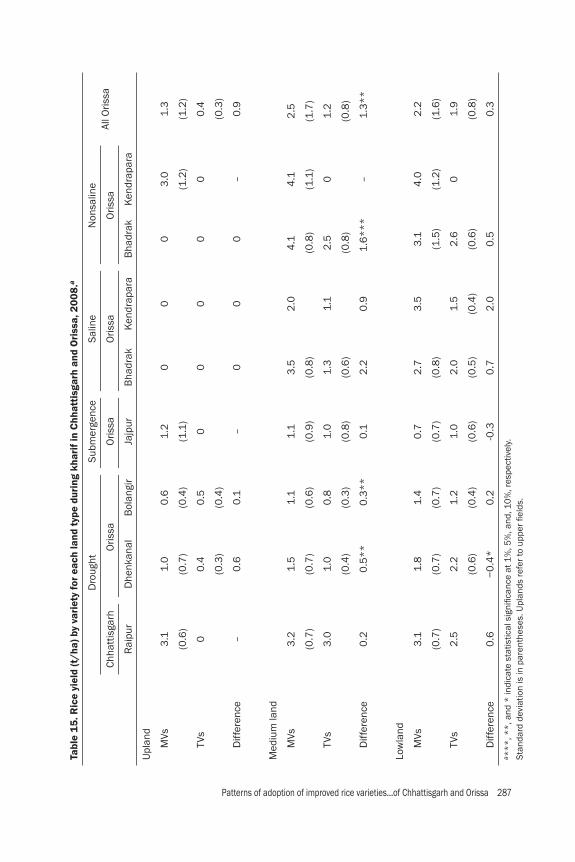
Patterns of adoption of improved rice varieties...of Chhattisgarh and Orissa 287
Tabl
e 15
. Ric
e yi
eld
(t/h
a) b
y va
riet
y fo
r ea
ch la
nd t
ype
duri
ng k
hari
f in
Chh
atti
sgar
h an
d O
riss
a, 2
008.
a
Dro
ught
Subm
erge
nce
Salin
eN
onsa
line
All O
rissa
Chha
ttis
garh
Oris
saO
rissa
Oris
saO
rissa
Rai
pur
Dhe
nkan
alB
olan
gir
Jajp
urB
hadr
akK
endr
apar
aB
hadr
akK
endr
apar
a
Upl
and
MVs
3.1
1.0
0.6
1.2
00
03
.01.
3
(0.6
)(0
.7)
(0.4
)(1
.1)
(1.2
)(1
.2)
TVs
00
.40
.50
00
00
0.4
(0.3
)(0
.4)
(0.3
)
Diff
eren
ce–
0.6
0.1
–0
00
–0
.9
Med
ium
land
MVs
3.2
1.5
1.1
1.1
3.5
2.0
4.1
4.1
2.5
(0.7
)(0
.7)
(0.6
)(0
.9)
(0.8
)(0
.8)
(1.1
)(1
.7)
TVs
3.0
1.0
0.8
1.0
1.3
1.1
2.5
01.
2
(0.4
)(0
.3)
(0.8
)(0
.6)
(0.8
)(0
.8)
Diff
eren
ce0
.20
.5*
*0
.3*
*0
.12
.20
.91.
6*
**
–1.
3*
*
Low
land
MVs
3.1
1.8
1.4
0.7
2.7
3.5
3.1
4.0
2.2
(0.7
)(0
.7)
(0.7
)(0
.7)
(0.8
)(1
.5)
(1.2
)(1
.6)
TVs
2.5
2.2
1.2
1.0
2.0
1.5
2.6
01.
9
(0.6
)(0
.4)
(0.6
)(0
.5)
(0.4
)(0
.6)
(0.8
)
Diff
eren
ce0
.6−
0.4
*0
.2-0
.30
.72
.00
.50
.3a *
**
, **
, and
* in
dica
te s
tatis
tical
sig
nifi c
ance
at 1
%, 5
%, a
nd, 1
0%
, res
pect
ivel
y.St
anda
rd d
evia
tion
is in
par
enth
eses
. Upl
ands
refe
r to
uppe
r fi e
lds.
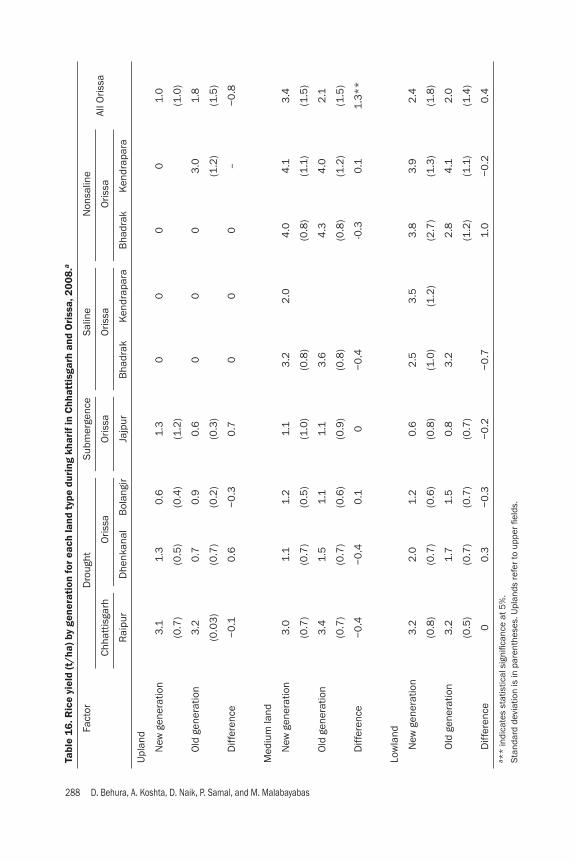
288 D. Behura, A. Koshta, D. Naik, P. Samal, and M. Malabayabas
Tabl
e 16
. Ric
e yi
eld
(t/h
a) b
y ge
nera
tion
for
each
land
typ
e du
ring
kha
rif i
n C
hhat
tisg
arh
and
Ori
ssa,
200
8.a
Fact
orD
roug
htSu
bmer
genc
eSa
line
Non
salin
eAl
l Oris
saCh
hatt
isga
rhO
rissa
Oris
saO
rissa
Oris
sa
Rai
pur
Dhe
nkan
alB
olan
gir
Jajp
urB
hadr
akK
endr
apar
aB
hadr
akK
endr
apar
a
Upl
and
New
gen
erat
ion
3.1
1.3
0.6
1.3
00
00
1.0
(0.7
)(0
.5)
(0.4
)(1
.2)
(1.0
)
Old
gen
erat
ion
3.2
0.7
0.9
0.6
00
03
.01.
8
(0.0
3)
(0.7
)(0
.2)
(0.3
)(1
.2)
(1.5
)
Diff
eren
ce−
0.1
0.6
−0
.30
.70
00
–−
0.8
Med
ium
land
New
gen
erat
ion
3.0
1.1
1.2
1.1
3.2
2.0
4.0
4.1
3.4
(0.7
)(0
.7)
(0.5
)(1
.0)
(0.8
)(0
.8)
(1.1
)(1
.5)
Old
gen
erat
ion
3.4
1.5
1.1
1.1
3.6
4.3
4.0
2.1
(0.7
)(0
.7)
(0.6
)(0
.9)
(0.8
)(0
.8)
(1.2
)(1
.5)
Diff
eren
ce−
0.4
−0
.40
.10
−0
.4-0
.30
.11.
3*
*
Low
land
New
gen
erat
ion
3.2
2.0
1.2
0.6
2.5
3.5
3.8
3.9
2.4
(0.8
)(0
.7)
(0.6
)(0
.8)
(1.0
)(1
.2)
(2.7
)(1
.3)
(1.8
)
Old
gen
erat
ion
3.2
1.7
1.5
0.8
3.2
2.8
4.1
2.0
(0.5
)(0
.7)
(0.7
)(0
.7)
(1.2
)(1
.1)
(1.4
)
Diff
eren
ce0
0.3
−0
.3−
0.2
−0
.71.
0−
0.2
0.4
a **
indi
cate
s st
atis
tical
sig
nifi c
ance
at 5
%.
Stan
dard
dev
iatio
n is
in p
aren
thes
es. U
plan
ds re
fer t
o up
per fi
eld
s.

Patterns of adoption of improved rice varieties...of Chhattisgarh and Orissa 289
Tabl
e 17
. Per
cent
age
of M
V ar
ea a
nd y
ield
of m
ajor
MVs
by
gene
rati
on d
urin
g kh
arif
in C
hhat
tisg
arh
and
Ori
ssa,
200
8.
Varie
ties
Dro
ught
Subm
erge
nce
Salin
eN
onsa
line
All O
rissa
Chha
ttis
garh
Oris
saO
rissa
Oris
saO
rissa
Rai
pur
Dhe
nkan
alB
olan
gir
Jajp
urB
hadr
akK
endr
apar
aB
hadr
akK
endr
apar
a
Area
Yiel
dAr
eaYi
eld
Area
Yiel
dAr
eaYi
eld
Area
Yiel
dAr
eaYi
eld
Area
Yiel
dAr
eaYi
eld
Area
Yiel
d
Old
-gen
erat
ion
MVs
G
ayat
ri18
0.8
63
.214
4.1
62
.6
La
lat
28
1.4
20
0.9
12
1.2
Sw
arna
59
3.4
49
1.7
571.
437
1.1
48
3.6
45
4.2
154
.14
42
.3
Pa
rijat
173
.03
2.0
New
-gen
erat
ion
MVs
D
urga
110
.62
0.6
Ja
raw
a6
72
.00
2.0
M
aham
aya
25
3.0
K
hand
agiri
21.
64
0.8
12
1.2
41.
1
M
TU-1
001
36
3.2
83
.9
M
TU-1
010
12
2.9
61.
87
1.3
55
4.0
41.
5
Sa
rala
174
.12
4.0
Po
oja
80
.73
54
.07
3.6
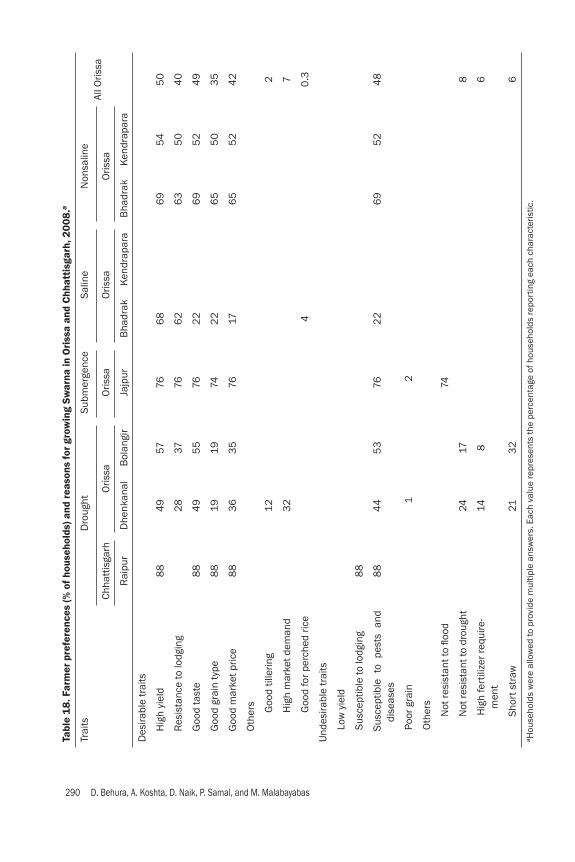
290 D. Behura, A. Koshta, D. Naik, P. Samal, and M. Malabayabas
Tabl
e 1
8. F
arm
er p
refe
renc
es (%
of h
ouse
hold
s) a
nd r
easo
ns fo
r gr
owin
g Sw
arna
in O
riss
a an
d C
hhat
tisg
arh,
200
8.a
Trai
tsD
roug
htSu
bmer
genc
eSa
line
Non
salin
eAl
l Oris
saCh
hatt
isga
rhO
rissa
Oris
saO
rissa
Oris
sa
Rai
pur
Dhe
nkan
alB
olan
gir
Jajp
urB
hadr
akK
endr
apar
aB
hadr
akK
endr
apar
a
Des
irabl
e tr
aits
Hig
h yi
eld
88
49
5776
68
69
54
50
Res
ista
nce
to lo
dgin
g2
837
766
26
35
04
0
Goo
d ta
ste
88
49
55
762
26
95
24
9
Goo
d gr
ain
type
88
1919
742
26
55
03
5
Goo
d m
arke
t pric
e8
83
63
576
176
55
24
2
Oth
ers
Goo
d til
lerin
g1
22
Hig
h m
arke
t dem
and
32
7
Goo
d fo
r per
ched
rice
40
.3
Und
esira
ble
trai
ts
Low
yie
ld
Susc
eptib
le to
lodg
ing
88
Susc
eptib
le t
o pe
sts
and
dise
ases
88
44
53
762
26
95
24
8
Poor
gra
in
1
2
Oth
ers
Not
resi
stan
t to fl o
od74
Not
resi
stan
t to
drou
ght
2417
8
Hig
h fe
rtili
zer r
equi
re-
men
t14
86
Shor
t str
aw21
32
6a H
ouse
hold
s w
ere
allo
wed
to p
rovi
de m
ultip
le a
nsw
ers.
Eac
h va
lue
repr
esen
ts th
e pe
rcen
tage
of h
ouse
hold
s re
port
ing
each
cha
ract
eris
tic.
Patterns of adoption of improved rice varieties...of Chhattisgarh and Orissa 291
The descriptive statistics of some of the major variables are presented in Tables 19 and 20. Information in Table 19 pertains to the analysis of the adoption of MVs in general relative to TVs. On the other hand, information in Table 20 pertains to the analysis of new-generation MVs relative to old-generation MVs. Slight differences in the mean values of the explanatory variables between these tables are due to the differences in the number of observations used in each of the analyses. Results. The results of the probit and tobit estimations (Table 21) for modern varieties indicate that land type (lowland), presence of saline areas, and years of educa-tion are the major factors affecting the adoption of MVs. The coeffi cients associated with lowlands were found to be negative and statistically signifi cant in both analyses. This suggests that the probability (as indicated in the probit results) of adopting MVs in lowland fi elds is lower than in other fi eld types. Similarly, the intensity of adoption of MVs is lower for farmers who have proportionately larger area under lowlands. These results from probit and tobit models are consistent with each other. Traditional varieties (TVs) are planted in the lowlands of Orissa due to their adaptability to lowland conditions while MVs are planted mainly in upper portions of the fi elds. The same is true with salinity, suggesting that the probability and the extent of adoption of MVs are relatively lower in saline fi elds. In terms of the household-level variables, education was found to signifi cantly affect the adoption of MVs. This is expected since most of the earlier studies on adop-tion have shown that education helps farmers to learn and acquire new technologies faster. The effect of farm size was found to be negative (and weakly signifi cant in the probit) but the coeffi cient was not signifi cant in the tobit model. Overall, the effect of farm size on the adoption of MVs seems inconclusive. The district dummies also showed signifi cant coeffi cients, indicating that location effects are strong. In terms of the choice between new-generation and old-generation MVs, the results again show the importance of land type. The negative coeffi cients associated with lowland and medium land types in the probit model imply that new-generation MVs are grown mostly in upper fi elds (Table 22). Most old-generation MVs are of long duration and are more suited to lowland (or medium land) types. On the other hand, several newer generation varieties are of medium duration, making them more suited to upper fi eld types. Thus, the adoption of new-generation MVs is also governed mainly by fi eld type. In addition, the coeffi cients associated with location dummies are statistically signifi cant, indicating the importance of location-specifi c factors in determining the adoption of new-generation MVs.
Economics of rice production and household economyInput use in rice production.
• Rice seedThe average use of seeds in Raipur is 120 kg/ha, which is relatively higher than in other districts (Table 23). High seed use per hectare can be attributed partly

292 D. Behura, A. Koshta, D. Naik, P. Samal, and M. Malabayabas
Tabl
e 19
. Defi
nit
ions
of v
aria
bles
and
sum
mar
y st
atis
tics
for
MV/
TV a
dopt
ion
anal
ysis
.
Varia
ble
nam
eVa
riabl
e defi n
ition
Mod
ern/
trad
ition
al v
arie
ties
(MVs
/TVs
)
Mea
nSt
anda
rd d
evia
tion
Tota
l num
ber o
f plo
ts (p
lot l
evel
N =
1,9
88
)
Num
ber o
f plo
ts w
ith M
Vs (p
lot l
evel
N =
1,0
74)
Gro
w M
V at
the
plot
leve
l (ye
s =
1; o
ther
wis
e =
0)
5
4a
Perc
enta
ge a
rea
unde
r MVs
(%) (
N =
50
8)
Shar
e of
MV
area
in th
e to
tal r
ice
area
5
24
0
Expl
anat
ory
varia
bles
Fa
rm s
ize
Culti
vate
d ar
ea o
f the
farm
(in
ha)
1.6
1.4
Ad
ult h
ouse
hold
siz
eH
ouse
hold
mem
bers
abo
ve 1
5 y
ears
old
(num
ber)
42
Ag
eAg
e of
hou
seho
ld h
ead
(in y
ears
)4
911
Ed
ucat
ion
Educ
atio
n of
hou
seho
ld h
ead
(in y
ears
)5
4
Sh
are
of lo
wla
ndPr
opor
tion
of ri
ce a
rea
unde
r low
land
(%)
53
36
Shar
e of
sal
ine
area
Prop
ortio
n of
rice
are
a un
der s
alin
e co
nditi
ons
(%)
20
39
Dum
my
var
iabl
esa
L
owla
ndLo
wla
nd la
nd ty
pe (l
owla
nd =
1, 0
oth
erw
ise)
48
M
ediu
m la
ndM
ediu
m la
nd ty
pe (m
ediu
m la
nd =
1, 0
oth
erw
ise)
35
B
olan
gir
Bol
angi
r Dis
tric
t (B
olan
gir =
1, 0
oth
erw
ise)
12
D
henk
anal
Dhe
nkan
al D
istr
ict (
Dhe
nkan
al =
1, 0
oth
erw
ise)
22
J
ajpu
rJa
jpur
Dis
tric
t (Ja
jpur
= 1
, 0 o
ther
wis
e)2
2
B
hadr
akB
hadr
ak D
istr
ict (
Bha
drak
= 1
, 0 o
ther
wis
e)2
3
K
endr
apar
aK
endr
apar
a D
istr
ict (
Ken
drap
ara
= 1
, 0 o
ther
wis
e)2
0
S
alin
eSa
line
parc
el (s
alin
e =
1, 0
oth
erw
ise)
14a
Mea
n (p
ropo
rtio
n) o
f the
var
iabl
es, d
urin
g kh
arif
seas
on.
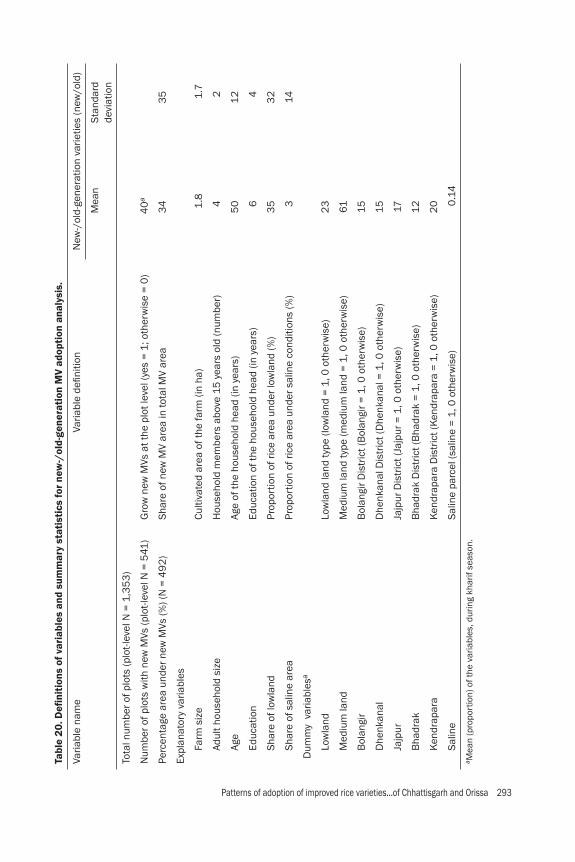
Patterns of adoption of improved rice varieties...of Chhattisgarh and Orissa 293
Tabl
e 20
. Defi
nit
ions
of v
aria
bles
and
sum
mar
y st
atis
tics
for
new
-/ol
d-ge
nera
tion
MV
adop
tion
ana
lysi
s.
Varia
ble
nam
eVa
riabl
e defi n
ition
New
-/ol
d-ge
nera
tion
varie
ties
(new
/old
)
Mea
nSt
anda
rd
devi
atio
n
Tota
l num
ber o
f plo
ts (p
lot-l
evel
N =
1,3
53
)
Num
ber o
f plo
ts w
ith n
ew M
Vs (p
lot-l
evel
N =
541
)G
row
new
MVs
at t
he p
lot l
evel
(yes
= 1
; oth
erw
ise
= 0
)
40a
Perc
enta
ge a
rea
unde
r new
MVs
(%) (
N =
49
2)
Shar
e of
new
MV
area
in to
tal M
V ar
ea
34
35
Expl
anat
ory
varia
bles
Fa
rm s
ize
Culti
vate
d ar
ea o
f the
farm
(in
ha)
1
.8
1
.7
Ad
ult h
ouse
hold
siz
eH
ouse
hold
mem
bers
abo
ve 1
5 y
ears
old
(num
ber)
42
Ag
eAg
e of
the
hous
ehol
d he
ad (i
n ye
ars)
50
12
Ed
ucat
ion
Educ
atio
n of
the
hous
ehol
d he
ad (i
n ye
ars)
64
Sh
are
of lo
wla
ndPr
opor
tion
of ri
ce a
rea
unde
r low
land
(%)
35
32
Sh
are
of s
alin
e ar
eaPr
opor
tion
of ri
ce a
rea
unde
r sal
ine
cond
ition
s (%
)3
14
Dum
my
var
iabl
esa
L
owla
ndLo
wla
nd la
nd ty
pe (l
owla
nd =
1, 0
oth
erw
ise)
23
M
ediu
m la
ndM
ediu
m la
nd ty
pe (m
ediu
m la
nd =
1, 0
oth
erw
ise)
61
B
olan
gir
Bol
angi
r Dis
tric
t (B
olan
gir =
1, 0
oth
erw
ise)
15
D
henk
anal
Dhe
nkan
al D
istr
ict (
Dhe
nkan
al =
1, 0
oth
erw
ise)
15
J
ajpu
rJa
jpur
Dis
tric
t (Ja
jpur
= 1
, 0 o
ther
wis
e)17
B
hadr
akB
hadr
ak D
istr
ict (
Bha
drak
= 1
, 0 o
ther
wis
e)1
2
K
endr
apar
aK
endr
apar
a D
istr
ict (
Ken
drap
ara
= 1
, 0 o
ther
wis
e)2
0
S
alin
eSa
line
parc
el (s
alin
e =
1, 0
oth
erw
ise)
0.1
4a M
ean
(pro
port
ion)
of t
he v
aria
bles
, dur
ing
khar
if se
ason
.
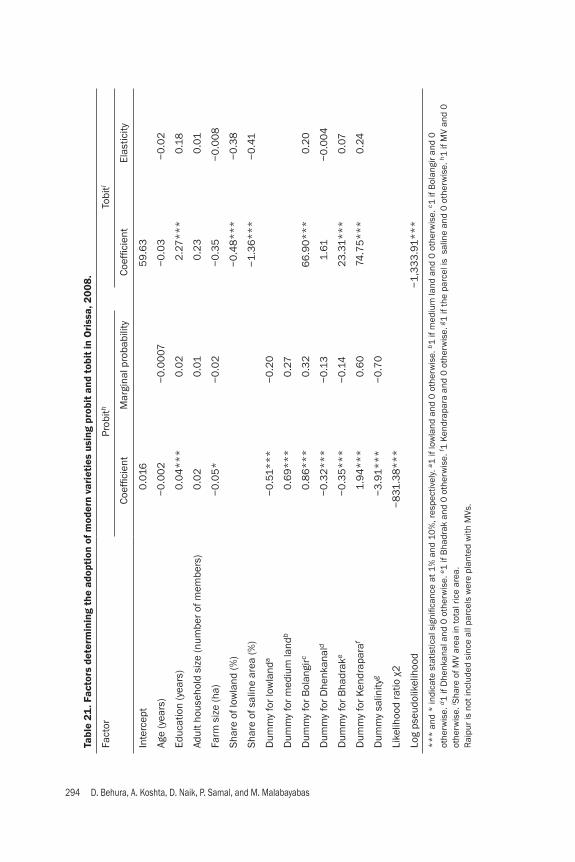
294 D. Behura, A. Koshta, D. Naik, P. Samal, and M. Malabayabas
Tabl
e 21
. Fac
tors
det
erm
inin
g th
e ad
opti
on o
f mod
ern
vari
etie
s us
ing
prob
it a
nd t
obit
in O
riss
a, 2
008.
Fact
orPr
obith
Tobi
ti
Coeffi c
ient
Mar
gina
l pro
babi
lity
Coeffi c
ient
Elas
ticity
Inte
rcep
t0
.016
59
.63
Age
(yea
rs)
−0
.00
2−
0.0
007
−0
.03
−0
.02
Educ
atio
n (y
ears
)0
.04
**
*0
.02
2.2
7*
**
0.1
8
Adul
t hou
seho
ld s
ize
(num
ber o
f mem
bers
)0
.02
0.0
10
.23
0.0
1
Farm
siz
e (h
a) −
0.0
5*
−0
.02
−0
.35
−0
.00
8
Shar
e of
low
land
(%)
−0
.48
**
*−
0.3
8
Shar
e of
sal
ine
area
(%)
−1.
36
**
*−
0.4
1
Dum
my
for l
owla
nda
−0
.51
**
*−
0.2
0
Dum
my
for m
ediu
m la
ndb
0.6
9*
**
0.2
7
Dum
my
for B
olan
girc
0.8
6*
**
0.3
26
6.9
0*
**
0.2
0
Dum
my
for D
henk
anal
d−
0.3
2*
**
−0
.13
1.61
−0
.00
4
Dum
my
for B
hadr
ake
−0
.35
**
*−
0.1
42
3.3
1*
**
0.0
7
Dum
my
for K
endr
apar
af1.
94
**
*0
.60
74.7
5*
**
0.2
4
Dum
my
salin
ityg
−3
.91
**
*−
0.7
0
Like
lihoo
d ra
tio χ
2−
831
.38
**
*
Log
pseu
dolik
elih
ood
−1,
33
3.9
1*
**
**
* a
nd *
indi
cate
sta
tistic
al s
ignifi c
ance
at 1
% a
nd 1
0%
, res
pect
ivel
y. a 1
if lo
wla
nd a
nd 0
oth
erw
ise.
b 1 if
med
ium
land
and
0 o
ther
wis
e. c 1
if B
olan
gir a
nd 0
ot
herw
ise.
d 1 if
Dhe
nkan
al a
nd 0
oth
erw
ise.
e 1 if
Bha
drak
and
0 o
ther
wis
e. f 1
Ken
drap
ara
and
0 o
ther
wis
e. g 1
if th
e pa
rcel
is s
alin
e an
d 0
oth
erw
ise.
h 1 if
MV
and
0
othe
rwis
e. i S
hare
of M
V ar
ea in
tota
l ric
e ar
ea.
Rai
pur i
s no
t inc
lude
d si
nce
all p
arce
ls w
ere
plan
ted
with
MVs
.

Patterns of adoption of improved rice varieties...of Chhattisgarh and Orissa 295
Tabl
e 22
. Fac
tors
det
erm
inin
g th
e ad
opti
on o
f new
-gen
erat
ion
mod
ern
vari
etie
s us
ing
prob
it a
nd t
obit
mod
els
in C
hhat
tisg
arh
and
Ori
ssa,
200
8.
Fact
orPr
obith
Tobi
ti
Coeffi c
ient
Mar
gina
l pro
babi
lity
Coeffi c
ient
Elas
ticity
Inte
rcep
t0
.21
16
.48
Age
(yea
rs)
0.0
03
0.0
01 0
.35
0.3
1
Educ
atio
n (y
ears
) −
0.0
04
−0
.00
2 0
.03
0.0
03
Adul
t hou
seho
ld s
ize
(num
ber o
f mem
bers
) −
0.0
2 −
0.0
07 −
0.7
2 −
0.0
5
Farm
siz
e (h
a)0
.01
0.0
06
1.3
70
.05
Shar
e of
low
land
(%)
−0
.17
−0
.11
Shar
e of
sal
ine
area
(%)
−0
.13
−0
.00
6
Dum
my
for l
owla
nda
−0
.32
**
−0
.12
Dum
my
for m
ediu
m la
ndb
−0
.52
**
* −
0.2
0
Dum
my
for B
olan
girc
−0
.59
**
* −
0.2
1 −
32
.84
**
* −
0.1
1
Dum
my
for D
henk
anal
d −
1.13
**
* −
0.3
4 −
59
.32
**
* −
0.1
9
Dum
my
for J
ajpu
re −
0.3
7*
* −
0.1
3−
0.0
05
−0
.00
001
Dum
my
for B
hadr
akf
0.3
1*
*0
.12
33
.01
**
*0
.07
Dum
my
for K
endr
apar
ag0
.32
**
*0
.13
47.6
0*
**
0.0
9
Like
lihoo
d ra
tio χ
2 −
824
.64
**
*
Log
pseu
dolik
elih
ood
−1,
49
5.5
8*
**
**
* a
nd *
* in
dica
te s
tatis
tical
sig
nifi c
ance
at 1
% a
nd 5
%, r
espe
ctiv
ely.
a 1 if
low
land
and
0 o
ther
wis
e. b 1
if m
ediu
m la
nd a
nd 0
oth
erw
ise.
c 1 if
Bol
angi
r and
0 o
ther
wis
e. d 1
if
Dhe
nkan
al a
nd 0
oth
erw
ise.
e 1 if
Jaj
pur a
nd 0
oth
erw
ise.
f 1 if
Bha
drak
and
0 o
ther
wis
e. g 1
Ken
drap
ara
and
0 o
ther
wis
e. h 1
if n
ew M
V an
d 0
oth
erw
ise.
i Sha
re o
f new
MV
area
in
tota
l MV
area
.
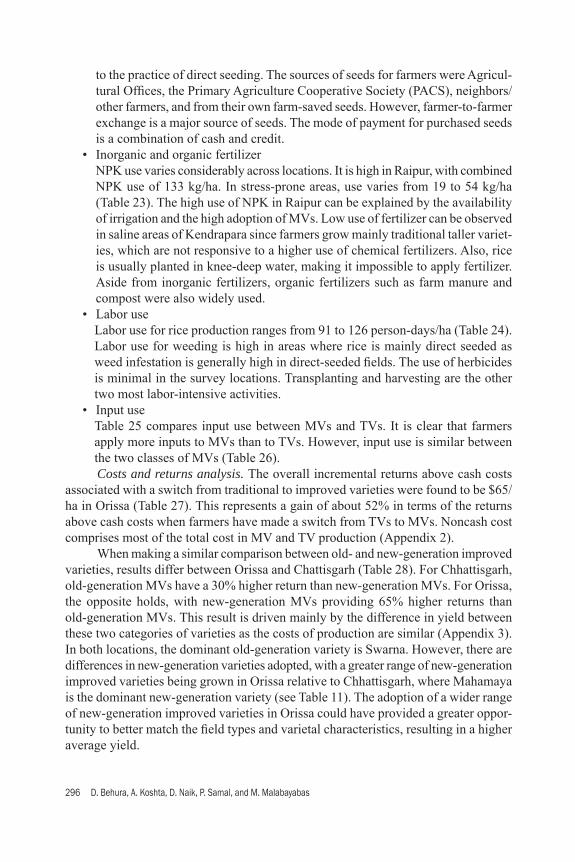
296 D. Behura, A. Koshta, D. Naik, P. Samal, and M. Malabayabas
to the practice of direct seeding. The sources of seeds for farmers were Agricul-tural Offi ces, the Primary Agriculture Cooperative Society (PACS), neighbors/other farmers, and from their own farm-saved seeds. However, farmer-to-farmer exchange is a major source of seeds. The mode of payment for purchased seeds is a combination of cash and credit.
• Inorganic and organic fertilizerNPK use varies considerably across locations. It is high in Raipur, with combined NPK use of 133 kg/ha. In stress-prone areas, use varies from 19 to 54 kg/ha (Table 23). The high use of NPK in Raipur can be explained by the availability of irrigation and the high adoption of MVs. Low use of fertilizer can be observed in saline areas of Kendrapara since farmers grow mainly traditional taller variet-ies, which are not responsive to a higher use of chemical fertilizers. Also, rice is usually planted in knee-deep water, making it impossible to apply fertilizer. Aside from inorganic fertilizers, organic fertilizers such as farm manure and compost were also widely used.
• Labor useLabor use for rice production ranges from 91 to 126 person-days/ha (Table 24). Labor use for weeding is high in areas where rice is mainly direct seeded as weed infestation is generally high in direct-seeded fi elds. The use of herbicides is minimal in the survey locations. Transplanting and harvesting are the other two most labor-intensive activities.
• Input useTable 25 compares input use between MVs and TVs. It is clear that farmers apply more inputs to MVs than to TVs. However, input use is similar between the two classes of MVs (Table 26).
Costs and returns analysis. The overall incremental returns above cash costs associated with a switch from traditional to improved varieties were found to be $65/ha in Orissa (Table 27). This represents a gain of about 52% in terms of the returns above cash costs when farmers have made a switch from TVs to MVs. Noncash cost comprises most of the total cost in MV and TV production (Appendix 2). When making a similar comparison between old- and new-generation improved varieties, results differ between Orissa and Chattisgarh (Table 28). For Chhattisgarh, old-generation MVs have a 30% higher return than new-generation MVs. For Orissa, the opposite holds, with new-generation MVs providing 65% higher returns than old-generation MVs. This result is driven mainly by the difference in yield between these two categories of varieties as the costs of production are similar (Appendix 3). In both locations, the dominant old-generation variety is Swarna. However, there are differences in new-generation varieties adopted, with a greater range of new-generation improved varieties being grown in Orissa relative to Chhattisgarh, where Mahamaya is the dominant new-generation variety (see Table 11). The adoption of a wider range of new-generation improved varieties in Orissa could have provided a greater oppor-tunity to better match the fi eld types and varietal characteristics, resulting in a higher average yield.

Patterns of adoption of improved rice varieties...of Chhattisgarh and Orissa 297
Tabl
e 23
. Maj
or in
puts
use
d in
ric
e pr
oduc
tion
(kg/
ha) d
urin
g kh
arif
in C
hhat
tisg
arh
and
Ori
ssa,
200
8.a
Inpu
tsD
roug
htSu
bmer
genc
eSa
line
Non
salin
eAl
l Oris
saCh
hatt
isga
rhO
rissa
Oris
saO
rissa
Oris
sa
Rai
pur
Dhe
nkan
alB
olan
gir
Jajp
urB
hadr
akK
endr
apar
aB
hadr
akK
endr
apar
a
Fert
ilize
r
N
7617
23
32
34
1647
65
30
P
44
12
917
183
35
44
17
K
133
25
00
514
4
(com
bine
d N
PK)
133
32
34
54
52
198
61
23
51
Org
anic
fert
ilize
r2
,40
02
,20
01,
20
0
1,8
00
–9
2,1
46
2,1
00
1,3
00
Seed
12
010
510
77
5
59
746
37
98
5a O
n th
e ba
sis
of th
e la
rges
t par
cel.
Tabl
e 24
. Lab
or u
se (p
erso
n-da
ys/h
a) in
ric
e pr
oduc
tion
dur
ing
khar
if in
Chh
atti
sgar
h an
d O
riss
a, 2
008.
Labo
r act
ivity
Dro
ught
Subm
erge
nce
Salin
eN
onsa
line
All O
rissa
Chha
ttis
garh
Oris
saO
rissa
Oris
saO
rissa
Rai
pur
Dhe
nkan
alB
olan
gir
Jajp
urB
hadr
akK
endr
apar
aB
hadr
akK
endr
apar
a
Land
pre
para
tion
92
216
67
89
81
2
Crop
est
ablis
hmen
t17
25
32
1927
36
273
52
8
Appl
icat
ion
of c
hem
ical
s7
117
61
12
55
Wee
ding
28
40
33
22
1018
914
24
Har
vest
ing
1917
1619
29
33
35
36
24
Thre
shin
g11
97
81
211
1517
10
Oth
ersa
92
116
52
87
6
Tota
l lab
or10
01
26
112
96
9110
910
51
22
109
a Oth
ers
incl
udes
labo
r for
tran
spor
ting
grai
ns a
nd ir
rigat
ion.
On
the
basi
s of
the
larg
est p
arce
l.

298 D. Behura, A. Koshta, D. Naik, P. Samal, and M. Malabayabas
Tabl
e 25
. Inp
ut u
se in
ric
e pr
oduc
tion
usi
ng M
Vs a
nd T
Vs d
urin
g kh
arif
in C
hhat
tisg
arh
and
Ori
ssa,
200
8.a
Item
Dro
ught
Subm
erge
nce
Salin
eN
onsa
line
All O
rissa
Chha
ttis
garh
Oris
saO
rissa
Oris
saO
rissa
Rai
pur
Dhe
nkan
alB
olan
gir
Jajp
urB
hadr
akK
endr
apar
aB
hadr
akK
endr
apar
a
MVs
TVs
MVs
TVs
MVs
TVs
MVs
TVs
MVs
TVs
MVs
TVs
MVs
TVs
MVs
TVs
MVs
TVs
Fert
ilize
r (k
g/ha
)
N76
–19
1424
1637
27–
34
–16
56
35
62
–3
624
P4
4–
158
97
1916
–18
–3
4127
42
–2
21
2
K13
–4
12
06
4–
0–
07
113
–6
1
NPK
tota
l13
3–
38
23
35
23
62
47–
52
–19
104
63
117
–6
437
Org
anic
fe
rtili
zer
(kg/
ha)
2,4
00
–2
,20
02
,20
01,
20
08
00
1,3
00
2,4
00
–0
–8
30
013
02
,10
0–
1,5
00
90
0

Patterns of adoption of improved rice varieties...of Chhattisgarh and Orissa 299
Tabl
e 26
. Inp
ut u
se u
sing
new
- and
old
-gen
erat
ion
MVs
dur
ing
khar
if in
Chh
atti
sgar
h an
d O
riss
a, 2
008.
a
Inpu
tsD
roug
htSu
bmer
genc
eSa
line
Non
salin
eAl
l Oris
sa
Chha
ttis
garh
Oris
saO
rissa
Oris
saO
rissa
Rai
pur
Dhe
nkan
alB
olan
gir
Jajp
urB
hadr
akK
endr
apar
aB
hadr
akK
endr
apar
a
New
Old
New
Old
New
Old
New
Old
New
Old
New
Old
New
Old
New
Old
New
Old
Fert
ilize
r (kg
/ha)
N74
772
219
212
54
63
35
36
46
56
647
30
P2
224
78
45
119
22
22
23
23
169
K2
32
54
82
415
913
132
82
317
9
NPK
to
tal
119
12
63
33
527
34
72
518
89
911
611
28
04
8
Org
anic
fe
rtil-
izer
(k
g/ha
)
2,0
00
2,6
00
2,3
00
2,1
00
1,0
00
1,3
00
775
1,5
00
––
––
271
50
82
,30
01,
80
01,
40
01,
60
0
Seed
(k
g/ha
)
113
12
397
102
111
104
73
75
––
––
63
55
79
78
83
93
Labo
r us
e (p
er-
son-
days
/ha
)
104
98
119
127
106
114
98
93
––
––
114
12
51
28
107
115
113
a On
the
basi
s of
the
larg
est p
arce
l.
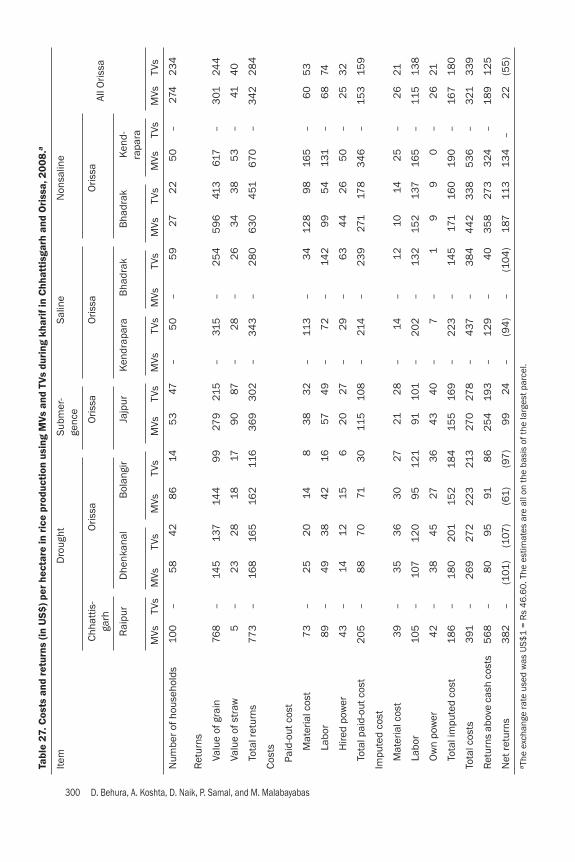
300 D. Behura, A. Koshta, D. Naik, P. Samal, and M. Malabayabas
Tabl
e 27
. Cos
ts a
nd r
etur
ns (i
n U
S$) p
er h
ecta
re in
ric
e pr
oduc
tion
usi
ng M
Vs a
nd T
Vs d
urin
g kh
arif
in C
hhat
tisg
arh
and
Ori
ssa,
200
8.a
Item
Dro
ught
Subm
er-
genc
eSa
line
Non
salin
e
All O
rissa
Chha
ttis
-ga
rhO
rissa
Oris
saO
rissa
Oris
sa
Rai
pur
Dhe
nkan
alB
olan
gir
Jajp
urK
endr
apar
aB
hadr
akB
hadr
akK
end-
rapa
ra
MVs
TVs
MVs
TVs
MVs
TVs
MVs
TVs
MVs
TVs
MVs
TVs
MVs
TVs
MVs
TVs
MVs
TVs
Num
ber o
f hou
seho
lds
100
–5
84
28
614
53
47–
50
–5
927
22
50
–27
42
34
Ret
urns
Valu
e of
gra
in76
8–
145
137
144
99
279
215
–31
5–
25
45
96
413
617
–3
0124
4
Valu
e of
str
aw5
–2
32
818
179
087
–2
8–
26
34
38
53
–41
40
Tota
l ret
urns
773
–16
816
516
211
63
69
30
2–
34
3–
28
06
30
451
67
0–
34
22
84
Cost
s
Paid
-out
cos
t
Mat
eria
l cos
t7
3–
25
20
148
38
32
–11
3–
34
12
89
816
5–
60
53
Labo
r8
9–
49
38
42
1657
49
–7
2–
142
99
54
131
–6
874
Hire
d po
wer
43
–14
12
156
20
27–
29
–6
34
42
65
0–
25
32
Tota
l pai
d-ou
t cos
t2
05
–8
87
071
30
115
108
–21
4–
23
927
117
83
46
–15
315
9
Impu
ted
cost
Mat
eria
l cos
t3
9–
35
36
30
2721
28
–14
–1
210
142
5–
26
21
Labo
r10
5–
107
12
09
51
2191
101
–2
02
–13
215
213
716
5–
115
138
Ow
n po
wer
42
–3
84
527
36
43
40
–7
–1
99
0–
26
21
Tota
l im
pute
d co
st18
6–
180
201
152
184
155
169
–2
23
–14
517
116
019
0–
167
180
Tota
l cos
ts3
91–
26
927
22
23
213
270
278
–4
37–
38
44
42
33
85
36
–3
213
39
Ret
urns
abo
ve c
ash
cost
s5
68
–8
09
591
86
25
419
3–
12
9–
40
35
827
33
24–
189
12
5
Net
retu
rns
38
2–
(101
)(1
07)
(61
)(9
7)
99
24–
(94
)–
(10
4)
187
113
134
–2
2(5
5)
a The
exc
hang
e ra
te u
sed
was
US$
1 =
Rs
46
.60
. The
est
imat
es a
re a
ll on
the
basi
s of
the
larg
est p
arce
l.

Patterns of adoption of improved rice varieties...of Chhattisgarh and Orissa 301
Tabl
e 28
. Cos
ts a
nd re
turn
s (in
US$
) per
hec
tare
in ri
ce p
rodu
ctio
n us
ing
new
- and
old
-gen
erat
ion
MVs
dur
ing
khar
if in
Chh
atti
sgar
h an
d O
riss
a, 2
008.
a
Item
Dro
ught
Subm
erge
nce
Non
salin
eAl
l Oris
sa
Chha
ttis
garh
Oris
saO
rissa
Oris
sa
Rai
pur
Dhe
nkan
alB
olan
gir
Jajp
urB
hadr
akK
endr
apar
a
New
Old
New
Old
New
Old
New
Old
New
Old
New
Old
New
Old
Num
ber o
f hou
seho
lds
316
96
52
216
516
36
198
35
1597
176
Ret
urns
Valu
e of
gra
in6
72
811
131
147
12
914
93
312
50
58
36
26
63
657
14
35
227
Valu
e of
str
aw4
521
23
1619
78
92
35
30
55
49
44
38
Tota
l ret
urns
676
816
152
170
145
168
40
93
42
618
65
66
916
20
479
26
5
Cost
s
Paid
-out
cos
t
Mat
eria
l cos
t8
66
83
424
1115
43
371
29
12
518
01
28
102
36
Labo
r7
99
44
84
92
94
67
251
111
73
135
12
391
56
Hire
d po
wer
414
32
313
1116
29
174
44
44
95
33
52
0
Tota
l pai
d-ou
t cos
t2
06
20
510
58
651
7714
410
52
84
242
36
43
04
22
811
2
Impu
ted
cost
Mat
eria
l cos
t3
541
36
35
28
30
172
210
827
22
23
29
Labo
r10
410
510
110
810
39
37
99
313
519
517
813
413
210
5
Ow
n po
wer
40
43
23
40
35
25
44
42
98
00
183
0
Tota
l im
pute
d co
st17
918
916
018
316
614
814
015
715
421
12
05
156
173
164
Tota
l cos
ts3
85
39
42
65
26
921
72
25
28
42
62
43
84
53
56
94
60
401
276
Ret
urns
abo
ve c
ash
cost
s47
061
247
84
94
912
65
237
33
541
43
2731
62
5115
2
Net
retu
rns
291
42
3(1
13)
(99
)(7
2)
(58
)1
25
80
180
20
31
23
160
78
(11
)a T
he e
xcha
nge
rate
use
d w
as U
S$1
= R
s 4
6.6
0. T
he e
stim
ates
are
all
on th
e ba
sis
of th
e la
rges
t par
cel.
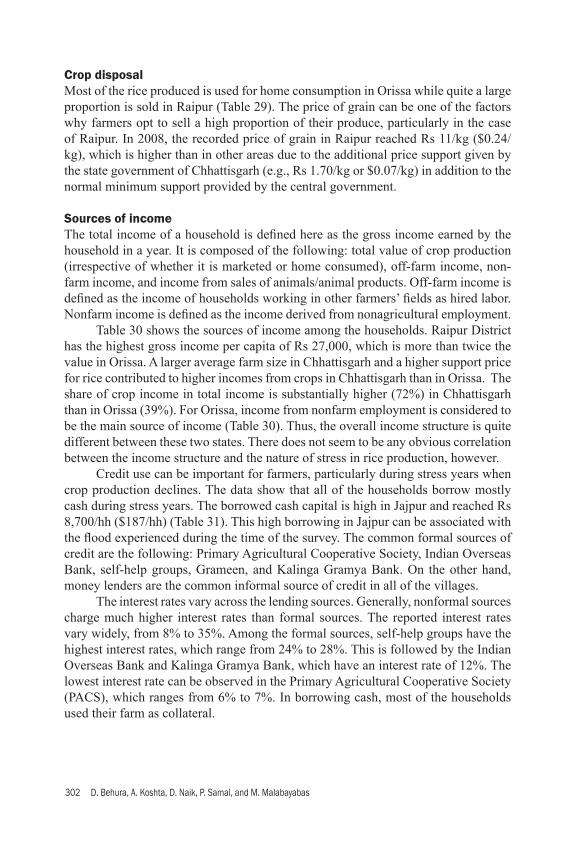
302 D. Behura, A. Koshta, D. Naik, P. Samal, and M. Malabayabas
Crop disposalMost of the rice produced is used for home consumption in Orissa while quite a large proportion is sold in Raipur (Table 29). The price of grain can be one of the factors why farmers opt to sell a high proportion of their produce, particularly in the case of Raipur. In 2008, the recorded price of grain in Raipur reached Rs 11/kg ($0.24/kg), which is higher than in other areas due to the additional price support given by the state government of Chhattisgarh (e.g., Rs 1.70/kg or $0.07/kg) in addition to the normal minimum support provided by the central government.
Sources of incomeThe total income of a household is defi ned here as the gross income earned by the household in a year. It is composed of the following: total value of crop production (irrespective of whether it is marketed or home consumed), off-farm income, non-farm income, and income from sales of animals/animal products. Off-farm income is defi ned as the income of households working in other farmers’ fi elds as hired labor. Nonfarm income is defi ned as the income derived from nonagricultural employment. Table 30 shows the sources of income among the households. Raipur District has the highest gross income per capita of Rs 27,000, which is more than twice the value in Orissa. A larger average farm size in Chhattisgarh and a higher support price for rice contributed to higher incomes from crops in Chhattisgarh than in Orissa. The share of crop income in total income is substantially higher (72%) in Chhattisgarh than in Orissa (39%). For Orissa, income from nonfarm employment is considered to be the main source of income (Table 30). Thus, the overall income structure is quite different between these two states. There does not seem to be any obvious correlation between the income structure and the nature of stress in rice production, however. Credit use can be important for farmers, particularly during stress years when crop production declines. The data show that all of the households borrow mostly cash during stress years. The borrowed cash capital is high in Jajpur and reached Rs 8,700/hh ($187/hh) (Table 31). This high borrowing in Jajpur can be associated with the fl ood experienced during the time of the survey. The common formal sources of credit are the following: Primary Agricultural Cooperative Society, Indian Overseas Bank, self-help groups, Grameen, and Kalinga Gramya Bank. On the other hand, money lenders are the common informal source of credit in all of the villages. The interest rates vary across the lending sources. Generally, nonformal sources charge much higher interest rates than formal sources. The reported interest rates vary widely, from 8% to 35%. Among the formal sources, self-help groups have the highest interest rates, which range from 24% to 28%. This is followed by the Indian Overseas Bank and Kalinga Gramya Bank, which have an interest rate of 12%. The lowest interest rate can be observed in the Primary Agricultural Cooperative Society (PACS), which ranges from 6% to 7%. In borrowing cash, most of the households used their farm as collateral.
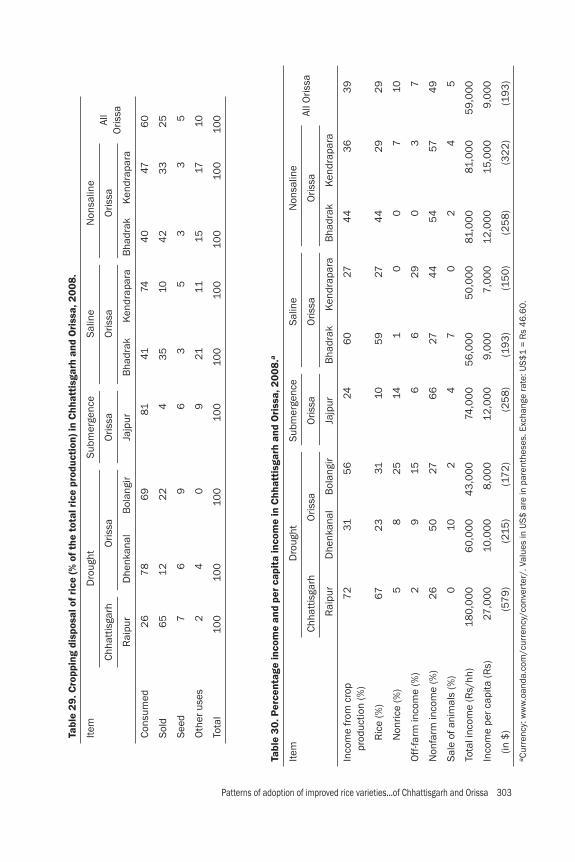
Patterns of adoption of improved rice varieties...of Chhattisgarh and Orissa 303
Tabl
e 29
. Cro
ppin
g di
spos
al o
f ric
e (%
of t
he t
otal
ric
e pr
oduc
tion
) in
Chh
atti
sgar
h an
d O
riss
a, 2
008.
Item
Dro
ught
Subm
erge
nce
Salin
eN
onsa
line
All
Oris
saCh
hatt
isga
rhO
rissa
Oris
saO
rissa
Oris
sa
Rai
pur
Dhe
nkan
alB
olan
gir
Jajp
urB
hadr
akK
endr
apar
aB
hadr
akK
endr
apar
a
Cons
umed
26
78
69
8141
744
047
60
Sold
65
12
22
43
510
42
33
25
Seed
76
96
35
33
5
Oth
er u
ses
24
09
2111
1517
10
Tota
l10
010
010
010
010
010
010
010
010
0
Tabl
e 30
. Per
cent
age
inco
me
and
per
capi
ta in
com
e in
Chh
atti
sgar
h an
d O
riss
a, 2
008.
a
Item
Dro
ught
Subm
erge
nce
Salin
eN
onsa
line
All O
rissa
Chha
ttis
garh
Oris
saO
rissa
Oris
saO
rissa
Rai
pur
Dhe
nkan
alB
olan
gir
Jajp
urB
hadr
akK
endr
apar
aB
hadr
akK
endr
apar
a
Inco
me
from
cro
p
pro
duct
ion
(%)
72
315
624
60
274
43
63
9
Ric
e (%
)6
72
331
105
927
44
29
29
Non
rice
(%)
58
25
141
00
710
Off
-farm
inco
me
(%)
29
156
62
90
37
Non
farm
inco
me
(%)
26
50
276
627
44
54
574
9
Sale
of a
nim
als
(%)
010
24
70
24
5
Tota
l inc
ome
(Rs/
hh)
180
,00
06
0,0
00
43
,00
074
,00
05
6,0
00
50
,00
081
,00
081
,00
05
9,0
00
Inco
me
per c
apita
(Rs)
27,0
00
10,0
00
8,0
00
12
,00
09
,00
07
,00
01
2,0
00
15,0
00
9,0
00
(in $
)(5
79
)(2
15)
(17
2)
(25
8)
(19
3)
(15
0)
(25
8)
(32
2)
(19
3)
a Cur
renc
y: w
ww
.oan
da.c
om/c
urre
ncy/
conv
erte
r/. V
alue
s in
US$
are
in p
aren
thes
es. E
xcha
nge
rate
: US$
1 =
Rs
46
.60
.
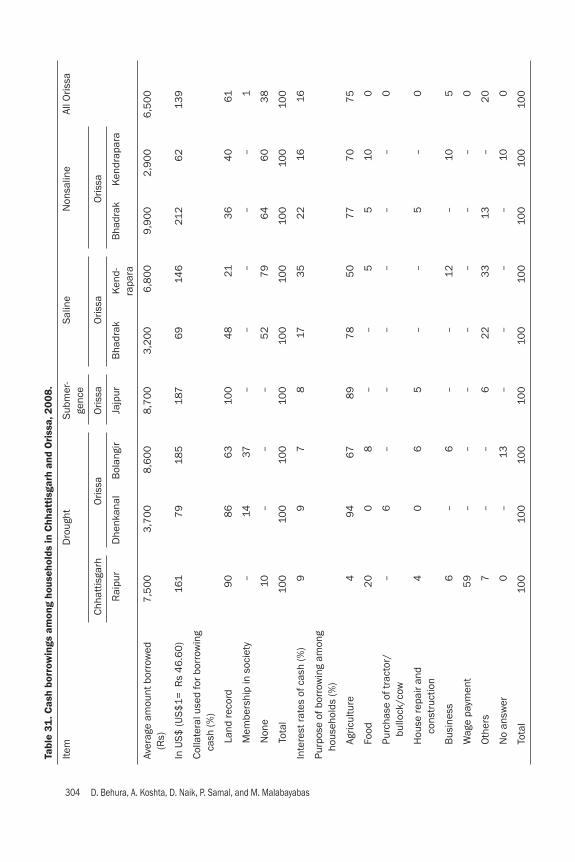
304 D. Behura, A. Koshta, D. Naik, P. Samal, and M. Malabayabas
Tabl
e 31
. Cas
h bo
rrow
ings
am
ong
hous
ehol
ds in
Chh
atti
sgar
h an
d O
riss
a, 2
008.
Item
Dro
ught
Subm
er-
genc
eSa
line
Non
salin
eAl
l Oris
sa
Chha
ttis
garh
Oris
saO
rissa
Oris
saO
rissa
Rai
pur
Dhe
nkan
alB
olan
gir
Jajp
urB
hadr
akK
end-
rapa
raB
hadr
akK
endr
apar
a
Aver
age
amou
nt b
orro
wed
(R
s)7
,50
03
,70
08
,60
08
,70
03
,20
06
,80
09
,90
02
,90
06
,50
0
In U
S$ (U
S$1
= R
s 4
6.6
0)
161
79
185
187
69
146
212
62
139
Colla
tera
l use
d fo
r bor
row
ing
cash
(%)
Land
reco
rd9
08
66
310
04
821
36
40
61
Mem
bers
hip
in s
ocie
ty–
1437
––
––
–1
Non
e10
––
–5
27
96
46
03
8
Tota
l10
010
010
010
010
010
010
010
010
0
Inte
rest
rate
s of
cas
h (%
)9
97
817
35
22
1616
Purp
ose
of b
orro
win
g am
ong
hous
ehol
ds (%
)
Agric
ultu
re4
946
78
97
85
077
70
75
Food
20
08
––
55
100
Purc
hase
of t
ract
or/
bu
llock
/cow
–6
––
––
––
0
Hou
se re
pair
and
c
onst
ruct
ion
40
65
––
5–
0
Bus
ines
s6
–6
––
12
–10
5
Wag
e pa
ymen
t5
9–
––
––
––
0
Oth
ers
7–
–6
22
33
13–
20
No
answ
er0
–13
––
––
100
Tota
l10
010
010
010
010
010
010
010
010
0
Patterns of adoption of improved rice varieties...of Chhattisgarh and Orissa 305
Household coping strategiesHouseholds that are usually exposed to stresses such as drought and fl ood do have inherent coping strategies. In this section, information on how households dealt with these stresses is presented. The common coping strategies that were identifi ed are the following: consumption adjustments, crop management adjustments, and credit and expenditure adjustments. Consumption adjustments. Households adjust not only their farm management strategies but also their consumption during stress years to cope with the adverse effects of stress since production is greatly affected. Table 32 shows the adjustments made by households in Orissa and Raipur districts. During normal years, more than 60% of the households are considered to be rice-suffi cient throughout the year, whereas, in stress years, only 8–32% of the households reported being self-suffi cient. Households reported having reduced both the number of meals in a day and the quantity of food consumed per meal to manage the shortage. During normal years, more than 80% of the households consumed three meals a day. However, the proportion of households that consumed three meals a day was lower. Household livelihood adjustments. Livelihood adjustments of households appear in Table 33, which shows that most of the households do resort to using their savings as an immediate response to stress. Increasing cash borrowing during stress years is also widely practiced. Food and seed borrowings were also done in most of the areas. Most of the households also sell or mortgage assets such as land, jewelry, and home appliances. All of the households reduced their expenses for clothing, festivals, and social ceremonies. Crop management adjustments. Table 34 shows the major crop management ad-justments of farmers during stress years. The adjustments reported in this section were all based on the focus group discussions done in each village. Most of the respondents interviewed decreased their area planted to rice. For example, in Chhattisgarh, they decreased the area planted due to limited water availability and also to reduce input costs. Some adjustments were made in crop establishment methods also during stress years. Farmers in Jajpur reported a change in their method of rice establishment from direct sowing to transplanting. This is because direct seeding is not possible when fi elds are submerged. In saline areas such as Bhadrak and Kendrapara, farmers practice late transplanting. This is done in order to make sure that the salinity is fully washed out. In the case of drought-prone areas of Raipur, farmers changed from the usual transplanting to DSR due to a lack of water. On the other hand, increasing the seeding rate to more than 60% was done by farmers during stress years, believing that planting additional seeds can compensate for the crop loss. Replanting/resowing is usually done depending on the extent of damage caused by fl ood/drought and the availability of money and labor. Farmers keep additional quantities of seeds for such use and those who don’t have extra seeds purchase them from neighboring farms. Farmers reported growing alternative crops when rice failed. In Jajpur, the farmers plant urdbean and mungbean in fi elds that were intended for rice

306 D. Behura, A. Koshta, D. Naik, P. Samal, and M. Malabayabas
Tabl
e 32
. Ric
e fo
od s
uffi c
ienc
y an
d fo
od in
take
am
ong
hous
ehol
ds d
urin
g no
rmal
and
str
ess
year
s in
Ori
ssa
and
Chh
atti
sgar
h, 2
008.
Item
Dro
ught
Subm
erge
nce
Chha
ttis
garh
Oris
saO
rissa
Rai
pur
Dhe
nkan
alB
olan
gir
Jajp
ur
Perc
ent o
f hou
seho
lds
that
are
sel
f-suffi c
ient
in a
yea
r
Nor
mal
yea
rs9
571
64
91
Stre
ss y
ears
931
32
8
Perc
ent o
f hou
seho
lds
that
are
con
sum
ing
3 m
eals
/day
Nor
mal
yea
rs10
09
08
99
8
Stre
ss y
ears
12
36
43
91
Perc
ent o
f hou
seho
lds
eatin
g le
ss fo
od d
urin
g st
ress
yea
rs8
85
05
421
Tabl
e 33
. Oth
er a
djus
tmen
ts b
y ho
useh
olds
(%) d
urin
g st
ress
yea
rs in
Chh
atti
sgar
h an
d O
riss
a, 2
008.
Adju
stm
ents
Dro
ught
Subm
erge
nce
Chha
ttis
garh
Oris
saO
rissa
Rai
pur
Dhe
nkan
alB
olan
gir
Jajp
ur
Usi
ng s
avin
gs10
08
291
13
Def
errin
g lo
an p
aym
ents
85
7191
–
Selli
ng m
ore
harv
este
d cr
op9
9–
––
Incr
easi
ng c
ash
borr
owin
g6
56
497
78
Incr
easi
ng fo
od b
orro
win
g6
69
49
–
Incr
easi
ng s
eed
borr
owin
g2
44
67
–
Selli
ng/m
ortg
agin
g as
sets
25
861
–
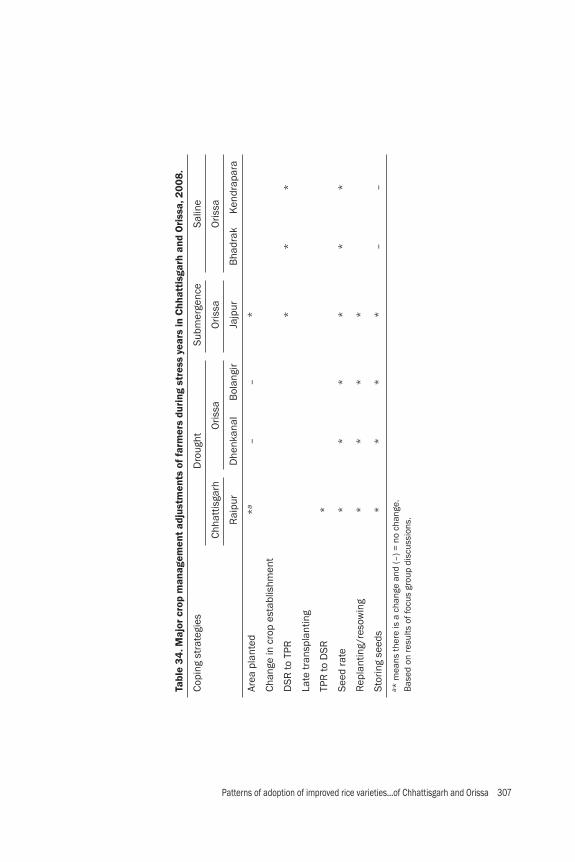
Patterns of adoption of improved rice varieties...of Chhattisgarh and Orissa 307
Tabl
e 34
. Maj
or c
rop
man
agem
ent
adju
stm
ents
of f
arm
ers
duri
ng s
tres
s ye
ars
in C
hhat
tisg
arh
and
Ori
ssa,
200
8.
Copi
ng s
trat
egie
sD
roug
htSu
bmer
genc
eSa
line
Chha
ttis
garh
Oris
saO
rissa
Oris
sa
Rai
pur
Dhe
nkan
alB
olan
gir
Jajp
urB
hadr
akK
endr
apar
a
Area
pla
nted
*a
––
*
Chan
ge in
cro
p es
tabl
ishm
ent
DSR
to T
PR*
**
Late
tran
spla
ntin
g
TPR
to D
SR*
Seed
rate
**
**
**
Rep
lant
ing/
reso
win
g*
**
*
Stor
ing
seed
s*
**
*–
–a *
mea
ns th
ere
is a
cha
nge
and
(–) =
no
chan
ge.
Bas
ed o
n re
sults
of f
ocus
gro
up d
iscu
ssio
ns.
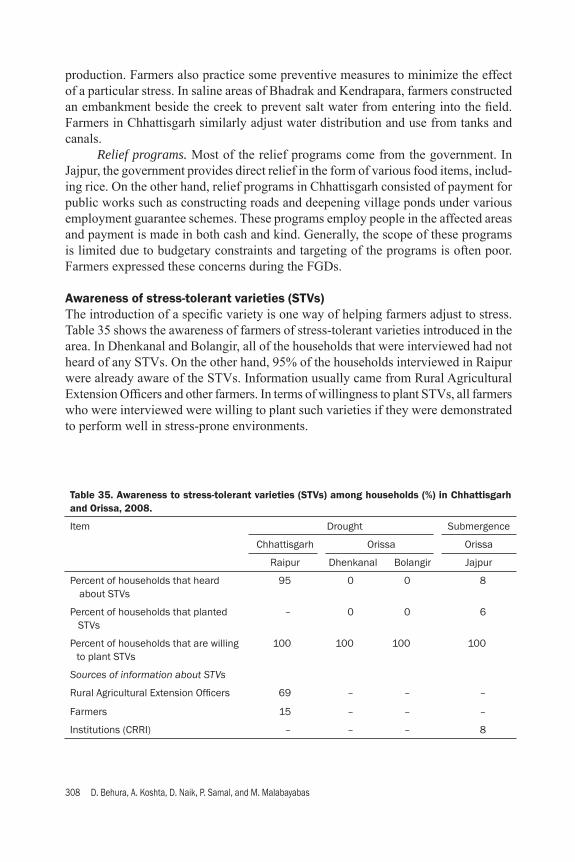
308 D. Behura, A. Koshta, D. Naik, P. Samal, and M. Malabayabas
production. Farmers also practice some preventive measures to minimize the effect of a particular stress. In saline areas of Bhadrak and Kendrapara, farmers constructed an embankment beside the creek to prevent salt water from entering into the fi eld. Farmers in Chhattisgarh similarly adjust water distribution and use from tanks and canals. Relief programs. Most of the relief programs come from the government. In Jajpur, the government provides direct relief in the form of various food items, includ-ing rice. On the other hand, relief programs in Chhattisgarh consisted of payment for public works such as constructing roads and deepening village ponds under various employment guarantee schemes. These programs employ people in the affected areas and payment is made in both cash and kind. Generally, the scope of these programs is limited due to budgetary constraints and targeting of the programs is often poor. Farmers expressed these concerns during the FGDs.
Awareness of stress-tolerant varieties (STVs)The introduction of a specifi c variety is one way of helping farmers adjust to stress. Table 35 shows the awareness of farmers of stress-tolerant varieties introduced in the area. In Dhenkanal and Bolangir, all of the households that were interviewed had not heard of any STVs. On the other hand, 95% of the households interviewed in Raipur were already aware of the STVs. Information usually came from Rural Agricultural Extension Offi cers and other farmers. In terms of willingness to plant STVs, all farmers who were interviewed were willing to plant such varieties if they were demonstrated to perform well in stress-prone environments.
Table 35. Awareness to stress-tolerant varieties (STVs) among households (%) in Chhattisgarh and Orissa, 2008.
Item Drought Submergence
Chhattisgarh Orissa Orissa
Raipur Dhenkanal Bolangir Jajpur
Percent of households that heard about STVs
95 0 0 8
Percent of households that planted STVs
– 0 0 6
Percent of households that are willing to plant STVs
100 100 100 100
Sources of information about STVs
Rural Agricultural Extension Offi cers 69 – – –
Farmers 15 – – –
Institutions (CRRI) – – – 8

Patterns of adoption of improved rice varieties...of Chhattisgarh and Orissa 309
Gender division of responsibility and decision-makingThe division on decisions and responsibilities between the husband and wife in all districts is presented in Table 36. Results show that most of the decisions with regard to farming are made mainly by men. On the other hand, household decisions are made by women, although men also contribute substantially to such decisions. In terms of labor participation, Table 37 shows that, on average, 82% of the farm labor activities were done by males in Orissa. On the other hand, the result is reversed in Raipur, where more than half of the activities are done by females, particularly weeding, land preparation, and crop establishment, and harvesting and threshing. In order to identify the participation of women in the decision process in farming as well as in household matters, the Women’s Empowerment Index (WEI), which was developed by Hossain, was adopted in the study (Paris et al 2008). Table 38 shows the computed WEI across locations. Results show that husbands mainly make farming decisions in most cases, particularly in Orissa. However, some indicators require a joint decision, which usually pertains to household matters such as farm/household income, type of food to consume, and children’s education (Raipur, Dhenkanal, and Bolangir). On the other hand, joint decision making was done on issues such as iden-tifying from which institution to borrow, political decisions, and number of children to raise in Jajpur. Alternatively, the only decision that is solely made by the wife even if the husband is around is the type of food to consume in Bhadrak and Kendrapara, and identifying which institution to borrow money from in Raipur. The fi ndings suggest that, in the areas under study, women still have a limited role not only in rice farming but also in household management.
Summary of fi ndings
• Raipur has a larger average farm size of 2.8 ha than Orissa, where farms range from only 1.0 to 2.1 ha.
• Farmers mostly own their farm land. However, some farmers in Bhadrak and Raipur are involved in rice farming by renting-in land from larger farmers due to a scarcity of labor.
• Cropping intensity in most of the villages ranges from 100% to 160% except in saline areas of Kendrapara, which has an intensity of 95% since rice is planted only in kharif when salinity is washed out by rain.
• A high proportion of farmers adopt only TVs in saline areas because of salinity. However, farmers use both MVs and TVs in submergence-prone areas of Jajpur. On the other hand, most of the areas are covered by MVs except for the coastal areas of Bhadrak and Kendrapara, where TVs cover 90% and 97%, respectively.
• Old-generation varieties (varieties released before 1990) dominate most of the areas. These old varieties include Swarna, Lalat, and Gayatri. On the other hand, the major new-generation varieties (varieties released after 1990) are Mahamaya, Khandagiri, and MTU-1010.
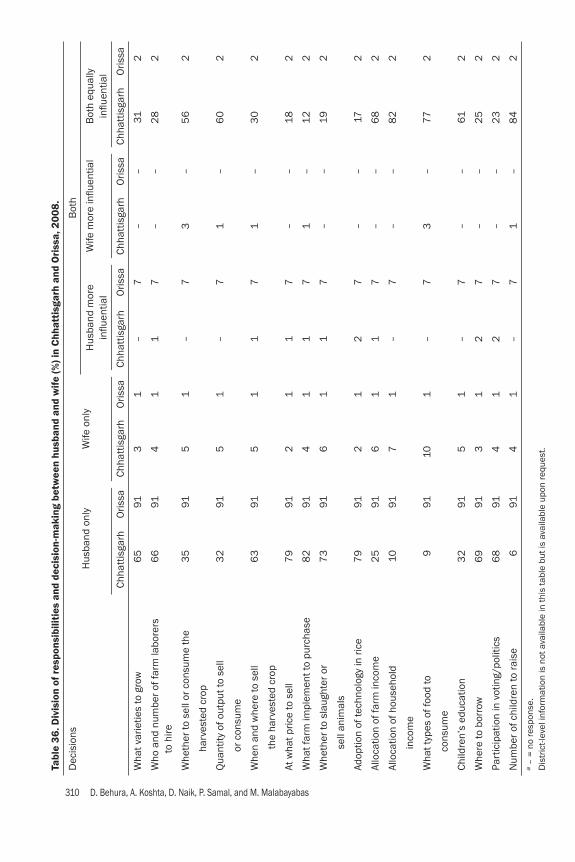
310 D. Behura, A. Koshta, D. Naik, P. Samal, and M. Malabayabas
Tabl
e 36
. Div
isio
n of
res
pons
ibili
ties
and
dec
isio
n-m
akin
g be
twee
n hu
sban
d an
d w
ife (%
) in
Chh
atti
sgar
h an
d O
riss
a, 2
008.
Dec
isio
nsH
usba
nd o
nly
Wife
onl
yB
oth
Hus
band
mor
e infl u
entia
lW
ife m
ore
infl u
entia
lB
oth
equa
lly
infl u
entia
l
Chha
ttis
garh
Oris
saCh
hatt
isga
rhO
rissa
Chha
ttis
garh
Oris
saCh
hatt
isga
rhO
rissa
Chha
ttis
garh
Oris
sa
Wha
t var
ietie
s to
gro
w6
591
31
–7
––
312
Who
and
num
ber o
f far
m la
bore
rs
to h
ire
66
914
11
7–
–2
82
Whe
ther
to s
ell o
r con
sum
e th
e 3
591
51
–7
3–
56
2
har
vest
ed c
rop
Qua
ntity
of o
utpu
t to
sell
32
915
1–
71
–6
02
or c
onsu
me
Whe
n an
d w
here
to s
ell
63
915
11
71
–3
02
the
har
vest
ed c
rop
At w
hat p
rice
to s
ell
79
912
11
7–
–18
2
Wha
t far
m im
plem
ent t
o pu
rcha
se8
291
41
17
1–
12
2
Whe
ther
to s
laug
hter
or
73
916
11
7–
–19
2
sel
l ani
mal
s
Adop
tion
of te
chno
logy
in ri
ce7
991
21
27
––
172
Allo
catio
n of
farm
inco
me
25
916
11
7–
–6
82
Allo
catio
n of
hou
seho
ld
10
917
1–
7–
–8
22
inc
ome
Wha
t typ
es o
f foo
d to
9
9110
1–
73
–77
2
con
sum
e
Child
ren’
s ed
ucat
ion
32
915
1–
7–
–61
2
Whe
re to
bor
row
69
913
12
7–
–2
52
Part
icip
atio
n in
vot
ing/
polit
ics
68
914
12
7–
–2
32
Num
ber o
f chi
ldre
n to
rais
e6
914
1–
71
–8
42
a –
= n
o re
spon
se.
Dis
tric
t-lev
el in
form
atio
n is
not
ava
ilabl
e in
this
tabl
e bu
t is
avai
labl
e up
on re
ques
t.
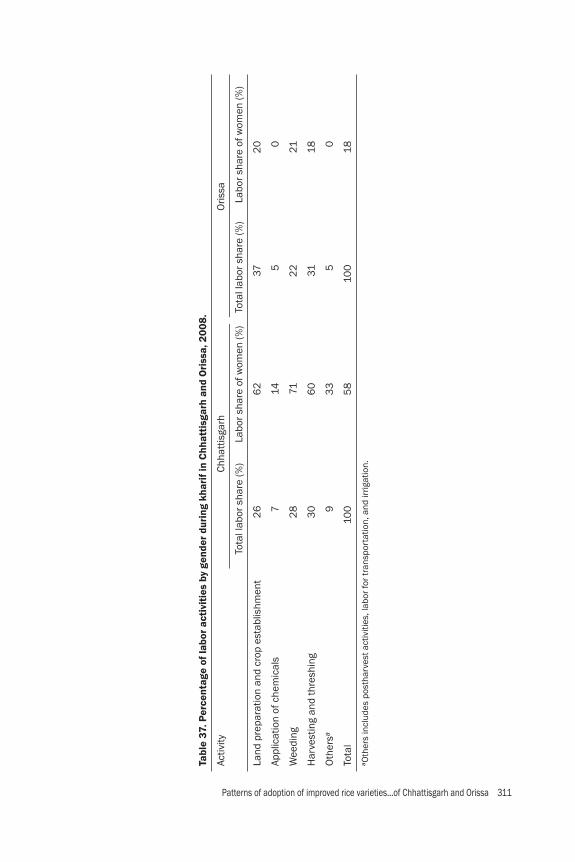
Patterns of adoption of improved rice varieties...of Chhattisgarh and Orissa 311
Tabl
e 37
. Per
cent
age
of la
bor
acti
viti
es b
y ge
nder
dur
ing
khar
if in
Chh
atti
sgar
h an
d O
riss
a, 2
008.
Activ
ityCh
hatt
isga
rhO
rissa
Tota
l lab
or s
hare
(%)
Labo
r sha
re o
f wom
en (%
)To
tal l
abor
sha
re (%
)La
bor s
hare
of w
omen
(%)
Land
pre
para
tion
and
crop
est
ablis
hmen
t2
66
237
20
Appl
icat
ion
of c
hem
ical
s7
145
0
Wee
ding
28
712
221
Har
vest
ing
and
thre
shin
g3
06
031
18
Oth
ersa
93
35
0
Tota
l10
05
810
018
a Oth
ers
incl
udes
pos
thar
vest
act
iviti
es, l
abor
for t
rans
port
atio
n, a
nd ir
rigat
ion.
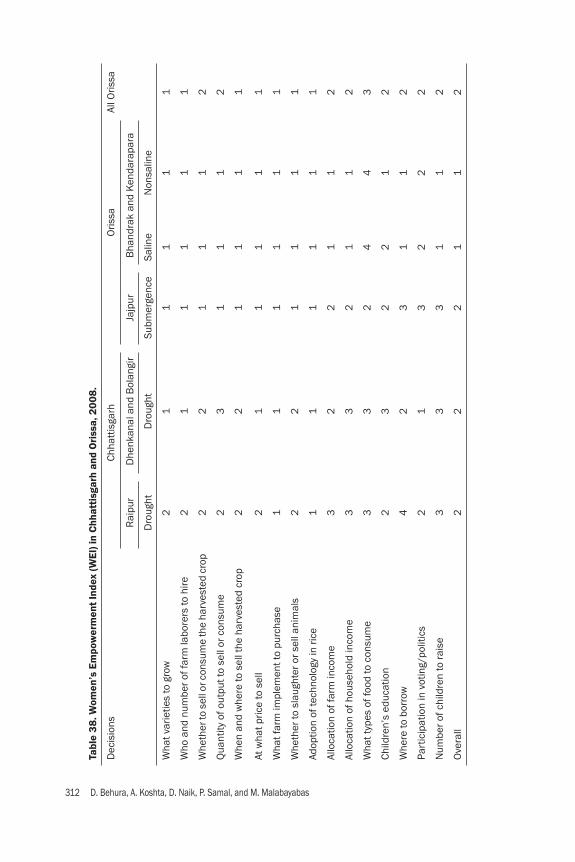
312 D. Behura, A. Koshta, D. Naik, P. Samal, and M. Malabayabas
Tabl
e 38
. Wom
en’s
Em
pow
erm
ent
Inde
x (W
EI) i
n C
hhat
tisg
arh
and
Ori
ssa,
200
8.
Dec
isio
nsCh
hatt
isga
rh
Oris
saAl
l Oris
sa
Rai
pur
Dhe
nkan
al a
nd B
olan
gir
Jajp
urB
hand
rak
and
Ken
dara
para
Dro
ught
Dro
ught
Subm
erge
nce
Salin
eN
onsa
line
Wha
t var
ietie
s to
gro
w2
11
11
1
Who
and
num
ber o
f far
m la
bore
rs to
hire
21
11
11
Whe
ther
to s
ell o
r con
sum
e th
e ha
rves
ted
crop
22
11
12
Qua
ntity
of o
utpu
t to
sell
or c
onsu
me
23
11
12
Whe
n an
d w
here
to s
ell t
he h
arve
sted
cro
p2
21
11
1
At w
hat p
rice
to s
ell
21
11
11
Wha
t far
m im
plem
ent t
o pu
rcha
se1
11
11
1
Whe
ther
to s
laug
hter
or s
ell a
nim
als
22
11
11
Adop
tion
of te
chno
logy
in ri
ce1
11
11
1
Allo
catio
n of
farm
inco
me
32
21
12
Allo
catio
n of
hou
seho
ld in
com
e 3
32
11
2
Wha
t typ
es o
f foo
d to
con
sum
e3
32
44
3
Child
ren’
s ed
ucat
ion
23
22
12
Whe
re to
bor
row
42
31
12
Part
icip
atio
n in
vot
ing/
polit
ics
21
32
22
Num
ber o
f chi
ldre
n to
rais
e3
33
11
2
Ove
rall
22
21
12
Patterns of adoption of improved rice varieties...of Chhattisgarh and Orissa 313
• The yield of MVs is signifi cantly higher by 0.4 t/ha and 0.6 t/ha than that of TVs in Raipur and Orissa, respectively. In terms of land type, MV yield is signifi cantly higher than TV yield in the medium land type by 1.3 t/ha.
• Probit and tobit analyses indicated that the presence of lowland and saline-affected areas signifi cantly affects the adoption of MVs and new MVs. In addition, farm size was found to signifi cantly affect only the probability of adopting MVs but not the intensity of adopting them.
• Cultivation of MVs is signifi cantly profi table (in terms of net returns above cash costs) relative to TVs in Orissa by $65/ha. This represents a 50% gain if the farmers decide to switch from TVs to MVs. Old-generation MVs were found to be more profi table by 30% than the new-generation MVs in Raipur, while new-generation MVs were more profi table in Orissa by 65%. The result is driven mainly by the difference in yields between these two categories of varieties as the production costs are similar.
• Crop production is the main source of income in Chhattisgarh while nonfarm employment in Orissa is the main income source.
• Households borrow mostly cash during stress years. The amount borrowed is highest in Jajpur—Rs 8,700/hh ($187/hh).
• Few households that were included in the study are aware of stress-tolerant variet-ies. However, they are willing to plant these STVs as long as they will give high yield, exhibit stress tolerance, and be readily available with proper demonstrations.
• Regarding gender participation, decisions related to farming are mainly made by the principal male members (husbands). However, decisions about the allocation of farm and household income, types of food to consume, and education for the children are jointly made by men and women. Women generally have a limited role in farm decision-making at all of the sites.
References
Behura D. 2010. Socio-economic baseline report of coastal belts of Orissa under STRASA program. Unpublished paper. Department of Agricultural Economics, Orissa University of Agriculture and Technology, Bhubaneshwar, India.
Bhandari H, Pandey S, Hardy B, editors. 2007. Economic costs of drought and rice farmers’ drought coping mechanisms in eastern India. Los Baños (Philippines): International Rice Research Institute. p 43-113.
Food and Agricultural Policy Research Institute (FAPRI) Projections Macro database 1980-2009.Gauchan D, Smale M. 2007. Comparing the choices of farmers and breeders: the value of rice
landraces in Nepal. In: Jarvis D, Padoch C, Cooper HD, editors. Managing biodiversity in agricultural ecosystems. CABI, Columbia University Press. 512 p.
Janaiah A, Hossain M, Otsuka K. 2006. Productivity impact of the modern varieties of rice in India. Dev. Economies 44(2):190-207.
Koshta AK. 2010. Rice stress tolerance of poor farmers in South Asia and Africa with special reference to Chhattisgarh. Unpublished paper.

314 D. Behura, A. Koshta, D. Naik, P. Samal, and M. Malabayabas
Naik D. 2010. Socio-economic analysis on rice production system in stress situations of Orissa (India). Unpublished paper. Department of Agricultural Economics, Orissa University of Agriculture and Technology, Bhubaneshwar.
OAS (Orissa Agricultural Statistics). 2004-2005, 2005-2006, 2006-2007, and 2007-2008. Directoriate of Agriculture and Food Production, Bhubaneshwar, Orissa.
Pandey S, Barah BC, Velasco L. 2003. Patterns of rice productivity growth in eastern India: implications for research and policy. Unpublished manuscript. International Rice Research Institute, Laguna, Philippines.
Pandey S, Barah BC, Velasco L. 2007. Rice technologies for rainfed environment of Asia. In: Ballabh V, editor. Institutional alternatives and governance of agriculture. Academic Foundation, New Delhi.
Paris T, Singh A, Cueno A, Singh VN. 2008. Assessing the impact of participatory research in rice breeding of women farmers: a case study in eastern Uttar Pradesh, India. Exp. Agric. 44:97-112.
Rhani NS, et al. 2010. High yielding rice varieties of India. Directorate of Rice Research (Indian Council of Agricultural Research), Hyderabad, India.
Notes
Authors’ addresses: D. Behura and D. Naik, Orissa University of Agriculture and Technology (OUAT), Bhubaneswar, Orissa, India; A. Koshta, Department of Agroforestry, College of Agriculture, Indira Gandhi Agricultural University, Raipur, Chhattisgarh; P. Samal, Agri-cultural Economics, Central Rice Research Institute, Cuttack, Orissa; M. Malabayabas, Social Sciences Division, International Rice Research Institute, Los Baños, Philippines.

Patterns of adoption of improved rice varieties...of Chhattisgarh and Orissa 315
App
endi
x 1
. Per
cent
age
area
of m
oder
n ri
ce v
arie
ties
by
land
typ
e du
ring
kha
rif i
n C
hhat
tisg
arh
and
Ori
ssa,
200
8.
Varie
ties
Dro
ught
Subm
erge
nce
Salin
eN
onsa
line
All O
rissa
Chha
ttis
garh
Oris
saO
rissa
Oris
saO
rissa
Rai
pur
Dhe
nkan
alB
olan
gir
Jajp
urB
hadr
akK
endr
apar
aB
hadr
akK
endr
apar
a
In u
pper
fi el
ds
Par
ijat
39
100
30
Kha
ndag
iri3
94
88
847
Nav
een
30
Ana
nda
51
Kha
rvel
152
Lal
at5
0
Pat
hara
36
4
Sar
ia4
916
Mah
amay
a3
2
MTU
-101
03
9
Sw
arna
29
Tot
al10
010
010
010
010
010
0
On
med
ium
land
Jar
awa
100
0
Cha
ndan
(CR
M)
10
MTU
-10
014
35
50
11
Poo
ja13
65
9
Pra
tiksh
ya3
0
Sw
arna
614
847
73
574
531
49
Kon
ark
04
1
Lal
at4
23
319
MTU
-101
011
410
4
Cont
inue
d on
nex
t pag
e

316 D. Behura, A. Koshta, D. Naik, P. Samal, and M. Malabayabas
Appe
ndix
1 c
ontin
ued
Varie
ties
Dro
ught
Subm
erge
nce
Salin
eN
onsa
line
All O
rissa
Chha
ttis
garh
Oris
saO
rissa
Oris
saO
rissa
Rai
pur
Dhe
nkan
alB
olan
gir
Jajp
urB
hadr
akK
endr
apar
aB
hadr
akK
endr
apar
a M
aham
aya
24 S
war
na-S
ub1
91
Oth
ers
46
65
7 T
otal
100
100
100
100
100
100
100
100
100
Low
land
Kha
ndag
iri1
Lun
ishr
ee
100
0 D
urga
29
7 G
ayat
ri51
374
219
Poo
ja3
48
3 S
war
na
32
619
01
50
47 T
ulas
i 6
1 V
arsh
adha
n
51
Jaj
ati
30
Lal
at
30
MTU
-10
01
35
02
MTU
-101
0
191
23
3 R
amch
andi
3
0 S
avitr
i 9
2 U
tkal
Pra
va
61
Mah
amay
a41
0 S
ona
Mas
uri
80
Mal
aksh
mi
63
1 S
aral
a5
08
Oth
ers
44
4 T
otal
100
100
100
100
100
100
100
100
100

Patterns of adoption of improved rice varieties...of Chhattisgarh and Orissa 317
App
endi
x 2.
Per
cent
age
(%) o
f cos
t in
the
tot
al c
ost
in r
ice
prod
ucti
on d
urin
g kh
arif
usin
g M
Vs a
nd T
Vs in
Chh
atti
sgar
h an
d O
riss
a, 2
008.
Cost
sD
roug
htSu
bmer
genc
eSa
line
Non
salin
e
All O
rissa
Chha
ttis
garh
Oris
saO
rissa
Oris
saO
rissa
Rai
pur
Dhe
nkan
alB
olan
gir
Jajp
urB
hadr
akK
endr
apar
aB
hadr
akK
endr
apar
a
MV
TVM
VTV
MV
TVM
VTV
MV
TVM
VTV
MV
TVM
VTV
MV
TV
Paid
-out
cos
ts
M
ater
ial c
ost
19–
98
64
141
2–
26
–9
29
29
31–
1916
L
abor
23
–18
1419
821
18–
16–
272
216
24–
212
2
H
ired
pow
er11
–5
47
38
10–
7–
1610
89
–8
10
Tota
l pai
d-ou
t cos
ts5
3–
33
26
32
144
33
9–
49
–6
261
53
65
–4
847
Impu
ted
cost
s
M
ater
ial c
ost
10–
1313
1313
810
–3
–3
24
5–
86
L
abor
27–
40
44
43
573
43
6–
46
–3
43
441
31–
36
41
O
wne
d po
wer
11–
1417
12
1716
14–
2–
02
30
–8
6
Tota
l im
pute
d co
sts
47–
67
746
88
657
61–
51–
38
39
473
5–
52
53
Tota
l cos
ts10
0–
100
100
100
100
100
100
–10
0–
100
100
100
100
–10
010
0
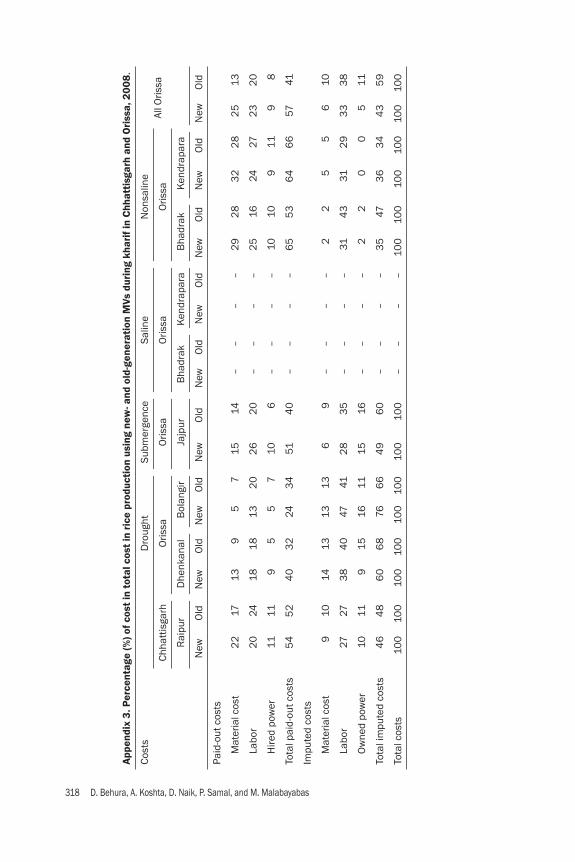
318 D. Behura, A. Koshta, D. Naik, P. Samal, and M. Malabayabas
App
endi
x 3.
Per
cent
age
(%) o
f cos
t in
tot
al c
ost
in r
ice
prod
ucti
on u
sing
new
- and
old
-gen
erat
ion
MVs
dur
ing
khar
if in
Chh
atti
sgar
h an
d O
riss
a, 2
008.
Cost
sD
roug
htSu
bmer
genc
eSa
line
Non
salin
eAl
l Oris
saCh
hatt
isga
rhO
rissa
Oris
saO
rissa
Oris
sa
Rai
pur
Dhe
nkan
alB
olan
gir
Jajp
urB
hadr
akK
endr
apar
aB
hadr
akK
endr
apar
a
New
Old
New
Old
New
Old
New
Old
New
Old
New
Old
New
Old
New
Old
New
Old
Paid
-out
cos
ts
M
ater
ial c
ost
22
1713
95
715
14–
––
–2
92
83
22
82
513
L
abor
20
2418
1813
20
26
20
––
––
25
1624
272
32
0
H
ired
pow
er11
119
55
710
6–
––
–10
109
119
8
Tota
l pai
d-ou
t cos
ts5
45
24
03
224
34
514
0–
––
–6
55
36
46
657
41
Impu
ted
cost
s
M
ater
ial c
ost
910
1413
1313
69
––
––
22
55
610
L
abor
2727
38
40
4741
28
35
––
––
314
331
29
33
38
O
wne
d po
wer
1011
915
1611
1516
––
––
22
00
511
Tota
l im
pute
d co
sts
46
48
60
68
766
64
96
0–
––
–3
547
36
34
43
59
Tota
l cos
ts10
010
010
010
010
010
010
010
0–
––
–10
010
010
010
010
010
0