patrick dunleavy the british general election of 2010 and...
TRANSCRIPT

Patrick Dunleavy The British general election of 2010 and the advent of coalition government Book section (accepted version) Original citation: Originally published in Baldini, G. and Hopkin, J., (eds.) Coalition Britain: the UK Election of 2010. (Manchester: Manchester University Press, 2012). ISBN 9780719083693 © 2012 Manchester University Press This version available at: http://eprints.lse.ac.uk/49607/ Available in LSE Research Online: February 2014 LSE has developed LSE Research Online so that users may access research output of the School. Copyright © and Moral Rights for the papers on this site are retained by the individual authors and/or other copyright owners. Users may download and/or print one copy of any article(s) in LSE Research Online to facilitate their private study or for non-commercial research. You may not engage in further distribution of the material or use it for any profit-making activities or any commercial gain. You may freely distribute the URL (http://eprints.lse.ac.uk) of the LSE Research Online website. This document is the author’s submitted version of the book section. There may be differences between this version and the published version. You are advised to consult the publisher’s version if you wish to cite from it.

1
The British general election of 2010 and the advent of coalition government *
Patrick Dunleavy In many respects the May 2010 general election in Britain seems to be one of those cases
where an election is lost, yet without any clear winner emerging. Yet it was also a contest
that led to a historic outcome, a further decline in support for the top two parties and the
advent of the first peacetime coalition government in the UK since the 1920s. I begin by
considering the shape of the basic results, and then look at how voting behaviour changed
in response to changing party strategies. Section 3 examines the operation of the electoral
system and the longer term significance of the 2010 election for long-run trends towards
multi-partism in British politics. Section 4 examines the transition to a coalition
government between the Conservatives and Liberal Democrats, lead by David Cameron
and Nick Clegg, and the basic parliamentary arithmetic and electoral situation that it
confronts. The final section considers the longer term potential for change in British politics
that have opened up from the election and its aftermath, especially for another wave of
constitutional reform.
1. The essential election outcomes
The governing Labour party under PM Gordon Brown ended thirteen years in power on a
low note, losing one in six of the votes they had gathered in the previous 2005 general
* Please cite as: Patrick Dunleavy (2012) ‘The British general election of 2010 and the advent of coalition government’. In: Baldini, Gianfranco and Hopkin, Jonathan, (eds.) Coalition Britain: the UK election of 2010. Manchester University Press, Manchester. ISBN 9780719083693 http://eprints.lse.ac.uk/49607/

2
election. Yet in the last two days of the campaign, the party rallied votes against the
prospects of Conservative cuts in public expenditure, and succeeded in coming in a clear
second. The party outperformed the final opinion polls by 2 per cent, suggesting a
hardening of the Labour vote in the last hours of the campaign. In the last two days of the
campaign a drama over public spending cuts and violent street protests in Greece played
out on the UK’s TV screens. Perhaps this helped to dramatize and underline Labour’s
argument that a Conservative government in charge of austerity measures would hurt many
different groups. Or perhaps the push by some Labour ministers for progressive voters to
vote tactically for them worked a little. Anyway Labour lost but succeeded in coming in a
clear second, in limiting their vote loss to 6 per cent compared with 2005 and in holding
many seats against the odds in their surrounding regions. Overall, the party did enough to
live to fight another day. By late autumn 2010, now in opposition, Labour was back at
level-pegging with the Conservatives in terms of opinion poll support.
The Conservatives became clearly the largest party in the 2010 election, thanks to
the operations of Britain’s famously unproportional voting system. Called plurality rule,
this historic system features local competitions in 645 small districts, in each of which the
winning party is whichever one gathers the most votes (that is, a plurality of votes, but not
necessarily or now usually a majority). In the UK’s modern multi-party conditions this
system is highly erratic, but it normally ends up awarding the largest party a strong
‘leader’s bonus’ of seats, as it did in 2010. Thus the Tories gained 48 per cent of seats in the
Commons on the basis of winning just over 36 per cent of votes. Yet David Cameron’s
party actually increased their vote share by only 4 per cent compared with the Tories losing
performance in 2005 (see Table 1). And despite their ‘unearned’ seats bonus, the
Conservatives failed to win an overall majority in the House of Commons and had to
negotiate a coalition deal to gain power. One of the party’s right wing grandees (Lord
Tebbit) noted acidly about David Cameron’s leadership that given the recession and
Gordon Brown’s unpopularity as Prime Minister, the Tories should have been 15 per cent
ahead of Labour: in fact they were 7 per cent ahead. This was not an impressive
performance, despite the party’s advances made in terms of winning seats. But the always
centrist-sounding Cameron was insulated from criticisms from his right wing because of the
haul of new MPs achieved, and the coalition government’s strong public spending cuts.

3
Table 1: The vote share results for the 2010 general election in Great Britain
Notes: EP European Parliament; GLA Greater London Assembly; LG local government councillors; SP Scottish Parliament; WNA Welsh National Assembly.
This table excludes 17 MPs elected in Northern Ireland for a completely different set of parties, specific to that province. The parties winning seats there were the Democratic Unionists (8 MPs), Sinn Fein (5 MPs, who never take their seats), the Social Democratic and Labour Party (3 MPs), Alliance (1) and an independent MP.
Many overseas observers follow the bulk of the UK media in picturing British
politics as some form of ‘two and a half’ party system. This at least half-heartedly
acknowledges the presence of the UK’s longest-running third party, the Liberal Democrats,
and of strong, nationalist fourth parties in Scotland and Wales. The chief justification for
this characterization has been that throughout the post 1945 period the Conservatives and
Labour have monopolized governing power between them, despite some periods of
minority or near-minority (tiny Commons majority) government in the mid 1960s and later
from 1974-79. Yet the 2010 election is chiefly significant as the point where this deceptive
pattern finally broke apart and the Liberal Democrats became a formal partner in a
Great Britain share of the votes % votes
Change in support (%
points) since 2005
Compare 2005 %
vote share
MPs in
2010
Other elected
institutions where the party is represented
Conservative 36.9 + 4 33 306 All institutions Labour 29.6 - 6 36 258 All institutions Liberal Democrats 23.5 + 0.4 23 57 All institutions UK Independence Party (UKIP) 3.2 + 0.9 2.3 0 EP, GLA, LG
British National Party (BNP) 1.9 + 1.2 0.7 0 EP, GLA, LG Scottish National Party (SNP) 1.7 + 0.1 1.6 6 EP, SP, LG
Greens 1.0 - 0.1 1.0 1 EP, GLA, LG Plaid Cymru (Wales only) 0.6 - 0.1 0.7 3 EP, WNA, LG Other parties/candidates 1.6 -0.1 1.7 0 - Total 100%

4
peacetime coalition government for the first time since the 1920s. The party can trace its
heritage back to the heyday of a previous Tory-Liberal two party system, which dominated
UK politics from the mid nineteenth century to 1922, and began to break up in acrimonious
Liberal splits during the First World War. Fuelled by a merger with the Social Democratic
Party (SDP), a Labour splinter party, during the 1980s, the Liberal Democrats’ return to
power was quite some comeback, and I discuss the coalition-forming process and its
reverberations for future politics below.
Yet in specific electoral terms, measured by their vote shares won or their ability to
elect MPs, 2010 was also something verging near to a disaster for the Liberal Democrats,
made all the worse by the illusory signs of success that the party racked up during the
campaign. Under their young and more right-wing leader, Nick Clegg, the Liberal
Democrats at times achieved apparent parity in opinion polls with the other two major
parties. Yet in the final vote counts they fell back to a clear third place, lost seats to the
resurgent Tories, gained only a compensating few MPs from Labour. And they completely
failed in their hopes of ‘breaking through’ to second party status, standing still in terms of
vote share. Clegg probably reaped a whirlwind that he himself sowed in some unguarded
and hubristic moments during the campaign, when he declared that he could not work with
Gordon Brown; insulted the PM as being ‘desperate’; proclaimed a ‘two-horse race’
between the Liberal Democrats and Tories, with Labour ‘out of it’; and so on. Rejecting
Labour calls for tactical voting in the last two days before polling also now looks unwise in
electoral terms (although it may have reflected Clegg’s already-settled determination to
work with Tories in a hung Parliament). Tactical voting is a quid pro quo deal – with no
quid, the Liberal Democrats lost out to a Tory-Labour squeeze in many seats that they
might otherwise have won or kept.
Denying that the UK is a multi-party system, as the press, media and many political
scientists still do, also ignores the existence of several other smaller parties in Figure 1,
with significant and growing vote shares in some forms of election. It is true that
Westminster’s highly unproportional voting system means that most of the smaller parties
have never won Commons seats, although in 2010 the Greens broke through this barrier for
the first time. Yet the smaller parties all have substantial representation elsewhere,
especially in the UK’s many proportional elections (for the European Parliament, Scottish
Parliament, Welsh National Assembly and Greater London Assembly) and in local
councils.

5
In 2010 the top-performing smaller party was the UK Independence Party, which
contested nearly 90 per cent of seats in Great Britain. Table 1 shows that it achieved the
highest fourth party score ever in post-war British politics, but its average vote share fell
slightly in its contested seats compared with 2005. UKIP’s campaign was hampered by the
members having elected as their party leader a highly obscure peer, who secured little
publicity for the party and resigned a couple of months after the election. His chief claims
to fame were admitting to a TV interviewer that he had not read his party’s whole
manifesto and was unfamiliar with its details, rather airily proposing draconian public
spending cuts of 50 per cent, and launching his party’s campaign by advising people to vote
for other parties if they felt that they could better secure the UK’s withdrawal from the
Europe Union or limit immigration (UKIP’s two central campaign issues). The anti-
immigrant, anti-foreigner and generally far right British National Party fielded candidates
in more than half of the seats (338) in Great Britain, covering nearly three times as many
seats as it did in 2005. Its national vote share increased to 2 per cent, but its vote share per
candidate fell back in the seats that it contested. Finally the Greens contested a similar
number of seats as the BNP, and showed a similar increase in candidacies. But their
national vote share fell back compared with 2005, to just over 1 per cent, and their average
vote per contested seat almost halved. However, the Greens concentrated their campaigning
resources in just two seats, and their party leader, Caroline Lucas, succeeded in winning
one of them in Brighton, to give the party its first ever MP at Westminster. In Wales the
nationalist Plaid Cymru saw its vote fall back, perhaps reflecting its being in coalition in the
Welsh Assembly government with Labour. In Scotland the SNP, running a minority
government in the Scottish Parliament, increased its vote share by 2 per cent but won no
more seats against Labour in Scotland, who staged a specific resurgence there under the
Scottish Gordon Brown.
2. How voting behaviour responded to party strategies
The analysis of mass political behaviour in the UK has not changed markedly in recent
decades. Most analysts have recognized a long-run ‘dealignment’ process in which there is
a weakening of the traditional (two-party heyday) links between the non-manual people
owning their own homes voting Conservative, and manual workers and social renters
voting Labour. A rearguard group of analysts argue that occupational class is still the most
important sociological influence on how British voters are aligned (Evans, 2000), but
6
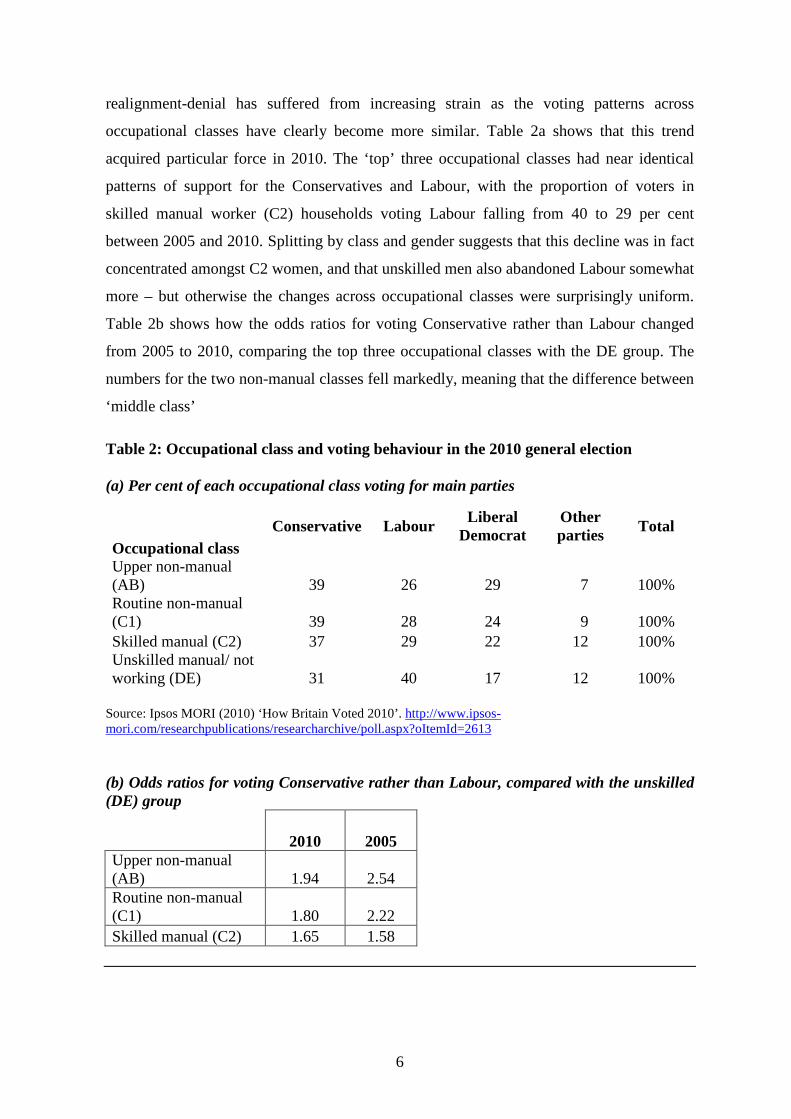
realignment-denial has suffered from increasing strain as the voting patterns across
occupational classes have clearly become more similar. Table 2a shows that this trend
acquired particular force in 2010. The ‘top’ three occupational classes had near identical
patterns of support for the Conservatives and Labour, with the proportion of voters in
skilled manual worker (C2) households voting Labour falling from 40 to 29 per cent
between 2005 and 2010. Splitting by class and gender suggests that this decline was in fact
concentrated amongst C2 women, and that unskilled men also abandoned Labour somewhat
more – but otherwise the changes across occupational classes were surprisingly uniform.
Table 2b shows how the odds ratios for voting Conservative rather than Labour changed
from 2005 to 2010, comparing the top three occupational classes with the DE group. The
numbers for the two non-manual classes fell markedly, meaning that the difference between
‘middle class’
Table 2: Occupational class and voting behaviour in the 2010 general election (a) Per cent of each occupational class voting for main parties
Occupational class Conservative Labour Liberal
Democrat Other parties Total
Upper non-manual (AB) 39 26 29 7 100% Routine non-manual (C1) 39 28 24 9 100% Skilled manual (C2) 37 29 22 12 100% Unskilled manual/ not working (DE) 31 40 17 12 100%
Source: Ipsos MORI (2010) ‘How Britain Voted 2010’. http://www.ipsos-mori.com/researchpublications/researcharchive/poll.aspx?oItemId=2613 (b) Odds ratios for voting Conservative rather than Labour, compared with the unskilled (DE) group
2010 2005 Upper non-manual (AB) 1.94 2.54 Routine non-manual (C1) 1.80 2.22 Skilled manual (C2) 1.65 1.58

7
and ‘working class’ groups clearly reduced in 2010. Checking other potential bases for
alignment in individual voting data from surveys shows no other marked changes in the
sociological or demographic influences on voting.
However, looking at voting patterns across constituencies (called ‘aggregate data
analysis’) offers additional insights, with the recession clearly having most impact on the
government’s defeat:
‘Labour particularly lost ground in seats where there were both many working class voters and there had been a large increase in unemployment; in these circumstances the drop in Labour’s vote was as much as 9.4 [per cent] points’ (Fisher et al, 2010, p.6).
These authors also show that Labour’s support stood up far better in seats with large
proportions of public sector workers, but was 4 per cent lower in constituencies with little
public employment. This is a big difference from 2005 when no such effect was visible, and
Fisher et al conclude that ‘a new political gap seems to have opened up in Britain’s
electoral geography’ (p.7). Voters’ fears about the more vigorous public spending cuts
promised by the Conservative largely explain both this effect and the hardening of Labour
support in the last few days of the campaign.
Turning to the political issues dividing the parties, the British Election Study (BES)
undertook extensive polling during the campaign period and found that economic issues
completely predominated with voters, in the aftermath of the 2008 financial crisis and
recession xxx). Three fifths of BES respondents rated an economic issue most important,
composed of 41 per cent citing ‘the economy’ as the key issue plus a further 11 per cent
citing ‘government debt’ (a strong Conservative theme in the campaign) and 7 per cent
unemployment. The second-ranked issue was immigration (chosen as most important by
one in six voters). Clearly the primacy of economic issues created difficulties for Labour as
the incumbent government, because voters especially blamed Gordon Brown for the
economic crisis – he had been at the helm economically at the Treasury for ten years until
2007, and PM since then. Yet the premier was also seen by many voters as competent
economically and the Conservative rival team as flawed, so this was less damaging than
might have been expected.
Immigration was a much more toxic issue for the government, with many working
class people resentful of the influxes of immigrants into housing stress areas of major cities
and some smaller towns like Slough, and of increased competition for low-paid jobs.
Ministers were seen as unresponsive to these concerns, although the government had

8
tightened immigration rules somewhat and could not restrict EU workers’ inward
migration. The issues flared into huge prominence when a Labour-supporting voter taxed
Gordon Brown with it, and the PM was heard calling her a ‘bigoted woman’ as he drove
away in his car with a broadcaster’s radio microphone still switched on and transmitting.
This gaffe late in the campaign put the right-wing press into a frenzy of denunciation,
demoralized the Labour campaign, put Brown on the defensive (he had to apologize in a
humiliating way), and seemed to crystallize ministers’ indifference to what their working
class voters were saying. But the affair seemed to change relatively few voters’ minds about
how they eventually voted.
Labour’s biggest issue, the National Health Service, on which the party had lavished
billions of pounds of extra public spending, was rated top by only one voter in twelve,
partly because David Cameron succeeded in making credible the Tories’ pledge to exempt
NHS spending from looming public expenditure cutbacks. Other issues, such as the war in
Afghanistan, terrorism and environmental concerns were rated unimportant by many voters
and played little role in the campaign. Having withdrawn British troops from Iraq, the
Brown government did successfully attract back some more votes for Labour amongst
Muslim voters in major cities, support which the party lost under Tony Blair in 2005.
Many British political scientists traditionally invoked the controversial concept of
‘party identification’ (constructed from survey responses about ‘feeling closer’ to one party
or another) in order to explain voters’ alignments. Yet the BES study in 2010 found
absolutely no change at all in the distribution of these responses compared with 2005, so
presumably this mysterious construct played no part in the big electoral changes between
the two contests. More recently this line of analysis has been changed into an emphasis
upon ‘valence issues’, including voters’ perceptions of efficacy and ratings of leadership or
‘performance politics’ (Clarke et al, 2009). The 2010 general election provides a perfect
setting for evaluating the significance of such factors, since for the first time in the UK it
was marked by three televised leadership debates between the top three party leaders,
Gordon Brown, David Cameron and Nick Clegg.
These debates attracted saturation media attention before, during and after each
occasion, and they were seen by large proportions of voters (three fifths for the first, half
for the last, and two fifths for the middle one, which covered foreign policy and defence
issues of less interest to most voters). Seven out of ten voters thought that Nick Clegg won
the first debate, sparking a huge increase in Liberal Democrat support, with many polls

9
putting them around 30 per cent support for the next two weeks. But the party’s support fell
back a little after that, as the right wing press conducted their own highly biased version of
‘due diligence’ on its liberal policies on immigration. David Cameron was seen as winning
the last leader’s debate by around half of voters. Gordon Brown was seen as coming last in
all three debates, but did not do disastrously badly in any of them, contrary to his general
media persona.
And in the end, the debates’ influence on actual votes proved to be highly
ephemeral. The Clegg/Liberal Democrat campaign bubble burst with no visible trace of any
impact on the party’s pre-campaign levels of support, although it may have helped them to
survive even more of a Conservative-Labour squeeze effect (evidenced under previous
unpopular Labour administrations). Cameron did not seem able to win over more voters
than he had before, nor to convince those doubting the Tories’ competence to give him the
benefit of the doubt. So the evidence seems to be that ‘valence’ issues made apparent
differences at the campaign level, but not enough to influence how voters cast their ballots
against their evaluations of what the parties’ programmes (especially on the economy)
meant for their interests.
3. The electoral system and the UK’s transition to multi-party politics
As late as 1970, nine out of ten voters across the whole of the UK supported one of the top
two parties (the Conservatives or Labour), and the salience of voting for any other party
was low. As early as the February 1974 election this situation changed rapidly, with two-
party support falling to three quarters of voters, as Figure 1 demonstrates. Since 1992 a
slower but steadier further decline of the top two parties’ combined support has brought it
in 2010 to less than two thirds of all voters (65 per cent). As early as the two 1974
elections, the Liberals alone gained almost a fifth of votes, and in 1983 in alliance with the
Social Democrats nearly a quarter, a high water mark which they have sometimes come
close to again, but which they have yet to improve upon. Meanwhile the total support for
smaller fourth, fifth and subsequent parties started off at less than 2 per cent of the UK
totals in 1970 (some of it in Northern Ireland), but ended the sequence in 2010 at 12 per
cent. It is worth emphasizing how much of a transition in voting behaviour this was by
calculating the two-party lead over all other parties, which the numbers in Figure 1 show
started off at 80 per cent but has now fallen to 30 per cent, especially steeply and
consistently in the period since 1992.

10
Another way of capturing this transition is to compute the ‘effective number of
parties’ (ENP) score. This measure has some considerable problems of interpretation
(Dunleavy and Boucek, 2003), but it is simple to calculate and widely known. Figure 2
shows the ENP scores for all major elections in Great Britain since 1992, with the red bars
being plurality rule general elections for the House of Commons. The green bars are
various forms of proportional representation (PR), used in the UK for several other kinds of
Figure 1: Trends in the vote shares for the top two parties and for smaller
parties, 1970 to 2010
Note: The numbers in grey area here show the combined Conservative and Labour per cent support, minus the combined support for the Liberal Democrats and all other parties, that is the ‘two party lead over the Rest’. elections, including voting for MEPs to sit in the European Parliament (using a list PR
system since 1999) and for the Scottish Parliament, the Welsh National Assembly and the
Greater London Assembly (all using British variants of the ‘additional member system’ (or
AMS)) (Dunleavy and Margetts, 2001). It can be seen that all the general election ENP
scores are always much smaller than those for PR elections. This is chiefly because voters
know that in general elections the scales are stacked towards the bigger parties winning
seats and the smaller parties being ineffective. This bias is still there in Britain’s PR
80 79
50 5062
4046
53 48 4535 30
0
10
20
30
40
50
60
70
80
90
100
1966 1970 1974FEB
1974OCT
1979 1983 1987 1992 1997 2001 2005 2010
Two party (Con plus Lab) Two party lead over Rest Liberal Democrats All other parties

11
electoral systems, but it is much less obvious and severe, so encouraging voters to support a
wider range of parties more in line with their views.
The differences between PR and plurality rule elections can be seen vividly in the
year 2009-10. In the June 2009 European Parliament elections the PR system plus a surge
of support for UKIP and the BNP (repeating almost exactly a 2004 surge) pushed the ENP
score for Great Britain as a whole to 6.3 parties, while only eleven months later at the
general election the effective number of parties fell to only 3.6. Yet the May 2010 result is a
long way from the plurality rule starting position in Figure 2, with the Westminster ENP
scores going from 2.2 in 1992, to 3.1 and 2.6 in 1997 and 2001, and then to 3.4 in 2005.
Some political scientists dismiss the green bars in Figure 2 as data only from lower turnout,
‘second order elections’ of lesser importance. But there is no substantive basis for such a
value-laden attitude, and the green-bar elections have key implications for party
performance in general elections, as 2005 rather strongly demonstrates. Another way of
looking at this is that the electoral system ‘reduced’ the number of parties by 31 per cent
when moving from the electorate’s vote shares, to the parties’ seats shares in the Commons.
In addition to suppressing voting for smaller parties that are highly unlikely to win
seats, the plurality rule electoral system of course takes the excluded parties’ seat share
nationally and awards it to others, normally to either the Conservatives or Labour.
Whichever of the two is ahead characteristically gets a large ‘leaders’ bonus’ in terms of
winning seats that they are not entitled to in terms of their national vote shares. Figure 3
shows the combined effect of these processes in distorting the House of Commons away
from the breakdown of voters’ preferences countrywide. I show here the ‘deviation from
proportionality’ (DV) score, which can be construed as the proportion of all MPs whose
party is not justified in holding these seats in terms of the party’s national vote share. In
2010 Figure 3 shows that the DV score reached 23 per cent. This is a very high number
indeed, for example, it is more than three times greater than the DV score for plurality rule
in the USA, which is typically only around 7 per cent. Figure 3 also shows that all DV
scores are much greater in general election than in the UK’s PR elections – where in the
latest round of elections in Scotland, Europe and London DV scores were half or less than
those in general elections. (This is not true of Wales, where there are too few ‘top up’
members to make the additional members system for the Welsh National Assembly

12
Figure 2: The effective number of parties in terms of votes at major elections in Great Britain, 1992 to 2010 elections work proportionately there. This feature was designed in by the Labour
government in the devolution settlement, in a bid to artificially maintain its historic party
hegemony there).
Advocates of electoral reform (and that included all parties at the 2010 general
election, except the Conservatives) generally argue that having a high deviation from
Practicable minimum score for any voting system is around 1.5 parties
2.21
3.1
2.6
3.4
3.6
3.3
3
4.3
4.7
4.2
3
5.8
5.1
4.7
4.6
4.6
6.3
0 1 2 3 4 5 6 7
1992
1997
1999 Scotland
1999 Wales
1999 Europe
2000 London
2001
2003 Scotland
2003 Wales
2004 London
2004 Europe
2005
2007 Scotland
2007 Wales
2008 London
2009 Europe
2010
Effective number of parties
Plurality election PR election

13
Figure 3: Deviation from proportionality scores at major elections in Great Britain, 1992 to 2010 proportionality is bad for electoral legitimacy, because voters know that their preferences
are chewed up and served back to them only in a distorted fashion by the plurality rule
voting system. Defenders of the status quo argue that plurality rule has two key virtues: it
forms a strong link between a majority of local opinion and their MP; and nationally it
produces ‘clear’ electoral outcomes where a ‘swing of the pendulum’ allows voters to
choose between two credible single-party governments that give clear and unambiguous
lines of electoral accountability. I look at the 2010 outcome of a hung Parliament and a
coalition government in the next section, but turn here to the arguments about strong links
between MPs and their constituencies.
Practicable minimum score for any votingsystem is around 4%
17.4
21
22.4
20.7
22.7
10.3
10.6
13.9
14.8
12.1
14.1
14.8
13.7
10.2
17.7
8.1
11.7
0 5 10 15 20 25
1992
1997
1999 Scotland
1999 Wales
1999 Europe
2000 London
2001
2003 Scotland
2003 Wales
2004 London
2004 Europe
2005
2007 Scotland
2007 Wales
2008 London
2009 Europe
2010
Deviation from proportionality scorePlurality election PR election

14
Figure 4 shows all the constituency outcomes in the 2010 general election, with
each black blob representing a single constituency outcome. The bottom axis shows the
Conservative vote share minus the Labour vote share in each local area. So the further from
the centre a constituency is to the right, the greater the Tory lead. And the more a
constituency is on the left of the centre-line, the more solidly Labour it is. The vertical axis
here shows the combined share of votes going to all other parties, which we have seen in
2010 included the Liberal Democrats, UKIP, the BNP, the Greens, the nationalist parties in
Scotland and Wales, and all other candidates. All feasible outcomes must lie inside the
overall double-triangle shape outlined in the green borders here. There cannot be any
outcomes outside this overall area.
The shaded blue and pink triangles inside the overall feasible space in Figure 4
allow us to see immediately what proportion of MPs are from the top two parties and draw
on local majority support in their constituencies. Every black blob in the blue-shaded area is
a Tory MP with local majority backing, and similarly Labour MPs with local majority
support fall inside the pink-shaded triangle. (The orange shaded area is only a rough guess
at indicating the zone where Liberal Democrats, or the nationalists in Scotland and Wales,
have some chance of enjoying majority support. It is set higher at a 60 per cent ‘other’ vote
Figure 4: The constituency outcomes in the 2010 general election, in Great Britain
0
10
20
30
40
50
60
70
80
90
100
-100 -90 -80 -70 -60 -50 -40 -30 -20 -10 0 10 20 30 40 50 60 70 80 90 100
Conservative lead over Labour in each local seat (%)
Tota
l vot
e sh
are
for a
ll ot
her p
artie
s in
eac
h se
at (%
)
Labour MPs witha local majority
Conservative MPs with a local majority
Other MPs with a local majority

15
to allow for the fact that the ‘other’ vote splits across several parties). The constituencies
where MPs lacked majority support are the black blobs on a white background – there are
only a few tens of constituencies, out of 650 seats in all.
Two-party contests completely disappeared in Britain in the 2005 general election,
and in 2010 there were also very few constituencies with only three parties contesting the
seat. Figure 4 shows that right across the country support for parties other than the
Conservatives and Labour is rarely less than a fifth of total votes, with exceptions occurring
in only a few handfuls of seats. As a result the whole set of black blobs showing
constituency outcomes is located pretty much in the middle of the triangle, and a long way
from the bottom axis – where Duverger’s famous ‘law’ says that a plurality rule system
should be. Instead, across the whole bottom third of the feasible area there are only a
scattering of seats with total ‘other party’ votes below 20 per cent. Although the core band
of seats is a long way up the chart, though, it still shows a marked Conservative versus
Labour patterning – albeit at highish levels of voting for third, fourth and subsequent
parties.
Above all the advent of a hung Parliament and the coalition government reflects the
fact that the Liberal Democrats, SNP, Plaid Cymru and other parties now regularly win
around 90 constituencies out of the 628 in Great Britain. This is shown mainly by the
‘curling over’ of seats on the sides of the distribution and extending in an upper swathe
across the middle of the diagram. Where the total ‘other party’ vote is above 33 per cent,
many seats are still won by the Conservatives or Labour, because remember that the ‘other’
vote is split across several different parties. But the higher up on the chart that blobs occur,
generally the less likely these seats are to be held by one of the top two parties.
To get an idea of how much change the 2010 results represents, suppose we flip
back to the 1955 general election, a low point for Liberal party support and the heyday of
the two-party Conservative-Labour system, shown in Figure 5 below. It is immediately
apparent that it looks nothing like the 2010 result. In the vast majority of the 1955
constituencies there were no other candidates except the Conservatives and Labour. Hence
in all those hundreds and hundreds of seats the outcome lies on the bottom axis itself –
where seat after seat lies piled on top of each other, so many that the chart cannot possibly
show them all. There were just 110 seats where the demoralized Liberals still put up
candidates in 1955, and a few others. Here the votes for ‘other parties’ vote still held up -
these are the scatter of blobs above the bottom axis, mostly concentrated in Conservative

16
areas. However, even in these cases almost all the Conservative and Labour MPs were
elected in local areas where they enjoyed local majority support, so that even these seats
mostly fell inside the pink or blue shaded triangles in Figure 5. Only around 40 seats are
located against the white background signifying that the MP elected there did not have local
majority support. The contrast between Figures 4 and 5 shows how far the argument that
the British voting system secures local accountability has degenerated, chiefly under the
contemporary pressures of rising multi-partism amongst voters.
A final aspect of how the modern British system works in practice is the creation of
what the 1999 Jenkins Commission on voting reform called ‘electoral deserts’ for the top
two parties at the regional level, an effect shown in Figure 6. The same diagram discussed
above is used to show four contrasting regional political systems. In the top row, the south-
east region reverted sharply to the Conservatives in 2010, so that Labour lost all but a
handful the seats that it had held there since 1997 (Diamond and Radice, 2010). In the
north-west, however, Labour MPs fought tenaciously and the party hung on to the bulk of
its seats. In the bottom row of Figure 6, the Scottish system was orientated as a battle
between Labour and the SNP (or the Liberal Democrats in some specific areas), while the
Conservative party had little impact still. In Wales, however, Plaid Cymru, the Liberal
Democrats and the Conservatives are all contenders in the middle, north and southern
suburban areas, with Labour holding its south Wales valley and industrial bastions.
Figure 5: The constituency outcomes in the 1955 general election, in Great Britain
0
10
20
30
40
50
60
70
80
90
100
-100 -90 -80 -70 -60 -50 -40 -30 -20 -10 0 10 20 30 40 50 60 70 80 90 100
Conservatives lead over Labour in each local seat (%)
Tota
l vot
e sh
are
for a
ll ot
her p
artie
s (%
)
Conservative MPs with a local majority
Labour MPs witha local majority
Other MPs with a local majority

17
Figure 6: The patterns of constituency outcomes across four different regions in 2010
0
10
20
30
40
50
60
70
80
90
100
-100 -90 -80 -70 -60 -50 -40 -30 -20 -10 0 10 20 30 40 50 60 70 80 90 100
Conservative lead over Labour in each local seat (%)
on
serv
ativ
e le
ad o
ver
Lab
ou
r in
eac
h lo
cal s
eat
(%)
Conservative MPs with a local majority
Labour MPs witha local majority
0
10
20
30
40
50
60
70
80
90
100
-100 -90 -80 -70 -60 -50 -40 -30 -20 -10 0 10 20 30 40 50 60 70 80 90 100
Conservative MPs with a local majority
Labour MPs witha local majority
0
10
20
30
40
50
60
70
80
90
100
-100 -90 -80 -70 -60 -50 -40 -30 -20 -10 0 10 20 30 40 50 60 70 80 90 100
Conservative MPs with a local majority
Labour MPs witha local majority
0
10
20
30
40
50
60
70
80
90
100
-100 -90 -80 -70 -60 -50 -40 -30 -20 -10 0 10 20 30 40 50 60 70 80 90 100
Conservative MPs with a local majority
Labour MPs witha local majority
South-east North-west
ScotlandWales

18
3. After the election, the advent of coalition government
The last solid argument of plurality rule defenders has generally been that the system
produces clear outcomes, so that the alleged ‘complexities’, ‘delays’, ‘deals’ and
‘bargaining in ‘smoke-filled rooms’ associated with European-style coalition government
formation can be avoided. Yet in 2010 with 641 MPs (excluding the 5 Sinn Fein MPs who
never take their seats, and so do not vote), the election result was a hung Parliament. Here
Table 3 shows that there were only six possible results in terms of forming a government:
Table 3: Feasible governments that could have formed in May 2010
Possible government Parties involved (number of MPs) Overall seats (majority)
1. Two-way coalition government with a majority
Conservatives (306) + Liberal Democrats (57)
363 (majority: 85)
2. Two-way coalition government with no majority
Labour (258) + Liberal Democrats (57) 315 (short by 6 seats)
3. Single-party minority government
Conservatives only (306) 306 (short by17 seats)
3. Multi-way coalition government with bare majority
Labour (258) + Liberal Democrats (57) + SNP (6) + Plaid Cymru (3) + SDLP (3)
327 (majority: 13)
5. Two-way minority government
Conservatives + Democratic Unionists (8)
314 (short by 9 seats)
Here the only possible governments that were actually subject to serious negotiation
were the top three, because they all involved only one or two parties being in government,
with minority government (option 3) being what would happen if negotiations failed (the
‘reversionary’ position). The possibility of larger, multi-way coalitions was generally
discounted by the leaders of all the three major parties, because a complex government
relying on multiple parties for support could quickly collapse. In addition, the parties from
Great Britain were very wary of becoming dependent upon any of the Northern Ireland
parties for support – given the history of sectarian-influenced politics in that province.
Amongst options 1, 2 and 3 a Tory minority government was possible (this is what
happened in February 1974, and again in 1977-79). But it would almost certainly have
meant another general election within a year or at most two, a timing that the PM would not
necessarily be able to control. It was also an unattractive basis for dealing with the public
spending cutbacks made necessary by the UK’s ballooning budget deficit and huge
borrowing to counteract the financial crisis and subsequent recession.

19
For David Cameron’s Conservatives, a coalition deal with the Liberal Democrats
seemed to offer the prospect of a five-year government with a secure majority. Meanwhile
the Liberal Democrats had effectively only a choice of joining the same majority coalition
or of forming a minority government with Labour, requiring that Gordon Brown resign and
a new Labour leader be elected. Even then a Lab-Lib government would have had no
majority and would have had to negotiate every piece of its legislation with nationalist MPs
and some Northern Ireland MPs to secure its passage. Since Nick Clegg was himself
temperamentally on the right wing of the Liberal Democrats (with many free market as well
as social liberal values), and since he had openly disparaged a failing Gordon Brown in the
election campaign, it was predictable from early on in the negotiations that he would accept
David Cameron’s offer and reject Labour’s.
Political scientists have also developed a way of estimating what share of power
each party has in this situation in terms of its comprehensive coalitional potential (or C-
score for short). (If you’re already an expert, I am using here a ‘power’ index called the
‘normalized Banzahf score’, on which see Taylor, 1995, Ch.4). Essentially this approach
looks at every conceivable way in which a majority coalition could come about, and then
works out how many times each party’s joining or leaving is critical for retaining a
majority. For each party their C-score is given by number of times they are vital to winning,
divided by the total number of possible coalitions. Thus we get a share of all ‘power as
coalitional potential’ that goes to each party.
We can use this approach to analyse the distribution of power in the House of
Commons before and after the formation of the coalition government. The ‘before’
situation is shown in Table 4 below. The fourth column here shows that although the Tories
had over 47 per cent of MPs, they actually had only 37 per cent of the overall coalitional
potential. It also shows that although Labour had five times as many MPs as the Liberal
Democrats, on this basis the two parties’ coalitional power was exactly the same, at just
under a quarter each. The smaller parties all had smaller C-scores, but these were in each
case several times bigger than their shares of MPs. The fifth column in Table 4 shows the
party’s total coalitional potential share divided by the number of its MPs, to give the
average ‘power’ weight of each MP. It can be seen that this is lower for Labour. (In fact the
second largest bloc almost invariably comes off worst on C-scores). This measure also

20
Table 4: Before the coalition – the coalitional potential and power scores for all parties in the House of Commons with separate Conservative and Liberal Democrats
Party MPs
Resource weight: % of all (voting)
MPs
C-score: % share of coalitional
potential score (normalized
Banzahf index)
C-score per MP
ratio
P-score: % share of power
P-score per MP
ratio
Conservative 307 47.6 36.7 0.77 42.1 0.89 Labour 258 40.0 22.0 0.55 31.0 0.78 Liberal Democrat 57 8.8 22.0 2.49 15.4 1.75 Democratic Unionist Party (NI)
8 1.2 7.3 5.92 4.3 3.46
Scottish National Party 6 0.9 5.5 5.92 3.2 3.46
Plaid Cymru 3 0.5 1.8 3.95 1.2 2.47 Social Democratic & Labour Party (NI)
3 0.5 1.8 3.95 1.2 2.47
Green 1 0.2 0.9 5.92 0.5 3.46 Alliance Party (NI) 1 0.2 0.9 5.92 0.5 3.46
Others 1 0.2 0.9 5.92 0.5 3.46 Total 645 100 % 100 % 100 %
Note: With separate Conservative and Liberal Democrat parties, there are a total of ten blocs in this situation.
suggests that before the coalitional deal was done the Liberal Democrats MPs were
individually each three times more influential over the coalitional outcome than were the
Tory MPs.
Of course, a great many critics in political science argue that comprehensive
coalitional potential scores are not good indicators of a broader concept of political power.
C-scores are completely situational and locked into the present – they do not take any
account of the past or future of the parties making deals. And small changes in the numbers
of blocs (e.g. some backbench dissenters from any of the main parties) can make
exaggerated differences to C-scores. Above all coalitional potential scores do not work very
well in predicting what will happen empirically. In Table 4, Labour and the Liberal
Democrats are assigned the same C-score – so if a Lab-Lib cabinet were to form this seems

21
to predict that it would include equal numbers of ministers for both parties, which of course
would greatly overstate Liberal Democrat influence. Empirically we might have expected
that in a minority government coalition between the two parties Labour would get the large
majority of cabinet seats and the Liberal Democrats a minority (perhaps 5 or 6 posts out of
a cabinet of 23).
To cope with such problems the last two columns in Table 4 (shaded yellow) show
an extended conception of parties’ power scores (the P-score), introduced here for the first
time. This is essentially an average of each party’s C-score plus their resource weight (in
this case their percentage share of all MPs). The logic of this measure is twofold. First,
resources are built up over time. A party’s representation in Parliament, for instance, is
normally added to or lost only partly at any given general election. And the party’s
influence with the media, public opinion, the government apparatus and interest groups
reflect how many seats it holds now (which bears on how much it can influence legislation)
- but also how much the party might hold in the future, given its historical record and the
prospects at the next general election. So averaging coalitional potential in the present with
parties’ resources in Parliament (i.e. their percentage shares of all MPs) gives a much better
guide to real, empirical power.
A second reason to prefer P scores is that the C-score assigns all power to a majority
government as soon as it has 51 per cent of MPs, and zero power to the opposition, which is
clearly completely unrealistic. By contrast, the reformulated power in the last two columns
of Table 4 score only gives a ‘total power to the government’ reading if the top party
controls all seats in the Commons. So long as the opposition parties have MPs, in the
P_score they also have a share of power – and this share is greater the closer the opposition
is to matching the government lobbies. Again the P-score is far better than just looking at
comprehensive coalitional potential, because parties’ resource weights reflect their longer-
term power, while the coalitional potential index taken on its own is very immediate and
short-term.
Looking at the ‘before’ coalition situation in Table 4, the P (real power) score shows
that again the Tories fell short of a winning position, but it places the Labour party as
having twice as much power in the hung Parliament as the Liberal Democrats. It also marks
down the influence of the smaller parties compared to the C score. However, in terms of P-
score per MP they still do well, as do the Liberal Democrats at the expense of the two
largest parties’ MPs. These power readings are also still the ones that will apply on issues

22
handled via free votes during the 2010-15 Parliament, especially certain issues that were
exempted from the coalition agreement between the Conservatives and Liberal Democrats.
To see what changes occur after the Conservative-Liberal Democrat coalition is
formed, Table 5 recalculates the C-scores and P-scores on the basis that these two parties
now operate as a single bloc in the House of Commons. Power and influence scores are
highly sensitive to blocs coalescing with each other, and hence to reductions in the total
number of blocs that are competing with each other. So when the largest and the third-
largest blocs (i.e. the Conservatives and the Liberal Democrats) coalesce into one bloc for
most voting purposes, thus reducing the total number of blocs to nine, we can expect to see
big changes. And in this ‘after coalition’ picture, everything has indeed changed in a
dramatic way.
The comprehensive coalition potential scores now assigns all power completely to
the coalition government with a score of 100 per cent, and gives zero per cent to all the
opposition parties, making not the slightest differentiation between them. Essentially, the
score is just saying ‘I give up’ at this point, because the combined Conservative and Liberal
Democrats MPs do not need to coalesce with anyone else in order to win. But my revised
power score keeps on working fine here, because we can still average the coalitional
potential of a winning bloc and its resource weight. (We can in principle average it in many
different, weighted ways: but for simplicity here I assume that we just take the mean of the
two scores). On this basis, the Cameron-Clegg government has more than three quarters of
the total power in Parliament, with Labour a long way behind on a fifth, and the small
parties sharing less than 2 per cent of power between them.
When the coalition first formed, many media commentators waxed lyrical about the
disruptive potential of an ‘awkward squad’ of MPs on the Conservative right. But in
ideological terms the Tory right are highly unlikely to vote with the opposition Labour
party on many issues, so that the most Tory dissidents can do is to abstain. The maths of the
situation show that a massive 84 out of the 307 Tory MPs will need to abstain before the
government could lose a single Commons vote – which seems highly unlikely to happen.
And even at this stage, the government would be the largest actor, and its power score

23
Table 5: After the coalition – the coalitional potential and power scores for all parties in the House of Commons with the Conservative and Liberal Democrats treated as a single bloc
Party MPs
Resource weight: % of all (voting)
MPs
C-score: % share of coalitional
potential score (normalized
Banzahf index)
C-score per MP
ratio
P-score: % share of power
P-score per MP
ratio
Conservative-Liberal Democrat government
364 56.4 100 1.77 78.2 1.39
Labour 258 40.0 0 0 20.0 0.50 Democratic Unionist Party (NI)
8 1.2 0 0 0.6 0.50
Scottish National Party 6 0.9 0 0 0.5 0.50
Plaid Cymru 3 0.5 0 0 0.2 0.50 Social Democratic & Labour Party (NI)
3 0.5 0 0 0.2 0.50
Green 1 0.2 0 0 0.1 0.50 Alliance Party (NI) 1 0.2 0 0 0.1 0.50
Others 1 0.2 0 0 0.1 0.50 Total 645 100% 100% 100%
would not be dented greatly. Not until the government faced 100 abstainers would its power
score fall below half.
We can use the same approach to assess the possibilities of rebellion from MPs on
the left of the Liberal Democrats, who may feel pressured by party members anguished by
the loss of the party’s centre-left credentials, and be unconvinced of the need for the
massive public spending cuts that quickly became coalition policy. These dissenters could
easily vote with Labour in ideological terms, thereby swelling the opposition ranks as well
as depleting government support. But it would require 42 of them before the government
would be at all imperilled – that is, nearly three quarters of the Liberal Democrats MPs
before losing any vote. Finally the government can probably rely on the eight votes of the
Democratic Unionist Party from Northern Ireland most of the time, so that its insulation
from defeat is even greater than I have allowed above.

24
In other words, the Cameron-Clegg coalition looks remarkably strong in
Parliamentary power terms. And in the period since its formation to the time of writing it
has proved remarkably cohesive and coherent in its various stances, with Conservative and
Liberal Democrat ministers working well together. At this point, it seems certain to go
whatever distance the two leaders and two sets of Cabinet ministers want it to go, busting
many paradigms in our thinking about British politics. Indeed it seems that single-party
government is not at all needed for cohesive government, but that it is rather the product of
a particular elite political culture, one that the Liberal Democrats’ MPs share as much as the
elites running the Conservative and Labour parties. The formal agreement between the
Conservatives and Liberal Democrats says that the government will last a full
Parliamentary term of five years - and ministers will probably need that long to make the
austerity cuts, weather unpopular times, and come out on the other side. This suggests that
the next UK general election will be either May 2014 or May 2015 - unless the coalition
unravels in some spectacular fashion through internal splits before then.
The Labour party tried hard to form coalition number 2 in Table 3 with the Liberal
Democrats. But having been rejected, Labour moved swiftly to reconstruct its leadership.
Gordon Brown announced his retirement as party leader almost as soon as the election
results were clear, triggering a leadership election which Ed Milband narrowly won over
his older and more experienced brother, David Miliband. Under its new leader, Labour may
have to prepare for a long and frustrating opposition. If the coalition is still in being, a 2014
or 2015 election under anything less than a fully proportional electoral system (that is,
under first past the post or the alternative vote (AV)) could easily spell a new electoral
disaster for Labour, suggesting that the party needs to adjust its mindset to begin to
compete effectively.
4. Longer term changes and voting reform
Three central elements of the coalition agreement between the Liberal Democrats and the
Conservatives concerned constitutional reform. The parties first agreed to hold a
referendum in May 2011 on changing the voting system at Westminster to the alternative
vote (AV) system as used in Australia. This compromise proposal (also proposed by
Labour in its 2010 manifesto) would keep the UK’s local constituencies but allow voters in
each area to number their preferences across parties in order (1, 2, 3 etc), instead of just
marking an X for their top preference (Travers et al, 2010). All the first (top) preferences
25
that voters have given are counted, as now. If any candidate gets majority support (i.e. 50%
+1), they immediately win the seat. If not, the candidate who has the fewest first preference
votes is knocked out of the contest, and we look at the second preferences of this party’s
voters, redistributing these votes to the remaining candidates in the race, in line with these
voters’ number 2 choice. This process of knocking out the least popular candidate and
redistributing their voters’ choices as voters intended continues until one candidate gets 50
per cent. In the USA this system is called ‘instant run-off’ and this is a good summary of
what AV does – it delivers a run-off election when no one gets an outright majority on first
preference votes.
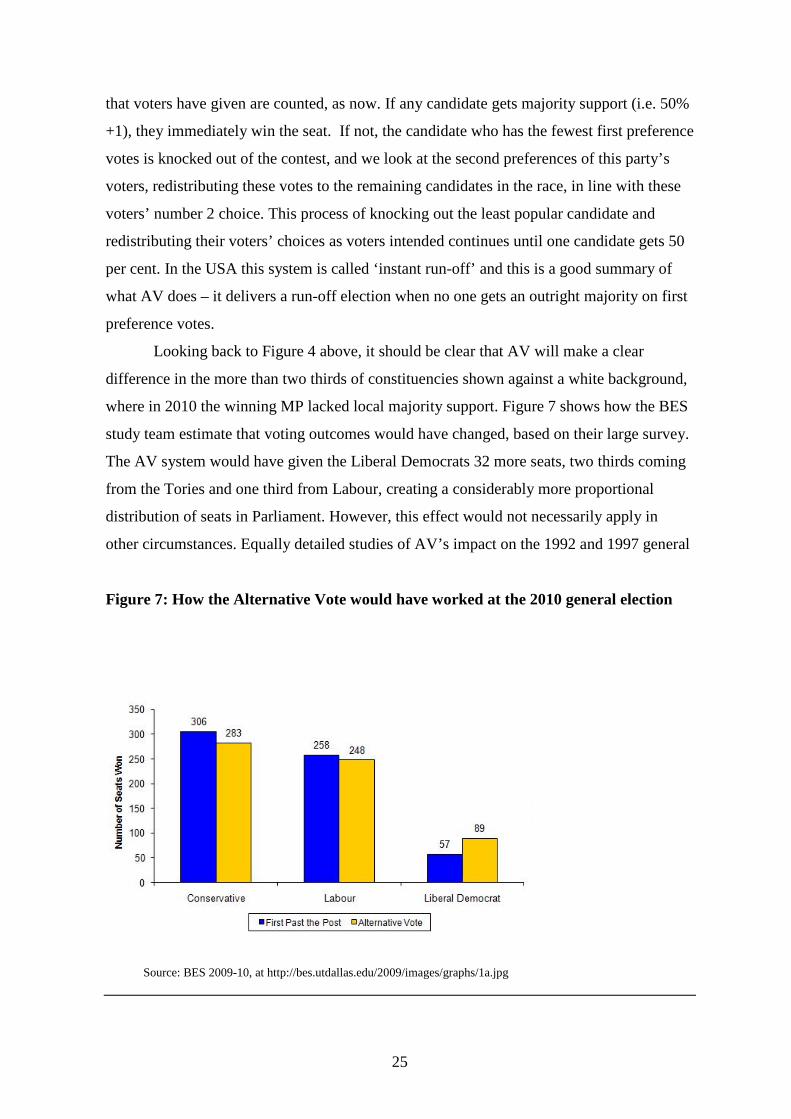
Looking back to Figure 4 above, it should be clear that AV will make a clear
difference in the more than two thirds of constituencies shown against a white background,
where in 2010 the winning MP lacked local majority support. Figure 7 shows how the BES
study team estimate that voting outcomes would have changed, based on their large survey.
The AV system would have given the Liberal Democrats 32 more seats, two thirds coming
from the Tories and one third from Labour, creating a considerably more proportional
distribution of seats in Parliament. However, this effect would not necessarily apply in
other circumstances. Equally detailed studies of AV’s impact on the 1992 and 1997 general
Figure 7: How the Alternative Vote would have worked at the 2010 general election
Source: BES 2009-10, at http://bes.utdallas.edu/2009/images/graphs/1a.jpg

26
election results, show that at this time the Liberal Democrats would have gained 15 to 20
more seats. But in 1997, when Labour was in the ascendant, Blair’s party would also have
benefited, creating an even greater under-representation of Tory MPs than in fact occurred
in that year. In other words, the impact of AV is rather volatile, depending on the fine
distribution of opinion. For example, in a 2014 or 2015 election if the Conservatives and
Liberal Democrats are still in coalition or have any kind of electoral pact, then AV could be
very damaging for Labour.
Whether the alternative vote will be accepted by voters in the 2011 referendum still
seems highly uncertain at the time of writing. The Conservatives agreed to holding the
referendum only, but are free to campaign strongly against any change, and they are
overwhelmingly likely to do so. Many ‘old style’ Labour MPs will join the Tories in
opposing any changes in Westminster voting at all. The remaining Labour elements may be
tempted not to campaign too strongly or uniformly for any change, in the hope that if the
referendum is lost this will increase the strain between the two coalition parties. And for the
Liberal Democrat activists, AV is anyway only a pale shadow of the PR system that they
have long campaigned for, which is the single transferable vote (STV) system already used
in Northern Ireland and in Scottish local government.
The second key constitutional reform element of the coalition agreement concerned
changing how Westminster seats are allocated across the country. The Conservatives wrote
into the coalition agreement that the House of Commons must be reduced in size to 600
MPs, and that these seats must be rigorously designed so as to have the same average size,
plus or minus 5 per cent. Constituency redrawing must occur every five years in response to
population changes and the previous long-winded boundary review inquiries are to be
abolished. These changes will not be easily implementable (Baston, 2011; Johnston, 2011).
They will clearly tend to reduce Labour’s advantage in recent elections, and the party
accordingly opposed the bitterly the changes, especially in the House of Lords where a
filibuster almost prevented the law passing in time for a referendum take place in May
2011. However, some analyses suggest that it is in fact the Liberal Democrats who may
lose most seats from the changes, because reducing seats numbers is disruptive for their
MPs holding ‘isolated’ seats (Baston, 2010).
The third constitutional element of the coalition agreement was reform of the House
of Lords to make it a wholly or mainly elected chamber, the Conservatives favouring only
80 per cent elected members and the Liberal Democrats tending towards universal election.

27
The government will outline proposals for changes in early 2011, and they are likely to
include using a proportional representation voting system of some kind, opening up new
opportunities for the Liberal Democrats and smaller parties to perhaps win enhanced
representation at Westminster. What yet remains uncertain is whether there is any realistic
prospect of the government giving sufficient priority to Lords reform to enact these changes
before the end of its term in office. Before the general election David Cameron described
Lords reform as ‘third term priority’, i.e. a long way down his list of priorities.
Conclusions
Whatever the outcomes of the AV referendum and Lords reform, it seems likely that Britain
will continue to develop electorally towards essentially a European-style multi-party
system. The Tories and Liberal Democrats hope to weather the political storm anticipated
around public spending reductions and emerge in 2014 with a renascent economy and a
case for re-election. By autumn 2010 the Liberal Democrats were already suffering a crisis
of support, with only around half their general election support in some opinion polls,
locking them ever more tightly into depending upon the coalition, whilst the Conservatives
were so far little affected. In mid-term elections at least, it is likely that momentum will
swing towards Labour for a time as the spending cuts bite. But other smaller parties are also
likely to revive if economic conditions worsen, especially the far-right UKIP and BNP,
while the Greens political presence might also grow.
The lasting impact of the 2010 election is likely to be that it made explicit in
governmental terms a series of trends towards greater political diversity which I hope to
have shown are deep-rooted in the British society and polity. A great deal now depends on
whether the coalition’s hopes for an extended co-operation in government can be sustained,
and on whether this co-operation lasts up to and into the next general election.

28
REFERENCES
Baston, Lewis. (2010a) Do Turkeys vote for Christmas? Yes, when it comes to Liberal
Democrat MPs and the boundary review for Westminster constituencies. Nick Clegg’s
party will lose a fifth of all its MPs. British Politics and Policy blog, 9 December.
http://blogs.lse.ac.uk/politicsandpolicy/2010/12/09/do-turkeys-vote-for-christmas-yes-
when-it-comes-to-liberal-democrat-mps-and-the-boundary-review-for-westminster-
constituencies-nick-clegg%E2%80%99s-party-will-lose-a-fifth-of-all-its-mps/
Baston, Lewis. (2011) ‘Britain’s unequally sized constituencies are a non existent
problem, to which the coalition government has adopted an extreme and perhaps
unworkable solution’, British Politics and Policy blog, 7 January.
http://blogs.lse.ac.uk/politicsandpolicy/2011/01/07/britain%E2%80%99s-unequally-sized-
constituencies-no-problem/
British Election Study 2009-10. (2010) Main Website at: http://bes.utdallas.edu/2009/
Clarke, Harold., Sanders, David., Stewart, Marianne and Whiteley, Paul. (2009)
Performance Politics and the British Voter (Cambridge: Cambridge University
Press).
Clarke, Harold., Sanders, David., Stewart, Marianne and Whiteley, Paul. (2010) ‘Electoral
Choice in Britain, 2010: Emerging Evidence from the BES’, Powerpoint set posted
25 June. http://bes.utdallas.edu/2009/
Diamond, Patrick and Radice, Giles. (2010) Southern Discomfort Again (London: Policy
Network), downloadable from:
http://pn.winonaesolutions.net/uploads/media/154/7134.pdf
Dunleavy, Patrick and Boucek, Françoise. (2003) ‘Constructing the number of parties’,
Party Politics, (2003), vol. 9, no. 3, pp. 291-315.
Evans, Geoffrey. ed. (2000) ‘The Continued Significance of Class Voting’, Annual Review
of Political Science, Vol. 3, pp. 401-417
Fisher, Stephen, Curtice, John and Ford, Robert. (2010) ‘The British General Election of
2010: The Results Analysed’, (Paper to the American Political Science Association
Conference, Washington DC, 3 September). Downloadable from:
http://papers.ssrn.com/sol3/papers.cfm?abstract_id=1643443
Ipsos MORI (2010). ‘How Britain Voted 2010’. Data slides at http://www.ipsos-
mori.com/researchpublications/researcharchive/poll.aspx?oItemId=2613

29
Johnston, Ron. (2011) ‘Why are Labour Lords keeping their peers up late? Opposition to
the coalition’s plans for fewer MPs and more equal constituencies’, British Politics
and Policy blog, 18 January.
http://blogs.lse.ac.uk/politicsandpolicy/2011/01/18/labour-house-of-lords-and-the-
reform-bill/.
Taylor, Alan D. (1995) Mathematics and Politics: Strategy, Voting, Power and Proof
(Berlin: Springer-Verlag).
Travers, Tony, Dunleavy, Patrick and Gilson, Chris. (2010) ‘The LSE’s simple guide to
voting systems’, British Politics and Policy blog, 12 May
http://blogs.lse.ac.uk/politicsandpolicy/2010/05/12/the-lses-simple-guide-to-voting-
systems/