patient-centered medical homes for patients with …
TRANSCRIPT

PATIENT-CENTERED MEDICAL HOMES FOR PATIENTS WITH SEVERE MENTAL ILLNESS: UTILIZATION AND QUALITY OF CARE VARIATION IN RURAL AND URBAN AREAS
Mona Kilany
A dissertation submitted to the faculty of the University of North Carolina at Chapel Hill in partial fulfillment of the requirements for the degree of Doctor of Philosophy in the Department of Health
Policy & Management in the Gillings School of Global Public Health.
Chapel Hill 2014
Approved by:
Joseph Morrissey
Marisa Domino
Pam Silberman
Kathleen Thomas
Carlos Jackson

ii
© 2014 Mona Kilany
ALL RIGHTS RESERVED

iii
ABSTRACT
Mona Kilany: Medical Homes for Patients with Severe Mental Illness: Utilization and Quality of Care Variation in Rural Areas
(Under the direction of Joseph Morrissey)
In rural areas, people with severe mental illness (SMI) often have more difficulties
accessing mental health services. As a result, the responsibility for addressing both physical and mental
needs is likely to fall to the primary care provider. The patient-centered medical home (PCMH) has been
proposed as a model for prevention, care coordination, and management of chronic disease. There is a
growing body of literature on adults in the PCMH. However, there is very little on people with SMI in the
PCMH and the performance of the model in rural versus urban areas remains unknown.
The objective of this dissertation was to examine the performance of the PCMH for Medicaid
beneficiaries with SMI living in urban and rural areas based on a set of health services utilization and
quality of care outcomes. First, it examined if there were differences for Medicaid patients with SMI
between urban, non-metropolitan urban and rural PCMHs. Next, it focused on the impact of the PCMH
in rural areas by examining primary care provider experience with SMI and, then, the interaction
between the mental health workforce supply with primary care provider experience with SMI. North
Carolina Medicaid administrative paid claims data from 2004-2007 was used to analyze the outcomes in
this dissertation.
There were differences between urban, non-metropolitan urban, and rural PCMHs for some, but
not all outcomes among people with SMI and there was some variation by SMI diagnoses. Within rural
PCMHs, the impact of experience with SMI showed higher primary care and specialty mental health use,
but also emergency department use. There was no impact of the interaction between primary care
experience with SMI and mental health workforce shortages across all of the outcomes studied.

iv
Findings from this dissertation suggests that rural and non-metropolitan urban PCMHs may
benefit from targeted resources to help close the remaining gaps in health services utilization and
medication adherence for people with SMI. Several areas for future research exist that can advance our
understanding of effective coordinated care models in order to inform future policy decisions regarding
programs aimed at improving care for people in rural areas with SMI.

v
ACKNOWLEDGEMENTS
I owe great thanks to so many people for supporting me throughout this dissertation
process. First and foremost, I would like to express my appreciation to my dissertation committee:
Joseph Morrissey, Marisa Domino, Pam Silberman, Kathleen Thomas, and Carlos Jackson. I especially
want to acknowledge my dissertation chair, Joseph Morrissey for his time, patience and thoughtful
feedback on the countless drafts he reviewed. I would also like to thank Marisa Domino for sharing her
methodological expertise and providing me with guidance for the Medicaid claims. Thank you also to
Kathleen Thomas for her support as I worked through dissertation topics that never came to fruition and
for her continued support when I finally found a topic that worked. Thank you to Pam Silberman and
Carlos Jackson for your insights into Community Care of North Carolina and helping to improve the focus
of my dissertation. This dissertation is a higher quality because of my committee’s influence.
There were so many other members of the faculty in Health Policy and Management who
guided and supported me throughout my time at UNC, but no one more than Morris Weinberger. I can
never fully express my gratitude to Morris for his unwavering support through the good times and the
bad. He has been willing to listen, been a constant source of advice and his mentorship has taught me
how to have a rational eye on everything. For all of that, and more, I am beyond grateful.
I could not have made it through this process without the amazing support of my friends, Katie
Miller, Saleema Karim, Jesse Lichstein, and Claire Lin. The hours we spent together laughing and
brainstorming random ideas on Wednesday afternoons were the best distraction from the daunting task
of dissertation writing. To my dissertation ‘buddy’, Saleema, thank you for cheering me on and
reminding me that it was always about getting to the end and walking across that stage. I also owe

vi
immense thanks to Melissa Burns for her editing support, writing knowledge, and overall amazing
friendship.
I was honored this year to receive the Fran and Paul Hoch Dissertation Fellowship from the
Royster Society of Fellows. This fellowship allowed me to have the dedicated time that I so greatly
needed to finish my dissertation.
And finally, I could not have made it this far without the unconditional love and support of my
family. Thank you to my brother, Omar Kilany, for always pushing me to aim higher. I owe a heartfelt
thank you to my mom, Edith Kilany, for always believing in me. I am a strong and independent person
today because she always told me that I could accomplish exactly what I wanted no matter what the
obstacle.

vii
TABLE OF CONTENTS
LIST OF TABLES ............................................................................................................................................. x
LIST OF FIGURES ......................................................................................................................................... xii
LIST OF ABBREVIATIONS ............................................................................................................................xiii
CHAPTER 1: BACKGROUND & STUDY OVERVIEW ....................................................................................... 1
I.A. Overview ............................................................................................................................................. 1
I.B. People with severe mental illness (SMI) have diverse needs that are challenging to manage in the primary care setting .................................................................................. 1
I.C. Addressing both the physical and mental health needs of people with SMI varies between rural and urban primary care settings ............................................................................. 4
I.D. Patient-centered medical home is an opportunity to address the challenges faced by primary care providers by bringing together networks of providers and resources ................................................................................................................................................... 7
I.E. Primary care-mental health integration efforts can inform the PCMH for people with SMI ...................................................................................................................................... 10
I.F. Community Care of North Carolina (CCNC) as a model of the PCMH ............................................... 11
I.G. Conclusions and Study Overview...................................................................................................... 13
I.H. Conceptual Framework .................................................................................................................... 18
CHAPTER 2: METHODS ............................................................................................................................... 21
Methods Overview .................................................................................................................................. 21
Aim 1 Methods ........................................................................................................................................ 21
Aim 2 Methods ........................................................................................................................................ 36
Aim 3 Methods ........................................................................................................................................ 39

viii
CHAPTER 3: RESULTS: AIM 1 ...................................................................................................................... 43
3.A. Descriptive Statistics ........................................................................................................................ 43
3.B. Primary Care Visits ........................................................................................................................... 45
3.C. Specialty Mental Health Visits ......................................................................................................... 47
3.D. Inpatient Hospitalizations ................................................................................................................ 48
3.E. Emergency Department Visits .......................................................................................................... 50
3.F. Medication Adherence ..................................................................................................................... 51
3.G. Aim 1 Results Summary ................................................................................................................... 52
CHAPTER 4: RESULTS: AIM 2 ...................................................................................................................... 54
4.A. Descriptive Statistics ........................................................................................................................ 54
4.B. Primary Care Visits ........................................................................................................................... 55
4.C. Specialty Mental Health Visits ......................................................................................................... 56
4.E. Emergency Department Visits .......................................................................................................... 58
4.F. Medication Adherence ..................................................................................................................... 59
4.G. Aim 2 Results Summary ................................................................................................................... 59
CHAPTER 5: RESULTS: AIM 3 ...................................................................................................................... 62
5.A. Primary Care Visits ........................................................................................................................... 62
5.B. Specialty Mental Health Visits ......................................................................................................... 63
5.C. Inpatient Hospitalizations ................................................................................................................ 64
5.D. Emergency Department Visits ......................................................................................................... 65
5.E. Medication Adherence ..................................................................................................................... 66
5.F. Aim 3 Results Summary .................................................................................................................... 67
CHAPTER 6: DISCUSSION & POLICY IMPLICATIONS .................................................................................. 69
6.A. Summary .......................................................................................................................................... 69
6.B, Discussion ........................................................................................................................................ 71

ix
6.C. Limitations........................................................................................................................................ 74
6.D. Next Steps ........................................................................................................................................ 76
APPENDIX: TABLES AND FIGURES .............................................................................................................. 78
REFERENCES .............................................................................................................................................. 111

x
LIST OF TABLES
Table 2.1: Sample Size of Patients with SMI by Rurality and Medical Home .......................................... 80
Table 3.1: Descriptive Statistics of Propensity Score Weighted Characteristics by Medical Home Status for SMI Sample .................................................................................................. 82
Table 3.2: Descriptive Statistics of Propensity Score Weighted Characteristics by Medical Home Status for Major Depression Sample ........................................................................... 83
Table 3.3: Descriptive Statistics of Propensity Score Weighted Characteristics by Medical Home Status for Bipolar Disorder Sample .............................................................................. 84
Table 3.4: Descriptive Statistics of Propensity Score Weighted Characteristics by Medical Home Status for Schizophrenia Sample ................................................................................. 85
Table 3.5: Propensity Score Weighted Average Marginal Effect in Monthly and Annual Primary Care Visits by Diagnosis ................................................................................................... 86
Table 3.6: Propensity Score Weighted Average Monthly and Annual Marginal Effect of Medical Home Status Simulation on Rurality for Primary Care Visits by Diagnosis ................................................................................................................................................ 87
Table 3.7: Propensity Score Weighted Average Marginal Effect in Monthly and Annual Specialty Mental Health Visits by Diagnosis ................................................................................. 88
Table 3.8: Propensity Score Weighted Average Monthly and Annual Marginal Effect of Medical Home Status Simulation on Rurality for Specialty Mental Health Visits by Diagnosis ...................................................................................................................................... 89
Table 3.9: Propensity Score Weighted Average Marginal Effect in Monthly and Annual Inpatient Hospitalizations by Diagnosis ........................................................................................ 90
Table 3.10: Propensity Score Weighted Average Monthly and Annual Marginal Effect of Medical Home Status Simulation on Rurality for Inpatient Hospitalizations by Diagnosis ................................................................................................................................................ 91
Table 3.11: Propensity Score Weighted Average Marginal Effect in Monthly and Annual Emergency Department Visits by Diagnosis ................................................................................. 92
Table 3.12: Propensity Score Weighted Average Monthly and Annual Marginal Effect of Medical Home Status Simulation on Rurality for Emergency Department Visits by Diagnosis ...................................................................................................................................... 93
Table 3.13: Propensity Score Weighted Average Marginal Effect of Monthly Prescription Adherence by Diagnosis ........................................................................................................ 94

xi
Table 3.14: Propensity Score Weighted Average Monthly and Annual Marginal Effect of Medical Home Status Simulation on Rurality for Medication Adherence by Diagnosis ................................................................................................................................................ 95
Table 4.1: Descriptive Statistics of Rural Medical Home Sample by Diagnosis ....................................... 96
Table 4.2: Average Marginal Effect in Monthly and Annual Primary Care Visits by Diagnosis in Rural PCMH ....................................................................................................................... 97
Table 4.3: Average Marginal Effect in Monthly and Annual Specialty Mental Health Visits by Diagnosis in Rural PCMH ................................................................................................. 98
Table 4.4: Average Marginal Effect in Monthly Likelihood of Any Inpatient Hospitalizations by Diagnosis in Rural PCMH ............................................................................................ 99
Table 4.5: Average Marginal Effect in Monthly and Annual Inpatient Hospitalizations by Diagnosis in Rural PCMH .......................................................................................... 100
Table 4.6: Average Marginal Effect in Monthly Likelihood of Any Emergency Department Visits by Diagnosis in Rural PCMH ...................................................................................... 101
Table 4.7: Average Marginal Effect in Monthly and Annual Emergency Department Visits by Diagnosis in Rural PCMH ...................................................................................... 102
Table 4.8: Average Marginal Effect of Monthly Medication Adherence by Diagnosis in Rural PCMH .......................................................................................................................................... 103
Table 5.1: Average Marginal Effect in Monthly and Annual Primary Care Visits by Diagnosis in Rural PCMH ......................................................................................................................... 104
Table 5.2: Average Marginal Effect in Monthly and Annual Specialty Mental Health Visits by Diagnosis in Rural PCMH ............................................................................................... 105
Table 5.3: Average Marginal Effect in Monthly Likelihood of Any Inpatient Hospitalizations by Diagnosis in Rural PCMH .......................................................................................... 106
Table 5.4: Average Marginal Effect in Monthly and Annual Inpatient Hospitalizations by Diagnosis in Rural PCMH .......................................................................................... 107
Table 5.5: Average Marginal Effect in Monthly Likelihood of Any Emergency Department Visits by Diagnosis in Rural PCMH ...................................................................................... 108
Table 5.6: Average Marginal Effect in Monthly and Annual Emergency Department Visits by Diagnosis in Rural PCMH ...................................................................................... 109
Table 5.7: Average Marginal Effect of Monthly Medication Adherence by Diagnosis in Rural PCMH ..................................................................................................................... 110

xii
LIST OF FIGURES
Figure 1.1: The Chronic Care Model ........................................................................................................... 78
Figure 1.2: North Carolina Counties by Rural-Urban Continuum Code ...................................................... 78
Figure 1.3: Conceptual Framework of Accessing Care in the Patient-Centered Medical Home ............................................................................................................................................. 79
Figure 2.1: Graph of Average Treatment Effect Weights Over Time by SMI and Diagnosis .................................................................................................................................. 80
Figure 2.2: Frequency of Experience with SMI ........................................................................................... 81
Figure 2.3: Frequency of County-Level % of Unmet Need .......................................................................... 81

xiii
LIST OF ABBREVIATIONS
CCNC Community Care of North Carolina
FQHC Federally Qualified Health Center
GEE Generalized Estimating Equations
PCMH Patient-Centered Medical Home
SMI Severe Mental Illness

1
CHAPTER 1: BACKGROUND & STUDY OVERVIEW I.A. Overview
The patient-centered medical home (PCMH) is a model for prevention, care coordination, and
management of chronic disease. This model can assist primary care providers in addressing the diverse
needs of people with severe mental illness (SMI) who have a high rate of physical comorbidities (Kessler
et al., 2005). Managing both the physical and mental health needs of patients with SMI can be complex
for primary care providers. Due to the lack of mental health resources, rural primary care providers are
more likely to assume the responsibility for managing both physical and mental health needs of their
patients with SMI than urban primary care providers (Wang et al., 2005). Most of what is known about
the PCMH is from children’s health services (Sia, Tonniges, Osterhus, & Taba, 2004), but there is a
growing body of literature on adults in the PCMH. Findings by Domino and colleagues (under review)
show that patients with SMI increased primary care and specialty mental health utilization in a PCMH
compared to those not in a PCMH. However, more research is needed on the performance of the PCMH
model for people with SMI in rural versus urban areas. Understanding the conditions necessary for rural
PCMHs to be successful in promoting primary care and mental health services utilization and quality of
care will help rural areas better address the physical and mental health needs of patients with SMI.
I.B. People with severe mental illness (SMI) have diverse needs that are challenging to manage in the primary care setting
Severe mental illness (SMI) is the presence of any mental disorder, substance use disorder that
leads to serious impairment over a long period of time (National Advisory Mental Health Council, 1993;
Substance Abuse and Mental Health Services Administration, 1993). The mental disorders that most
often meet this definition are mood disorders (i.e. major depression and bipolar disorder) and non-

2
affective psychoses (i.e. schizophrenia) (Kessler et al., 2006). Affecting approximately one-quarter of
people with mental disorder, people with SMI frequently experience a higher rate of physical
comorbidities and an earlier age of onset of these comorbidities than the general population, are less
likely to have insurance coverage or have a usual source of primary medical care (Bradford et al., 2008;
Kessler et al., 2005; Kessler, et al., 2006; Wang, et al., 2005).
Some researchers have suggested that the primary care setting has become the de facto mental
health system for people with SMI (Fox, Merwin, & Blank, 1995; Regier et al., 1993; Wang, Demler, &
Kessler, 2002). Specifically, Regier et al. (1993) found that primary care providers are the only source of
care, including their mental health care, for nearly one-third of people with SMI. More recent analyses
show that approximately 20-23% of people with SMI receive all of their mental health care from primary
care (Wang, et al., 2002; Wang, et al., 2005). Additionally, people with SMI report more problems
accessing care in any health care setting, including difficulties getting appointments and getting
prescriptions when needed (Bradford, et al., 2008). Specifically, people with SMI are four to six times
more likely to report needing medical care and needing prescriptions but were unable to get access to
these services compared to people without SMI (Bradford, et al., 2008). As a result of these barriers to
accessing needed services, people with SMI were also four to five times more likely to delay their
medical care because they were concerned about the cost of the care than people without SMI
(Bradford, et al., 2008; Wang, et al., 2005). Among people with SMI, people with schizophrenia and
bipolar disorder are more likely to report having problems accessing needed care or receiving minimally
adequate care than are people with depression, (Bradford, et al., 2008; Wang, et al., 2002; Wang, et al.,
2005).
The study by Bradford et al. (2008) relied on data from the National Health Interview Survey,
which is nationally representative survey of the non-institutionalized United States population, but it is
not a representative sample of the SMI population. However, Wang et al. (2002, 2005) had similar

3
findings using data from the National Comorbidity Survey, a nationally representative sample of the
United States population, but focused on mental health disorders. Additionally, these surveys rely on
respondents self-reporting on access to care questions such as whether they accessed care or
prescriptions when needed, or delayed care for any reason. While self-report questions and responses
provide useful information on access to care problems, they do not allow for further analysis necessary
for understanding the structural barriers associated with access to care. More in-depth research on the
types of health care settings respondents try to access along with the specific reasons why they cannot
get care when needed is necessary, but cannot be conducted from the data available in these nationally
representative surveys.
Providing care for people with SMI can be challenging for primary care providers who may have
limited training and experience managing care for this population. Wang and colleagues (2002) found
that, among people receiving their mental health care from primary care providers alone, only 29%
received minimally adequate care. In particular, people with SMI who only visit a primary care provider
for their mental health care are less likely to have their mental health needs met than people with SMI
who only visit a mental health provider for their mental health care. Additionally, primary care providers
are more likely to recognize physical health comorbidities, but less likely to provide mental health care
according to diagnosis specific guidelines, including prescribing proper medications and proper dosage
for those medications (Kilbourne et al., 2010; Wolf & Hopko, 2008). For example, people with bipolar
disorder receiving all or some of their mental health care from primary care providers were significantly
less likely to receive proper dosages of medications as compared to those with bipolar disorder who
received their mental health care from specialty mental health providers (Kilbourne, et al., 2010; Olfson
et al., 2005). Primary care providers may benefit from additional supports from and communication with
care managers and mental health providers to improve the care they provide to people with SMI, given

4
the complexity of managing SMI care in a primary care setting and that the care currently provided is
not meeting the needs of people with SMI.
I.C. Addressing both the physical and mental health needs of people with SMI varies between rural and urban primary care settings
The mental health system in rural areas often has fewer treatment and support resources
available to people with SMI than the mental health system in urban areas. In particular, rural mental
health services are more likely than urban areas to rely heavily on small networks of community mental
health service boards, primary care providers, social services and informal care networks such as rural
churches (Fox, et al., 1995; Hauenstein, 2008). Stigma and attitudes towards mental illness in rural areas
are also serious barriers to care for people with SMI. People with SMI in rural areas report more
concerns about community and provider attitudes towards both mental illness and seeking treatment
for mental illness(Fox, et al., 1995). There are also concerns among people with SMI that their providers
will treat them unkindly or unfairly due to their mental illness (Fox, Blank, Rovnyak, & Barnett, 2001;
Hauenstein, 2008).
Providing care for people with SMI can present more challenges in rural areas than in urban
areas. People with SMI in rural areas are less likely to receive any mental health services and are even
less likely to receive specialty mental health services (Hauenstein et al., 2007). People with SMI in rural
areas are more likely to be worse off economically and have worse health status than a similar
population in urban areas, which also impacts their access to care. In addition, people with SMI living in
rural areas have fewer years of education, more likely to be unemployed, to be living below the federal
poverty level and to be uninsured (Flaskerud & Kviz, 1982; Hartley et al., 2007; Probst et al., 2006; Rost,
Fortney, Zhang, Smith, & Smith, 1999; Wang, et al., 2005). In terms of health status, people with SMI in
rural areas are more likely to report lower health-related quality of life, poorer overall health and
mental health, and more limitations with daily living and social activity than people with SMI in urban

5
areas (Adams, Xu, Dong, Fortney, & Rost, 2006; Flaskerud & Kviz, 1982; Hauenstein, et al., 2007; Probst,
et al., 2006).
Based on the characteristics of rural areas and the people with SMI living there, providing care
for this population is challenging for two main reasons: 1) availability of necessary mental health
services and, 2) limited specialty mental health services when care is accessed.
The availability of mental health providers serving rural communities is one of the commonly
cited reasons for difficulty accessing necessary mental health services in rural areas. In a survey of
primary care providers, rural primary care providers reported greater difficulty getting referrals to
mental health providers than urban primary care providers (Cunningham, 2009; Fox, et al., 1995).
Approximately two-thirds of rural primary care providers report being unable to get referrals for mental
health services for people identified as needing mental health care because of shortages of mental
health providers serving rural areas (Cunningham, 2009). Referral problems are more common for rural
primary care providers in areas with a smaller supply of mental health providers. In rural counties with a
moderate supply of psychiatrists (8 or more per 100,000), primary care providers are 12% less likely to
report referral problems for people with SMI than physicians in counties with a lower supply of
psychiatrists (Cunningham, 2009). The lower the supply of mental health providers available to accept in
referrals, the greater the burden on rural primary care providers to be the sole provider addressing the
patient’s mental health needs.
Another commonly cited reason for problems getting mental health referrals in rural areas is the
amount of charity care or Medicaid patients (Cunningham, 2009; Yuen, Gerdes, & Gonzales, 1996). Yuen
et al. (1996) found that the more charity care or Medicaid patients seen in rural primary care practices,
the more likely primary care providers were to report problems getting people with SMI necessary
mental health referrals (Yuen, et al., 1996). A recent analysis by Cunningham (2009) found that when a
rural primary care practice served a high number of charity care and Medicaid patients, these providers

6
were 14% more likely to report not being able to get outpatient mental health referrals for their patients
than rural primary care practices with fewer charity care and Medicaid patients. Additionally, both
rurality and lower income are strong predictors of whether a county have a shortage of mental health
providers (Thomas, Ellis, Konrad, Holzer, & Morrissey, 2009). Similar to provider supply problems, the
burden of addressing a person’s mental health needs falls back to the rural primary care provider when
people with SMI cannot get referrals to mental health providers.
When people with SMI in rural areas are able to access mental health care, they see different
providers for their mental health services compared to urban areas. In general, the greater the degree of
rurality, the lower likelihood of any mental health treatment (Hauenstein, et al., 2007). Patterns of care
show that, in rural areas, people with SMI are more likely to receive all of their care from primary care
providers. They are also two to three times more likely to visit primary care providers than mental
health providers for their mental health needs (Fox, et al., 1995; Himelhoch & Ehrenreich, 2007). The
degree of rurality is also associated with the likelihood that rural primary care providers will provide
more mental health services, with primary care providers in the more rural locations assuming the
responsibility for providing more mental health services (Yuen, et al., 1996). In this instance, the degree
of rurality was defined as the distance from metropolitan areas and population size with greater rurality
defined as a community of approximately 3,500 people and over 45 minutes by car to the nearest
metropolitan area.
Rural primary care providers, even more than urban primary care providers, are not meeting all
of the physical and mental health needs of their patients with SMI. Treatment for mental illness in rural
areas is primarily driven by the use of prescription medications, with people with SMI five times more
likely to have a prescription medication, but having fewer psychotherapy visits than urban areas
(Fortney, Harman, Xu, & Dong, 2010; Ziller, Anderson, & Coburn, 2010). Rural-urban disparities are also
evidenced by people with SMI in rural areas being more likely to be hospitalized for both physical and

7
mental health reasons than people with SMI in urban areas (Hartley, et al., 2007; Rost, Adams, Xu, &
Dong, 2007; Rost, et al., 1999). Specifically, they are two to three times more likely to be hospitalized for
either physical or mental health problems than a similar population in urban areas. The higher likelihood
of having an inpatient hospitalization decreases when controlling for the number of outpatient specialty
visits (Rost, et al., 1999), suggesting that if people with SMI were to receive the necessary outpatient
specialty mental health services, an inpatient hospitalization could be avoided.
I.D. Patient-centered medical home is an opportunity to address the challenges faced by primary care providers by bringing together networks of providers and resources
Research shows that people with SMI have a hard time accessing necessary primary care and
mental health services, while primary care providers have a hard time meeting mental health needs and
finding referral services for these people. These problems are even worse in rural areas. Given the
challenges of managing people with SMI in primary care settings and the challenges of accessing mental
health services in rural areas, the PCMH can serve as a model to improve care for people with SMI in
primary care.
PCMHs began in the 1960s in the children’s health services arena as health homes, medical
homes or family-centered medical homes (Sia, et al., 2004). According to the American Academy of
Pediatrics, medical homes should be accessible, continuous, comprehensive, family-centered,
coordinated, compassionate, and culturally effective (American Academy of Pediatrics Ad Hoc Task
Force on Definition of the Medical Home, 1992). In 2007, several physician associations developed
guiding principles for the adult PCMH, which also informed the more recent definition developed by the
Agency for Health Research and Quality (Agency for Healthcare Research & Quality, n.d.; American
Academy of Family Physicians, American Academy of Pediatrics, & American Osteopathic Association,
2007). According to these guiding principles, a PCMH should include a physician-directed medical
practice, a personal physician for each patient, the capacity to coordinate high quality, accessible care

8
and payments that reflect the added value of the PCMH to patient care (Iglehart, 2008). The Agency for
Health Research and Quality narrowed the definition of the PCMH to focus on five features: care that is
1) comprehensive, 2) patient-centered, and 3) coordinated while also providing 4) accessible, and 5)
quality and safe services to patients (Agency for Healthcare Research & Quality, n.d.).
To date, the majority of the literature on the PCMH comes from the literature on children with
special health care needs. Analyses on the PCMH for children with special health care needs have shown
that the PCMH improves access to health care services for children (Homer et al., 2008). It has also been
shown to improve the relationship and communication between families and primary care providers,
which in turn influences child outcomes such as improved health status, care provided on a more timely
basis and care that is more family centered (Homer, et al., 2008). Recent systematic reviews of the adult
PCMH literature show promising early results of components of the PCMH for adults with chronic
physical health conditions. These reviews showed that adults in PCMHs were more satisfied with the
care they received and perceived that they were receiving more care coordination (Jackson et al., 2013;
Peikes, Zutshi, Genevro, Parchman, & Meyers, 2012). They also found that patients received more
preventive care, had fewer inpatient hospitalizations and emergency department visits (Jackson, et al.,
2013; Peikes, et al., 2012). Peikes and colleagues (2012) hypothesized that the PCMH may provide the
greatest benefit to older, sicker patients, although further research is needed on people with chronic
conditions to confirm this hypothesis. Of the PCMH studies reviewed by Jackson and colleagues (2013)
and Peikes and colleagues (2012), many of the studies of the PCMH for adults were conducted within
large, integrated health systems, including the Veteran’s Administration, Group Health Cooperative,
Geisinger Health System (Jackson, et al., 2013; Peikes, et al., 2012). While the experience of these health
systems provides valuable information on outcomes of the PCMH, smaller health systems and practices
in rural communities are not likely to have the same infrastructure in place to implement the PCMH
model. Additionally, among the observational studies, several of them did not have a comparison group

9
to compare the results of the participants in PCMH, which makes it difficult to determine if the observed
effects were due to the PCMH or other factors (Peikes, et al., 2012).
The chronic care model (Figure 1.1) is a model that informs the way that the PCMH influences
patient outcomes (Bodenheimer, Wagner, & Grumbach, 2002), and has frequently been used as the
framework for mental health-primary care integration programs (Butler et al., 2008). In the chronic care
model, the entire health care system coordinates care while integrating community resources with an
informed patient and a treatment team. The elements of the chronic care model include the health
system, delivery system design, decision support, clinical information systems, self-management
support, and the community. All of these settings and systems should collaborate to agree on
appropriate treatment and resources for the patient. This holistic approach to treatment leads to
improved patient outcomes and patient care (Coleman, Austin, Brach, & Wagner, 2009). People
receiving care within the chronic care model had fewer emergency department and inpatient hospital
visits, reported improved quality of life and were more knowledgeable about their chronic health
conditions (Coleman, et al., 2009).
The holistic approach of the chronic care model as described above requires many key elements
in order for patients and providers to benefit. For rural areas that may not have the staff support and
knowledge base to fully implement this type of model, it is unknown how rural areas are able to
translate the chronic care model into practice. Improvements in patient care and outcomes using the
chronic care model have been successful in interventions that only implemented certain elements of the
chronic care model; specifically, health information technology, clinical guideline support, practitioner
coordination teams and community linkages (Coleman, et al., 2009); these elements are key features of
the PCMH. That the chronic care model has been shown to be successful when implementing certain
key elements rather than the full model may make translating the PCMH into practice easier for rural
areas where economic and workforce resources are limited.

10
To date, PCMH programs have been implemented in 17 states, including North Carolina,
through state Medicaid programs and/or, private insurers. Early results show improved access to care
and higher patient satisfaction (Takach, 2011). States are experimenting with payment incentives,
coaching for providers, learning collaboratives and networks that support participating practices
(Takach, 2011). An analysis of a non-profit insurer’s PCMH initiative found that patients in the PCMH had
fewer primary care and specialist care visits (Fontaine, Flottemesch, Solberg, & Asche, 2011). This
analysis, however, did not analyze how health services utilization varied for people with more diverse
health care needs (i.e. specific diagnoses or comorbidities) and was unable to determine or whether
fewer primary care and specialty care visits resulted in improved quality of care or patient health-related
outcomes.
I.E. Primary care-mental health integration efforts can inform the PCMH for people with SMI
With relatively little research on the effect of the PCMH for people with SMI, related literature
on integrating mental health services into primary care can be used to inform this analysis. Primary care-
mental health integration provides a context for understanding the benefits and challenges that the
PCMH for people with SMI might experience moving forward. Integrated care aims to increase
collaboration between mental health and primary care providers with the goal of increasing the ability
of primary care providers to provide high quality mental health care, and improving the ability of
primary care providers to screen and refer people for mental health treatment (Butler, et al., 2008).
There have been 33 trials integrating mental health providers into primary care practices, with
the majority of the trials focusing on care for people with depression (Butler, et al., 2008). The primary
patient outcome focuses on improvements in symptom severity for the mental health diagnosis.
Unfortunately, few studies found significant improvements in patient outcomes. One exception is the
PRISM-E trial within the Veteran’s Administration, which found that using enhanced referral through

11
strong communication and coordination between providers improved patient outcomes for depression
(Krahn et al., 2006). In addition, only a few primary care-mental health integration efforts have been
conducted in rural areas. One analysis of depression management in primary care looked at rural-urban
differences in patient outcomes (Rost, et al., 2007). They showed that the depression management
program improved patient outcomes in urban areas, but did not find equivalent improvements in
patient outcomes in rural areas (Butler, et al., 2008; Rost, et al., 2007). Specifically, even with the
depression management program, rural patients had more hospitalizations than did urban patients
(Rost, et al., 2007). Nevertheless, the analysis found evidence of rural primary care providers increasing
their use of depression-specific treatment guidelines.
Similar to primary care-mental health integration efforts, the PCMH aims to bring together
resources, such as case managers and resources associated with managing care for people with SMI that
did not previously exist for primary care practices. In some instances, incorporating case management or
involving mental health providers in treatment discussions has been shown to improve patient response
to treatment (i.e., adherence to medications) as well as improved management of mental health needs
by primary care providers (i.e., guideline based care) (Butler, et al., 2008; Krahn, et al., 2006; O'Connor,
Whitlock, Beil, & Gaynes, 2009; Rost, et al., 2007). In rural areas in particular, these additional resources
are expected to assist primary care PCMHs in overcoming the challenges of providing care for people
with SMI in rural areas. However, care managers may only have a significant impact assisting primary
care providers in the rural areas where there is a sufficient supply of mental health providers and
community mental health services that care managers can use to coordinate services.
I.F. Community Care of North Carolina (CCNC) as a model of the PCMH
In 1998, the North Carolina Division of Medical Assistance created the CCNC system that
allowed areas to develop as networks of primary care providers responsible for coordinating prevention,

12
treatment, and referral services (Willson, 2005). Primary care providers agreeing to participate in CCNC
receive a per member per month enhanced case management fee and each CCNC network receives
another per member per month enhanced care management fee (Ricketts, Greene, Silberman, Howard,
& Poley, 2004). With the enhanced case management fee, primary care providers are expected to
conduct a comprehensive assessment, develop individualized care plans, coordinate care, and monitor
each patient’s progress. The network uses the enhanced care management fee to hire local case
managers and resources associated with managing beneficiaries. The minimum requirement is that
CCNC networks include local primary care providers, local hospitals, local health department, and the
Department of Social Services. This network forms a 501(c)3 corporation to receive and manage the
enhanced care management fee. The resources provided by the CCNC networks to participating primary
care providers are essential to the success of the PCMH model. These resources are particularly helpful
in rural areas of North Carolina where fewer resources exist.
Analyses have been conducted on CCNCs disease management programs, particularly, asthma
and diabetes disease management (Ricketts, et al., 2004). Ricketts et al. (2004) showed that the CCNC
disease management program improved outcomes for beneficiaries. The evaluation showed that both
programs reduced hospitalizations and emergency department visits for beneficiaries with asthma or
diabetes. This study period of this evaluation occurred during the early years of CCNC (2000-2002); as a
result, some of the improved outcomes may have been associated with early adopters (providers and
patients) who were more likely to adhere to the disease management programs and experience positive
outcomes. Additionally, the evaluation did not make any adjustments for selection bias for both
providers selecting to participate in CCNC and patients selecting to enroll in the program. Also, the focus
of the evaluation was entirely on asthma and diabetes disease management, which may not translate to
the SMI population. Finally, the evaluation showed wide variations in utilization across North Carolina

13
counties, but it did not discuss the rurality of counties or whether there were significant differences in
utilization outcomes between rural and urban areas.
There have been a few more recent studies of CCNC as a PCMH model looking at (1) children
with asthma (Domino, Humble, Lawrence, & Wegner, 2009), and (2) people with SMI (Domino, Wells, &
Morrissey, under review). Domino et al. (2009) showed that the quality of asthma care improved while
hospitalizations and emergency department visits decreased for children with asthma in the PCMH. This
study of children with asthma adjusted for selection into CCNC using a fixed effects model, but did not
evaluate other methods of adjusting for selection such as propensity score methods or instrumental
variables. Additionally, the findings from the study on children with asthma do not generalize to an adult
SMI population. Adults with SMI have different health and mental health care needs as well as family or
social supports than children with asthma. Findings from Domino et al. (under review) found that people
with SMI increased primary care and specialty mental health utilization. Missing from all of the CCNC
analyses is an understanding of the differing effect of the PCMH model in rural versus urban areas of
North Carolina, which is important given that 60 of North Carolina’s 100 counties are designated as non-
metropolitan by the 2003 Rural/Urban Continuum Codes (Figure 1.2).
I.G. Conclusions and Study Overview
The main tenets of the PCMH model are a physician-directed medical practice, a personal
physician for each patient, the capacity to coordinate high quality, accessible care and payments
(Iglehart, 2008). This model has the opportunity to help address the issues of managing care for people
with SMI, particularly in rural primary care practices. As the literature shows, managing the care for
people with SMI in primary care can be complicated, requiring more care coordination between
providers, and understanding of both the physical and mental health needs. Care management in rural
areas with less availability, and accessibility of mental health services is more complex than in urban

14
areas. Rural primary care providers experience more difficulties getting referrals to mental health
providers for their people with mental health needs (Cunningham, 2009; Fox, et al., 1995). As a result,
primary care providers take a greater role in the mental health care as shown by people with SMI using
more primary care than mental health care and more rural primary care providers providing
psychotherapy (Fox, et al., 1995; Himelhoch & Ehrenreich, 2007; Lambert, Agger, & Hartley, 1999; Yuen,
et al., 1996). Involving care managers and mental health providers in primary care delivery is believed to
improve the communication between mental health and primary care providers when caring for people
with SMI in the PCMH (Alakeson, Frank, & Katz, 2010; Centers for Medicare & Medicaid Services,
November 16, 2010; The Kaiser Commission on Medicaid and the Uninsured, 2011). As the lessons from
the primary care-mental health integration literature illustrate, increased involvement of and
communication with mental health providers in primary care practices improves outcomes for people
with SMI (Butler, et al., 2008). However, the impact of primary care-mental health integration in rural
areas is less clear since fewer analyses have looked primarily at rural areas or analyzed the differences
that exist between rural and urban areas. Given the challenges of addressing the needs of people with
SMI in rural primary care, the gaps in the literature, and the renewed emphasis on the PCMH model, it is
important to gain a better understanding of the issues rural areas might face translating the PCMH
model into practice for people with SMI.
The objective of this study is to examine the performance of the PCMH for Medicaid
beneficiaries with SMI living in urban and rural areas. The central hypothesis of this study is that urban
PCMHs will outperform rural PCMHs on a number of utilization and quality indicators, but the gaps will
be lessened in rural areas with higher numbers of mental health providers and primary care providers
with more experience managing SMI. It is expected that these two conditions will allow rural PCMHS to
elevate their performance over what is achieved by other rural PCMHs. Specific aims will be addressed:

15
Aim 1: To determine if differences in health services utilization and quality of care exists for
patient-centered medical home status between rural and urban areas for Medicaid patients with SMI.
The hypothesis for this aim is that Medicaid patients with SMI in urban PCMHs will have higher health
services utilization and quality of care than Medicaid patients with SMI in rural PCMHs.
As shown in the literature, there are rural-urban differences in primary care as well as mental
health care access and utilization problems for people with SMI in rural areas (Cunningham, 2009; Yuen,
et al., 1996). Currently, the impact of the PCMH model on these rural-urban differences is unknown.
Given that the chronic care model and primary care-mental health integration have been shown to be
effective when providers have sufficient clinical guideline support, practitioner coordination teams and
community linkages (Butler, et al., 2008; Coleman, et al., 2009), it is expected that the PCMH model will
significantly improve health services utilization and quality of care for Medicaid beneficiaries with SMI in
urban areas over what PCMHs are able to accomplish for this population in rural areas. This is because
urban areas provider more of the infrastructure upon which the PCMH relies, including ample specialty
mental health referral sources and high population densities. However, prior research has not examined
rural-urban differences in PCMHs for people with SMI. Learning more about rural-urban differences in
health care utilization and health care quality for people with SMI is an important first step in
determining the full impact and the conditions for success of the PCMH model on the physical and
mental health care needs of people with SMI.
The holistic approach of the chronic care and PCMH models require many key elements in order
to for patients and providers to benefit. However, rural areas face resources gaps required to fully
implement the PCMH model such as shortages of mental health providers and primary care providers
who have the knowledge and experience to treat people with SMI. Aims 2 and 3 respond to these issues

16
by focusing on understanding the role played by primary care and mental health workforce in rural areas
in meeting the health services utilization and quality of care needs of people with SMI in the PCMH.
Aim 2: To determine whether the performance of PCMHs in rural areas on health services
utilization and quality of care for patients with SMI varies with primary care provider experience with
SMI. The hypothesis for this aim is that PCMH patients with SMI in rural areas receiving care from
primary care providers with high SMI caseloads will have improved health services utilization and quality
of care than those receiving care from primary care providers with low SMI caseloads.
The medical literature has studied volume as the number of cases per year from two
perspectives, hospital volume and physician volume (Halm, Lee, & Chassin, 2002). The assumption is
that more experience with certain medical procedures leads to better patient outcomes because the
providers become more proficient with these procedures when they are conducted more frequently.
Additionally, it is believed that hospital or physician volume continues to increase because of referrals
from other providers as a result of better outcomes from higher experience (Halm, et al., 2002). The
main outcome among the medical literature on volume and outcomes is mortality rates, which is not as
relevant for chronic condition such as SMI. The relationship between volume and quality in mental
health care has been studied at the managed care plan level, specifically focusing on several HEDIS
measures such as follow-up care after hospitalizations and medication management (Druss, Miller,
Pincus, & Shih, 2004). Druss and colleagues (2004) found that at the managed care plan level, plans with
lower mental health care volume had weaker performance on HEDIS performance measures. However,
the association between primary care provider volume of people SMI has not been studied.
Understanding the impact of high SMI volume among rural primary care providers information on how

17
utilization and quality of care is affected when primary care providers gain more experience managing
the needs of people with SMI in the PCMH.
Aim 3: To assess the extent to which the performance of PCMHs in rural areas on health
services utilization and quality of care for patients with SMI varies with the extent of mental health
workforce shortages and experience with SMI. The hypothesis for this aim is that PCMH patients with
SMI in rural areas that have less mental health workforce shortages and receive care from primary care
providers with high SMI caseloads will have improved health services utilization and quality of care
relative to other rural areas
Connecting primary care providers with the necessary mental health resources such as
incorporating case management or involving mental health providers in treatment discussions has been
shown to improve patient response to treatment (i.e., adherence to medications) as well as improved
management of mental health needs by primary care providers (i.e., guideline based care) (Butler, et al.,
2008; O'Connor, et al., 2009). Across the United States, significant shortages of mental health providers
exist, particularly in rural areas (Thomas, et al., 2009). However, not all rural areas are the same with
regard to workforce shortages or primary care provider experience with people who have SMI. The
degree of rurality has been shown to affect the likelihood that rural primary care providers will provide
mental health services (Yuen, et al., 1996). Further, rural primary care providers are increasingly
providing psychotherapy within the primary care setting (Himelhoch & Ehrenreich, 2007). The shortage
of mental health providers and variations in provider knowledge about treating SMI may have an impact
on the performance of PCMHs in rural areas. The Aim 3 hypothesis holds that PCMH utilization and
quality performance will be higher in rural areas where there are greater numbers of mental health
providers and primary care providers who have more experience treating people with SMI.

18
Understanding the constraints on PCMHs in rural areas associated with limited mental health provider
availability and primary care providers experience treating SMI will inform us about the challenges and
barriers facing the PCMH for people with SMI. This study seeks to broaden the understanding of the
facilitators and barriers associated with developing PCMHs in rural communities and their role in care
for people with SMI.
I.H. Conceptual Framework
The conceptual framework for this analysis is based on the Andersen and Aday behavioral model
for health service use (Aday & Andersen, 1974; Andersen, 1995). The Andersen and Aday model seeks to
understand why people use health services, measure access to care and inform policies that will address
the issues associated with why and how people use health services. This model reflects the ways in
which the health care delivery system, the population characteristics, and health behaviors influence
patient outcomes and satisfaction with care.
The health care delivery system refers to the environment where care is delivered to patients.
Use of health services is represented as a function of population characteristics. The population
characteristics are comprised of predisposing characteristics, enabling resources, and need. Predisposing
characteristics are the set of patient characteristics that helps describe the likelihood of using services,
including individual characteristics (i.e. age, sex, race), health status (i.e. SMI diagnosis) and location of
residence (i.e. rural or urban). Enabling resources then explains the means with which a patient has to
use services within the health care delivery system. These enabling resources can be unique to the
patient and the community in which the patient lives. Finally, need is the reason a patient has for using
health services and is described as either perceived need, by the patient, or evaluated need, by the
health care system (Andersen, 1995).

19
With respect to how the PCMH assists primary care providers in addressing the physical and
mental health needs of patients with SMI in rural areas, the conceptual framework (Figure 1.3) focuses
on the PCMH as the health care environment. The PCMH, building on concepts from the chronic care
model (Figure 1.1), has a direct influence on the health services utilization and quality of care outcomes.
The impact of the PCMH on outcomes (i.e. utilization and expenditures) for patients with SMI has been
assessed elsewhere (Domino, et al., under review). In addition to the direct influence of the PCMH on
outcomes, a set of population characteristics that includes the predisposing characteristics and enabling
resources from the Andersen and Aday model directly affects outcomes. The predisposing
characteristics used for this analysis will be the individual characteristics of age, sex and race along with
the individual’s health status that were also controlled for in Domino et al. (under review).
Aim 1 of the analysis builds upon previous research by including rural/urban residence as an
important context characteristic that is expected to influence outcomes for patients with SMI in the
PCMH. The PCMH model emphasizes prevention, care coordination, and management of chronic
disease. Linking primary care providers with care managers, specialty mental health providers and
additional information about managing care for people with SMI provides both urban and rural areas
with the additional support that allows both areas to develop successful PCMHs and help to lessen the
differences that currently exist between urban and rural areas.
Despite the additional support available through the PCMH model, rural areas often have a
scarcity of resources, including mental health provider supply and care management support for primary
care providers when compared to urban areas. The role of the community context for rural areas is
important towards understanding how rural PCMHs are able to respond when primary care providers
have experience with people with SMI, likely due to mental health provider shortages in rural areas. As a
result, the context of the community within which the individual accesses care is the focus of Aims 2 and
3. These aims focus on two measurable community contexts that are expected to influence rural PCMHs

20
outcomes: experience with SMI mental health and workforce supply. Specifically, rural primary care
providers with greater experience with SMI (Aim 2) is expected to influence the health services
utilization and medication adherence outcomes in the rural PCMH setting. The burden of meeting both
the physical and mental health needs often fall to rural primary care providers. This burden gives
primary care providers with higher SMI caseloads more experience at caring for people with SMI, and
therefore, more experience with how to improve the outcomes of people with SMI. Additionally, within
the context of the rural PCMH, primary care providers have access to care managers and additional
educational information on treating SMI such that having a higher volume of patients with SMI would
prepare them on treating patients with SMI and influence patient outcomes. In combination with the
primary care provider caseload size from Aim 2, mental health provider shortages were likely to
influence the amount of experience a rural primary care provider gains in treating patients with SMI. As
a result, an interaction between primary care provider experience and mental health workforce supply
(Aim 3) will provide greater understanding of the role of the rural community context for the PCMH and
its impact on outcomes for people with SMI in rural PCMHs.

21
CHAPTER 2: METHODS
Methods Overview
The study was a quasi-experimental design of North Carolina Medicaid paid claims data of
Community Care of North Carolina (CCNC) model of a patient-centered medical home (PCMH). It
examined if the health service utilization and quality of care for people with severe mental illness (SMI)
was different across urban and rural PCMHs. It examined people with SMI in PCMHs compared to those
in fee-for-service Medicaid between rural and urban areas (Aim 1), explored differences in the impact of
the PCMH in rural areas by examining primary care provider experience with SMI (Aim 2) and, the
combined effect of the mental health workforce supply with primary care provider experience with SMI
(Aim 3). These aims were tested using a generalized estimating equation approach and propensity score
methods to account for potential selection problems.
Aim 1 Methods
To determine if differences in health services utilization and quality of care exists for PCMH status between rural and urban areas for Medicaid people with SMI.
1. A. Data
The data for this analysis were North Carolina Medicaid paid claims during 2004-2007 (January
1, 2004-December 31, 2007). The data were obtained through the Carolina Cost and Quality Initiative on
individuals with major depression bipolar disorder, and schizophrenia and were used in previous
analyses (Domino, et al., under review). The full set of ICD-9 295 codes for schizophrenic disorders was
used to identify people with schizophrenia, which also included schizoaffective disorders. The data had
information on Medicaid claims for all services and medications paid for by the North Carolina Medicaid

22
program. The data were collapsed to the person-month level. In addition to the Medicaid paid claims,
the 2003 Rural-Urban Continuum codes were added for each county.
The period for this analysis (2004-2007) covered the time when CCNC was expanding the PCMH
model statewide beyond the early focus on children with asthma. During the study period, an increasing
number of adults began receiving care under the PCMH. Additionally, this period also allowed for a
comparison of people with SMI in a PCMH compared to people with SMI in fee-for-service Medicaid.
This comparison was necessary to determine if the outcomes of people with SMI in the PCMH were the
result of the care offered in the PCMH rather than other factors.
During the period for this analysis, North Carolina was also in the midst of significant statewide
mental health reform, starting in 2001. The mental health reform restructured the mental health system
to create local management entities which had connections with the local community, including the
county government and community mental health providers (Rash, 2012). It was expected that all of the
North Carolina counties (rural and urban) as well as PCMH and fee-for-service were equally affected by
this mental health reform during the study period and did not significantly affect the utilization and
quality of care outcomes.
1.B. Sample
The sample for Aim 1 was adults (18 and older) with SMI who were enrolled in North Carolina
Medicaid during 2004-2007 for at least one month. SMI in this analysis was defined as the diagnosis of
major depression, bipolar disorder, or schizophrenia. Identification of these disorders in the data was
based on an indication of at least two outpatient diagnoses or one inpatient diagnosis in the North
Carolina Medicaid claims data over the three year study period. Study participants were also allowed to
have more than one SMI diagnosis.

23
There was a total number 195,718 people with SMI in the sample, with 160,203 diagnosed with
major depression, 39,848 diagnosed with bipolar disorder, and 32,791 diagnosed with schizophrenia
(Table 2.1). The sample was broken into two categories by diagnosis: (1) people with SMI enrolled in the
PCMH and, (2) people with SMI in fee-for-service Medicaid. People with SMI were allowed to switch in
an out of the PCMH during the study period. Among people with major depression, bipolar disorder and
schizophrenia, 58%, 60% and 44%, respectively, on average over the study period were in the PCMH
category.
The sample was also broken down by rurality based on the 2003 Rural-Urban Continuum codes.
Many analyses studying rural areas only used binary variables that separate areas into only rural and
urban categories. There are several different definitions for defining rural areas, but one overarching
definition of rural does not currently exist (Coburn et al., 2007; Hall, Kaufman, & Ricketts, 2006). Some
have argued that regardless of the definition used, using a simple binary variable to define rural and
urban areas does not fully capture the differences that exist within rural areas (Hall, et al., 2006); rurality
is not necessarily homogenous. As a result, a three-level categorical variable based on the 2003 rural-
urban continuum codes was used in order to expand beyond what is known about rural areas and
consider the impact of degree of rurality on health services utilization and quality of care for people with
SMI. The rural-urban continuum codes used in this analysis allowed rurality to be defined by
metropolitan counties and non-metropolitan counties broken down further by degree of urbanization
and adjacency to metropolitan/non-metropolitan areas (United States Department of Agriculture
Economic Research Service, 2004).
1.C. Variables
Dependent Variables
This analysis used two categories of dependent variables: mental health and physical health
services utilization and a medication adherence measure.

24
The health services utilization variables looked at visits to a variety of health settings. These
were count variables of the number of health care visits to the following health care settings: 1) primary
care providers, 2) outpatient mental health providers, 3) emergency departments and 4) inpatient
hospitalizations. This measure was used to determine how many visits people with SMI made to each of
these health care settings by PCMH enrollment in rural or urban areas.
Medication adherence was a continuous measure of the proportion of days of medication
received (Benner et al., 2002; Peterson et al., 2007). The proportion was a fraction of the days in the
month for which at least one medication was dispensed, with the numerator the number of days in the
month with the drug on hand and the denominator the number of days in the month.
Main Explanatory Variable
The difference-in-differences estimator, rural X medical home interaction term, was the main
explanatory variable for Aim 1. This was an interaction of the medical home indicator (binary variable)
and rural indicator (categorical variable). It was used to show if the PCMH reduced differences in health
services utilization and quality of care between rural and urban areas.
The medical home indicator was a binary variable of whether a Medicaid patient with SMI was
enrolled in a PCMH or in a traditional fee-for-service Medicaid practice. The PCMH was identified based
on two additional fees: (1) per member per month enhanced case management fee to the primary care
practice, and (2) per member per month enhanced care management fee to CCNC network. Enrollment
in the PCMH was allowed to vary from month to month during the study period.
The rural indicator was a three-level categorical variable of urban, non-metropolitan urban and
rural counties in North Carolina based on the 2003 rural-urban continuum codes. The codes allowed for
a maximum nine-category breakdown, with three categories for metropolitan counties and six
categories for non-metropolitan counties. In North Carolina, 40 counties were urban (RUC 1, 2, and 3),

25
39 were non-metropolitan urban (RUC 4, 5, 6, and 7), and 21 were non-metropolitan rural (RUC 8 and 9)
(United States Department of Agriculture Economic Research Service, 2004).
One advantage of the rural-urban continuum codes was that areas were categorized by county,
which was a variable available in the NC Medicaid paid claims data, whereas other rurality measures rely
upon zip code or population density. The 2003 rural-urban continuum codes (RUC) distinguished
between metropolitan and non-metropolitan counties by degree of urbanization and adjacency to
metropolitan/non-metropolitan areas (United States Department of Agriculture Economic Research
Service, 2004). Metropolitan was defined by the Office of Management and Budget and referred to
central counties that had one or more urbanized areas and outlying counties that have at least 25% of
workers in the county commuting to central counties. Urbanized areas were defined based on
population density. Metropolitan areas had to have a minimum population of at least 100,000. Non-
metropolitan counties were based on urban clusters and fell outside the boundaries of the metropolitan
county definition. Urban clusters in non-metropolitan counties have populations of at least 2,500 but
less than 50,000 (United States Department of Agriculture Economic Research Service, 2003).
Control Variables
Control variables for the analysis included age, sex, race, Hispanic ethnicity, dual eligibility, and
comorbidities. Two forms of comorbidities were included in the analysis 1) count of the number of
additional diagnosed comorbidities the individual had, and 2) presence of comorbid SMI diagnoses.
1.D. Data Analysis
Selection Problem
It was expected that this analysis would have a selection problem resulting from non-random
assignment to the PCMH. Randomization is one way to evaluate whether or not improvements in the

26
outcome variables are associated with the treatment (i.e. the PCMH) and affects the internal validity of
a study. Without randomization, the treatment and control groups are likely to be inherently different to
begin with, which would have made it difficult to determine if other reasons played a role in improving
outcomes. The choice to enroll in a program as well as the reasons associated with the decision created
a situation of self-selection into treatment (i.e. PCMH) and control groups (i.e. fee-for-service). In CCNC,
Medicaid beneficiaries were given the choice to enroll in the PCMH or stay in traditional fee-for-service
Medicaid. As a result, the reasons associated with a beneficiary’s choice to join the PCMH were not
known. The choice to enroll in a PCMH could have been associated with several possibilities, which was
expected to make the treatment and control groups inherently different at the start of the analysis.
The ignorability of treatment assignment in the PCMH is the main assumption to assess whether
the self-selection is a problem. The ignorability of treatment assignment assumption considers whether
assignment to either treatment or control is independent of the observable outcomes (Guo & Fraser,
2010); when treatment assignment is not random, the ignorability of treatment assignment assumption
is violated. Therefore, adjustments would need to be made to the data because the treatment and
control groups would be unequal and part of the results on the dependent variable would be wrapped
up in the self-selection (e.g. non-randomization) into the treatment group.
Correcting the Selection Problem
Several options were available to address the selection problem. Those options included
traditional multivariable modeling to control for individual characteristics, instrumental variables, or
propensity score methods (Guo & Fraser, 2010; Kennedy, 2004; Wooldridge, 2005). Traditional
multivariable modeling addresses the selection problem by controlling for as many individual
characteristics associated with the likelihood of enrolling in the PCMH as possible (Kennedy, 2004;
Wooldridge, 2005). By controlling for these characteristics, it is assumed that the model accounts for the

27
difference between those in the PCMH and those who stayed in traditional fee-for-service Medicaid.
Unfortunately, there were a limited number of individual characteristic variables in the Medicaid paid
claims data that could be used to control for differences between the groups. Individual level fixed
effects could be used in conjunction with the individual characteristics in the data to control for
individual unobserved time invariant characteristics not observed in the data. Even after controlling for
individual characteristics that were available in the data and using fixed effects, there would still likely
be unobserved time-varying characteristics associated with the likelihood of enrolling in the PCMH. Not
controlling for the unobserved characteristics would have biased the results of the regression analyses
and only partially corrected the selection problem. There was an additional issue with using traditional
multivariable modeling with individual level fixed effects due to time invariance of certain variables in
the model. Specifically, the rural indicator varied very little over time and would have fallen out of a
fixed effects regression analysis. While the main explanatory variable for Aim 1, the rural X medical
home interaction would still be estimated, it would not be possible to estimate the effect of rurality on
the outcome measures.
The second option to address the selection problem was instrumental variables (Kennedy, 2004;
Wooldridge, 2005). Instrumental variables estimate the amount of variation in the treatment variable
(i.e. the medical home indicator) that is induced by one or more instruments through a structural
equation and removes the correlation between the treatment variable and the error term. A valid
instrument must (1) affect the treatment variable, but (2) have no direct effect on the dependent
variables of interest. The instrument would in a sense act as a randomizer. At least one instrument is
needed for exact identification that will allow structural equation modeling to be used. Unfortunately,
identifying a strong instrument that affects likelihood of being in the PCMH, but not correlated with the
health services utilization or the quality of care measures can be difficult to accomplish. Using a weak
instrument would likely bias the regression estimates and possibly produced worse regression estimates

28
than if no instrument were used. County CCNC rates has been discussed as a good instrument because it
would affect the likelihood of being in the PCMH, but not correlated with the outcome measures.
Further testing is needed to determine if this would be a strong instrument for this study.
The third option to address the selection problem was propensity score methods. Propensity
score methods provide a way to solve the problem of non-randomization by creating weights or
matched treatment and control groups based on characteristics associated with the likelihood of
selecting into the treatment group. One significant limitation of propensity score methods is that
developing the propensity scores depends on having observable data on the characteristics associated
with the likelihood of selecting into the treatment group. If there were characteristics associated with
this likelihood of selection that were unobservable in the data, the propensity score methods would not
sufficiently correct for the selection issue. Several propensity score methods exist and there is no
consensus on which matching method is best (Basu, Polsky, & Manning, 2011; Guo & Fraser, 2010). One
type of propensity score method is nearest neighbor matching, which creates a ‘neighborhood’ with an
individual in the control group matched with an individual in the treatment group by the smallest
distance between the control observation score and the treatment observation score. The goal was to
maximize the number of exact matches while not excluding or dropping too many observations because
they was not an exact match to the treatment group (Guo & Fraser, 2010). Once a match was found, the
observation was removed without replacement. (Guo & Fraser, 2010). Another propensity score method
is propensity score weighting, which takes the propensity scores and estimates weights to be used in the
regression analysis. The propensity score weights then are used to reweight the treatment and controls
to make them representative of the overall sample population. The use of propensity score weights
allows for the selection problem to be corrected without losing the sample size that is lost under
propensity score matching. Recent simulation studies of propensity score methods determined that
propensity score weighting is most likely to produce unbiased results as long as the propensity score

29
model is correctly specified (Basu, et al., 2011). Based on this, propensity score weighting was used as
the correction for the selection problem in this analysis.
The first step of propensity score weighting used a logistic regression model with conditioning
variables that provided the propensity scores used in step two. The dependent variable was the medical
home indicator of whether a person with SMI was in the PCMH or traditional fee-for-service Medicaid.
Then, the conditioning variables were used to optimize the propensity score estimates. These
conditioning variables were risk factors associated with the likelihood of being in the PCMH (i.e. the
variables affecting the selection bias).
Correct specification of the logistic regression model of the likelihood of being in the PCMH was
important to produce unbiased results. A similar set of covariates used in the propensity score model in
Domino et al. (under review) was used for the propensity score model in this analysis. Demographic
characteristics of age, sex and rural residence were controlled for since older patients and women may
have been more likely to enroll in the PCMH. Someone who is older might have had more contact with
the health care providers and may have found the additional care management available from the
PCMH helpful to navigate the health care system. Similarly, women tend to be higher users health
services and may prefer the PCMH model. As higher users of health services, people with additional
physical health comorbidities may prefer to have access to better care management services available in
the PCMH and were controlled for in the propensity score model. It was hypothesized that selection into
the PCMH would also be affected by the severity of the mental illness because less severe cases could
prefer the PCMH, while more severe cases would prefer the flexibility of fee-for-service. A proxy
measure for severity of mental illness was created based on categorical eligibility for Medicaid because a
direct measure of illness severity was not available in the Medicaid paid claims data. This indicator
assessed whether an individual qualified for Medicaid as ‘disabled’ or under a different category. This
measure was not able to determine if the qualification for Medicaid based on social security disability

30
standards was due to severe mental illness or a disabling physical condition, but it was thought to
suggest an overall more severe, disabling illness state. This would mean that Medicaid beneficiaries with
SMI who were categorically eligible as disabled would generally be more severely ill than those Medicaid
beneficiaries with SMI who were eligible for Medicaid under a different category.
The likelihood ratio test was used to check correct specification of the propensity score model.
The likelihood ratio test is the ratio of likelihood functions from an unrestricted and a restricted model.
The null hypothesis stated that the log-likelihood should be approximately equal in both the restricted
and unrestricted models. The likelihood ratio test was used to test the functional form of age,
specifically the quadratic of age, in the propensity score model. The likelihood ratio test rejected the null
hypothesis that the quadratic of age has no effect on the probability of enrolling in a medical home;
therefore, the quadratic form of age was also used in the final propensity score model.
The logistic regression model to determine the propensity scores was:
( ) ( ) ( ) ( ) ( )
Where, =medical home indicator (PCMH vs. fee-for-service)
Comorbidity = count of diagnosed comorbidities
Disability = indicator of Medicaid categorical eligibility as disabled
Dual=indicator of dual eligibility for Medicaid and Medicaid
MH Diagnosis=indicator of diagnosis with depression, bipolar disorder, and/or
schizophrenia
X=demographic characteristics: age, age2, sex, race, ethnicity, rural residence
The estimates from modelling the likelihood of selecting the PCMH were then used to create the
propensity score weights. The average treatment effect was used to calculate the propensity score

31
weights. Both the average treatment effect and the average effect of treatment on the treated were
reviewed. The average treatment effect is the average change in the outcomes if the whole population
were changed from the control group to the treatment group. The average effect of treatment on the
treated is a subgroup of the average treatment effect that only considers the population that received
treatment. For policy relevance, the average treatment effect was used since it has the greatest
generalizability to the population.
One challenge of using propensity score weighting with generalized estimating equations (GEE)
to model the effect of health services utilization and medication adherence outcomes was that GEE does
not allow the propensity score weights to vary per person per period. In order to use propensity score
weights with the GEE models, it was necessary to use propensity score weights created at the individual
level rather than the person-month level. If propensity score weights at the person-month-level did not
vary too much over time, it was assumed that the propensity score weights at the individual level could
be used. In order to create propensity score weights that change over time the propensity score logistic
regression model was run at the person-month level with time covariates in the model. The propensity
scores from the person-month level model were then used to create the average treatment effect
weight. This weight was then graphed over each person-month for the study period of 2004-2007
(Figure 2.1). The propensity score weights for the SMI sample and each SMI diagnosis at the person
month level take on values between 0.83 and 0.89. A visual assessment of Figure 2.1 also showed that
the graph of the person-month level weights over time did not significantly vary from month to month.
Since there was very little variation in the person-month level weights, it was determined that
propensity score weights created at the individual level at one point in time would be used.
The GEE models were run on the full SMI sample as well as on each of the individual SMI
diagnoses of major depression, bipolar disorder, and schizophrenia. Four types of propensity score
weights were created based on diagnoses: (1) full SMI sample, (2) major depression only, (3) bipolar

32
disorder only, and (4) schizophrenia only. These four weights were created in order to have accurate
weights for each model. For example, using a weight created based on the full SMI sample on the model
for the bipolar disorder only sample would take into account not only the characteristics of people with
bipolar disorder, but also the characteristics of people with the other SMI diagnoses as well. Using the
weights created based the full SMI sample for the diagnosis specific models would likely lead to higher
standard errors in the final GEE models than would be found when using the diagnosis specific weights
(Guo & Fraser, 2010).
The formula for the average treatment effect weights was:
(
( )) (
( ))
In the formula, pscore refers to the propensity score from logistic regression model, treatment equals
one when an individual is in the PCMH, zero if they are in fee-for-service, and control equals one when
an individual is in fee-for-service, zero if they are in the PCMH.
Standardized differences of the means were used to determine balance across the PCMH and
non-PCMH groups. The standardized difference compares the absolute difference in the sample means
divided by the pooled standard deviation of the variable (Austin, 2008). Standardized differences above
10% in absolute value indicated a serious imbalance and weighting was considered successful when the
standardized differences were less than 10% (d’Agostino, 1998). The formulas for the standardized
differences of continuous and binary variables were:
Continuous variables: (| ̅ ̅ |
√
)
33
Binary variables: (| ̂ ̂ |
√ ̂ ( ̂ ) ̂ ( ̂ )
)
Analytical Model: Generalized Estimating Equations
Generalized estimating equation (GEE) models were used to model the effect of health services
utilization and quality of care outcomes rather than traditional multivariable regression models (i.e.
logistic regression, linear regression, or count models). The main drawbacks of traditional multivariable
regression models for this analysis were that they have difficulty accounting for time-series nature of
the data that was used. The main assumptions of generalized linear models are that observations are
independent of one another and identically distributed (Hardin & Hilbe, 2007; Liang & Zeger, 1986);
however, GEE, a form of generalized linear models, takes into account correlation across observations
that makes the observations not independent of one another. This increases the efficiency of the
estimating equation and produces consistent estimates of the coefficients and the variance estimates
(Liang & Zeger, 1986). The estimates produced from GEE have a population average interpretation. For
correct model specification, GEE requires that the family, link function, and correlation structure be
chosen prior to running the regression models (Hardin & Hilbe, 2007; Liang & Zeger, 1986).
The family chooses the probability distribution associated with the type of each dependent
variable. For the continuous variable (prescription adherence), the gamma distribution was the
designated family. For the count variables (visits), the Poisson distribution was the designated family.
The negative binomial was evaluated, but was not used because of negative binomial family produced
estimates that were unexpected and inconsistent with results found by Domino et al. (under review).
Therefore, the Poisson family was used for this analysis which was also used by Domino et al. (under
review).
The link function, associated with the family chosen, reflects the relationship between the
combination of covariates in the model and the mean of the family. The ideal link function produces the

34
correct range of values associated with the type of dependent variable. The log-link was used for all of
the dependent variables in the analysis. Given that the continuous variable was skewed to the right, the
log-link was appropriate to adjust for this skewness. For the count variables, the log-link was used over
the negative binomial link. While the negative binomial link may have been appropriate to address
overdispersion in the Poisson distribution, Hardin and Hilbe (2007) discuss that the negative binomial
link often has estimation problems and the log-link is a better fit for count variables.
The correlation structure is necessary to account for the correlation across the observations for
each individual. Several correlation structures were available to choose from, including exchangeable,
auto-regressive, stationary, non-stationary, unstructured, and fixed. The choice of correlation structure
for each type of variable was tested for using the quasi-likelihood information criteria (QIC). The
correlation structure with the smallest QIC value was used.
The exchangeable and auto-regressive correlation structures were evaluated for the best fit for
the correlation across observations in this analysis. Exchangeable correlation structure would occur
when the repeated observations for each individual occur in no particular order, which suggests that
there is no time dependence between the observations. This correlation structure was thought to occur
in this analysis because having health care visits is not always time dependent across observations,
though it could be for some individuals who use health care services on a regular basis. For this reason,
the auto-regressive correlation structure was reviewed. The autoregressive correlation structure
assumes that there is time dependence between the observations over time. Specifically, it assumes
that there is a natural order to the repeated observations for each individual. This correlation structure
was thought to occur with the visits variables, particularly the primary care visits and outpatient mental
health visits when follow-up appointments are scheduled. A visit to one of these health care settings
might naturally lead to additional appointments over a period. Additionally, whether an individual is
adherent to prescriptions may be dependent on whether they were adherent in a previous period.
35
When comparing the QIC values for the health services utilizations variables, the GEE models
with the autoregressive correlation structure produced lower QIC values than the GEE models with the
exchangeable correlation structure. The autoregressive correlation structure depends on a correlation
between observations from month to month, but a portion of the sample was not enrolled in Medicaid
in the previous month. The GEE models with the autoregressive correlation structure treated those
observations that were not enrolled in Medicaid in the previous month as missing. For policy relevance,
it was determined that it was not realistic to compare the results of people who only continuously
enrolled in Medicaid, which occurred with the autoregressive correlation structure. A third correlation
structure, the unstructured correlation structure was also evaluated, but not used because the model
did not converge and could not produce estimates with this correlation structure. This often occurs
when the data is unbalanced (Hardin & Hilbe, 2007). There were gaps in the data because people with
SMI were not required to be continuously enrolled in Medicaid throughout the study period. As a result,
despite having a higher QIC value, the exchangeable correlation structure was used.
Robust standard errors were used for all of the models. As previously stated, the GEE models
were run on the full propensity score weighted SMI sample and by each individual SMI diagnosis. The
estimates produced from GEE were the population average effect. The models produced estimates of
the monthly effect since the data was at the person-month level. For ease of interpretation, the monthly
effect was scaled up to show annual effect. Marginal effects for each of the variables in the model were
obtained using the ‘margins’ command in Stata 12. For each variable, the margins command produces
the average marginal effect by calculating the marginal effect each observation and then averages all
of the marginal effects. The effect of the rurality X medical home interaction was more complicated
and was evaluated by calculating the effect of the PCMH on a simulated experiment of the full sample
living in an urban area, then changing the full sample to be living in a non-metropolitan urban area, and
finally, changing the full sample to be living in a rural area. Post-estimation tests were conducted to

36
determine if there was a significant difference between the estimates of effect of the PCMH on the
simulated experience across each geographic area.
The final specification of the Aim 1 model was:
( ) ( ) ( ) ( )
( ) ( )
Where, Y= outcome measures: count of the number of visits (primary care, specialty mental health,
inpatient hospitalizations or emergency departments) or medication adherence
Rurality=indicator of urban, non-metropolitan urban or rural residence
PCMH= indicator of enrollment in PCMH
Rurality X PCMH=interaction between rurality and PCMH
Comorbidity= count of diagnosed comorbidities
MH Diagnosis=indicator of diagnosis with depression, bipolar disorder, and/or schizophrenia
X=demographic characteristics: age, sex, race, ethnicity
Aim 2 Methods
To determine whether the performance of PCMHs on health services utilization and quality of care for patients with SMI in rural areas varies with primary care provider experience with SMI.
2. A. Data
The same North Carolina Medicaid paid claims data during 2004-2007 collapsed to the person-
month level and the county level 2003 Rural-Urban Continuum codes used in Aim 1 were used in Aim 2.
2.B. Sample
The sample for Aim 2 was limited to patients with SMI living in rural areas based on the rural-
urban continuum codes for each county (RUC 8 and 9) and in a PCMH. Limiting the sample to patients

37
with SMI living in non-metropolitan rural counties focused the analysis on 21 of North Carolina’s 100
counties. There was a total of 5,308 people with SMI in the living in a rural area and in the PCMH, with
4,573 diagnosed with major depression, 993 diagnosed with bipolar disorder, and 636 diagnosed with
schizophrenia (Table 2.1).
2.C. Variables
Dependent Variables
In addition to the mental health and physical health services utilization and medication
adherence variables from Aim 1, two additional utilization measures were used for Aim 2.
The any visit variables looked at the likelihood of having a visit to certain health care settings.
They were binary indicators of whether an individual had an inpatient hospitalization or had an
emergency department visit during the study period. These outcomes were added to Aim 2 because the
average count of inpatient hospitalizations and emergency department visits among the rural PCMH
sample was, on average, less than one (Table 4.1). The likelihood of having any visit was expected to
determine whether seeing a primary care provider with more experience managing SMI has an impact
on visiting these settings at any point during the study period.
Main Explanatory Variable
Experience with SMI was based on the number of people with SMI seen by an individual’s
primary care provider in the month. This measure assessed the situation where certain primary care
providers see a higher number of patients with complex needs, and as a result would have more
experience with this population in the PCMH and improve patient outcomes. The final version of the
variable was a binary indicator of an individual visited a primary care provider with a high vs. low count
of the number of people in a practice with a diagnosis of depression, bipolar disorder, or schizophrenia

38
in the month. The underlying continuous variable was operationalized by tallying the number of people
with SMI associated with each primary care provider ID in the Medicaid paid claims in the month. The
binary variable then used the cut point for high/low was placed at the 90th percentile, primary care
provider with 203 patients in the month. The range of the underlying continuous variables was large (1-
1,635) and 90% percentile was the point where was a shift in the volume of patients from lower volume
to the very high volume (Figure 2.2). Other studies of volume also used a binary indicator to measure
volume rather than the underlying continuous variable (Druss, et al., 2004; Halm, et al., 2002). The QIC
was used to determine the correct specification of experience with SMI variable to use in the GEE
models. The QIC with the lowest value showed that the binary version of experience with SMI, with the
cut point at the 90th percentile should be used.
Control Variables
The same control variables from Aim 1 were used for Aim 2. An indicator for whether an
individual received care from a federally qualified health center was also used.
2.D. Data Analysis
Analytical Model: Generalized Estimating Equations (GEE)
The same family used in Aim 1 was used for the continuous and count variables. The binary
variable (any visit) used the binomial family. The same link function used in Aim 1 was used for the
continuous and count variables. The binary variable used the logit-link function. The correlation
structure was evaluated using the QIC. As in Aim 1, the exchangeable, auto-regressive and unstructured
correlation structures were reviewed. The exchangeable correlation structure produced the lowest
value of QIC and was used for each of the outcome measures in the Aim 2 analysis. The GEE models

39
were run on the full rural PCMH SMI sample and by each individual SMI diagnosis. Robust standard
errors were also used for all of the models.
The final specification of the Aim 2 model on the rural PCMH sample was:
( ) ( ) ( ) ( )
( ) ( )
Where, Y= outcome measures: count of the number of visits (primary care, specialty mental health,
inpatient hospitalizations or emergency departments), medication adherence, or any visits
(inpatient hospitalizations, emergency departments)
Experience=indicator of high vs. low experience
Comorbidity = count of diagnosed comorbidities
MH Diagnosis=indicator of diagnosis with depression, bipolar disorder, and/or schizophrenia
Dual=indicator of dual eligibility for Medicaid and Medicaid
FQHC=indicator of care received from a federally qualified health center
X=demographic characteristics: age, sex, race, ethnicity
Aim 3 Methods
To assess the extent to which the performance of PCMHs on health services utilization and quality of care for patients with SMI in rural areas varies with mental health workforce shortages and experience with SMI.
3. A. Data
The same North Carolina Medicaid paid claims data during 2004-2007 collapsed to the person-
month level and the county level 2003 Rural-Urban Continuum codes used in Aim 1 were used in Aim 3.
North Carolina 2006 county-level mental health workforce shortage data was also added.

40
The mental health workforce shortage data provided county-level shortage scores from all
counties in the United States as of 2006. The shortage scores represented unmet need as a proportion
of the total need in a county (Thomas, et al., 2009). Unmet need measured as the difference between
county need and supply. Supply of mental health providers was the estimate of full-time equivalent
providers in a county based on all types of mental health providers, including psychiatrists,
psychologists, advanced practice psychiatric nurses, social workers, licensed professional counselors and
marriage and family therapists. Need was the estimate of full-time provider equivalents needed in a
county based on actual mental health services utilization among people with SMI and adjusted for need
potentially met by primary care providers. Both of the need and supply estimates were also adjusted to
account for travel to a provider within a 60-minute radius (Thomas, et al., 2009). The final shortage
score is on a scale from 0-100%.
3.B. Sample
The same rural sample from Aim 2 was used for Aim 3.
3.C. Variables
Dependent Variables
The same mental health and physical health services utilization and medication adherence
variables from Aim 2 were used for Aim 3.
Main Explanatory Variable
Workforce X Experience was an interaction between mental health workforce supply and
experience with SMI to capture the interaction effect of mental health workforce shortage areas and
provider experience with SMI.

41
Mental Health Workforce Supply was binary variable based on an underlying continuous
measure the severity of mental health provider shortage in the county where a patient with SMI lives on
a scale of 0-100. Severity of mental health provider shortage in the county is based on the percent of
unmet need for mental health professionals in a county as conceptualized in the literature with a higher
percent of unmet need for mental health professionals equal to lower mental health workforce supply
(Thomas, et al., 2009). The final variable was a binary indicator high vs. low shortage of mental health
providers in a county. Based on the distribution of the percent of unmet need for the rural PCMH
sample, there was not a clear cut point for the binary indicator (Figure 2.3). As a result, two versions of
the binary indicator were created. One version had a cut point at median (50th percentile; 39.47% unmet
need), the second version had a cut point at the 75th percentile (43.93% unmet need). Sensitivity
analyses were conducted on the unmet need cut points by running the GEE models with each version of
the binary indicator. The results between the models were very similar in terms of statistical significance
for both the binary indicator and the interaction effect. The version of the binary indicator cut at the
median was used for the main analyses.
Experience with SMI was the binary variable an individual visited a primary care provider with a
high vs. low count of the number of people in a practice with a diagnosis of depression, bipolar disorder,
or schizophrenia in the month used in Aim 2.
Control Variables
The same control variables from Aim 2 were used for Aim 3.

42
3.D. Data Analysis
Analytical Model: Generalized Estimating Equations(GEE)
Since the same dependent variables from Aim 2 were used for Aim 3, the same GEE models
were used for Aim 3 as well. As with Aim 2, the GEE models were run on the full rural PCMH SMI sample
and by each individual SMI diagnosis. Robust standard errors were also used for all of the models.
The final specification of the Aim 3 model on the rural PCMH sample was:
( ) ( ) ( )
( ) ( ) ( ) ( ) ( )
Where, Y= outcome measures: count of the number of visits (primary care, specialty mental health,
inpatient hospitalizations or emergency departments), medication adherence, or any visits
(inpatient hospitalizations, emergency departments)
Experience=indicator of high vs. low primary care provider volume of people with SMI in the
month
Workforce= indicator of high vs. low shortage of mental health providers
Experience X Workforce= interaction between experience indicator and workforce indicator
Comorbidity = count of diagnosed comorbidities
MH Diagnosis=indicator of diagnosis with depression, bipolar disorder, and/or schizophrenia
Dual=indicator of dual eligibility for Medicaid and Medicaid
FQHC=indicator of care received from a federally qualified health center
X=demographic characteristics: age, sex, race, ethnicity
43
CHAPTER 3: RESULTS: AIM 1
Aim 1: To determine if differences in health services utilization and quality of care exists for patient-centered medical home status between rural and urban areas for Medicaid patients with SMI.
3.A. Descriptive Statistics
The SMI sample (n=195,718) was comprised of people with major depression (81.8%), bipolar
disorder (20.4%), and schizophrenia (16.7%) as well as some overlap between each of these diagnoses
(Table 3.1). The majority of the sample lived in urban areas, were female, and white. Fifty six percent of
the people with SMI were enrolled in a medical home at some point during the study period. The people
with SMI in a medical home were younger (38.9 yrs. vs. 52.5 yrs.), less likely to be dually eligible to
Medicare and Medicaid (18% vs. 57%), less likely to be categorically eligible for Medicaid as disabled
(52% vs. 56%) and had fewer comorbidities (6.8 vs. 7.6) than people with SMI not in a medical home (i.e.
fee-for-service) (Table 3.1).
The sample of people with major depression (n=160,202) on average lived in urban areas, were
female, and Caucasian (Table 3.2). A small percentage of people with major depression also had
comorbid mental health diagnoses; 14% of people with major depression also had a bipolar diagnosis,
7% of also had a schizophrenia diagnosis and 2.5% had both bipolar disorder and schizophrenia
diagnoses along with their major depression diagnosis. The majority of people with major depression
(58%) were enrolled in a medical home. Among the people with major depression in a medical home,
they were younger (38.88 yrs. vs. 53.47 yrs.), less likely to be dually eligible to Medicare and Medicaid
(17% vs. 55%), less likely to be categorically eligible for Medicaid as disabled (49% vs. 53%) and had
fewer comorbidities (7 vs. 8) than people with major depression not enrolled in a medical home (Table
3.2).

44
The sample of people with bipolar disorder (n=39,848) on average lived in urban areas, were
female, and Caucasian (Table 3.3). Among people with bipolar disorder, 56% also had a diagnosis of
major depression, 18.79% also had a schizophrenia diagnosis and 10% were diagnosed with all three SMI
diagnoses (i.e. bipolar disorder, schizophrenia, and major depression). The majority of people with
bipolar disorder (60%) were enrolled in a medical home. Among people with bipolar disorder in a
medical home, they were younger (36 yrs. vs. 45yrs.), less likely to be dually eligible to Medicare and
Medicaid (19% vs. 55%), and less likely to be categorically eligible for Medicaid as disabled (57.5% vs.
72.5%) as compared to people with bipolar disorder not in a medical home (Table 3.3).
Among the sample of people with schizophrenia (n=32,791), the majority of lived in urban areas,
were female, and Caucasian (Table 3.4). Thirty four percent of people with schizophrenia also had a
diagnosis of major depression, 22.8% also had a diagnosis of bipolar disorder and 12% were diagnosed
with all three SMI diagnoses (i.e. schizophrenia, major depression, and bipolar disorder). Unlike the
sample of people with major depression and the sample with bipolar disorder, the majority of people
with schizophrenia (56%) were not enrolled in a medical home. Among the people with schizophrenia in
a medical home, they were younger (42 yrs. vs. 51%), less likely to be dually eligible to Medicare and
Medicaid (31% vs. 71%) and more likely to be categorically eligible for Medicaid as disabled (91% vs.
79%) than people with schizophrenia not in a medical home (Table 3.4).
Standardized differences of the unweighted means showed that the characteristics
hypothesized to be associated with selection into the medical home were greater than 10 for major
depression diagnosis, schizophrenia diagnosis, age, gender, African-American, dual eligibility, categorical
eligibility as disabled, and the number of comorbidities. This indicates that there was an imbalance
between the medical home and non-medical home on these characteristics. After each of the samples
were weighted, the standardized differences of the characteristics hypothesized to be associated with

45
selection into the medical home were all less than 10%, showing a strong balance of each of the
samples.
3.B. Primary Care Visits
Consistent with Domino et al. (under review), the results of the GEE models showed that for the
average person with SMI, enrollment in a medical home was associated with having more primary care
visits as compared to the average person with SMI not enrolled in a medical home (Table 3.5).
Interestingly by SMI diagnosis, people with bipolar disorder and people with schizophrenia in a medical
home were both associated with having nearly six average annual primary care visits as compared to the
people with bipolar disorder and people with schizophrenia not enrolled in a medical home, but the
people with major depression in a medical home had nearly five average annual primary care as
compared to the people with major depression not enrolled in a medical home.
As compared to the average person with SMI living in an urban area, the average person with
SMI in living in a non-metropolitan urban or a rural area was associated with fewer annual primary care
visits, but the results were not statistically significant. By SMI diagnosis, the higher number of annual
primary care visits for the people with major depression living in an urban are consistent with the overall
SMI results; however, people with bipolar disorder and people with schizophrenia living in a rural area
were both associated with more annual primary care visits as compared to the people with bipolar
disorder or people with schizophrenia living in an urban area, though these results were also not
statistically significant.
Enrollment in a medical home was associated with a higher number of primary care visits across
all three geographic regions for the average person with SMI (Table 3.6). The average person with SMI in
an urban medical home had five more annual visits to primary care as compared to the average person
with SMI not in a medical home. Additionally, the people with SMI in non-metropolitan urban and rural

46
medical homes had fewer primary care annual visits than the people with SMI in an urban medical
home, approximately four annual primary care visits. By SMI diagnosis, the results for people with major
depression were consistent with the results for the overall SMI results; people with major depression
had more annual primary care visits primary care visits across all three geographic regions, with people
with major depression in an urban medical home having more annual primary care visits than people
with major depression in non-metropolitan urban and rural medical homes as compared to people with
major depression not in a medical home. People with bipolar disorder and people with schizophrenia in
an urban medical home had six more annual visits to primary care as compared to people with bipolar
disorder or schizophrenia not in a medical home. Surprisingly, people with bipolar disorder in a rural
medical home had nearly seven annual visits to primary care as compared to people with bipolar
disorder not in a medical home. There was a significant difference in the annual increase in primary care
visits between urban and non-metropolitan urban medical homes for people with SMI and by each of
the SMI diagnoses examined. There was also a significant difference in the annual increase in primary
care visits between urban and rural medical homes for people with schizophrenia.
Among the SMI diagnoses examined, the presence of an additional SMI diagnosis was associated
with fewer in annual primary care visits as compared to those without an additional SMI diagnosis,
except among people with bipolar disorder or schizophrenia and major depression diagnosis (Table 3.5).
Across all of the SMI diagnoses examined, an additional comorbidity was associated with an annual
increase of nearly one primary care visit. Race was associated with a decrease in annual visits to primary
care providers, with African Americans, on average, having two fewer annual primary care visits as
compared to Caucasians across all of the diagnoses examined.

47
3.C. Specialty Mental Health Visits
Enrollment in a medical home for the average person with SMI was associated with minimally
more annual specialty mental health visits as compared to the average person with SMI not enrolled in a
medical home (Table 3.7). These results are consistent with the results for people with major depression
and people with schizophrenia.; however, enrollment in a medical home for people with bipolar
disorder was associated an increase of two annual specialty health visits as compared to people with
bipolar disorder not enrolled in a medical home.
Interestingly, the average person with SMI living in a rural area was associated with significantly
higher annual specialty mental health visits as compared to the average person with SMI living in an
urban area. Specifically, the average person with SMI living in a rural area had 3.6 more annual specialty
mental health visits as compared to the average person with SMI living in an urban area. Looking by
diagnosis, the increase in annual specialty mental health visits ranged from two more annual specialty
mental visits for people with major depression living in a rural area to 13 more annual specialty mental
health visits for people with schizophrenia living in a rural area as compared to the each of the SMI
diagnoses examined living in an urban area.
Specialty mental health visits only minimally increased for the average person with SMI in the
urban or non-metropolitan urban medical homes as compared to the average person with SMI not in a
medical home (Table 3.8). Surprisingly, in rural medical homes, the average person with SMI had fewer
annual specialty mental health visits as compared to the average person with SMI not in a medical
home. By SMI diagnosis, the SMI results were consistent with the results for people with major
depression and people with schizophrenia. Specifically, people with major depression in a rural medical
home had approximately two fewer annual specialty mental health visits as compared to people with
depression not in a medical home and people with schizophrenia in a rural medical home had
approximately 12 fewer annual specialty mental health visits as compared to people with schizophrenia

48
not in a medical home. Interestingly, people with bipolar disorder in an urban medical home had three
more annual specialty mental health visits as compared to people with bipolar disorder not in a medical
home.
Among the SMI diagnoses examined, the presence of an additional SMI diagnosis was associated
with an increase in annual specialty mental health visits as compared to those without an additional SMI
diagnosis, except among people with bipolar disorder or schizophrenia and major depression or bipolar
disorder diagnosis (Table 3.7). Race was associated with fewer annual visits to specialty mental health
providers, with African American having approximately one to two fewer annual specialty mental health
visits for people with major depression and bipolar disorder, but 11 fewer annual specialty mental
health visits for people with schizophrenia as compared with Caucasians. As compared to women, men
had approximately four additional annual specialty mental health visits among people with major
depression or people with bipolar disorder, but nearly eight fewer annual specialty mental health visits
among people with schizophrenia. An additional comorbidity was associated with an increase of one to
two annual specialty mental health visits for people with major depression or people with bipolar
disorder, but nearly four fewer annual specialty mental health visits for people with schizophrenia.
3.D. Inpatient Hospitalizations
The results of the GEE models showed that for the average person with SMI, enrollment in a
medical home was associated with fewer annual inpatient hospitalizations as compared to the average
person with SMI not in a medical home (Table 3.9). The SMI results were consistent with each of the SMI
diagnoses examined. Specifically, people with major depression, with bipolar disorder or with
schizophrenia in a medical home had approximately one fewer annual inpatient hospitalization as
compared to people with major depression, with bipolar disorder or with schizophrenia not in a medical
home.

49
As compared to the average person with SMI living in an urban area, the average person with
SMI in living in a non-metropolitan urban or a rural area was associated with minimally fewer annual
inpatient hospitalizations (i.e. less than one annual inpatient hospitalization). The SMI results were
consistent with each of the SMI diagnoses examined.
The annual number of inpatient hospitalizations for the average person with SMI in a medical
home decreased across all three geographic regions as compared to the average person with SMI not in
a medical home (Table 3.10). This result was consistent by each of the SMI diagnoses examined. People
with major depression and people with bipolar disorder in an urban medical home, a non-metropolitan
urban medical home or a rural medical home decreased inpatient use by over one annual inpatient
hospitalization as compared to people with major depression and people with bipolar disorder not in a
medical home. People with schizophrenia in a medical home across all three geographic regions also
decreased the annual inpatient hospitalizations, but by less than one annual inpatient hospitalization as
compared to people with schizophrenia not in a medical home. There was a significant difference in the
annual decrease in inpatient hospitalizations between urban and non-metropolitan urban medical
homes for people with SMI and by each of the SMI diagnoses examined. There was also a significant
difference in the annual decrease in inpatient hospitalizations between urban and rural medical homes
for people with schizophrenia.
Among the SMI diagnoses examined, the presence of an additional SMI diagnosis was associated
with fewer annual inpatient hospitalizations as compared to those without an additional SMI diagnosis,
except among people with bipolar disorder or schizophrenia who had more annual inpatient
hospitalization (Table 3.9). As compared to women, men had higher annual of inpatient hospitalizations
across all of the SMI diagnoses examined. Across all of the SMI diagnoses examined, ethnicity was
associated with an increase in average annual inpatient hospitalizations, with being of Hispanic ethnicity

50
associated with an increase of one to two inpatient hospitalizations as compared to other ethnic
backgrounds.
3.E. Emergency Department Visits
For the average person with SMI, enrollment in a medical home was associated with fewer
emergency department visits as compared to the average person with SMI not enrolled in a medical
home (Table 3.11). By SMI diagnosis, the SMI results were consistent with each of the SMI diagnoses
examined. Specifically, people with major depression, with bipolar disorder or with schizophrenia in a
medical home had between 0.38-0.7 fewer annual emergency department visits as compared to the
people with major depression, with bipolar disorder or with schizophrenia not in a medical home.
As compared to the average person with SMI living in an urban area, the average person with
SMI in living in a non-metropolitan urban area was associated with somewhat higher annual emergency
department visits, but fewer annual emergency department visits when living in a rural area. This result
was consistent with the results for people with major depression or bipolar disorder. However, as
compared to people with schizophrenia living in an urban area, people with schizophrenia living in a
non-metropolitan urban or a rural area was associated with fewer annual emergency department visits.
The annual number of emergency department visits for the average person with SMI in a
medical home decreased across all three geographic regions as compared to the average person with
SMI not in a medical home (Table 3.12). This result was consistent by each of the SMI diagnoses
examined, except for people with schizophrenia in a rural medical home. People with major depression
and people with bipolar disorder in an urban medical home, a non-metropolitan urban medical home or
a rural medical home decreased annual emergency department visits by between 0.5-0.78 emergency
department visits as compared to people with major depression and people with bipolar disorder not in
a medical home. People with schizophrenia in a medical home only decreased annual emergency

51
department visits in urban and non-metropolitan medical homes. There was only a significant difference
in the annual decrease in emergency department visits between urban and rural medical homes as well
as between urban and non-metropolitan urban medical homes for people with schizophrenia
Among the SMI diagnoses examined, the presence of an additional SMI diagnosis was associated
with fewer annual emergency department visits as compared to those without an additional SMI
diagnosis, except among people with a major depression and bipolar disorder diagnosis (Table 3.11). An
additional comorbidity was associated with higher annual emergency department visits by
approximately 0.5 visits across all of the diagnoses examined.
3.F. Medication Adherence
The GEE results for medication adherence are presented by each SMI diagnosis examined since
there is not a medication adherence measure for SMI. Enrollment in the medical home was associated
with higher monthly prescription adherence for depression, bipolar disorder and schizophrenia
medications for people with each SMI diagnosis as compared to not being enrolled in a medical home
(Table 3.13). For people with major depression or with bipolar disorder medication adherence was
higher by 5.7% and 6.5% in a medical home as compared with people with major depression or people
with bipolar disorder not in a medical home.
Medication adherence was higher for people with major depression, with bipolar disorder, or
with schizophrenia living in a rural area as compared to people with major depression, with bipolar
disorder, or with schizophrenia living in an urban area
People with major depression in the urban medical home had an average monthly increase in
medication adherence of 6%, while people with major depression in the non-metropolitan urban
medical home had a monthly increase in medication adherence of 6.8%. Similarly, people with bipolar
disorder in the urban medical home had a monthly increase in medication adherence of 6.7%, while

52
people with bipolar disorder in the non-metropolitan urban medical home had a monthly increase in
medication adherence of 5.8% as compared to people with bipolar disorder not in a medical home.
People with bipolar disorder in rural medical homes had a monthly increase in medication adherence of
12%, which was significantly higher than the monthly increase in medication adherence observed in
urban and non-metropolitan urban medical homes. People with schizophrenia in the urban medical
home had a monthly increase in medication adherence of 15%. There was a significant difference in
average monthly medication adherence in urban and rural medical homes as well as between non-
metropolitan urban and rural medical homes for people with major depression.
Among the SMI diagnoses examined, the presence of an additional SMI diagnosis was associated
with lower medication adherence as compared to those without an additional SMI diagnosis, except
among people with bipolar disorder and schizophrenia who were more adherent to medications (Table
3.13). Across all of the diagnoses examined, African Americans were associated with an average monthly
decrease in medication adherence of 3.5% to 42% as compared to Caucasians. An additional
comorbidity was associated with a monthly increase of 1.3% to 19% in medication adherence across all
of the diagnoses examined.
3.G. Aim 1 Results Summary
The hypothesis for Aim 1 was that people with SMI in the urban PCMH would have higher health
services utilization and medication adherence than people with SMI in the rural PCMH. More
specifically, it was hypothesized that people with SMI in urban PCMHs would have more primary care
visits, more specialty mental health visits, and more adherence to medications, but fewer inpatient
hospitalizations and fewer emergency department visits than people with SMI in the rural PCMH. This
hypothesis was confirmed across all of the outcomes. Significant differences existed between urban and
rural PCMHs for specialty mental health visits for people with SMI and each of the diagnoses examined.

53
Significant differences also existed between non-metropolitan urban and urban PCMHs for primary care
visits and inpatient hospitalizations for people with SMI and for each of the diagnoses examined. It was
also observed that people with schizophrenia also had significant differences in emergency department
visits between urban and rural PCMHs as well as between urban and non-metropolitan urban PCMHs.
Overall, the findings for Aim 1 suggest that the PCMH can meet the needs of people with SMI in
both urban and rural areas by improving access to primary care services, while also reducing inpatient
hospitalizations and emergency department visits. Interestingly, differences in primary care and
inpatient utilization between urban and non-metropolitan urban PCMHs suggests that non-metropolitan
urban PCMHs would benefit from additional resources in order to better serve people with SMI.
By diagnosis, the findings of the overall sample of people with SMI were consistent among the
major depression and the bipolar disorder samples. However, there were interesting findings among
people with schizophrenia that were different than the findings of the overall SMI sample. Across all of
the utilization measure, differences between urban and rural PCMHs for people with schizophrenia were
observed. This suggests that during study period rural PCMHs were not entirely meeting the needs of
people with schizophrenia. These findings suggest that rural PCMHs would benefit from additional
resources to assist rural primary care providers meet the needs of people with schizophrenia. In fact,
starting in 2010, CCNC began embedding a psychiatrist and behavioral health coordinators within each
of the 14 CCNC networks across the state ("A History of CCNC: The Evolution of Community Care of
North Carolina ", 2014). These psychiatrists provide consultation and referral services for the physicians
in the CCNC networks. This is a significant resource now available to the rural PCMHs that would likely
have an impact on the treatment for people with schizophrenia in rural PCMHs. Further research with
current CCNC data should be undertaken to determine whether the urban-rural PCMH differences
observed with regard to Aim 1 diminished following the introduction of psychiatric consultations for
PCMH physicians.

54
CHAPTER 4: RESULTS: AIM 2
Aim 2: To determine whether the performance of PCMHs on health services utilization and quality of care for patients with SMI in rural areas varies with primary care provider experience with SMI.
4.A. Descriptive Statistics
The rural PCMH SMI sample (n=5,274) was comprised of people with major depression
(80.26%), bipolar disorder (17.08%), and schizophrenia (11.11%) (Table 4.1). Similar to the Aim 1 sample,
there was some overlap between each of the SMI diagnoses. Among the rural PCMH sample with major
depression, 12% also had a bipolar disorder diagnosis and 4.5% had a schizophrenia diagnosis. Among
the rural PCMH sample with bipolar disorder, 56.7% also had a major depression diagnosis and 12.1%
had a schizophrenia diagnosis. Among the rural PCMH sample with schizophrenia, 32.76% also had a
major depression diagnosis and 18.6% had a bipolar disorder diagnosis.
The rural PCMH SMI sample was approximately 40 years old, female (76%), Caucasian (70%), not
dual eligible (79%), eligible for Medicaid as disabled (52%), and had approximately six comorbidities. The
rural PCMH major depression sample and the bipolar disorder sample were similar to the overall rural
PCMH SMI sample. However, the rural PCMH schizophrenia sample was different on several
characteristics. Specifically, the rural PCMH schizophrenia sample was older (45 yrs.), had fewer women
(52%), had more dual eligibles (47%), were African American (51%) and were primarily eligible for
Medicaid as disabled (91.5%) than the overall rural PCMH SMI sample.
On average, the rural PCMH SMI sample saw primary care providers that had a monthly
caseload of 123 people with SMI. People with bipolar disorder and schizophrenia saw primary care
providers that had slightly larger monthly SMI caseloads, 135 SMI caseload size and 130 SMI caseload
size, respectively. Approximately 16% of the rural PCMH SMI sample saw primary care providers with

55
SMI caseloads higher than 203 people with SMI (i.e. high experience). More people with bipolar disorder
(18.5%) and people with schizophrenia (17.75%) saw primary care providers with high SMI caseloads
than people with major depression (16%). The minority of rural PCMH SMI sample received care from a
federally qualified health center (18%). Slightly more people with schizophrenia visited federally
qualified health centers (26%) than the SMI sample average and slightly fewer people with bipolar
disorder visited federally qualified health centers (15%) than the SMI sample average. The rural PCMH
SMI sample, on average, lived in counties with 36% unmet need for mental health providers, which was
consistent among the rural PCMH major depression and bipolar disorder samples. However, the rural
PCMH schizophrenia sample lived in counties with slightly higher unmet need for mental health
providers (38%) than the other SMI diagnoses examined.
4.B. Primary Care Visits
The GEE results showed that for the average person with SMI in a rural PCMH seeing a primary
care provider with high experience with SMI (<203 people with SMI) was associated with an increase in
the number of annual primary care visits as compared with the average person with SMI seeing a
primary care provider with low experience with SMI (Table 4.2). Specifically, people with SMI who saw a
primary care provider with high experience with SMI had three more annual primary care visits than the
people with SMI seeing a primary care provider with low experience with SMI. This result was the same
for people with major depression. Seeing a primary care provider with high experience with SMI as
compared with seeing a primary care provider with low experience with SMI was not significant for the
average person with bipolar disorder and the average person with schizophrenia.
Within the rural PCMH, receiving care from a Federally Qualified Health Center (FQHC) was
associated with significantly lower annual primary care visits as compared with not receiving care from

56
an FQHC for the people with SMI as well as for all of the diagnoses examined, ranging from
approximately 12 to 22 fewer annual primary care visits.
Across all of the SMI diagnoses examined, an additional comorbidity was associated with an
annual increase of just under one annual primary care visit. Race was associated with a decrease in
annual visits to primary care providers, with African Americans, on average, having two fewer annual
primary care visits as compared to Caucasians across all of the diagnoses examined.
4.C. Specialty Mental Health Visits
Within the rural PCMH, the GEE results showed that for people with SMI seeing a primary care
provider with high experience with SMI was associated with an increase in the number of annual
specialty mental health visits as compared with people with SMI seeing a primary care provider with low
experience with SMI (Table 4.3). People with SMI who saw a primary care provider with high experience
with SMI had nearly six more annual specialty mental health visits than people with SMI seeing a
primary care provider with low experience with SMI. Higher specialty mental health visits among those
who saw a primary care provider with high experience with SMI as compared to those who saw a
primary care provider with low experience with SMI was consistent by each of the diagnoses examined,
but was only significant among people with major depression.
Receiving care from an FQHC was associated with significantly lower annual specialty mental
health visits as compared with not receiving care from an FQHC for people with SMI as well as for all of
the diagnoses examined within the rural PCMH (6.6-27 fewer annual specialty mental health visits).
Across all of the SMI diagnoses examined, an additional comorbidity was associated with an
annual increase in specialty mental health visits, but the number varied by SMI diagnosis. An additional
comorbidity was associated with just under one additional annual specialty mental health visit for
people with major depression, slightly more than two average annual specialty mental health visits for
57
people with bipolar disorder, and over four annual specialty mental health visits for people with
schizophrenia. Among the SMI diagnoses examined, the presence of an additional SMI diagnosis was
associated with an increase in annual specialty mental health visits as compared to those without an
additional SMI diagnosis for people with major depression or for people with a comorbid bipolar
disorder and schizophrenia diagnosis. However, an additional SMI diagnosis was associated with fewer
annual specialty mental health visits for people with bipolar disorder with a comorbid major depression
diagnosis or for people with schizophrenia with a comorbid major depression or bipolar disorder
diagnosis as compared with those who did not have a comorbid SMI diagnosis.
4.D. Inpatient Hospitalizations
Though not significant, for people with SMI and each of the SMI diagnoses examined (except
schizophrenia) in a rural PCMH seeing a primary care provider with high experience with SMI was
associated with a minimally lower likelihood of having an inpatient hospitalization in the month (Table
4.4) and the number of inpatient hospitalizations (Table 4.5) as compared with those in a rural PCMH
seeing a primary care provider with low experience with SMI.
For people with SMI as well as for each of the diagnoses examined, an additional comorbidity
was associated with an approximately 0.6 percentage point increase in the likelihood of an inpatient
hospitalization in the month (Table 4.4). Similarly, an additional comorbidity was associated with an
increase of half an annual inpatient hospitalization for people with SMI and each of the SMI diagnoses
examined (Table 4.5). On the other hand, in a rural PCMH, for people with SMI and each of the SMI
diagnoses examined dual eligibility was associated with an approximately three percentage point
decrease in the likelihood of having an inpatient hospitalization in the month as compared with those
who were not dually eligible (Table 4.4). Dual eligibility was also associated with approximately two

58
fewer annual inpatient hospitalizations for the average person with SMI and each of the SMI diagnoses
as compared to those who were not dual eligible (Table 4.5).
4.E. Emergency Department Visits
People with SMI and people with major depression in a rural PCMH seeing a primary care
provider with high experience with SMI was associated with a higher likelihood of an emergency
department visit in the month as compared with those who were seeing a primary care provider with
low experience with SMI (Table 4.6). Specifically, seeing a primary care provider with high experience
with SMI was associated with an approximately one percentage point increase in the likelihood of
having an emergency department visit in the month for people with SMI and people with major
depression in a rural PCMH as compared with those seeing a primary care provider with low experience
with SMI. For people with SMI and people with major depression in a rural PCMH, seeing a primary care
provider with high experience with SMI increased annual emergency department visits by approximately
half a visit as compared with those who were seeing a primary care provider with low experience with
SMI (Table 4.7).
Similar to the inpatient hospitalization results, for people with SMI as well as for each of the
diagnoses examined, an additional comorbidity was associated with an increase in the likelihood of an
emergency department visits in the month of just under two percentage points (Table 4.6). An
additional comorbidity was associated with an increase of half an annual emergency department visit
for people with SMI and each of the SMI diagnoses examined (Table 4.7). On the other hand, in a rural
PCMH, for people with SMI and each of the SMI diagnoses examined dual eligibility was associated with
an approximately two to four percentage point decrease in the likelihood of having an emergency
department visit in the month as compared with those who were not dually eligible (Table 4.6). Dual
eligibility was also associated with approximately one to two fewer annual emergency department visits

59
for people with SMI and each of the SMI diagnoses as compared to those who were not dual eligible
(Table 4.7).
4.F. Medication Adherence
While not significant, the GEE results showed that direction of the effect for people with major
depression and people with schizophrenia in a rural PCMH seeing a primary care provider with high
experience with SMI was associated with less adherence to their medications as compared with the
people with major depression and people with schizophrenia in a rural PCMH seeing a primary care
provider with low experience with SMI (Table 4.8). The results were also not significant for people with
bipolar disorder in a rural PCMH seeing a primary care provider with high experience with SMI as
compared with people with bipolar disorder in a rural PCMH seeing a primary care provider with low
experience with SMI, but the direction of the effect showed higher adherence to medications.
In a rural PCMH, an additional comorbidity was associated with an increase of one to two
percentage points in medication adherence for each of the SMI diagnoses examined (Table 4.8). On the
other hand, dual eligibility in a rural PCMH was associated with lower medication adherence as
compared with those who were not dual eligible in a rural PCMH. People with major depression and
people with schizophrenia who were dual eligible were 29 and 39 percentage points, respectively, less
adherent to their medications, while people with bipolar disorder was 9.8 percentage points less
adherent to their medications.
4.G. Aim 2 Results Summary
The hypothesis for Aim 2 was that in a rural PCMH, people with SMI would have higher health
services utilization and medication adherence when seeing primary care providers with high experience
with SMI. More specifically, it was hypothesized that people with SMI seeing primary care providers with

60
high experience with SMI would have more primary care visits, specialty mental health visits, and more
adherent to medications, but fewer inpatient hospitalizations and emergency department visits than
people with SMI seeing primary care providers with low experience with SMI. The hypothesis was
confirmed for primary care visits, specialty mental health visits and inpatient hospitalizations. However,
the hypothesis was rejected for emergency department visits and medication adherence for people with
SMI in a rural PCMH. With regards to emergency department visits, it was observed that people with
SMI seeing a primary care provider with high experience with SMI actually had a higher likelihood of
emergency department visits as well as more emergency department visits instead of observing the
hypothesized reduction in emergency department visits when people with SMI saw a primary care
provider with high experience with SMI as compared with people with SMI seeing a primary care
provider with low experience with SMI. Finally, with regards to medication adherence, the hypothesis
was rejected because the results were not significant and not in the hypothesized direction for people
with major depression and for people with schizophrenia.
The findings for Aim 2 also showed some unexpected results regarding FQHCs. In particular, it
was observed that receiving care from a FQHC was associated with lower primary care and specialty
mental health service use as well as higher inpatient and emergency department use among people with
SMI in rural PCMHs. This finding is contrary to what has been shown previously in the literature
regarding access to care among those who seek care from FQHCs, which has shown that people in
underserved areas have improved access to health services when they have access to an FQHC (Shi &
Stevens, 2007). Anomalies in the FQHC make it difficult to determine whether these results are an
artifact or a true difference reflecting poor access to services within FQHCs. Specifically, these centers
do not always bill Medicaid for services provided. If this is the case, actual levels of FQHC service
utilization would not have been accurately reported and reflected in the Medicaid claims data, making it
appear that there was lower use than actually occurred. Additionally, FQHCs often provide a bundle of

61
services that can include primary care as well as specialty services, but these services are often billed for
under a single billing code, making it difficult to determine exactly what type of services was received.
As a result of these data issues, it is difficult to attribute the FQHC findings to problems with access to
care. More reliable data on FQHCs are needed to assess and understand the role of these health centers
for people with SMI in rural PCMHs.

62
CHAPTER 5: RESULTS: AIM 3
Aim 3: To assess the extent to which the performance of PCMHs on health services utilization and quality of care for patients with SMI in rural areas varies with mental health workforce shortages and experience with SMI.
5.A. Primary Care Visits
The results of the GEE models showed that for people with SMI in a rural PCMH, the partial
effect of living in a county with a high unmet need for mental health providers (<39%) was associated
with five fewer annual primary care visits as compared to the average person with SMI living in a county
with a low unmet need for mental health providers (Table 5.1). This result was similar and only
significant for the people with major depression and people with bipolar disorder. People with
schizophrenia living in a county with a high unmet need for mental health providers only had nearly
three fewer annual primary care visits as compared to people with schizophrenia living in a county with
a low unmet need for mental health providers.
For people with SMI in a rural PCMH the partial effect of seeing a primary care provider with
high experience with SMI was associated with approximately four more annual primary care visits as
compared with people with SMI seeing a primary care provider with low experience with SMI. These
results were similar for people with major depression. People with bipolar disorder and people with
schizophrenia seeing a primary care provider with high experience with SMI also had an annual increase
of primary care visits, though these results were not significant.
The interaction effect of experience with SMI and mental health workforce shortage was not
significant for primary care visits. However, the direction of the interaction effect shows that for people
with SMI and all of the diagnoses examined in a rural PCMH seeing a primary care provider with high
experience with SMI differs between living in a county with a high unmet need for mental health

63
providers and living in a county with a low unmet need of mental health providers by fewer primary care
visits. Specifically, living in a county with a low unmet need for mental health providers had a higher
marginal effect of seeing a primary care provider with high experience with SMI on average for primary
care visits (Table 5.1).
The addition of information on the percentage of unmet need for mental health providers in a
county and the interaction effect of experience with SMI and mental health workforce shortage to the
GEE model did not impact the other covariates in the model and were nearly identical to the Aim 2 GEE
results for annual primary care visits.
5.B. Specialty Mental Health Visits
Though not significant, the results of the GEE models showed that for people with SMI and each
of the diagnoses examined in a rural PCMH, the partial effect of living in a county with a high unmet
need of mental health providers was associated with fewer annual specialty mental health visits as
compared to people with SMI living in a county with a low unmet need of mental health providers (Table
5.2). For people with SMI in a rural PCMH the partial effect of seeing a primary care provider with high
experience with SMI was associated with approximately six more annual specialty mental health visits as
compared with people with SMI seeing a primary care provider with low experience with SMI. People
with bipolar disorder and people with schizophrenia seeing a primary care provider with high experience
with SMI also had an annual increase of specialty mental health visits, though these results were not
significant.
The interaction effect of experience with SMI and mental health workforce shortage was not
significant. However, the direction of the interaction effect showed that for people with SMI and all of
the diagnoses examined in a rural PCMH seeing a primary care provider with high experience with SMI
differs between living in a county with a high unmet need for mental health providers and living in a

64
county with a low unmet need for mental health providers by fewer specialty mental health visits.
Specifically, living in a county with a low unmet need for mental health providers had a higher marginal
effect of seeing a primary care provider with high experience with SMI on average for specialty mental
health visits (Table 5.2).
The addition of information on the percentage of unmet need in a county and the interaction
effect of experience with SMI and mental health workforce shortage to the GEE model did not impact
the other covariates in the model and were nearly identical to the Aim 2 GEE results for average annual
specialty mental health visits.
5.C. Inpatient Hospitalizations
The results of the GEE models showed that for people with SMI and each of the diagnoses
examined in a rural PCMH, the partial effect of living in a county with a high unmet need for mental
health providers and the partial effect of seeing a primary care provider with high experience with SMI
did not significantly affect the likelihood of having an inpatient hospitalization (Table 5.3) or the number
of average annual inpatient hospitalization (Table 5.4).
The interaction effect of experience with SMI and mental health workforce shortage was also
not significant for the likelihood of having an inpatient hospitalization (Table 5.3) or the number of
inpatient hospitalizations (Table 5.4). However, the direction of the interaction effect showed that for
people with SMI and all of the diagnoses examined in a rural PCMH seeing a primary care provider with
high experience with SMI differs between living in a county with a high unmet need for mental health
providers and living in a county with a low unmet need for mental health providers by a higher
likelihood of an inpatient hospitalization and number of inpatient hospitalizations. Specifically, living in a
county with a low unmet need for mental health providers had a lower marginal effect of seeing a

65
primary care provider with high experience with SMI on average for the likelihood of an inpatient
hospitalization and the number of average annual inpatient hospitalizations.
The addition of information on the percentage of unmet need in a county and the interaction
effect of experience with SMI and mental health workforce shortage to the GEE model did not impact
the other covariates in the model and were nearly identical to the Aim 2 GEE results for the average
likelihood of an inpatient hospitalization and average annual inpatient hospitalizations.
5.D. Emergency Department Visits
Though not significant, the results of the GEE models showed that for people with SMI and each
of the diagnoses examined in a rural PCMH, the partial effect of living in a county with a high unmet
need for mental health providers was associated with a higher likelihood of an emergency department
visit in the month as compared to people with SMI and each of the diagnoses examined in a rural PCMH
living in a county with a low unmet need for mental health providers (Table 5.5). However, for people
with SMI and people with major depression in a rural PCMH, the partial effect of living in a county with a
high unmet need for mental health providers was significantly associated with approximately 0.3 more
annual emergency department visits as compared to people with SMI and people with major depression
living in a county with a low unmet need mental health providers (Table 5.6).
For people with SMI and people with major depression in a rural PCMH, the partial effect of
seeing a primary care provider with high experience with SMI was associated with a 1.2-1.5 percentage
point increase in the likelihood of an emergency department visit in the month as compared with those
who saw a primary care provider with low experience with SMI (Table 5.5). For people with SMI and
people with major depression in a rural PCMH, the partial effect of seeing a primary care provider with
high experience with SMI increased annual emergency department visits by approximately half a visit as
compared with those who saw a primary care provider with low experience with SMI (Table 5.6).

66
The interaction effect of experience with SMI and mental health workforce shortage was not
significant for the likelihood of having an emergency department visit (Table 5.5) or the number of
emergency department visits (Table 5.6). However, the direction of the interaction effect showed that
for people with SMI and all of the diagnoses examined in a rural PCMH seeing a primary care provider
with high experience with SMI differs between living in a county with a high unmet need for mental
health providers and living in a county with a low unmet need for mental health provider by a lower
likelihood of an emergency department visit and the number of average annual emergency department
visits.
The addition of information on the percentage of unmet need in a county and the interaction
effect of experience with SMI and mental health workforce shortage to the GEE model did not impact
the other covariates in the model and were nearly identical to the Aim 2 GEE results for the average
likelihood of an emergency department visit and average annual emergency department visits.
5.E. Medication Adherence
The GEE results showed that for people with major depression in a rural PCMH, the partial effect
of living in a county with a high unmet need for mental health providers was associated with a 3.6
percentage point lower adherence to medication as compared with people with major depression living
in a county with a low unmet need for mental health providers (Table 5.7). The partial effect of seeing a
primary care provider with high experience with SMI as compared with seeing a primary care provider
with low experience with SMI was not significant for each of the SMI diagnoses examined.
The interaction effect of experience with SMI and mental health workforce shortage was not
significant for medication adherence. However, the direction of the interaction effect showed that for all
of the diagnoses examined in a rural PCMH seeing a primary care provider with high experience with
SMI differs between living in a county with a high unmet need for mental health providers and living in a

67
county with a low unmet need of mental health provider by being more adherent to medications.
Specifically, living in a county with a low unmet need for mental health providers had a higher marginal
effect of seeing a primary care provider with high experience with SMI on average for medication
adherence (Table 5.7).
The addition of information on the percentage of unmet need in a county and the interaction
effect of experience with SMI and mental health workforce shortage to the GEE model did not impact
the other covariates in the model and were nearly identical to the Aim 2 GEE results for average
monthly medication adherence.
5.F. Aim 3 Results Summary
The primary hypothesis for Aim 3 was that in the rural PCMH, people with SMI would have
higher health services utilization and medication adherence when living in a county with lower unmet
need for mental health providers and seeing primary care providers with high experience with SMI.
More specifically, it was hypothesized that people with SMI living in a county with lower unmet need for
mental health providers and seeing primary care providers with high experience with SMI would have
more primary care visits, specialty mental health visits, and more adherent to medications, but fewer
inpatient hospitalizations and emergency department visits than people with SMI seeing primary care
providers with low experience with SMI. The interaction effect between unmet need for mental health
providers and provider experience with SMI was not significant for any of the outcome measures.
Therefore, the hypothesis for Aim 3 was not supported.
Despite the null findings, additional research on specialty mental health workforce shortages in
rural PCMHs in other states may produce different results. In North Carolina, the measure for specialty
mental health workforce shortages, percentage of unmet need for mental health providers had a large
range (i.e. 5%-94% unmet need), but when the upper outlier of 94% unmet need is removed, the highest

68
value of unmet for mental health providers is 53%, much lower than might be found in rural areas of
other states. Additional data from other states would likely provide more variability in the measure for
unmet need of mental health providers as well as provide a larger sample of rural counties and of
people with SMI could further inform the research presented here.

69
CHAPTER 6: DISCUSSION & POLICY IMPLICATIONS
The objective of this study was to examine the performance of the patient-centered medical home
(PCMH) for Medicaid beneficiaries with severe mental illness (SMI) living in urban and rural areas. This
study examined people with SMI in PCMHs compared to those in fee-for-service Medicaid between
urban, non-metropolitan urban and rural areas (Chapter 3), explored differences in the impact of the
PCMH in rural areas by examining primary care provider experience with SMI (Chapter 4) and, the
combined effect of the mental health workforce supply with primary care provider experience with SMI
(Chapter 5). Generalized estimating equations with 2004-2007 North Carolina Medicaid administrative
paid claims data was used to analyze the outcomes of visits to primary care, specialty mental health
care, inpatient hospitalizations, emergency department visits and medication adherence. In this final
chapter, the study findings are summarized and their implications for policy, practice, and future
research on the PCMH are discussed.
6.A. Summary
The main findings of this study can be summarized through the following three hypotheses
concerning the relationships between urban/rural settings, primary care provider experience with SMI,
mental health workforce shortages and the utilization and quality of services provided by Medicaid
supported PCMHs.
The first hypothesis stated that Medicaid patients with SMI in urban PCMHs would have higher
health services utilization and quality of care than Medicaid patients with SMI in rural PCMHs.
Propensity score weighted findings showed that urban, non-metropolitan urban, and rural PCMHs
performed better on most of the outcomes compared to fee-for-service. The exception was that rural

70
PCMHs performed worse that fee-for-service for the specialty mental health outcome. Differences
between urban, non-metropolitan, and rural PCMHs varied somewhat by outcome and SMI diagnosis.
Differences existed between urban and rural PCMHs for specialty mental health visits for people with
SMI and all of the diagnoses examined. Differences also existed between urban and rural PCMHs for
primary care visits among people with schizophrenia, but not among people with major depression or
bipolar disorder. However, differences only existed between urban and non-metropolitan urban PCMHs
for primary care visits and inpatient hospitalizations, but not for other outcomes. The findings support
the hypothesis that urban PCMHs would perform better than rural PCMHs on one of the outcomes
studied (i.e. specialty mental health), but not for the other outcomes (i.e. primary care, inpatient
hospitalizations, emergency department visits, and medication adherence).
The next hypothesis focused on rural PCMHs and stated that patients with SMI in rural PCMHs
receiving care from primary care providers with high SMI caseloads would have improved health
services utilization and quality of care than those receiving care from primary care providers with low
SMI caseloads. The findings showed that having a provider with high SMI caseloads were associated with
more primary care and specialty mental health visits as well as more emergency department visits than
low primary care provider SMI caseloads. The finding for primary care and specialty mental health visits
are consistent with the hypothesis. The emergency department visits are not consistent with the
hypothesis.
The final hypothesis also focused on rural PCMHs and stated that patients with SMI in rural PCMHs
that have lower mental health workforce shortages and receive care from primary care providers with
high SMI caseloads would have improved health services utilization and quality of care relative to other
rural areas. There were no significant finding for the interaction between primary care experience with
SMI and mental health workforce shortages across all of the outcomes studied. These findings are not
consistent with the hypothesis.

71
6.B, Discussion
The PCMH model seeks to improve care for patients through prevention, care coordination and
management of chronic disease (Iglehart, 2008). Even though the first hypothesis was rejected for many
of the outcomes studied, the null findings were due to the rural PCMHs performing better than
hypothesized. Based on these finding, the rural PCMHs may result in overall better health outcomes for
people with SMI because of more use of primary care services. Nonetheless, there still remains room for
improvement in differences between urban, non-metropolitan urban, and rural PCMHs, particularly
concerning specialty mental health services.
Specialty mental health service use was significantly lower between urban and rural PCMHs for
people with SMI. There are two main explanations for this finding. First, people with SMI in rural PCMHs
may receive mental health treatment in the form of medications from their rural primary care providers.
Other research has shown that treatment for mental illness in rural areas relies more heavily on
medications than urban areas (Fortney, et al., 2010). This supports the idea that people with SMI in rural
PCMHs also rely on medications for mental health treatment. Second explanation is that people with
SMI in rural PCMHs are not accessing any specialty mental health services due to a lack of specialty
mental health providers in rural areas. Based on the rural-urban differences for specialty mental health
visits, it was important understand if experience with SMI and differences in mental health workforces
shortages in rural areas mitigate these rural-urban differences.
Experience with SMI resulted in higher primary care service use as well as outpatient specialty
mental health use in rural PCMHs. This finding is consistent with other studies that observed higher
volume of people with mental health disorders having increased access to outpatient mental health
services (Druss, et al., 2004). On the primary care side, even though more experience with SMI increases
access to primary care, the increase in primary care visits do not bring rural PCMHs up to the same

72
primary care utilization levels as urban PCMHs that were observed in Chapter 3. That said, experience
with SMI does explain a large portion of increased primary care utilization in rural PCMHs over fee-for-
service.
Although people with SMI in rural PCMHs with more experienced providers used more primary
care and specialty mental health services, this pattern of care was not associated with lower emergency
department use. There could be several reasons for this finding. The first reason is that experience with
SMI alone is not enough to avoid or reduce psychiatric crises that could be the cause of emergency
department visits. Previous research has shown that primary care providers frequently do not provide
minimally adequate care to people with SMI (Wang, et al., 2002). A second reason is that a primary care
provider more experienced with SMI may be more likely to recognize the symptoms associated with
psychiatric crises and send patients to the emergency department. With the lack of mental health
providers in rural areas, hospital emergency departments function as the de facto crisis response system
for rural areas and as an entry point to inpatient care for primary care physicians who do not have the
time to locate a bed for patients needing inpatient care. Third, the measure used in this study was an all
cause indicator rather than a psychiatric specific indicator of emergency department use. given the high
rates of medical comorbidities among people with SMI, the high rates reported here may indicate
medical rather than psychiatric use. finally, for an SMI population in resource deprived areas, emergency
room use may not be a totally negative thing. It can be seen as a marker that someone was paying
attention to patient’s mental health needs. Regardless of the reason for the increased emergency
department use finding, future research should focus on patient-provider encounters in rural PCMHs as
well as the content, intensity and effectiveness of services received by people with SMI.
Experience with SMI alone does not help rural PCMHs function as well as urban PCMHs for
people with SMI. It is important, to consider whether other resources could be added to rural PCMHs
that would allow them to improve the care of people with SMI and thereby move them closer to the

73
level of performance observed for urban PCMHs. Urban areas tend to be resource rich environments
that are better equipped to assist both people with SMI and the PCMHs that serve them. Specifically,
urban PCMHs are likely to have better access to specialty providers to refer their patients, care
managers that are experienced in managing the care of people with SMI as well as overall stronger
linkages between the PCMH and specialty providers than rural PCMHs.
Rural areas have mental health professional shortages for a variety of reasons including low
population density, low income populations, and public transportation deficits. All of these combine to
make it economically difficult for a mix of specialty mental health providers to function in rural areas. As
a result, options like co-location of specialty mental health in non-urban PCMHs is not a realistic option
in most situations. What other resources might be mobilized to augment provider skills and experience
in rural PCMHs in ways that would make them better able to care for people with SMI?
Health IT, and advanced practice psychiatric nurses are examples of the type of resources that
can aid rural PCMHs (Fung, Chan, & Chien, 2014; Hilty et al., 2013). On the health IT front, there is a
growing literature base that shows the telemental health services have developed beyond providing
mental health services to patient in rural areas and is now also used as a consultation tool for rural
primary care providers (Hilty, et al., 2013; Hilty, Yellowlees, & Nesbitt, 2006). In particular, telemental
health services have been used to assist primary care providers with medication dosage information and
treatment planning. These support services to rural primary care providers are associated with better
outcomes for people with anxiety disorders or depression, but has not been tested yet for rural primary
care providers managing the care of people with SMI. In terms of advanced practice psychiatric nurses, a
larger role for advanced practice psychiatric nurses has been suggested for rural areas as well as for
collaborations with rural primary care providers (Fung, et al., 2014; Hanrahan & Hartley, 2008).
Advanced practice psychiatric nurses are able to provide a range of specialty mental health services,
consultation services to primary care providers, and in most states have prescribing privileges (Fung, et

74
al., 2014). As with telemental health services, interventions using advanced primary care practice nurses
focused on people with depression, but not for people with SMI. The rural PCMH would be a good
environment for future research on the role of telemental health services and advance practice
psychiatric nurses for people with SMI.
6.C. Limitations
It is important to note several limitations to this study. As discussed in Chapter 2, there was a
problem with selection bias in the Aim 1 analyses because North Carolina Medicaid beneficiaries have
the option to enroll in the CCNC medical home or to enroll in traditional fee-for-service Medicaid. The
unadjusted standardized differences in the means confirmed that this selection problem exists. As a
result, propensity score weighting methods were used to correct the selection problem. While the
weighted standardized differences in the means appeared to balance the risk factors associated with the
likelihood of being in the PCMH, additional factors may exist that were not controlled for in the
propensity score model, such as a measure of SMI severity. It would be worthwhile to conduct future
studies using an instrument like county Community Care of North Carolina (CCNC) rates to compare to
the results found in Aim 1 using propensity score weighting methods. County CCNC rates are
hypothesized to affect the likelihood of being in the PCMH, but not correlated with the outcome
measures used in this study.
Since this is an analysis of Medicaid paid claims, there are limitations related to the coverage of
the SMI population and to the use of administrative claims data. Medicaid is the principal, but not only
payer of services for the SMI population. Further, many individuals with SMI are uninsured. As a result,
research that included a broader sample of people with SMI might lead to different results than the
ones reported here. In addition, the way provider and practice-billing codes are reported in the
Medicaid claims data did not allow for a more detailed look at the role that provider or practice

75
characteristics might play in the relationships examined in this study. Additionally, in developing the
measure of primary care provider experience with SMI, it was not possible to determine when a primary
care provider was billing under their own provider ID or under the practice ID. As a result, there may be
a lot of noise in this measure and the measure would benefit from more detailed information separating
primary care provider IDs from practice IDs. Nonetheless, the data available for this study provided a
strong start to answering questions about the PCMH and the size of SMI caseload among PCMH
providers.
Another limitation of the data was the lack of data on non-SMI Medicaid beneficiaries as well as
information on care management. The data for the study was limited to people with depression, bipolar
disorder and schizophrenia only. This was a problem when developing the primary care provider
experience with SMI measure used in Aims 2 and 3 because the measure does not have a denominator
of the overall number of Medicaid beneficiaries in a PCMH primary care practice. As a result, the
percentage of Medicaid SMI in a practice could not be determined. Despite this limitation, the primary
care provider experience with SMI measure used in this study provides a strong baseline for
understanding the impact of higher caseloads/experience managing a complex set of patients in rural
primary care. Additionally, the data did not include information on care management provided within
the PCMH. Specifically, it is not known if primary care practices had care managers located within the
practice or relied on the CCNC network for care management. This type of information would be
beneficial towards understanding variation across PCMHs that may explain the outcomes for people
with SMI and is an important area for future research.
As previously discussed, there is a significant limitation on the data regarding Federally Qualified
Health Centers (FQHC). Within the Medicaid paid claims it can be difficult to determine what types of
services were received within FQHCs because providers frequently bill under just one billing code for a
bundled set of services. Additionally, if FQHC did not bill Medicaid for services provided to Medicaid

76
beneficiaries, it would not appear in the data. If so, this could produce findings reported here which are
inconsistent with prior research.
Finally, the numbers of people with bipolar disorder or schizophrenia in the study sample for
rural PCMHs during the 2004-2007 study period was also a concern. While the total sample of people
with SMI in rural PCMHs amounted to over 5,000 people, roughly 80% of that number was people with
major depression. This left a relatively small number of people with bipolar disorder or schizophrenia
(901 and 586, respectively). For the diagnosis specific models of people with bipolar disorder in a rural
PCMH or people with schizophrenia in a rural PCMH, many covariates that were significant in the overall
SMI models as well as in the major depression models were not significant in the bipolar disorder or
schizophrenia models. Later years of North Carolina Medicaid data would likely result in a larger rural
PCMH bipolar disorder and schizophrenia sample size, mainly due to policy changes that occurred
around 2006-2007 within CCNC that required CCNC to enroll Medicaid beneficiaries who qualified for
Medicaid as age, blind or disabled ("A History of CCNC: The Evolution of Community Care of North
Carolina ", 2014). Therefore, a larger and more representative sample of people with SMI might lead to
results different than those reported here.
6.D. Next Steps
Since the 2004-2007 time-frame for this dissertation, there have been several advances within
CCNC that could affect the findings of this study. For example, during 2006-2007, CCNC began initiatives
aimed at actively enrolling dual eligibles and the aged, blind and disabled populations. Additionally, in
2010, CCNC developed a behavioral health integration initiative that embedded a psychiatrist and
behavioral health coordinators into each of the 14 CCNC networks ("A History of CCNC: The Evolution of
Community Care of North Carolina ", 2014). These programmatic changes may have enhanced the ability
of PCMHs to serve people with SMI in rural areas. First, a larger population of dual eligibles and those

77
with disabilities are likely to increase experience level among the PCMHs. Second, embedding a
psychiatrist and behavioral health coordinator into the CCNC networks provides PCMHs, especially rural
PCMHs with additional consultation on how to manage the care of people with SMI effectively. As a next
step from the research presented in this dissertation it would be informative to reexamine the focal
hypotheses with more recent Medicaid claims to determine whether recent CCNC-PCMH program
enhancements lead to different findings and conclusions. Additionally, future research should
incorporate data from other states in order to understand if the rural-urban variations in care observed
in North Carolina are unique or a part of a broader mosaic that shows up in other jurisdictions as well.
6.E. Conclusions
There has been interest in models aimed at improving care for individuals with chronic
conditions in recent years. Additionally, states are evaluating how health services resources are directed
to various communities within their jurisdictions. Findings from this study show that the PCMH model
helps to reduce differences that exist between rural and urban areas for people with SMI. However,
gaps still remain between urban, non-metropolitan urban and rural areas in the performance of PCMHs
for people with SMI. Rural and non-metropolitan urban PCMHs may benefit from targeted resources to
help close the remaining gaps in health services utilization and medication adherence for people with
SMI. Several areas for future research exist that can advance our understanding of effective coordinated
care models in order to inform future policy decisions regarding programs aimed at improving care for
people in rural areas with SMI.

78
APPENDIX: TABLES AND FIGURES Chapter 1: Figure 1.1: The Chronic Care Model
Figure 1.2: North Carolina Counties by Rural-Urban Continuum Code

79
* based on Andersen, R. (1995). Revisiting the behavioral model and access to medical care: does it matter? J Health Soc Behav, 36(1), 1-10.
Outcomes Population Characteristics Health Care Environment
Utilization Visits
Quality of Care Medication Adherence
Patient-Centered Medical Home
Predisposing Characteristics
Individual Characteristics Age Sex Race
Rural/Urban Residence
Health Status SMI Diagnosis
Aim 1
Figure 1.3: Conceptual Framework of Accessing Care in the Patient-Centered Medical Home*
Need
Evaluated Need Comorbidities
Enabling Resources
Individual Resources Income Insurance Status
Community Context Outpatient Mental Health Services
Primary Care SMI Experience
Aim 2
Aim 3

80
Chapter 2:
Table 2.1: Sample Size of Patients with SMI by Rurality and Medical Home
Metropolitan
Non-Metropolitan Urban
Non-Metropolitan Rural
Medical Home
Major Depression 56,864 32,355 4,573
Bipolar Disorder 14,895 8,219 993
Schizophrenia 9,041 4,901 636
Total SMI 66,934 37,632 5,308
Not Medical Home
Major Depression 41,087 21,871 3,453
Bipolar Disorder 10,149 4,893 699
Schizophrenia 11,634 5,763 817
Total SMI 53,595 27,883 4,366
0
0.2
0.4
0.6
0.8
1
200401 200501 200601 200701
Figure 2.1: Graph of Average Treatment Effect Weights Over Time by SMI and Diagnosis
SMI Depression Bipolar Schizophrenia

81
0
.00
2.0
04
.00
6
Den
sity
0 500 1000 1500100 200 300smi_volume_ym
Figure 2.2: Frequency of Experience with SMI
0
.02
.04
.06
.08
Den
sity
0 20 40 60 80 100% unmet need
Figure 2.3: Frequency of County-Level % of Unmet Need
90th Percentile
50th Percentile 75th Percentile

82
Chapter 3
Table 3.1: Descriptive Statistics of Propensity Score Weighted Characteristics by Medical Home Status for SMI Sample (n=195,718)
Unweighted Weighted
In Medical Home
Not Medical Home
Standard difference in means
In Medical Home
Not Medical Home
Standard difference in means
Medical Home Enrollment (%) 56.14% 43.86% Mental Health Diagnosis (%) Major Depression 85.36% 77.36% 20.66 81.93% 81.82% 0.005 Bipolar Disorder 21.94% 18.34% 8.99 20.01% 20.04% 0.0011 Schizophrenia 13.27% 21.22% 21.16 16.54% 16.70% 0.0072 Rural Residence (%) Urban 60.92% 62.43% 3.12 62.11% 62.08% 0.0012 Non-Metropolitan Urban 34.25% 32.48% 3.75 32.51% 32.44% 0.0034 Rural 4.83% 5.09% 1.18 5.38% 5.48% 0.0046 Age (yrs.) 38.90 52.57 82.81 44.99 44.90 0.42 Gender: Male (%) 23.83% 32.45% 19.28 27.65% 27.79% 0.0066 Race (%) Caucasian 62.01% 66.24% 8.82 61.92% 64.62% 0.12 African-American 32.20% 26.76% 11.96 32.06% 27.55% 0.20 Other 7.57% 7.00% 4.96 6.01% 7.83% 0.082 Ethnicity: Hispanic (%) 1.45% 1.82% 2.90 1.95% 1.80% 0.0068 Medicaid Eligibility: Disabled (%) 52.06% 57.69% 11.34 55.07% 56.14% 0.0033 Dual Eligible (%) 18.08% 57.05% 87.90 36.97% 35.70% 0.057 Comorbidities (#) 6.86 7.65 18.77 7.13 7.12 0.046 a Age modeled as a quadratic

83
Table 3.2: Descriptive Statistics of Propensity Score Weighted Characteristics by Medical Home Status for Major Depression Sample (n=160,202)
Unweighted Weighted
In Medical Home Not Medical Home
Standard difference in means
In Medical Home
Not Medical Home
Standard difference in means
Medical Home Enrollment (%) 58.55% 41.45% Mental Health Diagnosis (%) Bipolar Disorder 15.88% 11.45% 12.92 13.66% 13.69% 0.0016 Schizophrenia 6.50% 7.72% 4.78 6.76% 6.88% 0.0056 Rural Residence (%) Urban 60.63% 61.87% 2.55 61.86% 61.72% 0.0063 Non-Metropolitan Urban 34.50% 32.93% 3.31 32.69% 32.74% 0.0023 Rural 4.89% 5.20% 1.48 5.45% 5.54% 0.0040 Age (yrs.)a 38.88 53.47 86.60 45.29 44.99 1.30 Gender: Male (%) 20.79% 27.70% 16.17 23.84% 23.86% 0.00064 Race (%) Caucasian 63.33% 68.87% 11.73 63.78% 66.56% 0.12 African-American 30.76% 23.56% 16.24 29.86% 25.30 0.20 Other 5.91% 7.57% 6.62 6.36% 8.14% 0.080 Ethnicity: Hispanic (%) 1.44% 1.99% 4.28 2.02% 1.83% 0.0085 Medicaid Eligibility: Disabled (%) 48.75% 52.86% 8.23 51.70% 51.97% 0.023 Dual Eligible (%) 16.89% 55.19% 86.99 35.02% 33.40% 0.073 Comorbidities (#) 7.02 8.03 23.60 7.36 7.36 0.012 a Age modeled as a quadratic

84
Table 3.3: Descriptive Statistics of Propensity Score Weighted Characteristics by Medical Home Status for Bipolar Disorder Sample (n=39,848)
Unweighted Weighted
In Medical Home Not Medical Home
Standard difference in means
In Medical Home
Not Medical Home
Standard difference in means
Medical Home Enrollment (%) 60.50% 39.50% Mental Health Diagnosis (%) Major Depression 62.78% 48.32% 27.32 55.91% 55.92% 0.00052 Schizophrenia 16.67% 22.04% 13.64 18.66% 18.80% 0.0064 Rural Residence (%) Urban 61.79% 64.47% 5.57 63.07% 63.95% 0.040 Non-Metropolitan Urban 34.09% 31.08% 6.42 32.75% 31.15% 0.072 Rural 4.12% 4.44% 1.59 4.19% 4.89% 0.032 Age (yrs.)a 36.63 45.24 61.87 39.79 39.90 0.51 Gender: Male (%) 23.64% 33.08% 21.06 27.14% 27.52% 0.017 Race (%) Caucasian 73.63% 75.74% 4.88 73.46% 74.88% 0.064 African-American 21.91% 19.21% 6.67 22.09% 19.40% 0.12 Other 4.47% 5.04% 2.71 4.45% 5.72% 0.057 Ethnicity: Hispanic (%) 1.27% 1.23% 0.427 1.35% 1.35% 0.00020 Medicaid Eligibility: Disabled (%) 57.57% 72.51% 31.73 65.07% 64.90% 0.0078 Dual Eligible (%) 18.97% 54.69% 79.73 33.68 33.50% 0.0081 Comorbidities (#) 8.23 8.38 3.36 8.18 8.19 0.070 a Age modeled as a quadratic

85
Table 3.4: Descriptive Statistics of Propensity Score Weighted Characteristics by Medical Home Status for Schizophrenia Sample (n=32,791)
Unweighted Weighted
In Medical Home
Not Medical Home
Standard difference in means
In Medical Home
Not Medical Home
Standard difference in means
Medical Home Enrollment (%) 44.46% 55.54% Mental Health Diagnosis (%) Major Depression 41.79% 28.16% 28.88 33.70% 33.88% 0.0082 Bipolar Disorder 27.56% 19.05% 20.23 22.75% 22.83% 0.0035 Rural Residence (%) Urban 62.02% 63.87% 3.84 63.01% 63.28% 0.012 Non-Metropolitan Urban 33.62% 31.64% 4.22 32.14% 31.86% 0.012 Rural 4.36% 4.49% 0.60 4.85% 4.86% 0.00028 Age (yrs.)a 41.68 51.18 64.66 46.30 46.62 1.50 Gender: Male (%) 47.39% 51.79% 8.81 50.19% 50.10% 0.0038 Race (%) Caucasian 40.04% 50.34% 20.81 43.46% 46.06% 0.12 African-American 54.69% 44.71% 20.06 52.33% 47.92% 0.20 Other 5.27% 4.95% 1.46 4.21% 6.03% 0.082 Ethnicity: Hispanic (%) 1.45% 1.06% 3.49 1.34% 1.31% 0.0014 Medicaid Eligibility: Disabled (%) 91.21% 79.77% 32.90 87.21% 85.78% 0.064 Dual Eligible (%) 30.89% 70.96% 87.49 53.45% 53.06% 0.018 Comorbidities (#) 8.08 7.78 6.69 7.81 7.84 0.13 a Age modeled as a quadratic

86
Table 3.5: Propensity Score Weighted Average Marginal Effect in Monthly and Annual Primary Care Visits by Diagnosis
SMI Major Depression Bipolar Disorder Schizophrenia
Monthly Annual Monthly Annual Monthly Annual Monthly Annual
Medical Home 0.40** (0.0063)
4.8 0.39**
(0.0075) 4.68
0.48** (0.011)
5.76 0.48** (0.015)
5.76
Rurality
Non-Metropolitan Urban -0.0088 (0.0073)
-0.1056 -0.018** (0.0086)
-0.216 -0.022 (0.014)
-0.264 0.027
(0.015) 0.324
Rural -0.018 (0.022)
-0.216 -0.014 (0.028)
-0.168 0.0075 (0.030)
0.09 0.033
(0.042) 0.396
Age 0.0016** (0.00035)
0.0192 0.0016** (0.00044)
0.0192 0.0032** (0.00058)
0.0384 0.0013** (0.00059)
0.0156
Gender 0.010 (0.0080)
0.12 0.023** (0.0099)
0.276 -0.079** (0.015)
-0.948 -0.072** (0.015)
-0.864
# of Comorbidities 0.080** (0.0011)
0.96 0.082** (0.0013)
0.984 0.079** (0.0024)
0.948 0.079** (0.0024)
0.948
Race -0.17** (0.0065)
-2.04 -0.17** (0.0078)
-2.04 -0.19** (0.013)
-2.28 -0.16** (0.013)
-1.92
Ethnicity 0.00069 (0.031)
0.00828 -0.021 (0.037)
-0.252 0.049
(0.060) 0.588
0.14** (0.061)
1.68
Major Depression 0.030** (0.011)
0.36 -- -- 0.042** (0.015)
0.504 0.010
(0.017) 0.12
Bipolar Disorder -0.014 (0.0081)
-0.168 -0.15
(0.0097) -1.8 -- --
-0.045** (0.017)
-0.54
Schizophrenia -0.077** (0.011)
-0.924 -0.071** (0.016)
-0.852 -0.064** (0.018)
-0.768 -- --
Number of Persons 195,716 160,202 39,848 32,791 Number of Observations 5,937,681 4,856,299 1,225,211 1,169,003 Notes: Delta method SEs are in parentheses ** Statistically significant at the 5% level

87
Table 3.6: Propensity Score Weighted Average Monthly and Annual Marginal Effect of Medical Home Status Simulation on Rurality for Primary Care Visits by Diagnosis
SMI Major Depression Bipolar Disorder Schizophrenia
Monthly Annual Monthly Annual Monthly Annual Monthly Annual
Medical Home Status on:+
Urban 0.44** (0.0078)
5.28b 0.43**
(0.0090) 5.16b
0.51** (0.014)
6.12b 0.54** (0.019)
6.48a,b
Non-Metropolitan Urban 0.34** (0.010)
4.08c 0.33** (0.012)
3.96c 0.40** (0.016)
4.8a,c 0.40** (0.023)
4.8c
Rural 0.37** (0.040)
4.44 0.38** (0.052)
4.56 0.56** (0.045)
6.72b 0.38** (0.069)
4.56c
Number of Persons 195,716 160,202 39,848 32,791 Number of Observations 5,937,681 4,856,299 1,225,211 1,169,003 Notes: Delta method SEs are in parentheses +
compared to patients not in the medical home a Significant difference from rural
b Significant difference from non-metropolitan urban
c Significant difference from urban
** Statistically significant at the 5% level

88
Table 3.7: Propensity Score Weighted Average Marginal Effect in Monthly and Annual Specialty Mental Health Visits by Diagnosis
SMI Major Depression Bipolar Disorder Schizophrenia
Monthly Annual Monthly Annual Monthly Annual Monthly Annual
Medical Home 0.018 (0.018)
0.216 0.031** (0.014)
0.372 0.17** (0.038)
2.04 0.016
(0.079) 0.192
Rurality
Non-Metropolitan Urban 0.010 (0.025)
0.12 0.0012 (0.021)
0.0144 -0.024 (0.062)
-0.288 0.18
(0.12) 2.16
Rural 0.30** (0.064)
3.6 0.17** (0.050)
2.04 0.51** (0.18)
6.12 1.11** (0.34)
13.32
Age -0.082** (0.0015)
-0.984 -0.054** (0.0014)
-0.648 -0.12** (0.0042)
-1.44 -0.28** (0.0068)
-3.36
Gender 0.31** (0.028)
3.72 0.38** (0.023)
4.56 0.39** (0.068)
4.68 -0.66** (0.12)
-7.92
# of Comorbidities 0.12** (0.0035)
1.44 0.085** (0.0029)
1.02 0.18**
(0.0086) 2.16
-0.33** (0.017)
-3.96
Race -0.23** (0.022)
-2.76 -0.17** (0.018)
-2.04 -0.12** (0.054)
-1.44 -0.92** (0.10)
-11.04
Ethnicity -0.35** (0.097)
-4.2 -0.14
(0.085) -1.68
-0.089 (0.25)
-1.068 -1.08** (0.53)
-12.96
Major Depression -0.54** (0.034)
-6.48 -- -- -0.21** (0.071)
-2.52 -1.52** (0.14)
-18.24
Bipolar Disorder 0.15** (0.028)
1.8 0.37** (0.025)
4.44 -- -- -1.27** (0.14)
-15.24
Schizophrenia 1.87** (0.036)
22.44 1.30** (0.033)
15.6 2.02** (0.081)
24.24 -- --
Number of Persons 195,716 160,202 39,848 32,791 Number of Observations 5,937,681 4,856,299 1,225,211 1,169,003 Notes: Delta method SEs are in parentheses ** Statistically significant at the 5% level

89
Table 3.8: Propensity Score Weighted Average Monthly and Annual Marginal Effect of Medical Home Status Simulation on Rurality for Specialty Mental Health Visits by Diagnosis
SMI Major Depression Bipolar Disorder Schizophrenia
Monthly Annual Monthly Annual Monthly Annual Monthly Annual
Medical Home Status on:+
Urban 0.042 (0.024)
0.504a 0.048** (0.019)
0.576a 0.25** (0.050)
3b 0.13 (0.10)
1.56a
Non-Metropolitan Urban 0.0056 (0.027)
0.0672a 0.028 (0.023)
0.336a 0.022 (0.060)
0.264c -0.053 (0.12)
-0.636a
Rural -0.21** (0.084)
-2.52b,c -0.16** (0.072)
-1.92b,c 0.14 (0.22)
1.68 -1.03** (0.42)
-12.36b,c
Number of Persons 195,716 160,202 39,848 32,791 Number of Observations 5,937,681 4,856,299 1,225,211 1,169,003 Notes: Delta method SEs are in parentheses +
compared to patients not in the medical home a Significant difference from rural
b Significant difference from non-metropolitan urban
c Significant difference from urban
** Statistically significant at the 5% level

90
Table 3.9: Propensity Score Weighted Average Marginal Effect in Monthly and Annual Inpatient Hospitalizations by Diagnosis
SMI Major Depression Bipolar Disorder Schizophrenia
Monthly Annual Monthly Annual Monthly Annual Monthly Annual
Medical Home -0.12** (0.0032)
-1.44 -0.12** (0.0035)
-1.44 -0.10** (0.0071)
-1.2 -0.054** (0.0088)
-0.648
Rurality
Non-Metropolitan Urban -0.033** (0.0045)
-0.396 -0.034** (0.0049)
-0.408 -0.049** (0.0094)
-0.588 -0.018 (0.013)
-0.216
Rural -0.018 (0.0094)
-0.216 -0.024** (0.010)
-0.288 -0.057** (0.021)
-0.684 -0.22
(0.021) -2.64
Age -0.0076** (0.00018)
-0.0912 -0.0082** (0.00021)
-0.0984 -0.0070** (0.00051)
-0.084 -0.0075** (0.00053)
-0.09
Gender: Male 0.094** (0.0049)
1.128 0.12**
(0.0054) 1.44
0.031** (0.010)
0.372 0.033** (0.012)
0.396
# of Comorbidities 0.045** (0.00071)
0.54 0.48**
(0.00078) 5.76
0.048** (0.0016)
0.576 0.041** (0.0016)
0.492
Race 0.023** (0.0037)
0.276 0.022** (0.0041)
0.264 0.0067
(0.0085) 0.0804
0.028** (0.0091)
0.336
Ethnicity 0.17** (0.015)
2.04 0.17** (0.017)
2.04 0.098** (0.034)
1.176 0.13** (0.047)
1.56
Major Depression 0.047** (0.0067)
0.564 -- -- 0.054** (0.010)
0.648 0.043** (0.012)
0.516
Bipolar Disorder -0.035** (0.0052)
-0.42 -0.048** (0.0059)
-0.576 -- -- 0.054** (0.012)
0.648
Schizophrenia -0.017** (0.0062)
-0.204 -0.015** (0.0073)
-0.18 0.094** (0.012)
1.128 -- --
Number of Persons 195,716 160,202 39,848 32,791 Number of Observations 5,937,681 4,856,299 1,225,211 1,169,003 Notes: Delta method SEs are in parentheses ** Statistically significant at the 5% level

91
Table 3.10: Propensity Score Weighted Average Monthly and Annual Marginal Effect of Medical Home Status Simulation on Rurality for Inpatient Hospitalizations by Diagnosis
SMI Major Depression Bipolar Disorder Schizophrenia
Monthly Annual Monthly Annual Monthly Annual Monthly Annual
Medical Home Status on:+
Urban -0.13** (0.0043)
-1.56b -0.14** (0.0048)
-1.68b -0.11** (0.0092)
-1.32 -0.065** (0.011)
-0.78a
Non-Metropolitan Urban -0.092** (0.0049)
-1.104c -0.094** (0.0053)
-1.128c -0.091** (0.011)
-1.092 -0.042** (0.015)
-0.504
Rural -0.11** (0.014)
-1.32 -0.12** (0.014)
-1.44 -0.11** (0.053)
-1.32 0.012
(0.036) 0.144c
Number of Persons 195,716 160,202 39,848 32,791 Number of Observations 5,937,681 4,856,299 1,225,211 1,169,003 Notes: Delta method SEs are in parentheses +
compared to patients not in the medical home a Significant difference from rural
b Significant difference from non-metropolitan urban
c Significant difference from urban
** Statistically significant at the 5% level

92
Table 3.11: Propensity Score Weighted Average Marginal Effect in Monthly and Annual Emergency Department Visits by Diagnosis
SMI Major Depression Bipolar Disorder Schizophrenia
Monthly Annual Monthly Annual Monthly Annual Monthly Annual
Medical Home -0.052** (0.0021)
-0.624 -0.053
(0.0025) -0.636
-0.059** (0.0043)
-0.708 -0.032** (0.0041)
-0.384
Rurality
Non-Metropolitan Urban 0.015** (0.0031)
0.18 0.016** (0.0036)
0.192 0.023** (0.0084)
0.276 -0.010
(0.0071) -0.12
Rural -0.025** (0.0063)
-0.3 -0.027** (0.0075)
-0.324 -0.037** (0.017)
-0.444 -0.045** (0.014)
-0.54
Age -0.010** (0.00014)
-0.12 -0.011** (0.00017)
-0.132 -0.013** (0.00032)
-0.156 -0.0077** (0.00027)
-0.0924
Gender 0.0082** (0.0032)
0.0984 0.017** (0.0038)
0.204 0.016
(0.0086) 0.192
0.023** (0.0073)
0.276
# of Comorbidities 0.043** (0.00046)
0.516 0.046**
(0.00053) 0.552
0.057** (0.0012)
0.684 0.041** (0.0011)
0.492
Race -0.014** (0.0025)
-0.168 -0.019** (0.0029)
-0.228 -0.040** (0.0066)
-0.48 0.017** (0.0057)
0.204
Ethnicity -0.0049 (0.00046)
-0.0588 -0.0069 (0.012)
-0.0828 0.0055 (0.026)
0.066 0.015
(0.026) 0.18
Major Depression 0.092** (0.0047)
1.104 -- -- 0.10**
(0.0080) 1.2
0.093** (0.0066)
1.116
Bipolar Disorder 0.038** (0.0036)
0.456 0.028** (0.0042)
0.336 -- -- -0.059** (0.0071)
-0.708
Schizophrenia -0.073** (0.0046)
-0.876 -0.054** (0.0059)
-0.648 -0.047** (0.010)
-0.564 -- --
Number of Persons 195,716 160,202 39,848 32,791 Number of Observations 5,937,681 4,856,299 1,225,211 1,169,003 Notes: Delta method SEs are in parentheses ** Statistically significant at the 5% level

93
Table 3.12: Propensity Score Weighted Average Monthly and Annual Marginal Effect of Medical Home Status Simulation on Rurality for Emergency Department Visits by Diagnosis
SMI Major Depression Bipolar Disorder Schizophrenia
Monthly Annual Monthly Annual Monthly Annual Monthly Annual
Medical Home Status on:+
Urban -0.054** (0.0027)
-0.648a -0.056** (0.0033)
-0.672 -0.057** (0.0056)
-0.684 -0.037** (0.0052)
-0.444a
Non-Metropolitan Urban -0.050** (0.0034)
-0.6 -0.051** (0.0042)
-0.612 -0.065** (0.0073)
-0.78 -0.030** (0.0067)
-0.36a
Rural -0.040** (0.0096)
-0.48 -0.042** (0.012)
-0.504 -0.048** (0.023)
-0.576 0.026
(0.022) 0.312b,c
Number of Persons 195,716 160,202 39,848 32,791 Number of Observations 5,937,681 4,856,299 1,225,211 1,169,003 Notes: Delta method SEs are in parentheses +
compared to patients not in the medical home a Significant difference from rural
b Significant difference from non-metropolitan urban
c Significant difference from urban
** Statistically significant at the 5% level

94
Table 3.13: Propensity Score Weighted Average Marginal Effect of Monthly Prescription Adherence by Diagnosis
Major Depression Bipolar Disorder Schizophrenia
Medical Home 0.057** (0.0063)
0.065** (0.0042)
0.11 (0.067)
Rurality Non-Metropolitan Urban 0.0053
(0.0040) -0.0083 (0.0048)
0.12** (0.052)
Rural 0.053** (0.019)
0.030** (0.015)
1.11** (0.39)
Age -0.0077** (0.00026)
-0.0073** (0.00034)
-0.15** (0.0061)
Gender -0.059** (0.0065)
0.011** (0.0050)
-1.10** (0.072)
# of Comorbidities 0.024** (0.00059)
0.013** (0.00073)
0.19** (0.011)
Race -0.077** (0.0040)
-0.035** (0.0049)
-0.42** (0.045)
Ethnicity 0.027 (0.017)
0.058 (0.029)
-0.41** (0.20)
Major Depression -- -0.11** (0.0066)
-1.09** (0.074)
Bipolar Disorder -0.066** (0.0036)
-- -1.30** (0.070)
Schizophrenia -0.024** (0.0045)
0.080** (0.0052)
--
Number of Persons 160,202 39,848 32,791 Number of Observations 4,856,299 1,225,211 1,169,003
Notes: Delta method SEs are in parentheses ** Statistically significant at the 0.05 level

95
Table 3.14: Propensity Score Weighted Average Monthly and Annual Marginal Effect of Medical Home Status Simulation on Rurality for Medication Adherence by Diagnosis
Major Depression Bipolar Disorder Schizophrenia
Medical Home Status on:+
Urban 0.060**b (0.0084)
0.066**a,b (0.0053)
0.17** (0.069)
Non-Metropolitan Urban 0.068**c (0.0069)
0.057**a,c (0.0068)
0.047 (0.15)
Rural -0.060 (0.055)
0.12**b,c (0.031)
-0.23 (0.32)
Number of Persons 160,202 39,848 32,791 Number of Observations 4,856,299 1,225,211 1,169,003
Notes: + compared to patients not in the medical home a Significant difference from rural b Significant difference from non-metropolitan urban c Significant difference from urban ** Statistically significant at the 5% level

96
Chapter 4: Table 4.1: Descriptive Statistics of Rural Medical Home Sample by Diagnosis
SMI Major Depression
Bipolar Disorder Schizophrenia
Individual Characteristics Age (yrs.) 40.27 39.95 37.89 45.20 Mental Health Diagnosis (%) Major Depression 80.26% -- 56.71% 32.76% Bipolar Disorder 17.08% 12.07% -- 18.60% Schizophrenia 11.11% 4.54% 12.10% -- Dual Eligibility: Yes (%) 21.03% 18.33% 18.87% 36.86% Gender: Male (%) 24.46% 21.78% 22.09% 47.44% Race Caucasian 70.52% 72.15% 81.35% 44.37% African-American 25.09% 23.43% 14.43% 50.85% Other 4.40% 4.42% 4.22% 4.78% Ethnicity 1.29% 1.32% 1.33% 1.54% Medicaid Eligibility: Disabled (%) 52.37% 48.78% 58.93% 91.47% Comorbidities (#) 6.65 6.70 7.78 7.76 Provider Characteristics Primary Care Provider Experience – Monthly (#)
123.18 122.50 135.24 130.28
Primary Care Provider Experience: High
15.72% 16.23% 18.53% 17.75%
Federally Qualified Health Center (%) 18.24% 18.00% 15.09% 25.94% County Unmet Need for Mental Health Providers (%)
35.98% 35.97% 35.43% 38.08%
Outcome Measures: Utilization Primary Care Visits (#) 1.28 1.31 1.47 1.33 Specialty Mental Health Visits (#) 1.25 1.07 2.30 3.38 Inpatient Hospitalizations (#) 0.23 0.23 0.29 0.46 Any Inpatient Hospitalizations (%) 33.49% 35.67% 40.40% 40.61% Emergency Department Visits (#) 0.34 0.36 0.46 0.30 Any Emergency Department (%) 14.64% 15.28% 17.90% 11.76% Medication Adherence Depression Medications 0.33 0.35 0.35 0.26 Bipolar Disorder Medications 0.069 0.056 0.18 0.12 Schizophrenia Medications 0.12 0.088 0.26 0.47
Number of Persons 5,274 4,233 901 586

97
Table 4.2: Average Marginal Effect in Monthly and Annual Primary Care Visits by Diagnosis in Rural PCMH
SMI Major Depression Bipolar Disorder Schizophrenia
Monthly Annual Monthly Annual Monthly Annual Monthly Annual
Provider Experience with SMI 0.26** (0.051)
3.12 0.27** (0.053)
3.24 0.079 (0.14)
0.948 0.059 (0.14)
0.708
Federally Qualified Health Center -1.49** (0.081)
-17.88 -1.44** (0.086)
-17.28 -1.85** (0.25)
-22.2 -1.05** (0.24)
-12.6
Age 0.004** (0.0014)
0.048 0.0065** (0.0015)
0.078 0.0030
(0.0035) 0.036
0.00065 (0.0034)
0.0078
Gender 0.066 (0.039)
0.792 0.041
(0.042) 0.492
0.034 (0.14)
0.408 0.055
(0.094) 0.66
# of Comorbidities 0.065** (0.0048)
0.78 0.062** (0.0052)
0.744 0.080** (0.011)
0.96 0.064** (0.013)
0.768
Dual Eligible 0.0045 (0.054)
0.054 -0.013 (0.062)
-0.156 0.029 (0.10)
0.348 0.12
(0.077) 1.44
Race -0.38** (0.039)
-4.56 -0.39** (0.041)
-4.68 -0.29** (0.11)
-3.48 -0.33** (0.084)
-3.96
Ethnicity 0.28** (0.13)
3.36 0.32** (0.14)
3.84 0.16
(0.29) 1.92
0.28 (0.38)
3.36
Major Depression -0.0099 (0.062)
-0.1188 -- -- -0.077 (0.094)
-0.924 0.086 (0.11)
1.032
Bipolar Disorder 0.065 (0.046)
0.78 0.057
(0.052) 0.684 -- --
-0.044 (0.12)
-0.528
Schizophrenia 0.088 (0.069)
1.056 0.15
(0.090) 1.8
-0.031 (0.14)
-0.372 -- --
Number of Persons 5,274 4,541 986 631 Number of Observations 116,236 99,198 20,847 16,866 Notes: Delta method SEs are in parentheses ** Statistically significant at the 5% level

98
Table 4.3: Average Marginal Effect in Monthly and Annual Specialty Mental Health Visits by Diagnosis in Rural PCMH
SMI Major Depression Bipolar Disorder Schizophrenia
Monthly Annual Monthly Annual Monthly Annual Monthly Annual
Provider Experience with SMI 0.48** (0.17)
5.76 0.37** (0.13)
4.44 0.65
(0.56) 7.8
1.35 (0.93)
16.2
Federally Qualified Health Center -0.73** (0.15)
-8.76 -0.55** (0.14)
-6.6 -1.20** (0.54)
-14.4 -2.25** (0.63)
-27
Age -0.061** (0.0077)
-0.732 -0.036** (0.0063)
-0.432 -0.11** (0.028)
-1.32 -0.28** (0.63)
-3.36
Gender 0.56** (0.15)
6.72 0.52** (0.13)
6.24 0.88
(0.049) 10.56
-0.019 (0.76)
-0.228
# of Comorbidities 0.12** (0.017)
1.44 0.059** (0.015)
0.708 0.20** (0.049)
2.4 0.39** (0.10)
4.68
Dual Eligible -0.15 (0.17)
-1.8 -0.29 (0.18)
-3.48 0.16
(0.38) 1.92
0.44 (0.58)
5.28
Race -0.28 (0.15)
-3.36 -0.18 (0.12)
-2.16 -0.40 (0.45)
-4.8 -1.80** (0.84)
-21.6
Ethnicity -0.44 (0.36)
-5.28 -0.11 (0.27)
-1.32 -1.29 (0.91)
-15.48 -1.92 (2.27)
-23.04
Major Depression -0.70** (0.20)
-8.4 -- -- -0.75 (0.48)
-9 -2.45** (1.04)
-29.4
Bipolar Disorder 0.36** (0.15)
4.32 0.56** (0.13)
6.72 -- -- -1.50 (0.95)
-18
Schizophrenia 1.65** (0.21)
19.8 1.23** (0.20)
14.76 1.89** (0.58)
22.68 -- --
Number of Persons 5,274 4,541 986 631 Number of Observations 116,236 99,198 20,847 16,866 Notes: Delta method SEs are in parentheses ** Statistically significant at the 5% level

99
Table 4.4: Average Marginal Effect in Monthly Likelihood of Any Inpatient Hospitalizations by Diagnosis in Rural PCMH
SMI Major Depression Bipolar Disorder Schizophrenia
Monthly Monthly Monthly Monthly
Provider Experience with SMI -0.0015 (0.0024)
-0.0020 (0.0027)
-0.0034 (0.0058)
0.0033 (0.0070)
Federally Qualified Health Center 0.0041 (0.0023)
0.0037 (0.0026)
0.0022 (0.0053)
0.0069 (0.0062)
Age -0.00030** (0.000075)
-0.00032** (0.000085)
-0.00024 (0.00017)
-0.00062** (0.00020)
Gender 0.0026 (0.0021)
0.0030 (0.0023)
0.0057 (0.0060)
-0.0025 (0.0048)
# of Comorbidities 0.0060** (0.000028)
0.0063** (0.00032)
0.0055** (0.00061)
0.0061** (0.00065)
Dual Eligible -0.028** (0.0027)
-0.031** (0.0032)
-0.037** (0.0072)
-0.033** (0.0066)
Race 0.000052 (0.0014)
0.00039 (0.0015)
-0.0074 (0.0042)
0.0015 (0.0043)
Ethnicity 0.0011 (0.0069)
0.0021 (0.0077)
-0.0062 (0.014)
-0.012 (0.019)
Major Depression 0.0045 (0.0031)
-- 0.013** (0.0051)
0.0022 (0.0054)
Bipolar Disorder -0.0028 (0.0023)
-0.0022 (0.0026)
-- -0.0019 (0.0054)
Schizophrenia 0.0032 (0.0026)
0.0019 (0.0032)
0.011** (0.0055)
--
Number of Persons 5,274 4,541 986 631 Number of Observations 116,236 99,198 20,847 16,866 Notes: Delta method SEs are in parentheses ** Statistically significant at the 5% level

10
0
Table 4.5: Average Marginal Effect in Monthly and Annual Inpatient Hospitalizations by Diagnosis in Rural PCMH
SMI Major Depression Bipolar Disorder Schizophrenia
Monthly Annual Monthly Annual Monthly Annual Monthly Annual
Provider Experience with SMI -0.0063 (0.017)
-0.0756 -0.016 (0.018)
-0.192 -0.036 (0.036)
-0.432 0.029
(0.060) 0.348
Federally Qualified Health Center 0.046** (0.017)
0.552 0.049** (0.019)
0.588 0.052
(0.039) 0.624
0.041 (0.054)
0.492
Age -0.0012** (0.00053)
-0.0144 -0.00095
(0.000060) -0.0114
-0.0019 (0.0012)
-0.0228 -0.0052** (0.0017)
-0.0624
Gender 0.032** (0.015)
0.384 0.037** (0.017)
0.444 0.064
(0.042) 0.768
-0.014 (0.044)
-0.168
# of Comorbidities 0.038** (0.0021)
0.456 0.039** (0.0023)
0.468 0.034** (0.0043)
0.408 0.047** (0.0063)
0.564
Dual Eligible -0.17** (0.022)
-2.04 -0.20** (0.0023)
-2.4 -0.19** (0.056)
-2.28 -0.24** (0.062)
-2.88
Race 0.016 (0.011)
0.192 0.020
(0.012) 0.24
-0.060 (0.031)
-0.72 0.026
(0.039) 0.312
Ethnicity 0.030 (0.050)
0.36 0.037
(0.055) 0.444
-0.12 (0.076)
-1.44 -0.055 (0.017)
-0.66
Major Depression 0.0077 (0.022)
0.0924 -- -- 0.083** (0.036)
0.996 -0.0091 (0.049)
-0.1092
Bipolar Disorder -0.014 (0.016)
-0.168 -0.0044 (0.018)
-0.0528 -- -- -0.017 (0.050)
-0.204
Schizophrenia 0.066** (0.019)
0.792 0.053** (0.022)
0.636 0.14** (0.042)
1.68 -- --
Number of Persons 5,274 4,541 986 631 Number of Observations 116,236 99,198 20,847 16,866 Notes: Delta method SEs are in parentheses ** Statistically significant at the 5% level

10
1
Table 4.6: Average Marginal Effect in Monthly Likelihood of Any Emergency Department Visits by Diagnosis in Rural PCMH
SMI Major Depression Bipolar Disorder Schizophrenia
Monthly Monthly Monthly Monthly
Provider Experience with SMI 0.011** (0.0051)
0.012** (0.0057)
0.018 (0.011)
-0.0041 (0.010)
Federally Qualified Health Center 0.0072 (0.0047)
0.0094 (0.0052)
-0.011 (0.013)
0.0077 (0.011)
Age -0.0029** (0.00016)
-0.0031** (0.00018)
-0.0035** (0.00044)
-0.0018** (0.00035)
Gender -0.0083 (0.0048)
-0.0085 (0.0054)
-0.0078 (0.014)
-0.0011 (0.010)
# of Comorbidities 0.018** (0.00059)
0.018** (0.00065)
0.019** (0.0015)
0.017** (0.0013)
Dual Eligible -0.021** (0.0056)
-0.022** (0.0065)
-0.044** (0.014)
-0.0085 (0.0010)
Race -0.019** (0.0036)
-0.019** (0.0039)
-0.029** (0.010)
-0.0017 (0.0085)
Ethnicity 0.015 (0.016)
0.016 (0.018)
-0.049 (0.040)
0.0023 (0.043)
Major Depression 0.020** (0.0079)
-- 0.012
(0.012) 0.022** (0.010)
Bipolar Disorder -0.0010 (0.0054)
-0.0072 (0.0062)
-- 0.026** (0.012)
Schizophrenia -0.025** (0.0076)
-0.015 (0.0093)
0.015 (0.015)
--
Number of Persons 5,274 4,541 986 631 Number of Observations 116,236 99,198 20,847 16,866 Notes: Delta method SEs are in parentheses ** Statistically significant at the 5% level

10
2
Table 4.7: Average Marginal Effect in Monthly and Annual Emergency Department Visits by Diagnosis in Rural PCMH
SMI Major Depression Bipolar Disorder Schizophrenia
Monthly Annual Monthly Annual Monthly Annual Monthly Annual
Provider Experience with SMI 0.038** (0.016)
0.456 0.043** (0.018)
0.516 0.039
(0.034) 0.468
-0.0044 (0.034)
-0.0528
Federally Qualified Health Center 0.032** (0.015)
0.384 0.041** (0.016)
0.492 0.0026 (0.047)
0.0312 0.070
(0.043) 0.84
Age -0.0081** (0.00058)
-0.0972 -0.0086** (0.00067)
-0.1032 -0.0093** (0.0022)
-0.1116 -0.0027 (0.0023)
-0.0324
Gender 0.0012 (0.017)
0.0144 0.00016 (0.019)
0.00192 0.042
(0.065) 0.504
0.041 (0.058)
0.492
# of Comorbidities 0.047** (0.0021)
0.564 0.049** (0.0024)
0.588 0.055** (0.0054)
0.66 0.050** (0.0051)
0.6
Dual Eligible -0.11** (0.019)
-1.32 -0.12** (0.022)
-1.44 -0.22** (0.061)
-2.64 -0.090** (0.045)
-1.08
Race -0.051** (0.012)
-0.612 -0.052** (0.013)
-0.624 -0.058 (0.044)
-0.696 0.014
(0.038) 0.168
Ethnicity 0.027 (0.042)
0.324 0.030
(0.048) 0.36
-0.14 (0.13)
-1.68 -0.028 (0.17)
-0.336
Major Depression 0.092** (0.030)
1.104 -- -- 0.080
(0.047) 0.96
0.14** (0.052)
1.68
Bipolar Disorder 0.021 (0.020)
0.252 0.0026 (0.021)
0.0312 -- -- 0.15** (0.067)
1.8
Schizophrenia -0.024 (0.030)
-0.288 0.015
(0.035) 0.18
-0.12 (0.065)
-1.44 -- --
Number of Persons 5,274 4,541 986 631 Number of Observations 116,236 99,198 20,847 16,866 Notes: Delta method SEs are in parentheses ** Statistically significant at the 5% level

103
Table 4.8: Average Marginal Effect of Monthly Medication Adherence by Diagnosis in Rural PCMH
Major Depression Bipolar Disorder Schizophrenia
Provider Experience with SMI -0.0070 (0.017)
0.026 (0.021)
-0.033 (0.056)
Federally Qualified Health Center -0.085** (0.024)
-0.026 (0.038)
-0.11 (0.059)
Age 0.0015** (0.00064)
0.0030** (0.0010)
-0.014** (0.0028)
Gender -0.054** (0.015)
0.085** (0.023)
-0.037 (0.049)
# of Comorbidities 0.016** (0.0016)
0.0074** (0.0027)
0.020** (0.0065)
Dual Eligible -0.29** (0.031)
-0.098** (0.034)
-0.39** (0.052)
Race -0.069** (0.013)
-0.029 (0.023)
0.049 (0.039)
Ethnicity 0.038 (0.040)
0.082 (0.077)
-0.22 (0.17)
Major Depression --
-0.050** (0.023)
-0.14** (0.055)
Bipolar Disorder 0.013 (0.014)
-- -0.049 (0.057)
Schizophrenia 0.027 (0.023)
0.037 (0.023)
--
Number of Persons 4,541 986 631 Number of Observations 99,198 20,847 16,866 Notes: Delta method SEs are in parentheses ** Statistically significant at the 0.05 level

10
4
Table 5.1: Average Marginal Effect in Monthly and Annual Primary Care Visits by Diagnosis in Rural PCMH
SMI Major Depression Bipolar Disorder Schizophrenia
Monthly Annual Monthly Annual Monthly Annual Monthly Annual
Provider Experience with SMI 0.35** (0.49)
4.2 0.36** (0.051)
4.32 0.13
(0.15) 1.56
0.095 (0.15)
1.14
Mental Health Workforce Shortage -0.45** (0.033)
-5.4 -0.46** (0.035)
-5.52 -0.42** (0.090)
-5.04 -0.23** (0.094)
-2.76
Experience X Workforce Interaction+ -0.45 (0.00)
-5.4 -0.41 (0.00)
-4.92 -0.15 (0.60)
-1.8 -0.19 (0.55)
-2.28
Federally Qualified Health Center -1.54** (0.087)
-18.48 -1.49** (0.093)
-17.88 -1.94** (0.29)
-23.28 -2.07** (0.24)
-24.84
Age 0.0043** (0.0014)
0.0516 0.0065** (0.0015)
0.078 0.0029
(0.0037) 0.0348
0.0010 (0.0035)
0.012
Gender 0.057 (0.038)
0.684 0.025
(0.041) 0.3
0.035 (0.14)
0.42 0.059
(0.094) 0.708
# of Comorbidities 0.065** (0.0048)
0.78 0.063** (0.0052)
0.756 0.079** (0.011)
0.948 0.066** (0.013)
0.792
Dual Eligible 0.011 (0.055)
0.132 -0.0048 (0.062)
-0.0576 0.028 (0.10)
0.336 0.12
(0.077) 1.44
Race -0.28** (0.038)
-3.36 -0.28** (0.040)
-3.36 -0.21 (0.11)
-2.52 -0.28** (0.087)
-3.36
Ethnicity 0.22 (0.12)
2.64 0.25** (0.13)
3 0.14
(0.27) 1.68
0.18 (0.37)
2.16
Major Depression 0.0099 (0.064)
0.1188 -- -- -0.058 (0.095)
-0.696 0.092 (0.11)
1.104
Bipolar Disorder 0.038 (0.047)
0.456 0.029
(0.052) 0.348 -- --
-0.065 (0.12)
-0.78
Schizophrenia 0.12 (0.072)
1.44 0.18
(0.093) 2.16
-0.0013 (0.15)
-0.0156 -- --
Number of Persons 5,274 4,541 986 631 Number of Observations 116,236 99,198 20,847 16,866 Notes: Delta method SEs are in parentheses ** Statistically significant at the 5% level + p-values reported in parentheses

10
5
Table 5.2: Average Marginal Effect in Monthly and Annual Specialty Mental Health Visits by Diagnosis in Rural PCMH
SMI Major Depression Bipolar Disorder Schizophrenia
Monthly Annual Monthly Annual Monthly Annual Monthly Annual
Provider Experience with SMI 0.55** (0.16)
6.6 0.42** (0.14)
5.04 0.70
(0.52) 8.4
1.32 (0.83)
15.84
Mental Health Workforce Shortage -0.093 (0.14)
-1.116 -0.074 (0.12)
-0.888 -0.24 (0.40)
-2.88 0.33
(0.89) 3.96
Experience X Workforce Interaction+ -0.61 (0.065)
-7.32 -0.41 (0.15)
-4.92 -0.33 (0.76)
-3.96 0.20
(0.91) 2.4
Federally Qualified Health Center -0.74** (0.15)
-8.88 -0.56** (0.15)
-6.72 -1.22** (0.56)
-14.64 -2.26** (0.63)
-27.12
Age -0.061** (0.0078)
-0.732 -0.036** (0.0064)
-0.432 -0.11** (0.028)
-1.32 -0.28** (0.043)
-3.36
Gender 0.59 (0.14)
7.08 -0.54** (0.13)
-6.48 0.89
(0.49) 10.68
-0.010 (0.75)
-0.12
# of Comorbidities 0.12** (0.017)
1.44 0.061** (0.015)
0.732 0.20** (0.049)
2.4 0.38** (0.10)
4.56
Dual Eligible -0.15 (0.17)
-1.8 -0.29 (0.18)
-3.48 0.16
(0.39) 1.92
0.44 (0.59)
5.28
Race -0.23 (0.16)
-2.76 -0.14 (0.13)
-1.68 -0.35 (0.47)
-4.2 -1.88 (0.98)
-22.56
Ethnicity -0.52 (0.36)
-6.24 -0.14 (0.27)
-1.68 -1.30 (0.87)
-15.6 -1.88 (2.29)
-22.56
Major Depression -0.73** (0.20)
-8.76 -- -- -0.77 (0.47)
-9.24 -2.44** (1.05)
-29.28
Bipolar Disorder 0.34** (0.15)
4.08 0.53** (0.13)
6.36 -- -- -1.45 (0.95)
-17.4
Schizophrenia 1.60** (0.21)
19.2 1.20** (0.20)
14.4 1.87** (0.57)
22.44 -- --
Number of Persons 5,274 4,541 986 631 Number of Observations 116,236 99,198 20,847 16,866 Notes: Delta method SEs are in parentheses ** Statistically significant at the 5% level + p-values reported in parentheses

10
6
Table 5.3: Average Marginal Effect in Monthly Likelihood of Any Inpatient Hospitalizations by Diagnosis in Rural PCMH
SMI Major Depression Bipolar Disorder Schizophrenia
Monthly Monthly Monthly Monthly
Provider Experience with SMI -0.0018 (0.0024)
-0.0020 (0.0027)
-0.0040 (0.0057)
0.0022 (0.0065)
Mental Health Workforce Shortage 0.00035 (0.0017)
0.00027 (0.0019)
0.0046 (0.0043)
0.0033 (0.0051)
Experience X Workforce Interaction 0.0017 (0.72)
0.00026 (0.96)
0.0013 (0.91)
0.017 (0.18)
Federally Qualified Health Center 0.0041 (0.0023)
0.0037 (0.0026)
0.0014 (0.0053)
0.0067 (0.0062)
Age -0.00030** (0.000075)
-0.00032** (0.000085)
-0.00023 (0.00017)
-0.00062** (0.00020)
Gender 0.0026 (0.0021)
0.0030 (0.0023)
0.0054 (0.0060)
-0.0026 (0.0049)
# of Comorbidities 0.0060** (0.00028)
0.0063** (0.00031)
0.0055** (0.00061)
0.0061** (0.00064)
Dual Eligible -0.028** (0.0027)
-0.031** (0.0032)
-0.036** (0.0072)
-0.033** (0.0066)
Race -0.000020 (0.0014)
0.00034 (0.0015)
-0.0082** (0.0042)
0.00078 (0.0044)
Ethnicity 0.0011 (0.0069)
0.0022 (0.0077)
-0.0054 (0.014)
-0.010 (0.019)
Major Depression 0.0045 (0.0031)
-- 0.012** (0.051)
0.0021 (0.0054)
Bipolar Disorder -0.0027 (0.0023)
-0.0022 (0.0026)
-- -0.00091 (0.0054)
Schizophrenia 0.0032 (0.0026)
0.0019 (0.0032)
0.011** (0.0055)
--
Number of Persons 5,274 4,541 986 631 Number of Observations 116,236 99,198 20,847 16,866 Notes: Delta method SEs are in parentheses ** Statistically significant at the 5% level

10
7
Table 5.4: Average Marginal Effect in Monthly and Annual Inpatient Hospitalizations by Diagnosis in Rural PCMH
SMI Major Depression Bipolar Disorder Schizophrenia
Monthly Annual Monthly Annual Monthly Annual Monthly Annual
Provider Experience with SMI -0.011 (0.016)
-0.132 -0.018 (0.018)
-0.216 -0.036 (0.037)
-0.432 0.019
(0.053) 0.228
Mental Health Workforce Shortage 0.0053 (0.013)
0.0636 0.0033 (0.014)
0.0396 0.017
(0.031) 0.204
0.066 (0.044)
0.792
Experience X Workforce Interaction+ 0.23 (0.47)
2.76 0.010 (0.77)
0.12 -0.016 (0.83)
-0.192 0.16
(0.091) 1.92
Federally Qualified Health Center 0.046** (0.017)
0.552 0.049** (0.018)
0.588 0.048
(0.039) 0.576
0.033 (0.055)
0.396
Age -0.0012** (0.00053)
-0.0144 -0.00095 (0.00060)
-0.0114 -0.0019 (0.0012)
-0.0228 -0.0052** (0.0016)
-0.0624
Gender 0.032** (0.015)
0.384 0.038** (0.017)
0.456 0.063
(0.042) 0.756
-0.017 (0.044)
-0.204
# of Comorbidities 0.038** (0.0021)
0.456 0.039** (0.0023)
0.468 0.034** (0.0043)
0.408 0.046** (0.0060)
0.552
Dual Eligible -0.17** (0.022)
-2.04 -0.20** (0.026)
-2.4 -0.19** (0.056)
-2.28 -0.24** (0.062)
-2.88
Race 0.015 (0.011)
0.18 0.020
(0.012) 0.24
-0.063** (0.031)
-0.756 0.013
(0.040) 0.156
Ethnicity 0.031 (0.049)
0.372 0.037
(0.055) 0.444
-0.11 (0.076)
-1.32 -0.030 (0.17)
-0.36
Major Depression 0.0075 (0.022)
0.09 -- -- 0.082** (0.036)
0.984 -0.012 (0.049)
-0.144
Bipolar Disorder -0.013 (0.016)
-0.156 -0.0039 (0.018)
-0.0468 -- -- -0.0048 (0.049)
-0.0576
Schizophrenia 0.066** (0.018)
0.792 0.053** (0.022)
0.636 0.13** (0.042)
1.56 -- --
Number of Persons 5,274 4,541 986 631 Number of Observations 116,236 99,198 20,847 16,866 Notes: Delta method SEs are in parentheses ** Statistically significant at the 5% level + p-values reported in parentheses
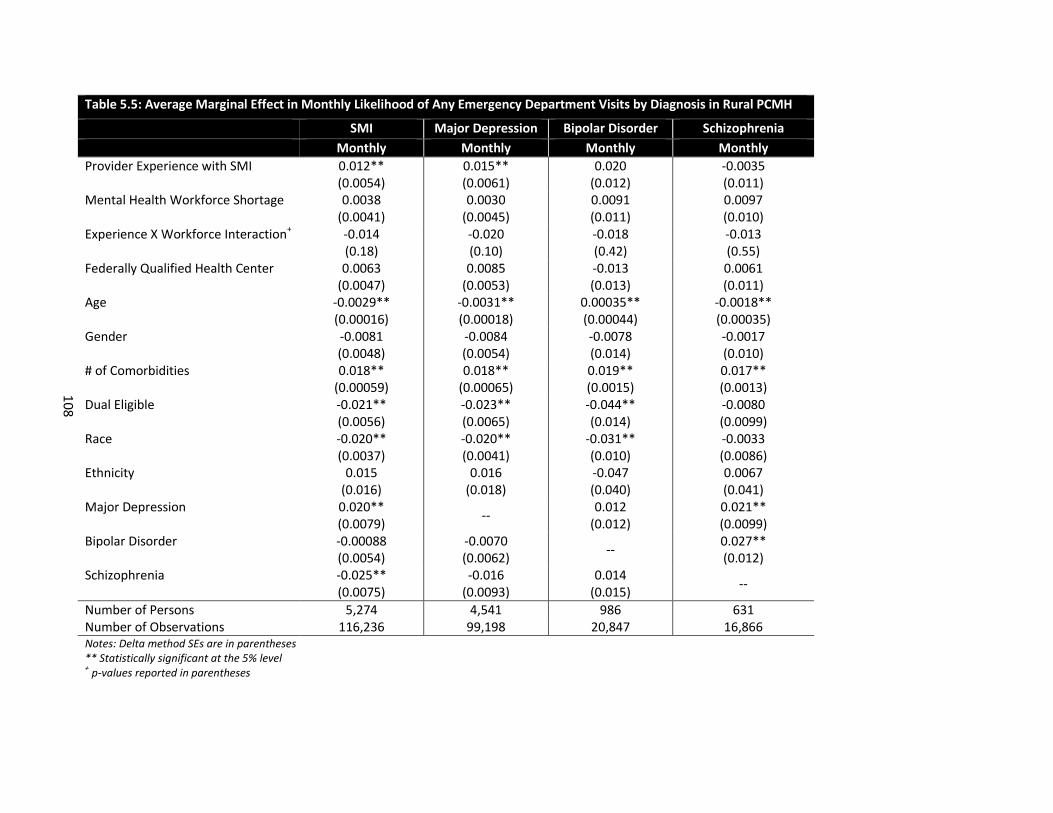
10
8
Table 5.5: Average Marginal Effect in Monthly Likelihood of Any Emergency Department Visits by Diagnosis in Rural PCMH
SMI Major Depression Bipolar Disorder Schizophrenia
Monthly Monthly Monthly Monthly
Provider Experience with SMI 0.012** (0.0054)
0.015** (0.0061)
0.020 (0.012)
-0.0035 (0.011)
Mental Health Workforce Shortage 0.0038 (0.0041)
0.0030 (0.0045)
0.0091 (0.011)
0.0097 (0.010)
Experience X Workforce Interaction+ -0.014 (0.18)
-0.020 (0.10)
-0.018 (0.42)
-0.013 (0.55)
Federally Qualified Health Center 0.0063 (0.0047)
0.0085 (0.0053)
-0.013 (0.013)
0.0061 (0.011)
Age -0.0029** (0.00016)
-0.0031** (0.00018)
0.00035** (0.00044)
-0.0018** (0.00035)
Gender -0.0081 (0.0048)
-0.0084 (0.0054)
-0.0078 (0.014)
-0.0017 (0.010)
# of Comorbidities 0.018** (0.00059)
0.018** (0.00065)
0.019** (0.0015)
0.017** (0.0013)
Dual Eligible -0.021** (0.0056)
-0.023** (0.0065)
-0.044** (0.014)
-0.0080 (0.0099)
Race -0.020** (0.0037)
-0.020** (0.0041)
-0.031** (0.010)
-0.0033 (0.0086)
Ethnicity 0.015 (0.016)
0.016 (0.018)
-0.047 (0.040)
0.0067 (0.041)
Major Depression 0.020** (0.0079)
-- 0.012
(0.012) 0.021** (0.0099)
Bipolar Disorder -0.00088 (0.0054)
-0.0070 (0.0062)
-- 0.027** (0.012)
Schizophrenia -0.025** (0.0075)
-0.016 (0.0093)
0.014 (0.015)
--
Number of Persons 5,274 4,541 986 631 Number of Observations 116,236 99,198 20,847 16,866 Notes: Delta method SEs are in parentheses ** Statistically significant at the 5% level + p-values reported in parentheses

10
9
Table 5.6: Average Marginal Effect in Monthly and Annual Emergency Department Visits by Diagnosis in Rural PCMH
SMI Major Depression Bipolar Disorder Schizophrenia
Monthly Annual Monthly Annual Monthly Annual Monthly Annual
Provider Experience with SMI 0.038** (0.016)
0.456 0.045** (0.018)
0.54 0.035
(0.033) 0.42
-0.0055 (0.032)
-0.066
Mental Health Workforce Shortage 0.030** (0.013)
0.36 0.032** (0.014)
0.384 0.057
(0.041) 0.684
0.065 (0.038)
0.78
Experience X Workforce Interaction+ -0.012 (0.69)
-0.144 0.89
(0.46) 10.68
0.0096 (0.89)
0.1152 0.030 (0.64)
0.36
Federally Qualified Health Center 0.028 (0.015)
0.336 0.037** (0.016)
0.444 -0.0021 (0.045)
-0.0252 0.061
(0.042) 0.732
Age -0.0080** (0.00058)
-0.096 -0.0085** (0.00066)
-0.102 -0.0092** (0.0022)
-0.1104 -0.0027 (0.0022)
-0.0324
Gender 0.0023 (0.017)
0.0276 0.0014 (0.020)
0.0168 0.039
(0.064) 0.468
0.035 (0.056)
0.42
# of Comorbidities 0.047** (0.0021)
0.564 0.049** (0.0024)
0.588 0.055** (0.0053)
0.66 0.049** (0.0048)
0.588
Dual Eligible -0.11** (0.018)
-1.32 -0.12** (0.022)
-1.44 -0.22
(0.061) -2.64
-0.089** (0.044)
-1.068
Race -0.057** (0.012)
-0.684 -0.059** (0.013)
-0.708 -0.068 (0.044)
-0.816 0.0012 (0.038)
0.0144
Ethnicity 0.030 (0.041)
0.36 0.034
(0.047) 0.408
-0.13 (0.13)
-1.56 0.011
(0.016) 0.132
Major Depression 0.090** (0.030)
1.08 -- -- 0.076
(0.046) 0.912
0.14** (0.049)
1.68
Bipolar Disorder 0.023 (0.020)
0.276 0.0046 (0.021)
0.0552 -- -- 0.16** (0.067)
1.92
Schizophrenia -0.027 (0.029)
-0.324 0.011
(0.035) 0.132
0.11 (0.064)
1.32 -- --
Number of Persons 5,274 4,541 986 631 Number of Observations 116,236 99,198 20,847 16,866 Notes: Delta method SEs are in parentheses ** Statistically significant at the 5% level + p-values reported in parentheses

110
Table 5.7: Average Marginal Effect of Monthly Medication Adherence by Diagnosis in Rural PCMH
Major Depression Bipolar Disorder Schizophrenia
Provider Experience with SMI -0.0093 (0.016)
0.021 (0.020)
-0.032 (0.052)
Mental Health Workforce Shortage -0.036** (0.011)
-0.011 (0.019)
0.047 (0.041)
Experience X Workforce Interaction+ 0.028 (0.40)
0.044 (0.28)
-0.046 (0.62)
Federally Qualified Health Center -0.082** (0.025)
-0.022 (0.037)
-0.11 (0.061)
Age 0.0014** (0.00065)
0.0031** (0.0010)
-0.015** (0.0028)
Gender -0.056** (0.015)
0.086** (0.023)
-0.038 (0.048)
# of Comorbidities 0.016** (0.0016)
0.0074** (0.0027)
0.020** (0.0066)
Dual Eligible -0.29** (0.032)
-0.096** (0.035)
-0.39** (0.052)
Race -0.062** (0.013)
-0.028 (0.023)
0.039 (0.039)
Ethnicity 0.034 (0.041)
0.079 (0.077)
-0.19 (0.18)
Major Depression --
-0.050** (0.023)
-0.15** (0.055)
Bipolar Disorder 0.012 (0.014)
-- -0.047 (0.057)
Schizophrenia 0.031 (0.023)
0.040 (0.023)
--
Number of Persons 4,541 986 631 Number of Observations 99,198 20,847 16,866 Notes: Delta method SEs are in parentheses ** Statistically significant at the 0.05 level + p-values reported in parentheses

111
REFERENCES
Adams, S. J., Xu, S., Dong, F., Fortney, J., & Rost, K. (2006). Differential effectiveness of depression
disease management for rural and urban primary care patients. J Rural Health, 22(4), 343-350.
Aday, L. A., & Andersen, R. (1974). A framework for the study of access to medical care. Health Serv Res, 9(3), 208-220.
Agency for Healthcare Research & Quality. (n.d.). Patient-Centered Medical Home Resource Center: Defining the PCMH. Retrieved August 12, 2012, from http://pcmh.ahrq.gov/portal/server.pt/community/pcmh__home/1483/pcmh_defining_the_pcpc_v2
Alakeson, V., Frank, R. G., & Katz, R. E. (2010). Specialty Care Medical Homes For People With Severe, Persistent Mental Disorders. Health Affairs, 29(5), 867-873.
American Academy of Family Physicians, American Academy of Pediatrics, A. C. o. P., & American Osteopathic Association. (2007). Joint principles of the patient-centered medical home.
American Academy of Pediatrics Ad Hoc Task Force on Definition of the Medical Home. (1992). The Medical Home. Pediatrics, 90(5), 774.
Andersen, R. (1995). Revisiting the behavioral model and access to medical care: does it matter? J Health Soc Behav, 36(1), 1-10.
Austin, P. C. (2008). A critical appraisal of propensity‐score matching in the medical literature between 1996 and 2003. Statistics in medicine, 27(12), 2037-2049.
Basu, A., Polsky, D., & Manning, W. (2011). Estimating treatment effects on healthcare costs under exogeneity: is there a ‘magic bullet’? Health Services and Outcomes Research Methodology, 11(1), 1-26.
Benner, J. S., Glynn, R. J., Mogun, H., Neumann, P. J., Weinstein, M. C., & Avorn, J. (2002). Long-term persistence in use of statin therapy in elderly patients. JAMA, 288(4), 455-461.
Bodenheimer, T., Wagner, E. H., & Grumbach, K. (2002). Improving primary care for patients with chronic illness: the chronic care model, Part 2. JAMA, 288(15), 1909-1914.
Bradford, D. W., Kim, M. M., Braxton, L. E., Marx, C. E., Butterfield, M., & Elbogen, E. B. (2008). Access to medical care among persons with psychotic and major affective disorders. Psychiatr Serv, 59(8), 847-852.
Butler, M., Kane, R. L., McAlpine, D., Kathol, R. G., Fu, S. S., Hagedorn, H., et al. (2008). Integration of Mental Health/Substance Abuse and Primary Care. Rockville, MD: Agency for Health Care Research and Quality.

112
Centers for Medicare & Medicaid Services. (November 16, 2010). Health Homes for Enrollees with Chronic Conditions.
Coburn, A. F., MacKinney, A. C., McBride, T. D., Mueller, K. J., Slifkin, R. T., & Wakefield, M. K. (2007). Choosing rural definitions: implications for health policy. Rural Policy Research Institute Health Panel. Issues Brief, 2.
Coleman, K., Austin, B. T., Brach, C., & Wagner, E. H. (2009). Evidence on the Chronic Care Model in the new millennium. Health Aff (Millwood), 28(1), 75-85.
Cunningham, P. J. (2009). Beyond Parity: Primary Care Physicians’ Perspectives On Access To Mental Health Care. Health Affairs, 28(3), w490-w501.
d’Agostino, R. B. (1998). Tutorial in biostatistics: propensity score methods for bias reduction in the comparison of a treatment to a non-randomized control group. Stat Med, 17(19), 2265-2281.
Domino, M. E., Humble, C., Lawrence, W. W., Jr., & Wegner, S. (2009). Enhancing the medical homes model for children with asthma. Med Care, 47(11), 1113-1120.
Domino, M. E., Wells, R. S., & Morrissey, J. P. (under review). Serving the Mentally Ill in Primary Care-based Medical Homes.
Druss, B. G., Miller, C. L., Pincus, H. A., & Shih, S. (2004). The volume-quality relationship of mental health care: does practice make perfect? American Journal of Psychiatry, 161(12), 2282-2286.
Flaskerud, J. H., & Kviz, F. J. (1982). Resources rural consumers indicate they would use for mental health problems. Community Ment Health J, 18(2), 107-119.
Fontaine, P., Flottemesch, T. J., Solberg, L. I., & Asche, S. E. (2011). Is consistent primary care within a patient-centered medical home related to utilization patterns and costs? J Ambul Care Manage, 34(1), 10-19.
Fortney, J. C., Harman, J. S., Xu, S., & Dong, F. (2010). The Association Between Rural Residence and the Use, Type, and Quality of Depression Care. The Journal of Rural Health, 26(3), 205-213.
Fox, J., Blank, M., Rovnyak, V., & Barnett, R. (2001). Barriers to Help Seeking for Mental Disorders in a Rural Impoverished Population. Community Mental Health Journal, 37(5), 421-436.
Fox, J., Merwin, E., & Blank, M. (1995). De facto mental health services in the rural south. J Health Care Poor Underserved, 6(4), 434-468.
Fung, Y. L., Chan, Z., & Chien, W. T. (2014). Role performance of psychiatric nurses in advanced practice: a systematic review of the literature. Journal of Psychiatric and Mental Health Nursing, n/a-n/a.
Guo, S., & Fraser, M. W. (2010). Propensity score analysis : Statistical methods and applications. Thousand Oaks, Calif.: Sage Publications.

113
Hall, S. A., Kaufman, J. S., & Ricketts, T. C. (2006). Defining urban and rural areas in US epidemiologic studies. Journal of urban health, 83(2), 162-175.
Halm, E. A., Lee, C., & Chassin, M. R. (2002). Is volume related to outcome in health care? A systematic review and methodologic critique of the literature. Annals of Internal medicine, 137(6), 511-520.
Hanrahan, N. P., & Hartley, D. (2008). Employment of advanced-practice psychiatric nurses to stem rural mental health workforce shortages. Psychiatr Serv, 59(1), 109-111.
Hardin, J. W., & Hilbe, J. M. (2007). Generalized Estimating Equations: John Wiley & Sons, Inc.
Hartley, D., Ziller, E. C., Loux, S. L., Gale, J. A., Lambert, D., & Yousefian, A. E. (2007). Use of critical access hospital emergency rooms by patients with mental health symptoms. J Rural Health, 23(2), 108-115.
Hauenstein, E. (2008). Building the rural mental health system: from De Facto system to quality care. Annual Review of Nursing Research, 26, 143-173.
Hauenstein, E., Petterson, S., Rovnyak, V., Merwin, E., Heise, B., & Wagner, D. (2007). Rurality and Mental Health Treatment. Administration and Policy in Mental Health and Mental Health Services Research, 34(3), 255-267.
Hilty, D. M., Ferrer, D. C., Parish, M. B., Johnston, B., Callahan, E. J., & Yellowlees, P. M. (2013). The effectiveness of telemental health: a 2013 review. Telemedicine and e-Health, 19(6), 444-454.
Hilty, D. M., Yellowlees, P. M., & Nesbitt, T. S. (2006). Evolution of telepsychiatry to rural sites: changes over time in types of referral and in primary care providers' knowledge, skills and satisfaction. General hospital psychiatry, 28(5), 367-373.
Himelhoch, S., & Ehrenreich, M. (2007). Psychotherapy by primary-care providers: results of a national sample. Psychosomatics, 48(4), 325-330.
A History of CCNC: The Evolution of Community Care of North Carolina (2014). Retrieved March 20, 2014, from https://www.communitycarenc.org/about-us/history-ccnc-rev/
Homer, C. J., Klatka, K., Romm, D., Kuhlthau, K., Bloom, S., Newacheck, P., et al. (2008). A Review of the Evidence for the Medical Home for Children With Special Health Care Needs. Pediatrics, 122(4), e922-e937.
Iglehart, J. K. (2008). No place like home--testing a new model of care delivery. N Engl J Med, 359(12), 1200-1202.
Jackson, G. L., Powers, B. J., Chatterjee, R., Bettger, J. P., Kemper, A. R., Hasselblad, V., et al. (2013). The Patient-Centered Medical Home: A Systematic Review. Annals of Internal medicine, 158(3), 169-178.
Kennedy, P. (2004). A Guide to Econometrics (5th ed.). Cambridge, Mass.: MIT Press.

114
Kessler, R. C., Berglund, P., Demler, O., Jin, R., Merikangas, K. R., & Walters, E. E. (2005). Lifetime Prevalence and Age-of-Onset Distributions of DSM-IV Disorders in the National Comorbidity Survey Replication. Arch Gen Psychiatry, 62(6), 593-602.
Kessler, R. C., Chiu, W. T., Colpe, L., Demler, O., Merikangas, K. R., Walters, E. E., et al. (2006). The Prevalence and Correlates of Serious Mental Illness (SMI) in the National Comorbidity Survey Replication (NCS-R). In R. W. Manderscheid & J. T. Berry (Eds.), Mental Health, United States, 2004. Rockville, MD: Substance Abuse and Mental Health Services Administration.
Kilbourne, A. M., Goodrich, D., Miklowitz, D. J., Austin, K., Post, E. P., & Bauer, M. S. (2010). Characteristics of patients with bipolar disorder managed in VA primary care or specialty mental health care settings. Psychiatr Serv, 61(5), 500-507.
Krahn, D. D., Bartels, S. J., Coakley, E., Oslin, D. W., Chen, H., McIntyre, J., et al. (2006). PRISM-E: Comparison of Integrated Care and Enhanced Specialty Referral Models in Depression Outcomes. Psychiatr Serv, 57(7), 946-953.
Lambert, D., Agger, M., & Hartley, D. (1999). Service Use of Rural and Urban Medicaid Beneficiaries Suffering From Depression: The Role of Supply. The Journal of Rural Health, 15(3), 344-355.
Liang, K. Y., & Zeger, S. L. (1986). Longitudinal data analysis using generalized linear models. Biometrika, 73(1), 13-22.
National Advisory Mental Health Council. (1993). Health care reform for Americans with severe mental illnesses: report of the National Advisory Mental Health Council. American Journal of Psychiatry, 150(10), 1447-1465.
O'Connor, E. A., Whitlock, E. P., Beil, T. L., & Gaynes, B. N. (2009). Screening for depression in adult patients in primary care settings: a systematic evidence review. Ann Intern Med, 151(11), 793-803.
Olfson, M., Das, A. K., Gameroff, M. J., Pilowsky, D., Feder, A., Gross, R., et al. (2005). Bipolar depression in a low-income primary care clinic. Am J Psychiatry, 162(11), 2146-2151.
Peikes, D., Zutshi, A., Genevro, J. L., Parchman, M. L., & Meyers, D. S. (2012). Early evaluations of the medical home: building on a promising start. Am J Manag Care, 18(2), 105-116.
Peterson, A. M., Nau, D. P., Cramer, J. A., Benner, J., Gwadry-Sridhar, F., & Nichol, M. (2007). A checklist for medication compliance and persistence studies using retrospective databases. Value Health, 10(1), 3-12.
Probst, J. C., Laditka, S. B., Moore, C. G., Harun, N., Powell, M. P., & Baxley, E. G. (2006). Rural-urban differences in depression prevalence: implications for family medicine. Fam Med, 38(9), 653-660.
Rash, M. (2012). North Carolina's Behavioral Health Delivery System: A Historical Perspective. North Carolina Medical Journal, 73(3), 185-188.

115
Regier, D. A., Narrow, W. E., Rae, D. S., Manderscheid, R. W., Locke, B. Z., & Goodwin, F. K. (1993). The de Facto US Mental and Addictive Disorders Service System: Epidemiologic Catchment Area Prospective 1-Year Prevalence Rates of Disorders and Services. Arch Gen Psychiatry, 50(2), 85-94.
Ricketts, T. C., Greene, S., Silberman, P., Howard, H. A., & Poley, S. (2004). Evaluation of Community Care of North Carolina Asthma and Diabetes Management Initiatives: January 2000-December 2002.
Rost, K., Adams, S., Xu, S., & Dong, F. (2007). Rural-urban differences in hospitalization rates of primary care patients with depression. Psychiatr Serv, 58(4), 503-508.
Rost, K., Fortney, J., Zhang, M., Smith, J., & Smith, G. R., Jr. (1999). Treatment of depression in rural Arkansas: policy implications for improving care. J Rural Health, 15(3), 308-315.
Shi, L., & Stevens, G. D. (2007). The role of community health centers in delivering primary care to the underserved: experiences of the uninsured and Medicaid insured. The Journal of ambulatory care management, 30(2), 159-170.
Sia, C., Tonniges, T. F., Osterhus, E., & Taba, S. (2004). History of the Medical Home Concept. Pediatrics, 113(Supplement 4), 1473-1478.
Substance Abuse and Mental Health Services Administration. (1993). Final notice establishing definitions for (1) children with a serious emotional disturbance, and (2) adults with a serious mental illness. Federal Register, 58, 29422- 29425.
Takach, M. (2011). Reinventing Medicaid: State Innovations To Qualify And Pay For Patient-Centered Medical Homes Show Promising Results. Health Affairs, 30(7), 1325-1334.
The Kaiser Commission on Medicaid and the Uninsured. (2011). Medicaid Policy Options for Meeting the Needs of Adults with Mental Illness under the Affordable Care Act.
Thomas, K. C., Ellis, A. R., Konrad, T. R., Holzer, C. E., & Morrissey, J. P. (2009). County-Level Estimates of Mental Health Professional Shortage in the United States. Psychiatr Serv, 60(10), 1323-1328.
United States Department of Agriculture Economic Research Service. (2003). Measuring Rurality: New Definitions in 2003. Retrieved August 10, 2011, from http://www.ers.usda.gov/Briefing/Rurality/NewDefinitions/
United States Department of Agriculture Economic Research Service. (2004). Measuring Rurality: Rural-Urban Continuum Codes. Retrieved August 10, 2011, from http://www.ers.usda.gov/briefing/rurality/ruralurbcon/
Wang, P. S., Demler, O., & Kessler, R. C. (2002). Adequacy of Treatment for Serious Mental Illness in the United States. American Journal of Public Health, 92(1), 92-98.
Wang, P. S., Lane, M., Olfson, M., Pincus, H. A., Wells, K. B., & Kessler, R. C. (2005). Twelve-Month Use of Mental Health Services in the United States: Results From the National Comorbidity Survey Replication. Arch Gen Psychiatry, 62(6), 629-640.

116
Willson, C. F. (2005). Community care of North Carolina: Saving state money and improving patient care. NC Med J, 66(3), 229-233.
Wolf, N. J., & Hopko, D. R. (2008). Psychosocial and pharmacological interventions for depressed adults in primary care: a critical review. Clin Psychol Rev, 28(1), 131-161.
Wooldridge, J. M. (2005). Introductory Econometrics: A Modern Approach (3rd ed.). Mason, OH: Thomson/South-Western.
Yuen, E. J., Gerdes, J. L., & Gonzales, J. J. (1996). Patterns of rural mental health care. An exploratory study. Gen Hosp Psychiatry, 18(1), 14-21.
Ziller, E. C., Anderson, N. J., & Coburn, A. F. (2010). Access to Rural Mental Health Services: Service Use and Out-of-Pocket Costs. The Journal of Rural Health, 26(3), 214-224.