the evolution of patient-centered medical homes in new
TRANSCRIPT
A N I S S U E B R I E F
The Evolution of Patient-Centered MedicalHomes in New York State:Current Status and Trendsas of September 2012

OFFICERS
J. Barclay Collins IIChairman
James R. Tallon, Jr.President
Patricia S. LevinsonFrederick W. Telling, PhDVice Chairmen
Sheila M. AbramsTreasurer
Sheila M. AbramsDavid A. GouldSally J. RogersSenior Vice Presidents
Michael BirnbaumDeborah E. HalperVice Presidents
Stephanie L. DavisCorporate Secretary
DIRECTORS
Richard A. BermanJo Ivey Boufford, MDRev. John E. CarringtonPhilip ChapmanJ. Barclay Collins IIRichard CottonWilliam M. Evarts, Jr.Michael R. Golding, MDJosh N. KuriloffPatricia S. LevinsonHoward P. MilsteinSusana R. Morales, MDRobert C. OsbornePeter J. PowersMary H. SchachneJohn C. SimonsMichael A. Stocker, MD, MPHMost Rev. Joseph M. SullivanJames R. Tallon, Jr.Frederick W. Telling, PhDMary Beth C. Tully
Howard SmithChairman Emeritus
HONORARY DIRECTORS
Donald M. EllimanDouglas T. YatesHonorary Chairmen
Herbert C. BernardJohn K. CastleTimothy C. ForbesBarbara P. GimbelRosalie B. GreenbergAllan Weissglass
United Hospital Fund
The United Hospital Fund is a health services researchand philanthropic organization whose primary mission is toshape positive change in health care for the people of NewYork. We advance policies and support programs that promotehigh-quality, patient-centered health care services that areaccessible to all. We undertake research and policy analysisto improve the financing and delivery of care in hospitals,health centers, nursing homes, and other care settings. Weraise funds and give grants to examine emerging issues andstimulate innovative programs. And we work collaborativelywith civic, professional, and volunteer leaders to identifyand realize opportunities for change.

U N I T E D H O S P I T A L F U N D
The Evolution ofPatient-Centered MedicalHomes in New York State:Current Status and Trendsas of September 2012
Gregory BurkeD I R E C T O R , I N N O VA T I O N S T R A T E G I E SU N I T E D H O S P I T A L F U N D

Copyright 2012 by United Hospital Fund
ISBN 1-933881-29-1
Free electronic copies of this report are available atthe United Hospital Fund’s website, www.uhfnyc.org.

Patient-Centered Medical Home Update, 2012 1
As part of the Fund’s work to promote positivechange by sharing good ideas and innovativesolutions, we have produced several reportsdetailing the evolution of the medical homemodel in New York State. In October 2011, ThePatient-Centered Medical Home: Taking a Modelto Scale in New York State served as backgroundfor last year’s Invitational Conference on thePatient-Centered Medical Home (PCMH) inNew York State, which was co-sponsored by theFund, the Primary Care DevelopmentCorporation, and the American College ofPhysicians. That report, prepared by GregoryBurke, described the characteristics and uniqueattributes of the patient-centered medical home,its spread across New York, and some of thechallenges to its further adoption.
This most recent report in the series, prepared asbackground for a second statewide invitationalconference, deepens our focus on this innovativearea. It provides a detailed picture of the numberof providers in New York State who work inpractice sites that the National Committee forQuality Assurance has recognized as PCMHs.The total number of PCMH providers in thestate grew by over 40 percent between July 2011and September 2012, with much of that growthoccurring in upstate communities. However,many challenges noted in last year’s report
remain, notably the continued slow growth ofthe model among small practices, and thevariability among payers in their support for thePCMH model, beyond pilot and demonstrationprojects. These are linked phenomena.
The Fund’s interest in the PCMH model of careis part of our continuing focus on identifying,analyzing, and helping disseminate promisinginnovations in health care. We are trackingchanges in the organization and delivery ofhealth care services, and in the way that care ispaid for — changes with the potential to improvethe quality, coordination, and cost-effectivenessof health care.
A growing body of evidence suggests that thePCMH model improves care, improves thepatient experience of care, and reduces costs. Ithas particular value in the care of patients withmultiple chronic conditions, who represent thehealth system’s highest-use, highest-costpatients. However, until the model is morewidely and consistently supported by commercialpayers (and by self-insured employers), and untilMedicare participates more regularly in theseefforts, it will be difficult to achieve or sustainthe further diffusion of this promising approachin New York.
JAMES R. TALLON, JR.PresidentUnited Hospital Fund
Foreword

This report was prepared as background for the2012 Invitational Conference on the Patient-Centered Medical Home in New York State,co-sponsored by the United Hospital Fund, thePrimary Care Development Corporation, and theAmerican College of Physicians. Thisconference, like last year’s, was organized at therequest of the New York State HealthCommissioner, Nirav Shah, MD, MPH.
The provider profiles presented in this report arethe result of analyses conducted by the author,
based on data provided by the New York StateOffice of Health Insurance Programs, the NewYork State Center for Health Workforce Studies,and the National Committee for QualityAssurance, all of whom were extremely helpfulin generating, sharing, and helping to interpretthose data.
This report was supported in part by the NewYork Community Trust, TD Bank,EmblemHealth, and Excellus BlueCrossBlueShield.
2 United Hospital Fund
Acknowledgment

This report and chartbook update the census ofpatient-centered medical home (PCMH)providers published in the United Hospital Fundreport, The Patient-Centered Medical Home:Taking a Model to Scale in New York State,released in October 2011. Both reports describethe spread of the PCMH model of care acrossthe state using three descriptors: region, level ofNational Committee for Quality Assurance(NCQA) recognition, and type of practice withinwhich those providers worked. The reportsprovide insights into the further spread of thePCMH model over the past year, and identifysome issues for consideration by the providercommunity, by payers, and by the StateDepartment of Health as the “medical home”movement matures.
New York State continues to exhibit stronggrowth of the PCMH model, and leads thenation in PCMH adoption. This growth isparticularly strong in certain regions of the stateand among certain provider types. This updatedescribes PCMH from two perspectives: thecurrent status of PCMH adoption in New Yorkas of September 2012 (Figures 1-14), andchanges in PCMH adoption between July 2011and September 2012 (Figures 15-21). All thefigures appear at the end of this report.
Data SourcesThis update uses the same data sources as theoriginal report. The NCQA provided the UnitedHospital Fund with a list of all providers workingin NCQA-recognized PCMHs as of a specificdate. The 2011 file included all PCMHproviders as of July 2011, with some basicdemographics and descriptors. The file uponwhich this report is based includes all PCMHproviders as of September 2012, with additionaldata and descriptors included.
DefinitionsFor consistency, we have maintained thedefinitions of the four main metrics used in lastyear’s report:
PCMH providers includes all providers listedin the NCQA report. In both 2011 and 2012,this definition included physicians (MD andDO) as well as mid-level providers (nursepractitioners, physician’s assistants, et al.). The2012 file from NCQA specified the individuals’licensure but the 2011 file did not. Analysis ofthe 2012 data showed that over 85 percent ofthe providers listed (4,550 of 5,312) were eitherMDs or DOs. For consistency with the 2011report, we have used the total number ofproviders listed, and the term “PCMH providers”in this report.
Level of NCQA recognition was included as aspecific data element in each of the two filesreceived from NCQA. The original NCQAPCC-PCMH standards, published in 2008, wereused by NCQA in its recognition process for allPCMHs analyzed in last year’s report. In 2011,NCQA published and began to use a revised setof standards for PCMH recognition. This newset of standards includes several changes in the“must-pass” elements, and in the weighting andscoring of measures — particularly those relatedto care management, patient engagement andself-management training for patients withchronic conditions — that determine thedifferent levels of recognition (Level 1, 2, or 3).
2012 has been a transition year. Most of thestate’s NCQA-recognized practices and providershave been recognized under the 2008 standards;that status is valid for three years from the dateof recognition. Although NCQA has beenaccepting applications for recognition under the2011 standards since mid-2011, they alsocontinued to accept applications under the 2008
Patient-Centered Medical Home Update, 2012 3
Introduction

4 United Hospital Fund
standards through June 2012. Since July 1,2012, all new applicants and all providersrecognized under the 2008 standards andapplying for an “upgrade” to the new standardshave been reviewed using the 2011 standards.
As of September 2012, roughly 250 providers inNew York had received NCQA recognition underthe 2011 standards. This number will increaseover the coming years, as providers’ initial three-year recognitions expire, and they (and other,new providers) apply for recognition under the2011 standards.
New York State regions. In the 2011 report weused a variant of New York State’s insuranceregions as a way of grouping and analyzingPCMH providers across the state; we have usedthis approach again. This methodology (seeAppendix for the county-region groupings usedin this report) groups the state’s counties into 7regions: New York City (given its size anddiversity, also analyzed at a borough level); LongIsland; the Hudson Valley; Albany/NortheastNew York; Rochester area; Syracuse/CentralNew York; and Buffalo/Western New York.
Practice type. Providers who work in differentsettings (e.g., large group vs. solo practice) oftenhave access to different resources (e.g., caremanagers and electronic medical record systems)
and they face different challenges in achievingand sustaining PCMH recognition. This updateuses the same six practice type categories thatthe 2011 report did.
• Group practice: Group practices withfive or more physicians listed on the NCQAroster
• Health center: Federally qualified healthcenters and State-licensed diagnostic andtreatment centers
• HHC: Hospitals and centers that arepart of New York City’s Health andHospitals Corporation
• Hospital clinic: On-site and community-based clinics of hospitals, licensed by NewYork State
• Hospital/AMC practice: Privatepractices and faculty practice plans based inhospitals and academic medical centers
• Practice: Small private practices withfewer than five physicians listed on theNCQA roster
In some cases these different types serve asmarkers for population served.

Patient-Centered Medical Home Update, 2012 5
Total PCMH ProvidersAs of September 2012, there were 5,312providers working in NCQA-recognized PCMHsin New York State. This is by far the largestnumber of PCMH providers in any state in thenation. As shown in Figure 1, roughly half of thetotal (2,768 PCMH providers, 52 percent) werelocated in New York City, and half (2,544providers, 48 percent) were in other regions ofthe state.
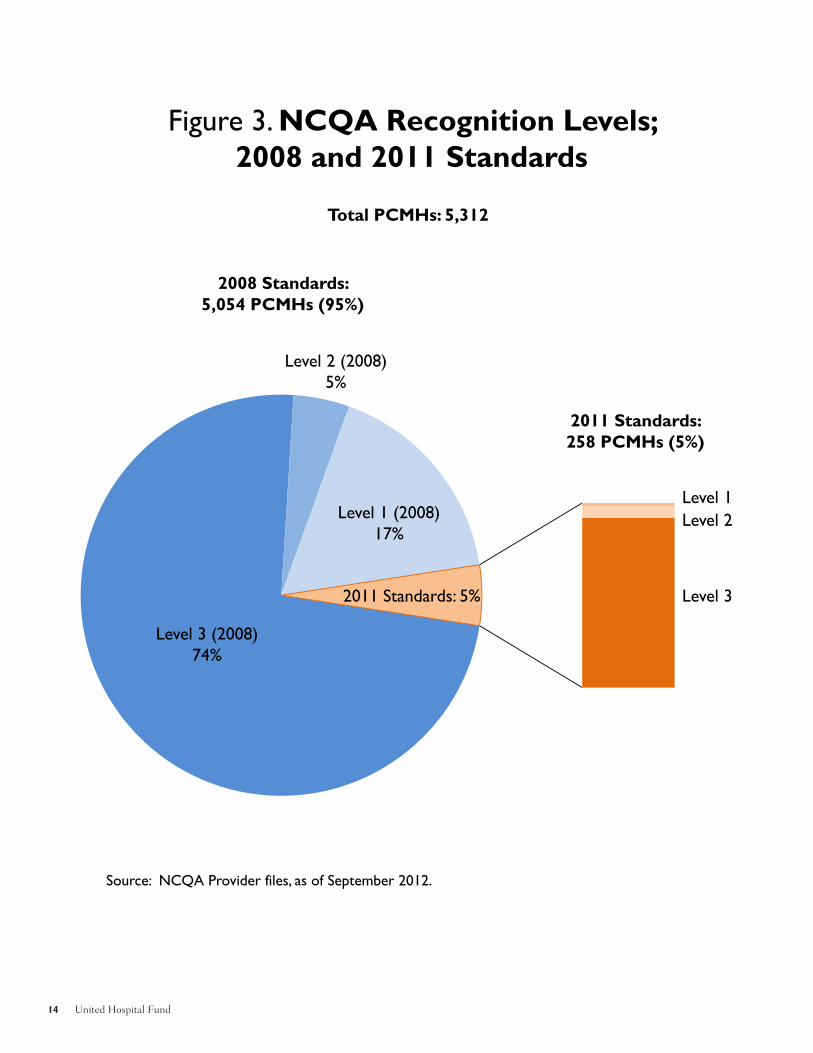
Level of NCQA RecognitionLevel 3 is NCQA’s highest level of recognition,given to practices that meet all of the keyelements and achieve a specific aggregate scoreon the certification process. Of the 5,312PCMH providers in New York, 78 percent wereworking in practices that NCQA recognized asLevel 3 PCMHs, 5 percent were in Level 2practices, and 17 percent were in Level 1practices (see Figure 2). As shown in Figure 3,the vast majority (over 95 percent) of the state’s5,312 NCQA-recognized PCMH providersreceived their NCQA recognition using the 2008standards. As of September 2012, roughly 250PCMH providers in New York State had receivedNCQA recognition using the 2011 standards,most of them at Level 3.
Distribution by Region, andLevel of NCQA RecognitionAs shown in Figure 4, the total number ofPCMH providers varied substantially across thestate regions and New York City boroughs, as didthe distribution of Level 1, 2, and 3 PCMHs.
Measuring PCMH Penetration To assess the “penetration” of the PCMH modelin a given county or region, or across the state,we developed a series of measures comparing thenumber of PCMH providers and physicians to
all primary care physicians practicing in thatarea, and to the region’s population. For the firsttwo analyses, we used the most recent availabledata (2008) from the New York State Center forHealth Workforce Studies (CHWS) on the totalsupply of primary care physicians (PCPs) in thestate’s 62 counties to estimate the number ofPCPs in the seven regions.
In 2011, lacking the ability to separatephysicians (MDs and DOs) from mid-levelpractitioners, we generated an estimate ofPCMH penetration using the total number ofPCMH providers as the numerator, and theCHWS estimates of PCP capacity in 2008 asthe denominator. In 2011, the statewide ratio ofPCMH providers to primary care physicians was18.5 percent.
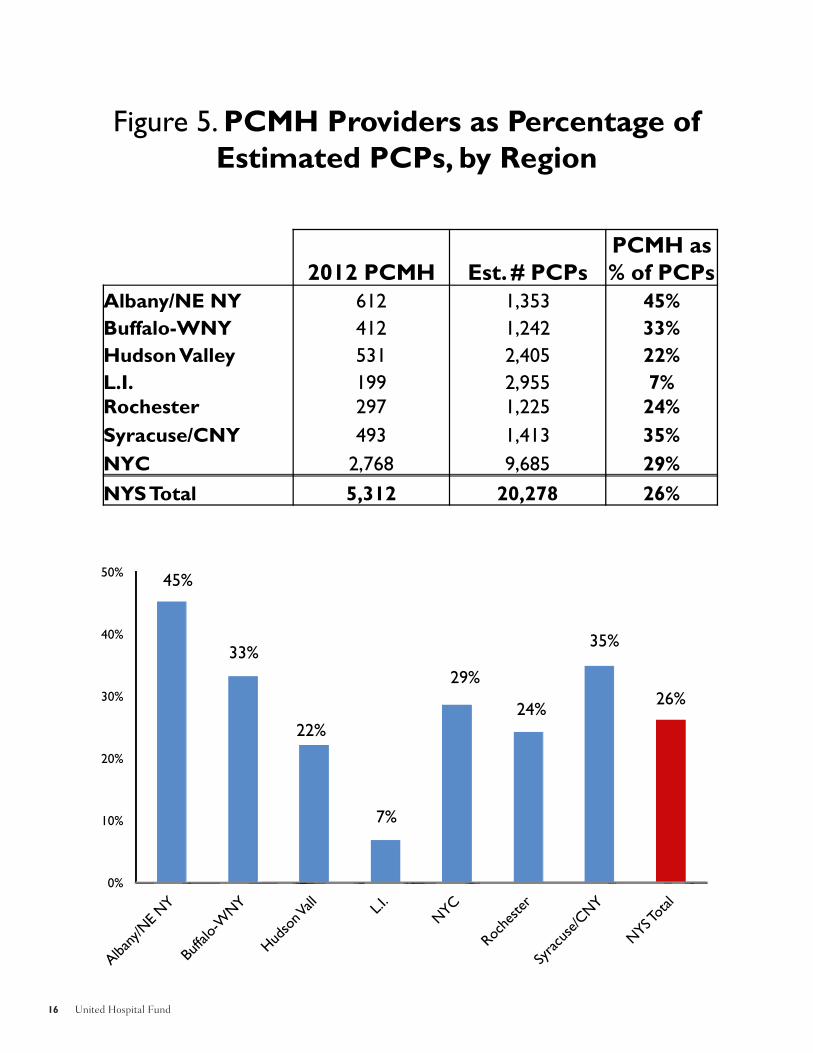
For comparability, we used this samemethodology in the first of three analyses ofPCMH penetration included in this report,yielding county-, region-, and state-level rates ofPCMH providers to estimated PCPs. Thestatewide ratio of PCMH providers to all PCPsin September 2012 was 26 percent (Figure 5),an increase of 40 percent over the past year. TheSeptember 2012 rates varied widely across thestate’s regions (Figure 6), from a low of 7 percenton Long Island to a high of 45 percent inAlbany/Northeast New York.
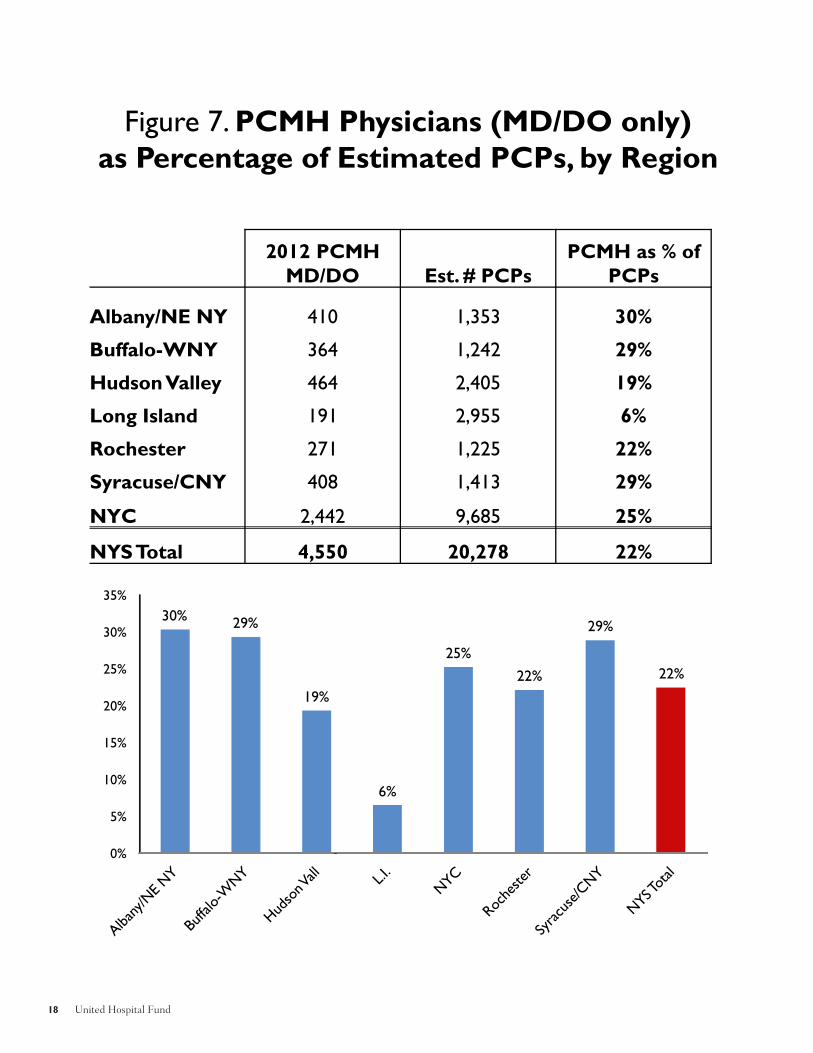
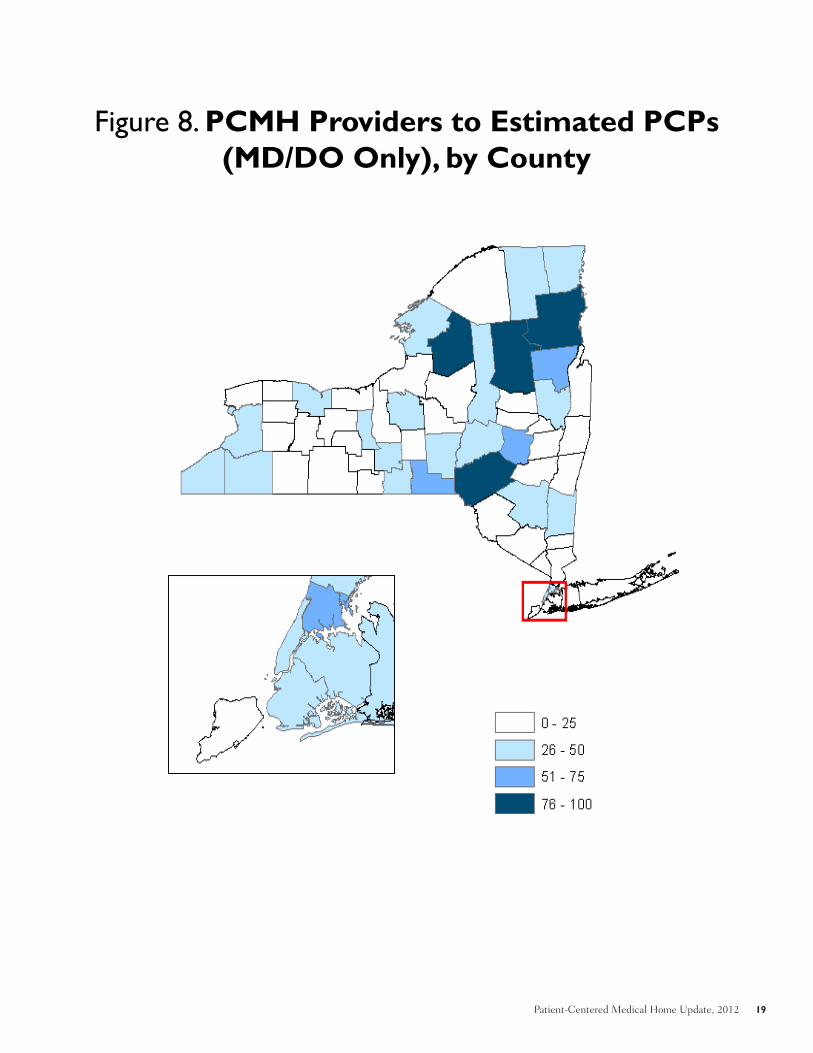
In our second assessment, we used theadditional detail provided in the 2012 databaseto generate an “apples-to-apples” comparison(Figure 7), using only PCPs in the numerator.This resulted in a slightly lower statewide rate ofPCMH penetration (22 percent) and lower ratesin most regions, particularly those (e.g.,Albany/Northeast New York) where mid-levelpractitioners were more heavily used by PCMHprovider groups (Figure 8).
PCMH Status as of September 2012

6 United Hospital Fund
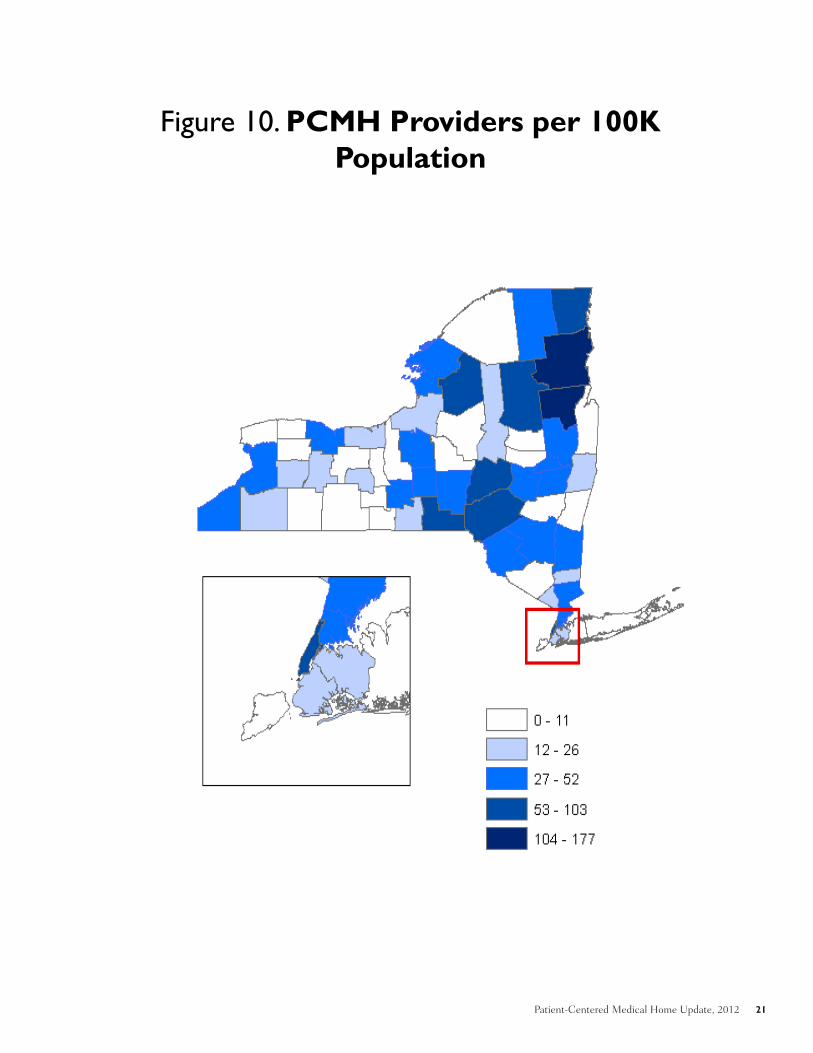
In our third assessment, we developed apopulation-based measure (PCMH providers per100,000 population) to estimate PCMHpenetration across the state, displaying theresulting county-level rates (which vary widely)both as a chart (Figure 9) and as a map (Figure10).
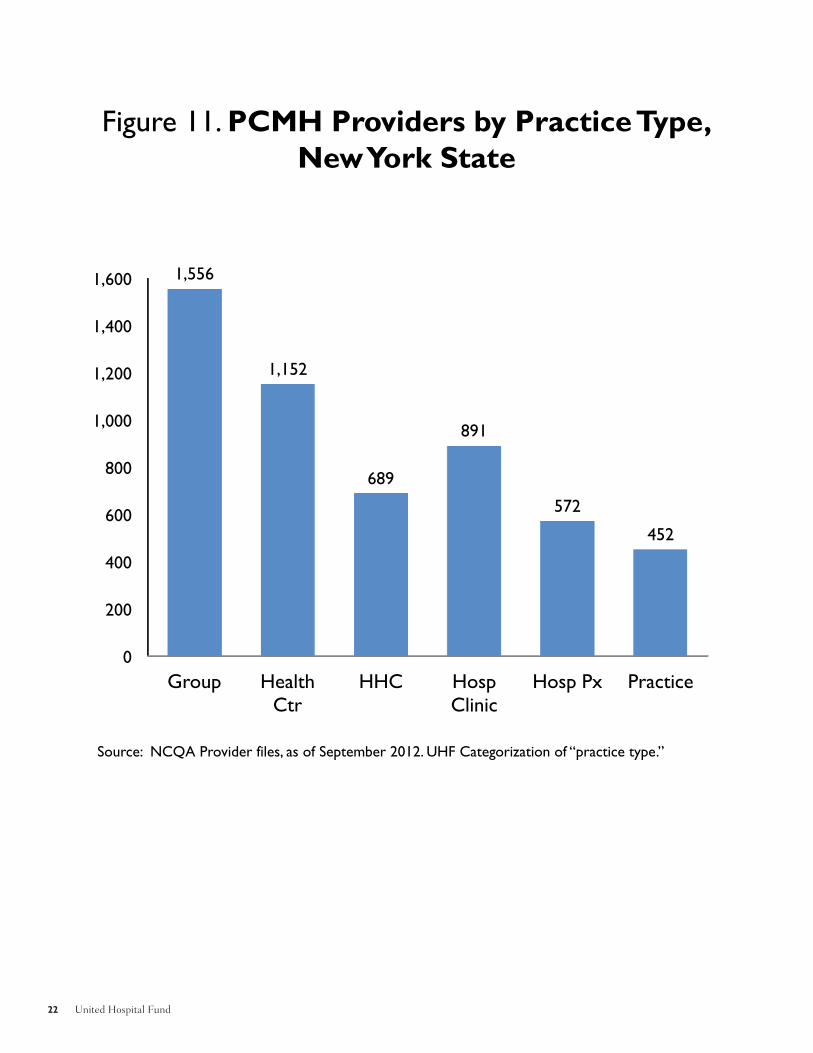
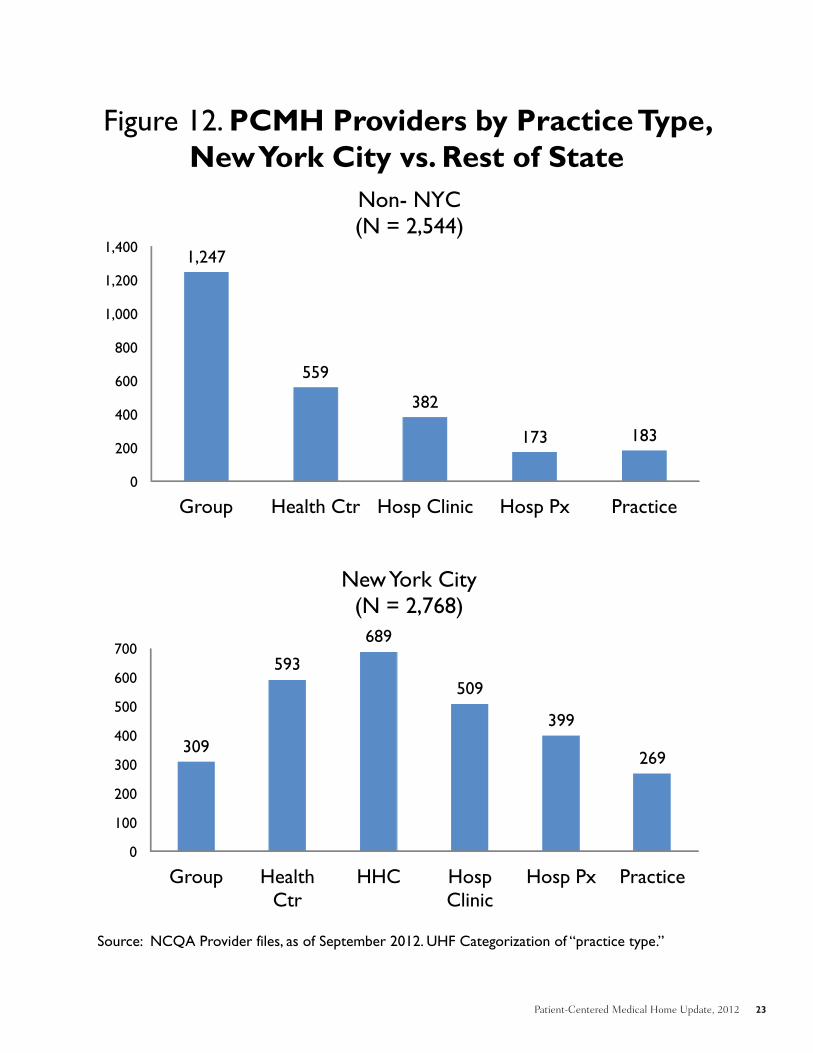
PCMH Providers by PracticeType and RegionWe analyzed the number of PCMH providers bypractice type both statewide (Figure 11) and byNew York City and non-NYC regions (Figure12). Statewide, large group practices and healthcenters — organizations with the scale andinfrastructure to more easily support the PCMHmodel — accounted for the largest numbers ofPCMH providers, followed by the New York CityHealth and Hospitals Corporation, hospitalclinics, and hospital/AMC practices. Smallpractices (practices with fewer than fiveproviders listed in the NCQA database, with theleast scale and infrastructure) were the smallestgroup.
As shown in Figure 13, the composition of thePCMH provider base differed greatly betweenNew York City and the rest of the state. In NewYork City, health centers and hospital-based
clinics and practices predominated; elsewhere,large groups were by far the largest cohort. Smallpractices represented a comparatively smallcohort in both regions. Within that broad trend,however, there were some stark differencesamong the seven regions of the state, and acrossthe five boroughs of New York City. Manhattanhad the largest concentration of PCMHproviders within hospital/AMC practices.Outside the city, while all regions showed asubstantial proportion of PCMH providers ingroups, the Hudson Valley and Albany had thelargest cohort within health centers, andSyracuse and Rochester had the largestconcentrations within hospital-based clinics andpractices.
Level of NCQA Recognition byPractice Type and RegionFinally, we analyzed the relationship between thelevel of NCQA recognition and practice type(Figure 14). Most providers across all practicetypes (including all providers in HHC) were inpractices that achieved Level 3 NCQArecognition, but a few practice types had higherproportions of providers in sites with Level 1 or 2recognition: hospital clinics (both in New YorkCity and in non-NYC regions), and hospitalpractices and small practices in New York City.
Patient-Centered Medical Home Update, 2012 7
Growth in Total PCMHProvidersBetween July 2011 and September 2012, thenumber of providers working in NCQA-recognized PCMHs grew by 42 percent, from astatewide total of 3,741 in July 2011 to 5,312 inSeptember 2012. That growth was uneven,however, between New York City and other partsof the state. As shown in Figure 15, the numberof PCMHs in non-NYC regions increased by 72percent over that period, while the number inNew York City grew by only 22 percent.
Each of the regions in upstate New York showeda substantial increase in the numbers of PCMHproviders, led by Syracuse/Central New York,where the number tripled, and Rochester, whereit more than doubled. In Albany and Buffalo thenumbers of PCMHs increased by over 70percent (Figures 16 and 17). Year-to-year growthin New York City and the Hudson Valley weremore moderate (increases of 22 percent and 31percent, respectively), but both were quiterobust in absolute numbers. Between 2011 and2012, the number of New York City PCMHproviders grew by over 500, with roughlyequivalent growth trajectories in all boroughs;and the number of PCMHs in the HudsonValley increased by 126. Long Island, with thelowest PCMH penetration in 2011, alsoexperienced the slowest growth between 2011and 2012, an increase of only 16 percent.
Levels of NCQA RecognitionThe total numbers of Level 1 and 2 providers inthe state remained stable from 2011 to 2012(Figure 17); almost all of the growth in totalPCMH providers over that period was in Level 3providers. Some new providers achieved Level 3recognition, and some providers previouslyrecognized as Level 1 or 2 progressed to Level 3.
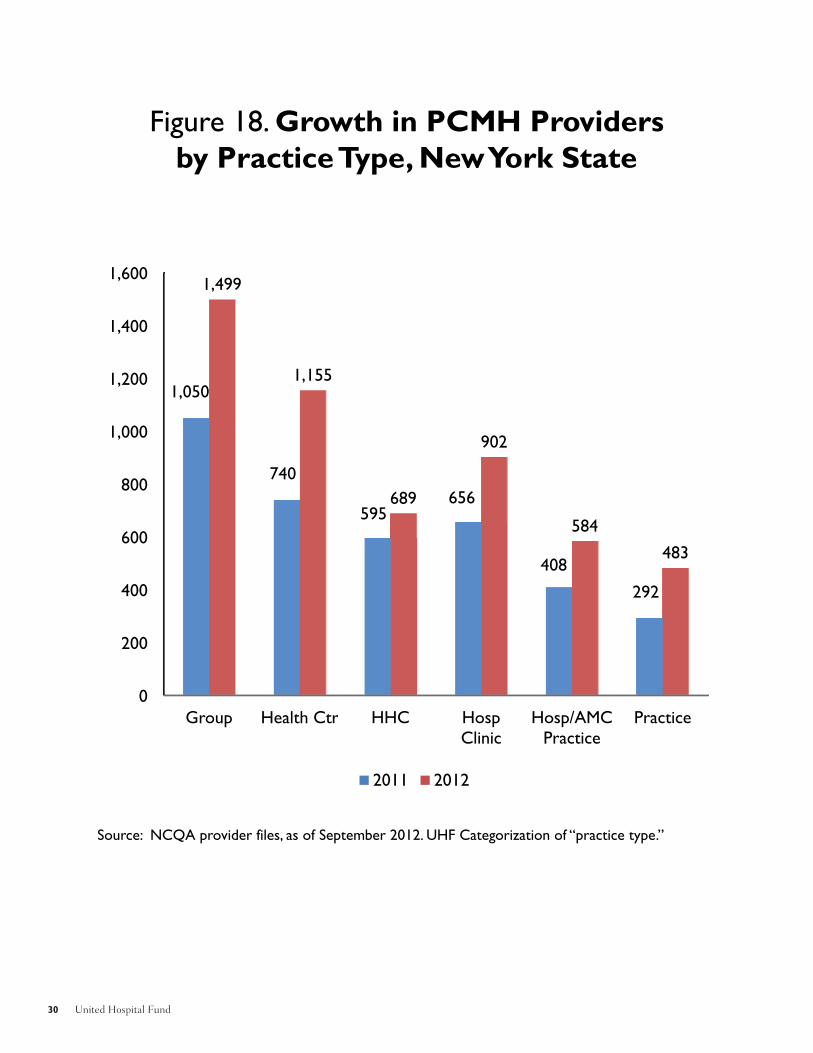
Growth by Practice Type andRegionFigure 18 depicts the growth in PCMHproviders by practice type. While there weresubstantial increases in the number of PCMHsin each category, most of the statewide growthbetween 2011 and 2012 occurred among groupsand health centers.
The growth patterns were quite differentbetween New York City and non-NYC regions(Figures 19 and 20). Outside New York City,most of the growth occurred in groups, healthcenters, and hospital clinics; in New York City,the growth came mainly from increases in healthcenters, small practices, and the HHC.
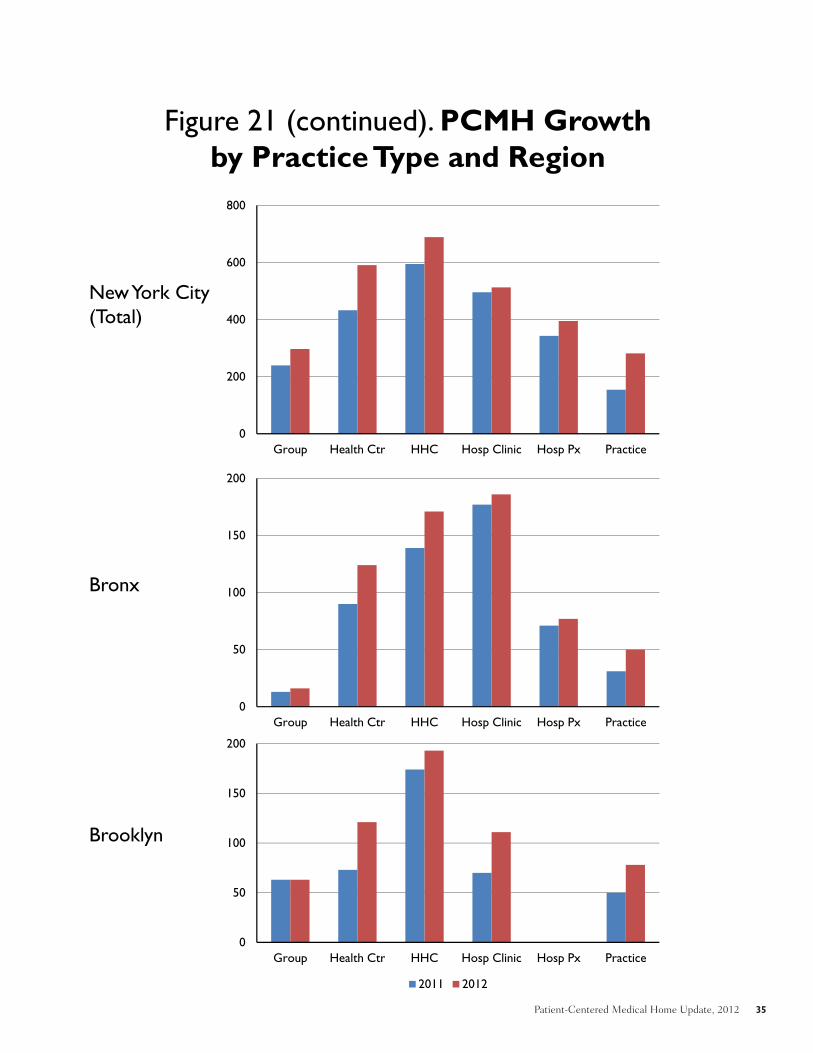
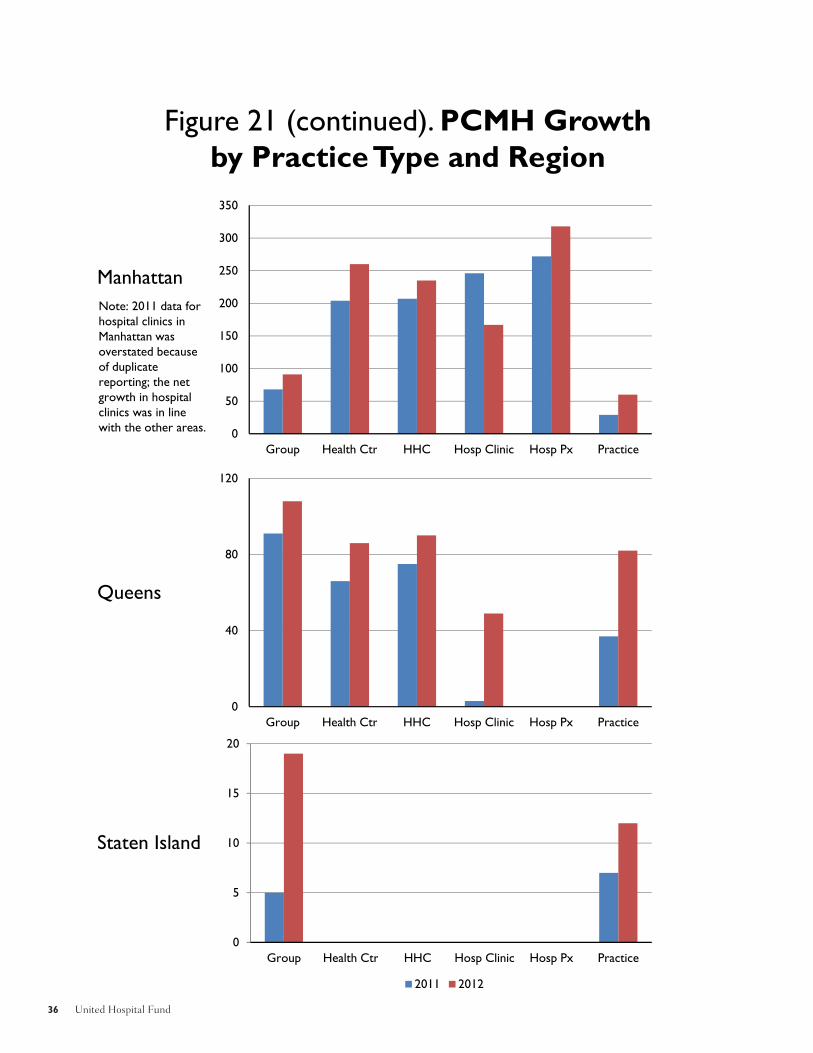
The composition of the PCMHs and theirgrowth patterns varied substantially by region(Figure 21). Notable regional differences ingrowth patterns include the following.
• In Albany/Northeast New York, wherethe PCMH census was relatively evenlyspread among groups, health centers,hospital clinics, and practices in 2011, therewas marked growth in groups, healthcenters, and hospital clinics in 2012.
• In Buffalo/Western New York, where thePCMH census was dominated by groups in2011, there was further growth in groups, aswell as in health centers and practices in2012.
• In the Hudson Valley, which wasdominated by groups and health centers,there was further growth in both types in2012.
• In Syracuse/Central New York, whichhad a comparatively low PCMH penetration
Growth in PCMH Recognition, July 2011 to September 2012

8 United Hospital Fund
in 2011, there was a large increase in 2012,driven by major increases in hospital clinicsand groups.
• In Rochester, where the PCMH censuswas evenly spread in 2011 among groups,health centers, hospital clinics, andhospital/AMC practices, there wassubstantial growth in 2012, driven in largepart by an increase in hospital/AMCpractices.
• On Long Island, which had the lowestPCMH penetration of any region, largelycomposed of groups, there was slight growthin 2012.
The boroughs of New York City were similarlydiverse in their composition and growthtrajectories.
• In 2011, New York City’s PCMH profilewas broadly based, with HHC, hospitalclinics, health centers, and hospital/AMCpractices all accounting for substantialproportions of the total. In 2012 eachcategory showed overall growth; the largest
absolute growth was in health centers,HHC, and practices.
• The Bronx, which had a moreinstitution-based PCMH profile in 2011,mainly in health centers, HHC, hospitalclinics, and hospital/AMC practices, grewin both health centers and HHC.
• Brooklyn, which in 2011 had the mostPCMHs in HHC, and smaller numbers ingroups, health centers, hospital clinics, andpractices, showed the largest growth inhealth centers and hospital clinics.
• Manhattan, which had a relatively evenspread of PCMHs among health centers,HHC, and hospital clinics, as well as thestate’s largest cohort in hospital/AMCpractices, grew slightly in all of the practicetypes.
• Staten Island, which had the smallestnumber of PCMHs of any borough, wasspread between groups and practices in2011, both of which grew (particularlygroups) in 2012.

Patient-Centered Medical Home Update, 2012 9
ConclusionAs this updated profile indicates, the adoption ofthe PCMH model continues to expand acrossNew York State as a new way to organize andprovide primary care services. The number ofNew York State providers working in NCQA-recognized PCMH practices, already by far thelargest of any state in the nation, has continuedto grow, increasing by another 40 percentbetween July 2011 and September 2012. Thepenetration of the PCMH model across thestate, however, continues to be uneven; it differsmarkedly from one region to another, and itvaries substantially among different types ofproviders and settings.
As we observed in last year’s report, the spread ofPCMH continues to be dominated by organizedgroups of providers: groups, health centers, andhospital-based clinics and practices. These areorganizations with sufficient scale to support theinvestments and working capital that practicetransformation requires, as well as the relevantinfrastructure — electronic medical records,regional data exchanges, registries, and the staffand systems needed to perform caremanagement and improve patient engagement.
In some parts of the state, small physicianpractices have received assistance enabling themto pursue and gain PCMH recognition fromNCQA, using creative approaches to acquiringresources and sharing them with the involvedpractitioners. Examples include New York City,where support has been provided by the PrimaryCare Information Program (PCIP); the HudsonValley, where the effort has been supported bythe Taconic Health Information Network andCommunity (THINC) and the TaconicIndependent Practice Association; theAdirondacks, where ongoing support has beenprovided through the Adirondack HealthInstitute; Buffalo, where the P2 Collaborative,the Health Foundation of Central and WesternNew York, and Catholic Medical Partners have
provided small practices with ongoing supportand technical assistance; and Rochester, wheresupport has been provided through the FingerLakes Health Systems Agency. Our 2012analysis shows that such efforts and trends arecontinuing to appear.
Another continuing theme is the differential rateof PCMH growth, shaped in part by providersreceiving consistent support from payers,including augmented payment for services theyprovide as PCMHs.
• Medicaid has adopted the PCMHmodel as a standard of care, providingsupport for PCMHs statewide. Thisaccounts in large part for the penetration ofthe model in the state’s health centers andsafety-net provider systems.
• Payer-specific PCMH pilots anddemonstration projects in particular regionswith specific providers are continuing tohave some impact, but such efforts alonecannot produce the saturation needed toaffect the entire community.
• In some areas (e.g., the Adirondacks andnow the Hudson Valley), the major payers,including Medicare, have organizedmultipayer arrangements to support thePCMH model. Such arrangements haveallowed and enabled further expansion ofthe PCMH model in those regions.
• In still other communities, such asRochester, the payer base is sufficientlyconcentrated that the coordinated efforts ofa few major commercial payers (along withMedicaid) have been able to stimulate andsupport the regional growth of PCMHs.
One interesting development, continuing a trendnoted in 2011, is the adoption of the PCMH
10 United Hospital Fund
model by large organized group practices thatparticipated in one or more payer-specificPCMH demonstrations covering comparativelysmall proportions of their patients. These groups— including the Crystal Run Medical Group inMiddletown, WestMed and Mount KiscoMedical Group in Westchester, and theFamilyCare Medical Group in Syracuse — alladopted the PCMH model because theyconsidered those capacities to be a foundationfor their efforts to manage population health.Each of these groups is now participating inMedicare’s ACO Shared Savings program.
Finally, in 2011 we noted the relatively low ratesof PCMH adoption by two types of providers:hospital clinics and small practices. Over thepast year, the State Department of Health
received a federal grant to provide resources andtechnical assistance to teaching hospitals andclinics, enabling them to change their practicemodel to that of a PCMH, targeting the receiptof NCQA Level 3 recognition by all participatinghospitals within two years.
The continued slow growth of PCMH adoptionamong small practices in New York State,however, is likely to prove more difficult tochange. Such practices are still the main sourceof primary care for many patients across thestate, including many covered by Medicare andcommercial insurance. Generating enough payersupport for the PCMH model, and increasingthe model’s spread among small practices, willlikely remain a challenge.

Patient-Centered Medical Home Update, 2012 11
Figures 1-14:PCMH Status as of September 2012
P 1

12 United Hospital Fund
Figure 1. PCMH Providers by Region
Non-NYC2,544
NYC2,768
Source: NCQA Provider files, as of September 2012.
1

Patient-Centered Medical Home Update, 2012 13
Figure 2. PCMH Providers by Level of NCQA Recognition, New York State
Level 1912
Level 2256
Level 34,144
Source: NCQA Provider files, as of September 2012.
P 1
14 United Hospital Fund
Figure 3. NCQA Recognition Levels; 2008 and 2011 Standards
Source: NCQA Provider files, as of September 2012.
1
Level 1 (2008)17%
Level 2 (2008)5%
Level 3 (2008)74%
2011 Standards: 5%
Level 1Level 2
Level 3
2008 Standards: 5,054 PCMHs (95%)
2011 Standards: 258 PCMHs (5%)
Total PCMHs: 5,312

Patient-Centered Medical Home Update, 2012 15
Figure 4. PCMH Providers by Level and Region
0
100
200
300
400
500
600
700
Albany/NE NY Buffalo/WNY Hudson Valley L.I. Rochester Syracuse/CNY
Non New York City(N=2,544)
0
200
400
600
800
1,000
1,200
Bronx Brooklyn Manhattan Queens Staten Isl
New York City (N=2,678)
Level 1 Level 2 Level 3
Source: NCQA Provider files, as of September 2012.P C d Medical Home Update, 2012 15
16 United Hospital Fund
Figure 5. PCMH Providers as Percentage of Estimated PCPs, by Region
2012 PCMH Est. # PCPsPCMH as % of PCPs
Albany/NE NY 612 1,353 45%Buffalo-WNY 412 1,242 33%Hudson Valley 531 2,405 22%L.I. 199 2,955 7%Rochester 297 1,225 24%Syracuse/CNY 493 1,413 35%NYC 2,768 9,685 29%NYS Total 5,312 20,278 26%
0%
10%
20%
30%
40%
50% 45%
33%
22%
7%
29%
24%
35%
26%
1

Patient-Centered Medical Home Update, 2012 17
Figure 6. PCMH Providers to Estimated PCPs, by County
P 1
Sources: NCQA database, September 2012 (PCMH providers); Center for Workforce Statistics, 2008 (estimated PCPs).
18 United Hospital Fund
Figure 7. PCMH Physicians (MD/DO only) as Percentage of Estimated PCPs, by Region
0%
5%
10%
15%
20%
25%
30%
35%30% 29%
19%
6%
25%
22%
29%
22%
2012 PCMH MD/DO Est. # PCPs
PCMH as % of PCPs
Albany/NE NY 410 1,353 30%
Buffalo-WNY 364 1,242 29%
Hudson Valley 464 2,405 19%
Long Island 191 2,955 6%
Rochester 271 1,225 22%
Syracuse/CNY 408 1,413 29%
NYC 2,442 9,685 25%
NYS Total 4,550 20,278 22%
1
Patient-Centered Medical Home Update, 2012 19
Figure 8. PCMH Providers to Estimated PCPs (MD/DO Only), by County
P 1

20 United Hospital Fund
0 20 40 60 80 100 120 140 160 180
YatesWyoming
WestchesterWayne
WashingtonWarren
UlsterTompkins
TiogaSullivanSuffolk
SteubenStaten IslandSt. Lawrence
SenecaSchuyler
SchoharieSchenectady
SaratogaRockland
RensselaerQueensPutnamOtsego
OswegoOrleansOrangeOntario
OnondagaOneida
NYS TotalNiagara
New YorkNassau
MontgomeryMonroeMadison
LivingstonLewisKings
JeffersonHerkimerHamilton
GreeneGenesee
FultonFranklin
EssexErie
DutchessDelawareCortlandColumbia
ClintonChenangoChemung
ChautauquaCayuga
CattaraugusBroome
BronxAllegany
Albany
Figure 9. PCMH Providers per 100K Population, by County, September 2012
2
Patient-Centered Medical Home Update, 2012 21
Figure 10. PCMH Providers per 100K Population
P 2
22 United Hospital Fund
Figure 11. PCMH Providers by Practice Type,New York State
0
200
400
600
800
1,000
1,200
1,400
1,600
Group Health Ctr
HHC Hosp Clinic
Hosp Px Practice
1,556
1,152
689
891
572
452
Source: NCQA Provider files, as of September 2012. UHF Categorization of “practice type.”
2
Patient-Centered Medical Home Update, 2012 23
Figure 12. PCMH Providers by Practice Type, New York City vs. Rest of State
0
100
200
300
400
500
600
700
Group Health Ctr
HHC Hosp Clinic
Hosp Px Practice
309
593
689
509
399
269
New York City(N = 2,768)
0
200
400
600
800
1,000
1,200
1,400
Group Health Ctr Hosp Clinic Hosp Px Practice
1,247
559
382
173 183
Non- NYC (N = 2,544)
Source: NCQA Provider files, as of September 2012. UHF Categorization of “practice type.”
P 2

24 United Hospital Fund
Figure 13. PCMH Providers by Practice Type and Region, New York State
0
200
400
600
800
1,000
1,200
New York City Non-NYC
Group Health Ctr HHC Hosp Clinic Hosp/AMC Px Practice
Source: NCQA Provider files, as of September 2012. UHF Categorization of “practice type.”
2

Patient-Centered Medical Home Update, 2012 25
Figure 14. PCMH Providers by Practice Type, Level, and Region
0
200
400
600
800
1,000
1,200
1,400
Group Health Ctr Hosp Clinic Hosp Px Practice
Non- NYC (N = 2,544)
0
200
400
600
800
Group Health Ctr HHC Hosp Clinic Hosp Px Practice
New York City (N = 2,768)
Level 1 Level 2 Level 3
Source: NCQA Provider files, as of September 2012. UHF Categorization of “practice type.”
P 2
26 United Hospital Fund
Figures 15-21: Growth in PCMH Recognition, July 2011 to September 2012
2

Patient-Centered Medical Home Update, 2012 27
1,480
2,261
2,5442,768
0
500
1,000
1,500
2,000
2,500
3,000
Non-NYC PCMH NYC PCMH
July 2011 September 2012
NYC growth = 22%Non-NYC Growth = 72%
Source: NCQA provider files, as of September 2012.
Figure 15. Growth in NCQA-Recognized PCMH Providers, New York City vs. Rest of State
P 2

28 United Hospital Fund
-
200
400
600
800
1,000
1,200
Bronx Brooklyn New York Queens Staten Island
521 430
1,026
272
12
624 567
1,131
415
31
NYC Boroughs
July, 2011 Sept., 2012
-
100
200
300
400
500
600
700
Albany/NE NY Buffalo/WNY Hudson Valley L.I. Rochester Syracuse/CNY
355
243
405
172 145
160
612
412
531
199
297
493
Non-NYC
Source: NCQA provider files, as of September 2012.
Figure 16. Growth in NCQA-Recognized PCMH Providers, by Region
2

Patient-Centered Medical Home Update, 2012 29
2011 Level 1 Level 2 Level 3 Grand Total % NYS Total
Albany/NE NY 55 3 297 355 9%Buffalo Area 2 241 243 6%Hudson Valley 11 10 384 405 11%L.I. 6 79 87 172 5%Rochester Area 19 126 145 4%Syracuse/Cent NY 37 31 92 160 4%NYC 745 151 1,365 2,261 60%Grand Total 875 274 2,592 3,741 100%
2012 Level 1 Level 2 Level 3 Grand Total % NYS Total
Albany/NE NY 109 1 502 612 12%Buffalo Area 8 1 403 412 8%Hudson Valley 50 481 531 10%L.I. 16 80 103 199 4%Rochester Area 8 289 297 6%Syracuse/Cent NY 162 62 269 493 9%NYC 559 113 2,096 2,768 52%Grand Total 912 256 4,144 5,312 100%
Difference Level 1 Level 2 Level 3 Grand Total% Change 2011-12
2011 vs 2012 Albany/NE NY 54 (2) 205 257 72%
Buffalo Area 6 1 162 169 70%Hudson Valley 39 (10) 97 126 31%L.I. 10 1 16 27 16%Rochester Area (11) 0 163 152 105%Syracuse/Cent NY 125 31 177 333 208%NYC (186) (38) 731 507 22%Grand Total 37 (18) 1,552 1,571 42%
Figure 17. Trends in NCQA PCMH Recognition by Region and Level
Source: NCQA provider files, as of September 2012. P 2
30 United Hospital Fund
Figure 18. Growth in PCMH Providers by Practice Type, New York State
0
200
400
600
800
1,000
1,200
1,400
1,600
Group Health Ctr HHC Hosp Clinic
Hosp/AMC Practice
Practice
1,050
740
595656
408
292
1,499
1,155
689
902
584
483
2011 2012
Source: NCQA provider files, as of September 2012. UHF Categorization of “practice type.”
3

Patient-Centered Medical Home Update, 2012 31
0
200
400
600
800
Group Health Ctr
HHC Hosp Clinic
Hosp Px Practice
240
433
595
496
343
154
297
591689
513
395
282
NYC
2011 2012
0
500
1,000
1,500
Group Health Ctr Hosp Clinic
Hosp Px Practice
810
307160
65138
1,202
564
389
189 201
Non-NYC
Figure 19. Growth in PCMH Providers by Practice Type, New York City vs. Rest of State
Source: NCQA provider files, as of September 2012. UHF Categorization of “practice type.”
P 3

32 United Hospital Fund
0
100
200
300
400
Group Health Ctr Hosp Clinic Hosp Px Practice
392
257229
124
63
Non-NYC
0
40
80
120
160
Group Health Ctr
HHC Hosp Clinic
Hosp Px Practice
57
158
94
17
52
128
NYC
Figure 20. Net Growth in PCMH Providers by Practice Type, New York City vs. Rest of State
Source: NCQA provider files, as of September 2012. UHF Categorization of “practice type.”
3

Patient-Centered Medical Home Update, 2012 33
Figure 21. PCMH Growth by Practice Type and Region
Albany/NE New York
Buffalo Area
Hudson Valley
0
50
100
150
200
250
300
Group Health Ctr Hosp Clinic Practice
0
50
100
150
200
250
300
Group Health Ctr Hosp Px Practice
0
50
100
150
200
250
300
Group Health Ctr Hosp Px Practice
2011 2012
3

34 United Hospital Fund
Figure 21 (continued). PCMH Growth by Practice Type and Region
0
20
40
60
80
100
120
140
Group Health Ctr Hosp Clinic Hosp Px Practice
0
20
40
60
80
100
120
140
Group Health Ctr Hosp Clinic Hosp Px Practice
0
50
100
150
200
250
Group Health Ctr Hosp Clinic Hosp Px Practice
2011 2012
Long Island
Rochester Area
Syracuse/Central NY
34 United Hospital Fund
Patient-Centered Medical Home Update, 2012 35
Figure 21 (continued). PCMH Growth by Practice Type and Region
0
200
400
600
800
Group Health Ctr HHC Hosp Clinic Hosp Px Practice
New York City (Total)
Bronx
Brooklyn
0
50
100
150
200
Group Health Ctr HHC Hosp Clinic Hosp Px Practice
0
50
100
150
200
Group Health Ctr HHC Hosp Clinic Hosp Px Practice
2011 2012Patient-Centered Medical Home Update, 2012 35
36 United Hospital Fund
Figure 21 (continued). PCMH Growth by Practice Type and Region
Manhattan
Queens
Staten Island
0
50
100
150
200
250
300
350
Group Health Ctr HHC Hosp Clinic Hosp Px Practice
0
40
80
120
Group Health Ctr HHC Hosp Clinic Hosp Px Practice
0
5
10
15
20
Group Health Ctr HHC Hosp Clinic Hosp Px Practice
2011 2012
Note: 2011 data for hospital clinics in Manhattan was overstated because of duplicate reporting; the net growth in hospital clinics was in line with the other areas.
36 United Hospital Fund

Patient-Centered Medical Home Update, 2012 37
Appendix: New York State Counties and Regions
Used in PCMH Analysis
P 3

38 United Hospital Fund
Region/County# PCMH Providers,
Sept. 2012 Region/County# PCMH Providers,
Sept. 2012Albany/NE NY 612 L.I. 199Albany County 88 Nassau County 134Clinton County 65 Suffolk County 65Columbia County 3 NYC 2,768Delaware County 46 Bronx County 624Essex County 48 Brooklyn /Kings County 567Franklin County 22 Manhattan/New York County 1,131Fulton County 2 Queens County 415Hamilton County 5 Staten Island/Richmond Cty 31Montgomery County 4 Rochester Area 297Otsego County 37 Livingston County 9Rensselaer County 42 Monroe County 258Saratoga County 67 Ontario County 8Schenectady County 43 Seneca County 4Schoharie County 17 Wayne County 13Warren County 116 Yates County 5Washington County 7 Syracuse/Cent NY 493
Buffalo Area 412 Broome County 115Allegany County 2 Cayuga County 7Cattaraugus County 20 Chemung County 2Chautauqua County 41 Chenango County 17Erie County 320 Cortland County 15Genesee County 6 Herkimer County 16Niagara County 13 Jefferson County 57Orleans County 3 Lewis County 20Wyoming County 7 Madison County 4
Hudson Valley 531 Oneida County 16Dutchess County 93 Onondaga County 151Orange County 27 Oswego County 17Putnam County 16 St Lawrence County 5Rockland County 41 Tioga County 11Sullivan County 25 Tompkins County 40Ulster County 53
Westchester County 276 NYS Total 5,312
Appendix Figure 1. Groupings of New York State Counties into Regions Used in PCMH Analysis
3

Patient-Centered Medical Home Update, 2012 39
Appendix Figure 2. New York State RegionsUsed for PCMH Analysis
P 3

1411 Broadway12th FloorNew York, NY 10018(212) 494-0700http://www.uhfnyc.org ISBN 1-933881-29-1
Shaping New York’s Health Care:Information, Philanthropy, Policy.