pathways in europe for sustainable energy - some examples from a new ags project
DESCRIPTION
Pathways in Europe for Sustainable Energy - some examples from a new AGS project. Filip Johnsson [email protected] Department of Energy and Environment Chalmers University of Technology SE 412 96 Göteborg. Edificación, Energía y Cambio Climático (EC) 2. Outline of Presentation. - PowerPoint PPT PresentationTRANSCRIPT
Chalmers University of Technology
Pathways in Europe for Sustainable Energy- some examples from a new AGS project
Filip [email protected]
Department of Energy and EnvironmentChalmers University of Technology
SE 412 96 Göteborg
Edificación, Energía y Cambio Climático (EC)2

Chalmers University of Technology
Outline of Presentation• Sustainability at Chalmers in short. Three
initiatives:– GMV, Environmental network– CEI, Chalmers Environmental Initiative– AGS, Alliance for Global Sustainability
• Examples from two projects on Pathways to Sustainable Energy Systems – a regional and a European– Power generation– Demand side – buildings
• Conclusions

Chalmers University of Technology
SUSTAINABLE DEVELOPMENT”… development that meets the needs of the present without compromising the ability of future generations to meet their own needs.”
Brundtland Commission Report, 1987
Heading towards a sustainable future
Chalmers University of Technology
Chalmers vision
In harmony with sustainable development and through cross-border collaboration,
Chalmers will be the first choice for research, education, training and innovation.

Chalmers University of Technology
Chalmers and Göteborg University Cooperation via GMV - Environmental aspects and sustainable
development
about 50,000 students2,500 faculty and PhD students3,000 staff
10,600 students1,600 faculty and PhD students 800 staff

Chalmers University of Technology
GMV:
• a networknetwork of 400 environmental scientists from Göteborg University and Chalmers University of Technology, Göteborg.
• a joint venturejoint venture between Chalmers and Göteborg University
• a meeting pointmeeting point for activities.
• a platform for projectsplatform for projects.
Chalmers University of Technology
Chalmers Environmental InitiativeOne initiative - seven areas

Chalmers University of Technology
Björn Malbert
Rolf Wolff1 June 2000
Anne-Marie Tillman
Christian AzarFilip JohnssonDonal Murtagh
Hans Theliander
Rolf Wolff
Chalmers University of Technology
Positive effects from CEI• Positive impact on Chalmers. • Credibility and identity within the area.• CEI funding as "scientific venture capital" has
allowed the research groups to enter new areas.• Bridging between scientific areas.• Facilitated active participation in important
international cooperation.• Attracted additional funding.• Good publicity and increased visibility.

Chalmers University of Technology
The Alliance for Global Sustainability (AGS) is an international partnership The Alliance for Global Sustainability (AGS) is an international partnership between four of the world's leading science and technology universities:between four of the world's leading science and technology universities:
•Swiss Federal Institute of Technology, Zurich (ETHZ)Swiss Federal Institute of Technology, Zurich (ETHZ)•Massachusetts Institute of Technology (MIT)Massachusetts Institute of Technology (MIT)•University of Tokyo (UT)University of Tokyo (UT)•Chalmers University of Technology (Chalmers)Chalmers University of Technology (Chalmers)
AGS goalsAGS goals• • Improving scientific understanding of global environmental challenges;Improving scientific understanding of global environmental challenges;• • Development of technology and policy tools to help societies reconcile Development of technology and policy tools to help societies reconcile ecological and economic concerns; and ecological and economic concerns; and • • Education of a new generation of leaders committed to meet the challenges of Education of a new generation of leaders committed to meet the challenges of sustainable development.sustainable development.

Chalmers University of Technology
Background to project examples• EU policy aims at reducing GHG emissions by 15 to
30% until the year 2020 (rel 1990)• Limiting global mean temperature to 2°C above pre-
industrial levels - long term stabilization of atmospheric GHG levels at 550 ppm CO2 equivalents.
• To meet these goals the energy system has to undergo significant technical and institutional changes (typically reducing CO2 emissions with some 60% over the next 50 year period)
• Economic, Social and Environmental sustainability must be maintained

Chalmers University of Technology
Example 1. European Pathway project:
Pathways to Sustainable European Energy Systems
- a New AGS flagship project
Chalmers University of Technology
• How can pathways to a sustainable energy system be characterized and visualized and what are the consequences of these pathways?
• …with respect to the characteristics of the energy system as such and for society in general

Chalmers University of Technology
..question divided into sub-questions such as • What is the critical timing for decisions to ensure that a pathway to a
sustainable energy system can be followed?• What are ”key” technologies and systems for the identified
“pathways” - including identification of uncertainties and risks for technology lock-in effects?
• What requirements and consequences are imposed on the energy system in case of a high penetration of renewables?
• What are the consequences of a strong increase in the use of natural gas?
• What if efforts to develop CO2 capture and storage fail?• Where should the biomass be used – in the transportation sector or in
the stationary energy system?• Are the deregulated energy markets suitable to facilitate a
development towards a sustainable energy system?

Chalmers University of Technology
Pathways to Sustainable European Energy Systems- priority on Bridging Technologies/Systems
Chalmers University of Technology
The project – scope
• Takes its basis in the existing energy system with this system described in a detailed way (Energy Infrastructure)
• Pathway analysis for the next 50 years
• European setting– General methodology– Future expansion of geographical scope

Chalmers University of Technology
Methodology• Description of Energy Infrastructure
– Supply side• The Chalmers Power Plant Database (EU25)• The Chalmers Fuel database• The Chalmers CO2 Storage Databases (EU25)
– Member State Database (EU25)– Demand side
• Databases on regional as well as on MS level with main characteristics of energy use – to be developed based on existing databases (e.g. Odyssee)
• Modeling and analysis• 10 work packages address key questions

Chalmers University of Technology
Power plant infrastructure

Chalmers University of Technology
Thermal PowerThermal PowerPlants in EU25Plants in EU25

Chalmers University of Technology
Coal (black) and lignite Coal (black) and lignite (brown) plants and potential (brown) plants and potential CO2 storage sitesCO2 storage sites
Blue circles denote oil fields, red Blue circles denote oil fields, red denotes gas fields, crossed grey denotes gas fields, crossed grey denotes aquifersdenotes aquifers
Chalmers University of Technology
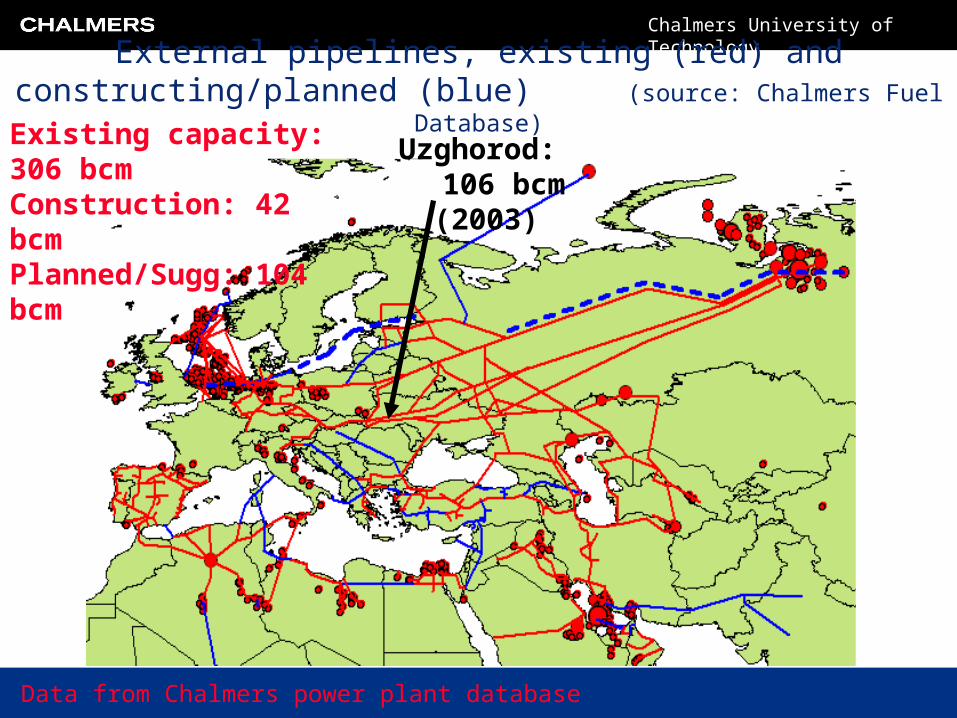
External pipelines, existing (red) and constructing/planned (blue) (source: Chalmers Fuel Database)
Uzghorod: 106 bcm (2003)
Existing capacity: 306 bcm Construction: 42 bcm Planned/Sugg: 104 bcm
Data from Chalmers power plant database

Chalmers University of Technology
21,0 21,0 22,8
79,2
17,7
69,4
67,2
37,320,6
5,8 20,9
23,9
14,6
5,4
7,9
29,9
18,4
5,5
6,5
9,1
76,4
35,9
8,4
2.6 (Coal)
1.9 (Lignite)
2.6 (Lignite)
0.2 (Oil)
0.6 (Oil)
3.2 (Nuclear)
0
20
40
60
80
100
120
140
160
180
> 30 years 21 - 30 years 11 - 20 years 0 - 10 years Construction Planned
GW
e
Natural gas Coal incl peat Lignite Oil Nuclear
Thermal power generation capacity – EU25
Data from Chalmers power plant database

Chalmers University of Technology
8,5
3,81,9
6,22,4
7,6
9,8
11,3
6,01,4
13,6
8,4
3,7
2,15,6
2,1
3,1
0,8
13,8
5,4
17,3
28,4
5,6 2,2
1,2
0,9
0.4 (Oil)
1,2
1.1 (Wind)
0.2 (Bio)
0.1 (Bio)
0.8 (Bio)
0.2 (Bio)
0.2 (Bio)0.3 (Bio)
0.2 (Hydro)
1.1 (Hydro)
0.2 (Hydro)
0
10
20
30
40
50
60
> 30 years 21 - 30 years 11 - 20 years 0 - 10 years Construction Planned
GW
e
Natural gas Coal Lignite Oil Nuclear Wind Bio/Waste Hydro
Power generation capacity - Germany
Data from Chalmers power plant database

Chalmers University of Technology
1,7
9,8
18,7
13,9
24,8
1,5
2,5
0,4
2,3
1,1
3,7
2,3
5,9
3,7
1,2
2,1
2,4
1,7
0,4
0.3 (Oil)
0,4
0.9 (Wind)
0.2 (Wind)
0.1 (Bio)
0.1 (Bio)
0.5 (Bio)
0.2 (Bio)
0,1
0.1 (Hydro)
0
5
10
15
20
25
30
35
> 30 years 21 - 30 years 11 - 20 years 0 - 10 years Construction Planned
GW
e
Natural gas Coal Oil Nuclear Wind Bio/Waste Hydro
Power generation capacity - UK
Data from Chalmers power plant database

Chalmers University of Technology
Power generation capacity - SpainNote: Planned wind farms not included, planned bio plants not complete)
2.20.9
14.4
7.6 7.22.9 5.2
0.9
0.72.84.1
1.3
1.1
4.9
2.0
9.9
11.8 3.0
2.4
0.1 (Natural Gas)
0.3
0.5 (Oil)
0.2 (Oil)
0.1 (Oil)0.4
0.1 (Wind)
0.1 (Bio)
0.2 (Bio)
0.1 (Hydro)
0
5
10
15
20
25
30
> 30 years 21 - 30 years 11 - 20 years 0 - 10 years Construction Planned
GW
e
Natural gas Coal Lignite Oil Nuclear Wind Bio/Waste Hydro
Data from Chalmers power plant database

Chalmers University of Technology
Development of power generation system- Germany and UK
Chalmers University of Technology
Germany

Chalmers University of Technology
German power generation 2000-2050(Phase out of existing plants according to Power Plant database)
LOW
MED
BAU
Range to be covered 2050: 303 TWh – 628 TWh
RES generation 2050: Wind: 164 TWh Biomass: 65 TWh Hydro: 29 TWh Geothermal/Solar (Others): 45 TWh
Data from Chalmers power plant database

Chalmers University of Technology
0
500
1000
1500
2000
2500
3000
3500
4000
1990
1992
1994
1996
1998
2000
2002
2004
2006
2008
2010
2012
2014
2016
2018
2020
2022
2024
2026
2028
2030
2032
2034
2036
2038
2040
2042
2044
2046
2048
2050
PJ
LOW MED BAU
1990
-
2002
NG for power:
Up 300% - 600% (gas scenarios)
BAU 2050: 628 TWh
MED 2050: 466 TWh
LOW 2050: 303 TWh
If gap (grey areas in previous slide) is covered by gas:German Natural Gas (NG) consumption 2000-2050
Note: Maximum use of renewables

Chalmers University of Technology
The German example tells us:
• Large gap to be covered with fossil or nuclear energy– efficiency measures important!
• Drastic increase in natural gas dependency (also for entire EU and for member states such as UK, Spain and Italy)

Chalmers University of Technology
UK

Chalmers University of Technology
Phase out pattern of present UK electricity generation system (including planned and approved facilities with assumed technical lifetimes and annual average full load hours)
50
100
150
200
250
300
350
400
450
2003 2008 2013 2018 2023 2028 2033 2038 2043 2048
[TW
h]
Natural Gas Coal Oil Nuclear Hydro Wind Biomass & Waste
Data from Chalmers power plant database

Chalmers University of Technology
UK electricity generation in present system and contribution of set targets based on maximum realistic penetration of RES and prescribed targets for gas technologies used for backup and peak production.
50
100
150
200
250
300
350
400
450
500
2003 2008 2013 2018 2023 2028 2033 2038 2043 2048
[TW
h]
Generation in present system New Natural gas New Hydro including small scale
New Wind New biomass & waste New Others
Generation shortage in scenario

Chalmers University of Technology
UK Gas consumption – RCEP1 Scenario
100
200
300
400
500
600
700
2003 2008 2013 2018 2023 2028 2033 2038 2043 2048
[TW
h]
Natural Gas consumption

Chalmers University of Technology
Conclusions from European Pathway project• Possibilities and limitations from the Energy
Infrastructure (regional variations)– Important to have detailed information on the energy
system – realistic assumptions on turnover in capital stock
• Security of supply – e.g. increased natural gas dependency in Europe as well as in other regions
• We must use bridging technologies/systems (NG, CCS, Co-firing etc) but avoid lock-in effects
• Energy efficiency measures must be implemented!

Chalmers University of Technology
Example 2. Regional Pathway project:
Towards sustainable buildings- some experiences from Sweden

Chalmers University of Technology
Aim of this work• to identify and systemize potentials for
increased energy efficiency and substitution of fuel and heating systems in the existing building stock
• to group potentials with respect to influencing factors, including operational and life-style factors
• to discuss on policy measures to use some of the potentials identified in this work

Chalmers University of Technology
Building sector – CO2 reduction strategies
• increase energy efficiency
• substitute fuels
• reduce demand.investments in the power and heat generation side are mainly governed by business logics and related to public economy, investments in the demand side belong to the private household economy (residential buildings) - dependent on consumer preferences and consumer behaviour etc

Chalmers University of Technology
Policy instruments
• Most proposed policy measures are based on technical performance indicators which seldom include direct feedback mechanisms on energy performance (e.g. the recently proposed building declaration in EU, Directive 2002/91/EC, 2002).

Chalmers University of Technology
Transforming the energy system for buildings- some difficulties
• Investments in residential buildings are to a large extent based on consumer preferences and consumer behavior– e.g. investments in energy efficiency measures compared to
spending on other goods which gives more immediate and direct satisfaction
• Energy use is influenced from the way the house owner “operate” the house
• Difficult for consumers to coordinate goals and interpret information from governmental boards and markets with respect to strategies for development of buildings and heating market

Chalmers University of Technology
Transforming buildings over the next decadesInfrastructure• Northern Europe – mainly transforming
existing buildings and infrastructure• Some Member States (e.g. Spain, Ireland) –
high degree of investments in new buildings and infrastructure
Experiences from Sweden - some examples to illustrate influence of
1. turnover in capital stock2. “life-style” factors and local conditions
Chalmers University of Technology
1. Turnover in capital stock - example
• Possibilities to reduce dependency of electricity and oil for heating in the Swedish building sector – as in line with governmental policy
• Compare a pathway in line with current policy (”Target scenario”) with current trends on the heating market (”Trend scenario”)

Chalmers University of Technology
To include capital stock and local conditions
• The energy infrastructure – the buildings with heating systems (e.g. age structure, geographical variations, heat density)
• Details on the energy infrastructure provided by a database (Southern Sweden)
• The database gives a detailed description of the energy infrastructure of the region (> 50 000 items)
• The region studied is large enough for the results to be assumed representative for Sweden as a whole

Chalmers University of Technology
Southern Sweden
Chalmers University of Technology
0
20000
40000
60000
80000
100000
120000
140000
160000
Before1940
1941-1960 1961-1965 1966-1970 1971-1975 1976-1980 1981-1985 1986-1990 1991-1995 1996-2002
Nu
mb
er
of
bu
ild
ing
s
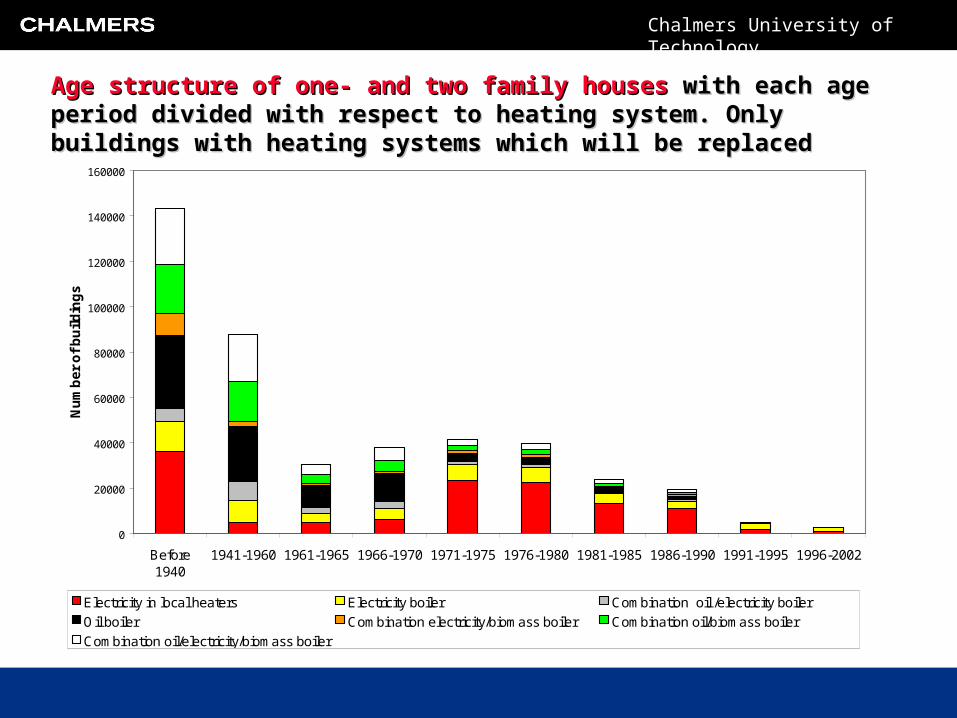
Electricity in local heaters Electricity boiler Combination oil /electricity boiler
Oil boiler Combination electricity/biomass boiler Combination oil/biomass boiler
Combination oil/electricity/biomass boiler
Age structure of one- and two family housesAge structure of one- and two family houses with each age period divided with with each age period divided with respect to heating system. Only buildings with heating systems which will be respect to heating system. Only buildings with heating systems which will be replacedreplaced

Chalmers University of Technology
Electricity for heating (Sweden) (Sweden)
0
5
10
15
20
25
30
35
1970 1975 1980 1985 1990 1995 2000 2005 2010 2015 2020 2025
TW
h
Historiska dataTrendscenario MålscenarioTrendscenario inkl effekter av konverteringsbidrag (1,5 miljarder kr)
Target scenario
Trend scenario
Trend scenario, including current policy measures of 1.6 billion SEK (from January 2006)

Chalmers University of Technology
• Current policy measures have more or less failed to meet governmental policy
• Important to consider the capital stock turnover times, not only for the building itself but also for its different subsystems (“layers”)– renovations and replacement of heating systems

Chalmers University of Technology
2. Variations in energy-use related to “life style” factors and local variations in
energy infrastructure (67 municipalities)
• Etot total energy consumed (electricity, heat or cooling)
• n and V are life-style factors– n is number of appliances
– V is amount consumed (e.g. indoor temperature, amount of tap water)
• Espec is specific energy used (defined by technology)
spectot EVnE
spectot EVnE

Chalmers University of Technology
Grouping of the reductions potentials
1.1. Change in life style – simple Change in life style – simple (mainly n and V)(mainly n and V)
2.2. Increased efficiency in operation of houseIncreased efficiency in operation of house3.3. Technical measures – simple Technical measures – simple
(mainly E(mainly Especspec))
4.4. Technical measures – extensive Technical measures – extensive (mainly E(mainly Especspec))
5.5. Measures on overall energy system Measures on overall energy system (mainly E(mainly Especspec system factors) system factors)
6.6. Change in life style – extensive Change in life style – extensive (mainly n och V)(mainly n och V)

Chalmers University of Technology
0
50
100
150
200
250
64 identical single-family houses
kWh
/m2,y
ear
Variation in energy use (heating and lighting) in 64 almost identical residential buildings (single-family houses) in the village “Stångby” in Southern Sweden (V)
energy use varies with a factor of around 2.5!
Espec
Type 1 & 2

Chalmers University of Technology
Potentials for reduction in heat demand in all single-family and two-family houses as obtained from applying lower quartile of data in previous slide to the database of Southern Sweden [V]
0
20
40
60
80
100
120
140
160
180
GW
h/y
ea
r
The 67 municipalities of Southern Sweden
4.2 TWh potentialfor energy conservation(total heat demand is 10 TWh)
Type 1 & 2

Chalmers University of Technology
0
1
2
3
4
5
The 67 municipalities of Southern Sweden
GW
h/y
ear
Example : Reduction in heat demand. From replacement of 2 glass windows with high performance 3 glass windows (single and two-family houses of Southern Sweden) [Espec ]
Type 4

Chalmers University of Technology
Major potentials calculated in this work based on the field studies applied to the database of Southern Sweden. Residential houses
0 2 000 4 000 6 000 8 000 10 000 12 000
Net heat demand equal to "best performing" municipalityReduced floor area (=floor area of "best performing" municipality
CHANGE IN LIFE STYLE - EXTENSIVE (n, V)Fuel substitution according to energy system optimization
MEASURES ON ENERGY SYSTEM (Espec, regional)Additional insulation facades (single and two-family houses)
Additional insulation attics (single and two-family houses)Heat exchanging of incoming air
Heat exchanging of incoming air, low cost optionsReplacement of windows (in 75% of building stock)
Replacement of windows (low cost option in single and two-family houses)TECHNICAL MEASURES - EXTENSIVE (Espec)
Installations of sun panels (single and two-family houses)Removal of cold spotsReduced air in eakageReplacement of piping
Replacing water heaters (single and two-family houses)Energy efficient water taps (single and two-family houses)
TECHNICAL MEASURES - SIMPLE (Espec)Improved control systems for central heating (single and two-family
Improved control systems for local heaters (single and two-family houses)Reduced airing in empty flats
INCREASED EFFICIENCY IN OPERATION (n, V)tap water
indoor temperatureairing
CHANGE IN LIFE STYLE - SIMPLE (n, V)CHANGES IN ENERGY USE
Electricity for household services and for common purpose (Etot net)Electricity for household services (Etot net)
Total heat demand (Etot net)Total heat demand (Etot net)
CURRENT ENERGY USE
GWh
Single and two-family buildings Apartment blocks

Chalmers University of Technology
• Mapping of a number of life-style factors yields large potential for increased energy efficiency
• Low, or no cost, options
• Problem to create incentives/policy measures to realize potentials
Summary from applying field experiences to database of energy infrastructure of
Southern Sweden

Chalmers University of Technology
Discussion on policy measuresType of measure Example of measure Requirements/policy Change in life style - simple (mainly n and V)
Life style influences energy use from e.g. choice of indoor temperature, airing habits, consumption of hot water and electricity
Information and feed back, cost of energy (heat and electricity) based on hourly measurement of consumption
Increased efficiency in operation of house
To use the technical systems/appliances in a more efficient way
Efficient and well educated tenant/management organization of building.
Technical measures - simple (mainly Espec)
Sealing of window, adjustment of heat distribution system, water saving appliances (e.g. WC), sun protection etc.
Efficient and well educated tenant/management organization of building. Easily accessible investment budget
Technical measures - extensive (mainly Espec)
Improved thermal insulation, window replacement, upgrading of ventilation system, replacement of pumps etc.
Economic incentives, knowledge, to take advantage of opportunities during renovations
Measures on overall energy system (mainly Espec system factors)
Matching supply and demand side and to take regional differences into account to reduce primary energy use
Efficient and clear governmental and regional planning and clear and long term policy measures
Change in life style - extensive (mainly n och V)
To reduce space for living, less travelling etc. Information and long term changes in perceptions on global influence from energy use
1
2
3
4
5
6

Chalmers University of Technology
• Mapping of a number of life-style factors yields large potential for increased energy efficiency
• Low or no cost options
• Problem to create incentives to realize potentials
Chalmers University of Technology
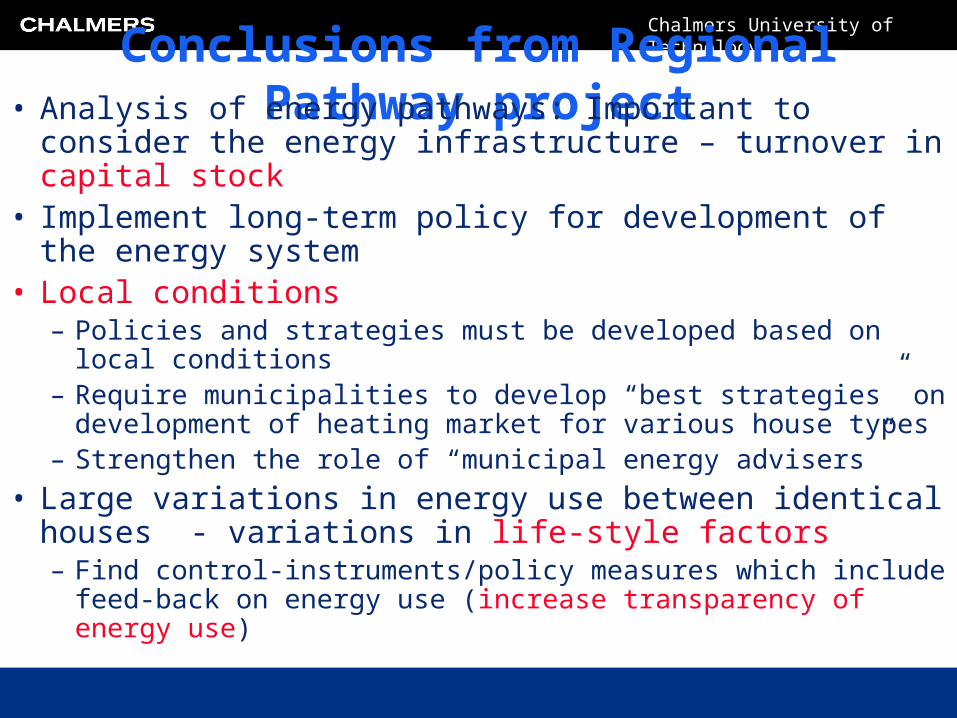
Conclusions from Regional Pathway project• Analysis of energy pathways: Important to consider the
energy infrastructure – turnover in capital stock• Implement long-term policy for development of the energy
system• Local conditions
– Policies and strategies must be developed based on local conditions
– Require municipalities to develop “best strategies” on development of heating market for various house types
– Strengthen the role of “municipal energy advisers”
• Large variations in energy use between identical houses - variations in life-style factors– Find control-instruments/policy measures which include feed-back
on energy use (increase transparency of energy use)

Chalmers University of Technology
Conclusions - general• Activities presented are based on a detailed description
of the Energy Infrastructure (regional variations)• The projects characterize and evaluate consequences
from different pathways • Europe should be able to take lead in reducing CO2
emissions – perhaps the European Pathway project can help…
• The plan is to expand project in order to increase leverage (national boards, utilities, equipment providers, fuel companies, DSM - facilities management companies)
Partners are welcome!

Chalmers University of Technology
Recent papers• Nylander, A., Johansson, P., Johnsson, F., ”Towards Sustainable Buildings: A Survey of
Improvements of the Existing Building Stock”, (2006), Proc. CIBW70 2006 International Symposium, Changing User Demands on Buildings, Trondheim.
• Kjärstad, J., Johnsson, F. (2006) “Prospects for the European Gas Market”, Energy Policy, in press.• Odenberger, M., Johnsson, F., “Achieving 60% reductions within the UK energy system –
Implications for the electricity generation sector”, submitted (Energy Policy)• Johnsson, F. Brendes, G., Berggren, M., “Cost competitive bioenergy: linking lignocellulosic
biomass supply with co-firing for electricity in Poland”, World Bioenergy Conference & Exhibition, Jönköping.
• Johansson, P., Nylander, A. and Johnsson, F. (2005), “Electricity dependency and CO2 emissions from heating in the Swedish building sector-Current trends in conflict with governmental policy?”, Energy policy, in press.
• Reiner, D., Curry, T.E., DeFigueiredo, M., A., Herzog, H., Ansolabehere, S.D., Itaoka, K., Johnsson, F., Odenberger, M., (2006)”American Exceptionalism? Similarities and Differences in National Attitudes Toward Energy Policy and Global Warming”, Environ. Sci. &Tech, 40 (7): pp 2093-2098.
• Johansson, P., Nylander, A. and Johnsson, F. (2006), “Primary energy use for heating in the Swedish building sector – current trends and proposed target”, Energy Policy, in press.
• Kjärstad, J., Johnsson, F., “CO2 capture and storage in the European Union - security of supply and the role of coal based power generation”, (2006) Proc 8th Int. Conf. on Greenhouse Gas Control Technologies, Trondheim.

Chalmers University of Technology
Extras

Chalmers University of Technology
“ The following technologies have been proposed to address global warming. If you were responsible for designing a plan to address global warming, which of the following technologies would you use?”

Chalmers University of Technology
Assumptions
• The analysis takes its basis in the present system, the starting point
• Takes steps forward 5 years at a time (forecasting)• The overall time period, the time it takes for the system to
be transformed to reach the goal of this study, is based on an analysis of the economic lifetime of the heating systems– Yields the year 2025 when heating systems have been replaced
• Thus, the replacement of a heating system is assumed to be limited by its economic life-time
• Only commercially available technologies are used (district heating, biomass boilers, heat pumps, savings)