pathway-centric computational approach identifies
TRANSCRIPT

i
Pathway-centric computational approach identifies molecular changes
associated with antibiotic resistance in Staphylococcus aureus
By
Laura K. Harris
A Dissertation Submitted
In partial fulfillment of the Requirements for the Degree of
Doctor of Philosophy in Biomedical Informatics
Department of Health Informatics
Rutgers, The State University of New Jersey
School of Health Professions
May 2020

ii
APPROVAL PAGE
X___________________________________________________________
Antonina Mitrofanova (Co-advisor)
X___________________________________________________________
Masayuki Shibata (Co-advisor)
X___________________________________________________________
Fredrick Coffman
X___________________________________________________________
Susan Gunn
X___________________________________________________________
External Reviewer

iii
ACKNOWLEDGEMENTS
I thank my mentors, Drs. Antonina Mitrofanova and Masayuki Shibata, for the countless
hours of mentoring they have provided over these past few years. Thank you to Dr. Susan
Gunn for her expertise with the experimental portion of the work. Thank you also to Dr.
Fredrick Coffman for being a committee member and advising on the work.

iv
DEDICATION
I dedicate this work to my husband, Robert W. Harris, and two daughters, Serena P.
Harris and Lilly A. Harris, all who have sacrificed so much to support me in completing
this degree.

v
TABLE OF CONTENTS
ACKNOWLEDGEMENTS ....................................................................................................... iii
DEDICATION .......................................................................................................................... iv
ABSTRACT ............................................................................................................................. vii
LIST OF TABLES ..................................................................................................................... ix
LIST OF FIGURES .................................................................................................................... x
CHAPTER 1 ............................................................................................................................. 11
1.1 Background on Antibiotic Resistance ..................................................................... 12
1.2 Statement of the Problem ....................................................................................... 18
1.3 Goal and Aims of the Study ................................................................................... 19
CHAPTER 2 ............................................................................................................................. 22
2.1 Review of Experimentally Recognized Antibiotic Resistance Mechanisms ............. 22
2.1.1 Vancomycin Resistance ......................................................................................... 25
2.1.2 Oxacillin Resistance .............................................................................................. 29
2.1.3 Daptomycin Resistance .......................................................................................... 30
2.1.4 Linezolid Resistance .............................................................................................. 31
2.2 Review of Computationally Identified Antibiotic Resistance Mechanisms .............. 32
2.2.1 Documented Gene Expression Analysis Findings ................................................... 32
2.2.2 Documented Pathway Enrichment Analysis Findings ............................................. 33
2.3 Review of Gene Set Enrichment Analysis .............................................................. 35
2.3.1 Method and Software Implementation .......................................................... 35
2.3.2 Advantages and Disadvantages of GSEA Compared to Other Methods ........ 39
2.4 Overview of Pathway Databases ............................................................................ 41
2.5 Conclusion............................................................................................................. 44
CHAPTER 3 ............................................................................................................................. 46
3.1 Background ........................................................................................................... 46
3.2. Results ................................................................................................................... 50
3.2.1. Pathway Signature Approach Identified Pathway Activity Changes Associated with
Antibiotic Resistance Driven by vraS and graSR Mutations....................................................... 50
3.2.2. Pathway Signature Approach Detects Pathway Activity Changes Associated with
Vancomycin Susceptibility........................................................................................................ 61

vi
3.2.3. Comparison of vraS-driven Resistance Panels to Antibiotic Susceptibility and
Response Pathway Signatures Identifies Top Pathway Candidates for Experimental Examination
……………………………………………………………………………………….71
3.2.4. Antibiotic Sensitivity Changes from Targeting Lysine Biosynthesis Provides
Experimental Evidence to Support Computational Findings ...................................................... 76
3.3. Discussion ............................................................................................................. 79
3.3.1. Summary of Main Findings .................................................................................... 79
3.3.2. Implications, Limitations, and Other Considerations .............................................. 82
3.3.3. Future Directions ................................................................................................... 86
3.4. Methods ................................................................................................................. 90
3.4.1. mRNA Expression Resources ................................................................................ 90
3.4.2. Signature Definition and Generation ...................................................................... 94
3.4.3. Defining Pathway Panels ....................................................................................... 95
3.4.4. Comparison Across Pathway Signatures................................................................. 95
3.4.5. Disk Diffusion Validation of Computational Predictions ........................................ 96
CHAPTER 4 ............................................................................................................................. 97
REFERENCES ......................................................................................................................... 99
APPENDIX A. Overview of mRNA Expression Resources ..................................................... 113
APPENDIX B. Justification Supplemental .............................................................................. 122
APPENDIX C. Complete Separation Data .............................................................................. 128
APPENDIX D. Leading-edge Pathway Tables ........................................................................ 132
APPENDIX E. Significant Pathways Associated with Vancomycin Response in S. aureus ...... 143
APPENDIX F. KEGG Pathways Used in Pathway Signature Generation ................................. 146
vii
ABSTRACT
Background: Antibiotic resistant Staphylococcus aureus (S. aureus) infections are a
major medical concern due to loss of antibiotic sensitivity. Genome-wide analyses,
including sequencing and gene expression, identified genes associated with antibiotic
resistances, such as vraSR whose mutations are associated with vancomycin, daptomycin,
and oxacillin resistances. Pathway enrichment analysis using Fisher’s Exact Test (FET)
provides insight into pathway activity, though pathway roles in resistance are not fully
elucidated. These studies applied a pathway-centric computational approach to examine
antibiotic resistance (i.e., vraS-driven) and response (i.e., treatment inducible) changes in
S. aureus.
Method: This is the first application of Gene Set Enrichment Analysis, which improves
upon FET by removing gene selection requirements, to obtain pathway signatures
(i.e., pathways ranked by activity change) from normalized enrichment scores reflecting
164 individual pathway activities in S. aureus. The pathway panels were obtained (most
up- or down-regulated pathways separately), for vraS- and graSR-driven resistance
signatures. A similar process was repeated to examine vancomycin susceptibility
(i.e., difference in response between resistant and sensitive strains). Pathway activity in
vraS-driven resistance panels was then examined in various antibiotic (vancomycin,
oxacillin, or linezolid) susceptibilities to identify commonalities and differences in
individual pathway activities. One novel pathway was selected and its association to
antibiotic sensitivity was experimentally verified.
Results: This approach correlated pathway activity changes, like up-regulated histidine
biosynthesis, with established genetic associations to antibiotic resistance. Further,

viii
pathway activity changes with known associations to vancomycin susceptibility such as
down-regulated TCA cycle activity was also identified. Both examinations identified
pathways with no prior association to antibiotic resistance. Inverse correlations between
pathway activity changes and susceptibility to vancomycin and oxacillin/linezolid were
seen (pathway activities up-regulated in vancomycin susceptibility were down-regulated
in linezolid susceptibility) regardless of strain resistance level. Lysine biosynthesis was
identified as a top candidate pathway for targeting to overcome resistance and verified by
lysine or aspartate supplementation. Thus, lysine biosynthesis as a co-therapeutic target
could restore antibiotic efficacy.
Conclusion: This pathway-centric approach identified pathway activity changes
associated with antibiotic sensitivity which can be targeted to help reverse antibiotic
resistance.

ix
LIST OF TABLES
Table 1. Antibiotics Commonly Used to Treat Bacterial Infections ............................................ 14
Table 2. Overview of Antibiotic Resistance Mechanisms .......................................................... 17
Table 3. Genes Associated with VISA Phenotypes .................................................................... 28
Table 4. vraS-driven Resistance Pathway Panels ....................................................................... 52
Table 5. Most Differentially Active Pathways Representing the Difference in Resistance
Mechanisms between Strains with Different graS Functions ...................................................... 55
Table 6. Most Differentially Active Pathways Representing graS-driven Resistance .................. 56
Table 7. Shared Leading-edge Pathways Associated with vraS- and graSR-driven Resistance ... 59
Table 8. Vancomycin Susceptibility Pathway Panels ................................................................. 63
Table 9. Significantly Enriched Leading-edge Pathways Associated with Vancomycin
Susceptibility ............................................................................................................................ 67
Table 10. Shared Significantly Enriched Pathways Associated with Vancomycin Response....... 70
Table 11. Shared Leading-edge Pathways Associated with Vancomycin Susceptibility and
Response .................................................................................................................................. 74
Table 12. Shared Leading-edge Pathways Associated with Oxacillin Susceptibility and
Flucloxacillin Response ............................................................................................................ 75
Table 13. S. aureus Datasets Utilized for this Study................................................................... 91

x
LIST OF FIGURES
Figure 1. Bacterial cell wall synthesis and mechanism of action of antibiotics commonly used to
treat S. aureus infections: oxacillin, vancomycin, daptomycin, and linezolid ............................. 24
Figure 2. Example Enrichment Plot ........................................................................................... 37
Figure 3. Example Histogram .................................................................................................... 38
Figure 4. Identification of Pathway Activity Change Similarities and Differences Associated with
vraS- and graSR-driven Resistance ........................................................................................... 58
Figure 5. Identification of Pathway Activity Change Similarities and Differences Associated with
Vancomycin Susceptibility........................................................................................................ 65
Figure 6. Pathway Signature Comparison Reveal Similarities and Differences between vraS-
driven Resistance Panel Activity and Pathway Activity Changes in Antibiotic Susceptibilities and
Responses ................................................................................................................................. 72
Figure 7. Pathway Signature Comparison Identifies Top Pathway Candidates Across Antibiotic
Susceptibilities and Responses .................................................................................................. 76
Figure 8. Lysine Biosynthesis from Aspartate is Involved in Vancomycin, Oxacillin, and
Linezolid Sensitivity ................................................................................................................. 78
Figure 9. Schematic Overview of Approach .............................................................................. 90

11
CHAPTER 1
INTRODUCTION
Many cells contain thousands of genes that drive complex molecular interactions
supporting life. Breakthroughs in high-throughput experimental technology, such as
microarray and RNA-seq, allow researchers to quickly examine expression of thousands
of genes for a biological sample to get a broad perspective of cellular activity which
allows for a comprehensive examination of specific biological processes. This is a
massive improvement over laboratory techniques like reverse transcriptase-polymerase
chain reaction (RT-PCR) and Northern blot that only test for a few select genes per
experiment1. Since inception, microarray technologies have been used extensively to
examine gene expression, polymorphisms, chromosomal aberrations, and copy number
variations to answer a wide-variety of scientific inquiries including cancer and antibiotic
resistance (i.e., loss of sensitivity to an antibiotic therapy) research1,2. Its extensive use
has generated large volumes of data which need further analysis to elucidate connections
between observed gene changes and the molecular interactions they impact in order to
fully understand cellular processes that produce phenotypic variations (i.e., observable
characteristics or traits). To accomplish this, researchers use statistical methods, such as
enrichment analysis, to identify pathways (i.e., ordered succession of cell molecular
interactions leading to change in a cellular process or state) from genes selected for their
statistical significance (e.g., T-test p-value<0.05) that neglect genes with insignificant
changes in expression from microarray data. While these methods identify individual
pathways of scientific interest, they are limited because they consider pathways whose
enrichment is based on statistically significant genes, missing broader pathway changes

12
(i.e., accumulated via small gene expression changes) which contribute to phenotypic
variations that result from activity of multiple pathways simultaneously, a perspective
that is needed to fully understand cellular processes. To overcome this limitation, I used
Gene Set Enrichment Analysis (GSEA), a well-established computational tool that does
not neglect genes with insignificant changes when calculating enrichment, to examine
antibiotic resistance, and was the first to use GSEA on Staphylococcus aureus
(S. aureus). Further, I was the first to apply a new computational approach using GSEA
that defines and compares pathway signatures (i.e., pathway lists ranked by activity as
defined by differential mRNA (i.e., gene) expression) to detect activity changes
associated with antibiotic resistance. I applied my pathway signature approach to multiple
resistance studies across different antibiotic classes to identify pathways affecting
development of antibiotic resistance, which was the first analysis of its kind to the best of
my knowledge. Finally, I experimentally established biological relevance for one of the
top pathway candidates identified from my computational approach.
1.1 Background on Antibiotic Resistance
Bacteriology, the study of bacteria, is one area of biological exploration where
mRNA expression data is used extensively, but with limited benefit to humanity’s overall
understanding of cellular processes, such as antibiotic resistance which was the focus of
this work. Bacteria are an entire taxonomy domain of single-celled microorganisms that
are found in most habitats on Earth including soil, water, and within and on humans3.
Researchers estimate there is at least one bacterium for every human cell in the body4.
Bacterial species associated with humans have either a mutualist (beneficial) or
commensal (neutral) relationship with us, while some bacteria are pathogens (harmful to

13
human health)3. Bacterial pathogens cause an average of nearly 14 million infections
annually5. While much scientific attention is given to true pathogens that can cause
disease in healthy individuals, such as Yersinia pestis (causative agent of bubonic
plague), opportunistic pathogens that cause disease in immunocompromised people, such
as Pseudomonas aeruginosa (common cause of burn infections), are bigger public health
concerns because they already inhabit most humans in commensal relationships, waiting
for the human immune system to decline before establishing infection3,6. For this reason,
opportunistic pathogen infections are an ongoing clinical challenge7.
To treat infections of true (i.e., able to cause infection in healthy humans) and
opportunistic pathogens clinically, antibiotics are useful therapeutic agents3. Antibiotics
have been used for decades as the primary treatment and prevention method for a wide
variety of communicable diseases and endogenous infections8-11. Over 70 billion
antibiotic doses are consumed worldwide every year1,12 which save millions of lives11.
Table 1 lists antibiotics commonly prescribed for bacterial infections, grouping them by
their mechanisms of action. Cell wall synthesis inhibitors are preferred for treating gram
positive infections, like those caused by S. aureus, because they target exposed
peptidoglycan, a polymer consisting of amino acids and sugars that form a mesh-like
layer unique to the bacterial cell wall3. On the other hand, gram negative bacteria have an
outer membrane protecting their peptidoglycan layer from the outside environment. Thus,
for gram negative bacteria, protein synthesis inhibitors are preferred since the ribosomal
subunit size is different between bacteria and humans. Both bacteria and humans have
similar cell membrane structure, nucleic acid and folate synthesis processes, thus
antibiotics that target these cellular components are less desirable3.

14
Table 1. Antibiotics Commonly Used to Treat Bacterial Infections
Mechanism of
Actiona,b
Group Example Antibioticsb,c,d
Cell wall synthesis
inhibitors
β-lactams Penicillin (e.g., methicillin, oxacillin,
and flucloxacillin)
Cephalosporin (e.g., ceftobiprole)
Glycopeptides Vancomycin
Protein synthesis
inhibitors
30S ribosomal subunit Aminoglycosides (e.g., kanamycin)
Tetracycline
50S ribosomal subunit Macrolides (e.g., erythromycin)
Glycylcyclines (e.g., tigecycline)
Oxazolidinones (e.g., linezolid)
Lincosamides (e.g., clindamycin)
Cell membrane
depolarizers
Lipopeptides Daptomycin
Polymyxin (e.g., colistin)
Nucleic acid
synthesis inhibitors
Quinolones Ciprofloxacin
Folate synthesis
inhibitors
Sulfonamides Trimethoprim-sulfamethoxazole
Trimethoprims a Madigan, M.T. Et al.3 b Kapoor, G. Et al.13 c Pantosti, A. Et al.14 d Velkov, T. Et al.15
Unfortunately, antibiotics are losing their efficacy (i.e., clinical treatment failure)
due to the rapid emergence of antibiotic resistant infections11,16, a problem regarded as
one of the 21st century’s major public health concerns by the World Health
Organization8,9,11,17-19. In the United States alone, almost two million Americans contract
hospital acquired infections, resulting in 99,000 deaths annually and most of these
infections involved antibiotic resistant pathogens11,20. Resistant pathogens are not limited
to clinical-based infections. They are prevalent in the community with over 53 million
people worldwide possibly who are colonized unknowingly with resistant pathogens,
posing as a potential risk to self and others21,22. As resistance spreads, predictions of up to
10 million deaths per year worldwide from antibiotic resistant infections by 2050 have
been reported23. Besides prolonged hospital stays11,20, increases in mortality rates11,20,

15
long-term disability rates11, and hospitalization for patients24,25, resistant infections
substantially increase medical costs per patient11,26 resulting in significant economic and
societal costs21,24,27-29. The estimated annual total economic burden to the United States
economy is $20 billion in health care costs and $35 billion in lost wages11,20. Finding
ways to more effectively treat antibiotic resistant infections is critical to improving
patient outcomes and relieving an already overburdened healthcare system11.
Of particular concern is antibiotic resistant S. aureus, an opportunistic Gram-
positive bacterial pathogen that causes a varied assortment of infections including
superficial skin and surgical wound infections, bone and joint infections, food poisoning,
toxic shock syndrome, pneumonia, endocarditis, and bacteremia14,21,30,31. During the pre-
antibiotic era, prior to the discovery of penicillin, S. aureus patients with bacteremia had
a mortality rate of more than 80%21,32. The introduction of penicillin and subsequent
antibiotics dramatically improved patient prognosis21,33. All S. aureus isolates were
sensitive to penicillin when first introduced in the early 1940s. However, now more than
90% of human S. aureus isolates are penicillin resistant14,21,31. Methicillin, a
semisynthetic penicillin derivative, was originally designed in 1959 to overcome the
spread of penicillin resistance21,31. However, methicillin resistant Staphylococcus aureus
(MRSA) isolates were found the following year21,34 and today MRSA is a serious threat
to public health11. MRSA is the second most common cause of bloodstream infections
worldwide and the most common cause of infective endocarditis in the developed
world35-37. The Center for Disease Control and Prevention in 2011 estimated 80,000
invasive MRSA infections and 11,285 related deaths in the United States (around 15%
mortality rate)21,38. As seen in other bacteria, MRSA infections among the general

16
population (i.e., community-acquired) have steadily increased during the past decade11,
resulting in S. aureus strains that now exist with resistance to one, two, or more (i.e.,
multi-drug resistant, MDR) antibiotics11,21,39,40. It will not be long before there is an
untreatable strain of S. aureus41 as is already seen in other infectious bacterial species
such as Acinetobacter spp. and Klebsiella pneumoniae42,43.
Several antibiotic resistance mechanisms have been elucidated.
Table 2 summarizes resistance mechanisms employed by S. aureus and other
bacterial species. High-level, sudden onset antibiotic resistance typically involves the
procurement of a detectable genetic marker such as a chromosomal mutation or
externally-acquired genes that deactivate the antibiotic, often by physical alteration of the
antibiotic or its target3,14,21,44,45. Further, efflux pumps that remove antibiotics from the
cell, preventing them from reaching their targets, have been found across bacterial
species and commonly contribute to multi-drug resistances of antibiotics across all
mechanisms of action44,46-50. Multi-drug resistance can also arise from accumulation of
several externally-derived genes and/or chromosomal mutations, each encoding
resistance to a particular antibiotic51. However, genetic markers are not consistently
found in multi-drug and low-level (i.e., intermediate) resistances, presenting a challenge
for treatment management14,44,45.

17
Table 2. Overview of Antibiotic Resistance Mechanisms
Groupa Mechanisms of Resistance
β-lactams • Acquire penicillinase to cleave β-lactam ring to inactive itb,c
• Mutate penicillin binding proteins so β-lactam ring cannot
bindb,c
Glycopeptides • Mutate cell wall so glycopeptides cannot bindb,c,d
30S ribosomal subunit • Mutate 30S subunit so drug cannot binde
50S ribosomal subunit • Modify methylation of ribosome to inhibit drug bindingf
• Mutate 50S subunit so drug cannot bindb
Lipopeptides • Increase voltage difference across the membraneb,g
• Mutate membrane proteins that bind drugg
Quinolones • Mutate DNA gyrase and/or topoisomerase IVb,h
Sulfonamides • Mutate dihydropteroate synthaseb
• Use alternative pathways of folate synthesisb
Trimethoprim • Mutate dihydrofolate reductaseb
• Use alternative pathways of folate synthesisb a Madigan, M.T. Et al.3 b Pantosti, A. Et al.14 c Peacock, S.J. Et al.21 d Gardete, S. Et al.45 e Chopra, I. Et al.47 f Quiles-Melero, I. Et al.52 g Tran, T.T. Et al.53 h Hooper, D.C. Et al.48
Low-level resistances frequently arise from “persister” cells that survive antibiotic
exposure and are common in reoccurring infections. Unlike high-level resistant species
which can flourish in the presence of antibiotic, “persister” cells grow after antibiotic
treatment has stopped44. Persistence has been observed in most bacterial species,
particularly for slow growing pathogens such as Mycobacterium tuberculosis (causative
agent of Tuberculosis) that require months of antibiotic therapy with a high risk of patient
non-compliance44. Mechanisms used by “persister” cells are not well understood,
particularly since a small percentage of any bacterial population exists in a transient state
of resistance meaning “persister” cells may have temporary resistance54. Despite
producing similar antibiotic resistant phenotypes, there is considerable diversity in which

18
gene mutations are accumulated across resistant bacterial species and resistant strains of
the same species55,56. While gene mutation studies provide useful information such as the
effects of mutation on gene expression, a pathway-centric perspective using GSEA can
identify pathway contributions to antibiotic resistant phenotypes, which complements
scientific understanding of how variations in accumulated gene mutations contribute to
the development of antibiotic resistant bacteria44.
1.2 Statement of the Problem
Despite science’s understanding of antibiotic resistance mechanisms, humanity
struggles to control S. aureus and other bacterial infections. Due to increases in the global
spread of resistant infections like MRSA18 and their development into MDR strains in
recent decades11, there is a need for new antibiotic therapy options, either with different
mechanisms of action than those currently in use57 or that suppress existing resistance
mechanisms to make current therapies useful again58. Not having these options will cause
significant economic and medical hardships.
Targeting changes in pathway activities to overcome antibiotic resistance has
shown promising preliminary outcomes44,59-62. Researchers have been able to restore
vancomycin efficacy in resistant S. aureus by inhibiting amino sugar and purine
biosynthesis59, combine cysteine or other small thiols with rifampicin or isoniazid to kill
“persister” and fully resistant Mycobacterium tuberculosis62, and use exogenous alanine,
glucose, or glutamate to restore kanamycin function in Edwardsiella tarda and
Escherichia coli (causative agents of gastrointestinal distress)60,61. Continued exploration
into pathway activity can provide new co-therapy options for antibiotic resistant
infections.

19
Pathway activity can be inferred from observing differential changes in mRNA
expression. Statistical methods, such as pathway enrichment analysis, a common
technique used for interpreting differentially expressed gene lists by comparing gene list
membership to memberships of known pathways individually63, have been used to
identify pathways involved in antibiotic resistance. However, most pathway enrichment
analysis methods are complicated by selection methods for gene list membership and do
not consider all pathway activities simultaniously64-69. GSEA improves upon these
methods by removing the gene selection requirement. Further, by using pathway
signatures to detect activity changes across all well-established pathways, scientists can
get a higher-level vantage of cellular processes that contribute to resistance. Pathway-
centric computational approaches, like the one proposed here, can improve how mRNA
expression is used to interpret pathway activity changes associated with antibiotic
resistance. When applied to mRNA expression datasets examining resistant and sensitive
strains, my computational approach could identify pathway targets useful for the
development of novel co-therapeutic options to clinically combat the worldwide
antibiotic resistance problem. Without these advancements, antibiotic therapy will
continue regressing into a post-antibiotic era where common infections, minor injuries,
and surgeries, once again threaten the lives of billions of people worldwide11,70.
1.3 Goal and Aims of the Study
The overall goal of this study was to elucidate molecular changes associated with
antibiotic resistance in S. aureus through computational mRNA expression and biological
pathway activity analyses to identify targetable pathways for co-therapeutic development
to overcome antibiotic resistance. To do this, I applied a computational approach that
20
uses GSEA to define and compare pathway signatures from S. aureus mRNA expression
datasets that examine 1) mutation-driven resistance (i.e., comparison of resistant and
sensitive S. aureus under the same treatment condition to identify the contributions of
known or established mutations to loss of antibiotic sensitivity)56,71-76, 2) antibiotic
response (i.e., comparison of S. aureus with and without antibiotic treatment, regardless
of strain resistance level)77, and 3) antibiotic susceptibility (i.e., difference in treatment
response between resistant and sensitive strains) to accomplish the following aims:
• Aim 1: Identify pathway activity changes associated with mutation-driven
resistance
• Aim 2: Identify pathway activity changes associated with vancomycin
susceptibility
• Aim 3: Compare pathway activity changes associated with mutation-driven
resistance to pathway activity changes associated with vancomycin, oxacillin, and
linezolid susceptibilities and responses
I used my approach to identify and confirm inferred pathway activity changes
associated with mutation-driven resistance, and antibiotic susceptibility and response in
S. aureus, focusing around vancomycin because of its alarming treatment failure rate
clinically11,56. Pathway activity changes identified for mutation-driven resistance were
then compared to changes associated with susceptibility and response to one of three
antibiotics individually (vancomycin, oxacillin, or linezolid) in both sensitive strains and
strains with varying resistance levels. The purpose of this analysis was to identify
pathway activity changes occurring via selective pressures from antibiotic exposure56,78-81
that potentially contribute to developing resistance in sensitive strains. These changes

21
have the potential to restore antibiotic sensitivity if used as a co-therapeutic target. The
outcome of this work could demonstrate a path to improve clinical outcomes by
predicting valuable pathway targets for co-therapeutic options to preclude or overcome
antibiotic resistance in S. aureus. Further, my approach is directly applicable to other
antibiotic resistant bacterial species and could be instrumental in predicting antibiotic co-
therapies targeting pathway activity changes that can be used to restore the efficacy of
current antibiotic therapies.

22
CHAPTER 2
REVIEW OF LITERATURE
This work applied a new computational approach based on pathway signatures
using Gene Set Enrichment Analysis (GSEA) to analyze mRNA expression data to
determine changes in pathway activities associated with antibiotic resistance in S. aureus.
This chapter begins with the specifics of known antibiotic resistance mechanisms for
vancomycin, oxacillin, daptomycin, and linezolid. I then detail the GSEA
algorithm/software67 used in this work and include a discussion of its benefits and
challenges. This chapter concludes with an overview of popular pathway databases
commonly used in pathway enrichment analysis with a discussion on which databases
were best to use in my study.
2.1 Review of Experimentally Recognized Antibiotic Resistance Mechanisms
This section is a review of antibiotic resistance mechanisms in S. aureus as they
pertain to my study. Since vancomycin and oxacillin are cell wall synthesis inhibitors, I
begin with a brief review of cell wall construction for gram positive bacterial species like
S. aureus. The cell wall is an important cellular structure located outside of the
cytoplasmic membrane that maintains cell shape and internal osmotic pressure82.
Bacterial cell walls contain peptidoglycan (PTG), which is unique to bacterial species,
making them excellent targets for antibiotic therapies3,56,82,83. PTG is comprised of
strands of alternating glycan sugars, N-acetyl glucosamine (NAG) and N-acetyl muramic
acid (NAM), crosslinked by amino acid bridges, forming a complex, thick, rigid, three-
dimensional layer that surrounds the entire cell3,82. The enzyme, transpeptidase, creates
these crosslinks by binding to the D-Alanine:D-Alanine (D-Ala: D-Ala) ends of NAM

23
molecules (Figure 1). Cell wall synthesis inhibitors, such as penicillin, oxacillin,
methicillin, and vancomycin, prevent transpeptidation resulting in a weak peptidoglycan
layer3,82. Penicillin and its derivatives, oxacillin and methicillin, use their -lactam ring
structures to bind transpeptidase, thus preventing transpeptidase binding to D-Ala:D-Ala
ends for cross-linkage (Figure 1)3,83. Vancomycin binds to D-Ala:D-Ala ends causing
steric hindrance, preventing the transpeptidase from binding and inhibiting cross-linkage
(Figure 1)14,19,83. Disrupting cell wall formation stalls bacterial growth or invokes cell
lysis, thus killing S. aureus cells3,19,83.
Daptomycin is a cell membrane disrupter that upsets the electrical potential all
cells produce across their cell membrane that is driven by a charged ion concentration
gradient. Daptomycin does this by using calcium to insert itself by anionic phospholipid
phosphatidylglycerols, a common component in cell membranes, then oligomerizing
before translocating throughout the cell membrane to form an oligomeric pore resulting
in ion leakage and dissipation of cell membrane potential (Figure 1)84-86. Losing the tight
control of ion flux that generates cell membrane potential radically alters cellular osmotic
pressure, often producing lethal consequences for the cell.
Linezolid is a protein synthesis inhibitor. Protein synthesis inhibition hinders
protein production for essential cellular metabolic machinery and structural components,
leading to issues with all cellular processes leading to cell death3. Protein synthesis
requires the formation of a ribosomal complex consisting of a large and small ribosomal
subunit sandwiched around mRNA3. Linezolid specifically binds to the peptidyl
transferase site of the large ribosomal subunit (50S), physically inhibiting formation of
the initiation complex (Figure 1)87-89. Established resistance mechanisms for all

24
antibiotics discussed here including linezolid circumvent these processes and are
discussed in the remainder of this section.
Figure 1. Bacterial cell wall synthesis and mechanism of action of antibiotics commonly
used to treat S. aureus infections: oxacillin, vancomycin, daptomycin, and linezolid
Cell walls are composed of alternating N-acetylmuramic acid (NAM, red hexagon) and
N-acetyl glucosamine (NAG, green hexagon) sugar layers to form peptidoglycan.
Transpeptidase (blue oval) cross-links (red line) NAG-NAM sugar layers by the amino
acid ends (black line) of NAM sugars to give peptidoglycan in bacterial cell walls rigidity
from osmotic pressure. Cell wall synthesis inhibitor antibiotics inhibit peptidoglycan
formation. Oxacillin (green circle) acts by binding to transpeptidase so it cannot bind
NAM ends (red X) to form cross-links. Vancomycin (purple oval) attach to amino acid
ends, preventing transpeptidase binding and cross-link formation. Daptomycin (purple
triangle) inserts its itself into the cytoplasmic membrane (dark blue oval) leading to
oligomerization and eventually pore formation that disrupts membrane integrity.
Linezolid binds to 50S ribosomal subunits (gray circle), inhibiting it from binding 30S

25
ribosomal subunits (gray oval) and preventing translation complex formation around
messenger ribonucleic acid (mRNA, black line). Without the ability to produce proteins,
cellular processes slow to a halt leading to death.
2.1.1 Vancomycin Resistance
Vancomycin resistance in S. aureus uses one of two different mechanisms90.
Vancomycin resistant Staphylococcus aureus (VRSA) infections are characterized by
high-level minimum inhibitory concentration (MIC) of >16mg/L, sudden-onset resistance
that arise from acquisition of the Tn1546 transposon from a vancomycin-resistant
enterococci plasmid during a mixed infection with MRSA14,56,81,83. VRSA is marked by
van operon, a group of 7 genes that produce modified peptidoglycan precursors
containing a terminal D-Ala:D-Lac instead of D-Ala:D-Ala while also eradicating
susceptible wild-type D-Ala:D-Ala ends14,56,81. Vancomycin has a much lower affinity for
the D-Ala:D-Lac ends than the wild-type D-Ala:D-Ala ends14,56,81, thus conveying the
observed resistance phenotype. Fortunately, VRSA infections are rare with only 14
isolates reported in the United States by 201656,91.
Vancomycin intermediate Staphylococcus aureus (VISA) infections are of greater
clinical concern with incidences of VISA infections steadily increasing and death tolls in
the tens of thousands annually56,59. VISA infections lack the van operon and are usually
associated with low-level resistance (MIC 2-8mg/L)56,92, persistent infection, long
hospitalizations, and prolonged or failed vancomycin treatment56. They commonly
develop in MRSA patients treated with vancomycin for an extended period of time82,
resulting in altered physiology and metabolism to sustain growth during vancomycin
exposure59,93. Thickened cell walls that are high in uncross-linked peptidoglycan chains
with the D-Ala:D-Ala ends are associated with intermediate resistance14,94,95. Evidence

26
suggests overproduction of the D-Ala:D-Ala ends in thickened cell walls act as decoys
blocking vancomycin in external layers and diverting it from reaching its intended
targets14,96. With continued exposure, the cell wall clogs with trapped vancomycin,
further hindering vancomycin effectiveness and leading to the development of full
vancomycin resistance14,97. VISA is usually preceded by an intermediate phenotype,
heterogenous VISA (hVISA), where the infection is a mixed population of sensitive
(MIC <2mg/L) and resistant (MIC >4mg/L) cells56. This makes VISA and hVISA
infections difficult to detect due to the low vancomycin doses needed for testing despite
variations in testing methods (i.e., E-strip, broth dilution)56. Further, VISA and hVISA
infections can enter a transient resistance state like other bacterial “persister” infections,
which is thought to be controlled by ATP depletion triggering entrance into the stationary
growth phase where cells become metabolically dormant and do not divide54,56,98, making
them difficult to treat and resulting in frequent reoccurring infections. Taken together, it
is easy to see why VISA infections are worrisome clinically.
Further, the mechanisms behind the development of VISA resistance are not
completely understood14. VISA isolates share phenotypic characteristics, such as
thickened cell wall, but there is substantial variation across strains in how these traits are
produced (i.e., types and number of genes mutated and specific mutations used)59,99.
Table 3 summarizes genes associated with VISA. Most genes associated with VISA are
part of the “cell wall stimulon”100. Researchers theorize that resistance develops from a
series of step-wise gene mutations14,56, and the majority of mutations has become
associated with certain S. aureus lineages101,56. For example, several nonsynonymous
single-nucleotide polymorphisms associated with VISA phenotype are part of two- and

27
three- component regulatory systems, such as graRS, vraTSR and walKR, which alter
expression of over 100 cell wall biosynthesis, including genes required to produce D-
Ala:D-Ala ends56,59,72,100,102-104. Over 40 of those genes, termed the “cell wall stimulon”,
are controlled by vraSR, resulting in cell wall synthesis when induced by cell wall
damage. Alternatively, active walKR controls expression of autolysins, which are
proteins needed for cell wall turn-over during division. In vancomycin sensitive strains,
vraSR remains inactive since it does not detect cell wall damage during vancomycin
exposure while walKR continues to be active to support cell division, the combination
resulting in cell lysis. Further, when the cationic antimicrobial peptide (CAMP) switch,
graSR, is activated it suppresses walKR expression and induces activity of over a dozen
cell wall synthesis genes, such as vraFG, vraDE, mprF and dltABCD, that overlap and
complement “cell wall stimulon” activity. Mutations that cause the over-expression of
vraSR, graSR, and/or several of the cell wall synthesis genes they control (e.g., mprF),
and/or under-expression of walKR result in increased cell wall thickness and decreased
cell division (i.e., slow growth), the classic VISA phenotype45,56,73,74,105-107. Further,
seemingly unrelated mutations that down-regulate activity of global regulators, such as
rpoB which encodes the RNA polymerase -subunit, are linked to VISA phenotype (i.e.,
increased cell wall thickness)45,56,108-112. This demonstrates the complexity of identifying
consistent genetic markers behind VISA development and highlights the need for an
additional perspective.

28
Table 3. Genes Associated with VISA Phenotypes
Phenotype Genes Role in VISA Phenotype
Cell wall thickening
and reduced autolytic
activity
graRS Up-regulates over 13 genes including vraFG,
vraDE, capsule operon, mprF, dltABCD, fmtC,
mgrA and rot, down-regulates walKR and agr,
and is associated with nucleotide metabolism
pbp4 Reduced rates of peptidoglycan cross-linking
and transpeptidation
sarA Reduced production of autolysins responsible
for cell wall recycling mgrA
clpP Cell wall thickening, slow growth, and
reduced autolysis stp1
walKR
(yycFG)
Limited walKR activity lowers rates of
autolysis and increases cell wall thickness
yycH Lowered expression of autolysis genes
Up-regulated cell wall
stimulon
vraSR Associated with reduced vancomycin
susceptibility, up-regulates 40 cell wall
stimulon genes including vraFG and mprF
vraFG Associated with reduced vancomycin
susceptibility
prsA
isdE
fmtC (mprF) Increased net negative charge of cell wall and
reduced peptidoglycan cross-linking
spoVG Increased capsule production
capA-capP
Down-regulated
global regulators
arg Attenuation of virulence and reduced
vancomycin susceptibility rot
rpoB Associated with reduced vancomycin
susceptibility rsbU
yjbH
vraT (yvqF) Up-regulates vraSR, reduced vancomycin
susceptibility
Decreased Production
of Virulence Factors
sbi Altered IgM binding
spa Observed alterations in opsonization and
phagocytosis
Source: Adopted From McGuinness WA, Malachowa N, DeLeo FR (2017). Vancomycin
Resistance in Staphylococcus aureus. Yale Journal of Biology and Medicine, 102(43),
pp.269-28156,99,102,113,114.
Researchers are looking at pathway activity in VISA isolates experimentally to
better comprehend resistance mechanisms and find links between reversable alterations in
the core metabolism of S. aureus and VISA phenotype107. Changes in acetate catabolism

29
due in part to reduction of tricarboxylic acid (i.e., Kreb’s, citrate, TCA) cycle are
associated with VISA phenotypes59, suggesting S. aureus may use a variety of metabolic
changes to develop vancomycin resistance. Increases in wall teichoic acid and
peptidoglycan precursor biosynthesis, urea cycle, arginine metabolism, nucleotide
metabolism56 such as purine biosynthesis, and carbon flow through the pentose phosphate
pathway are associated with VISA phenotypes59,107. This highlights the importance of
examining pathway changes to fully understand developing vancomycin resistance
mechanisms.
2.1.2 Oxacillin Resistance
Researchers have characterized two mechanisms S. aureus uses to resist -lactam
antibiotics (i.e., penicillin and its derivatives). Initial penicillin resistance occurred
through acquisition of the plasmid-borne bla operon, which contains an extracellular
enzyme, -lactamase, that inactivates -lactams by hydrolyzing their -lactam rings so
they can no longer bind transpeptidase14. Methicillin and other next generation -lactams
(e.g., oxacillin and flucloxacillin) have a semi-synthetic penicillinase-resistant -lactam
ring14. MRSA is characterized by high-level resistance (MIC >2mg/L) that is associated
with acquisition of the plasmid-borne mec operon that encodes a mutated transpeptidase
that lacks -lactam affinity14,19,31. Most cases of -lactam resistance clinically are MRSA,
though occasionally -lactam resistant strains lacking the mec operon arise from
chromosomal mutations that alter transpeptidase affinity for -lactam antibiotics21.
Regardless, oxacillin resistance is relatively well characterized at the genetic level
compared to resistance to other antibiotics.

30
2.1.3 Daptomycin Resistance
Despite being a cell membrane disrupter rather than a cell wall synthesis inhibitor
antibiotic, daptomycin resistance (MIC >1mg/L) often presents in MDR S. aureus strains
alongside VISA phenotypes with several genes implicated across antibiotic resistance84-
86. The most frequently described mutation associated with daptomycin resistance is in
mprF. For daptomycin resistance, mprF that encodes an enzyme that attaches lysine to
phosphatidylglycerol, thus conferring resistance by reducing binding of daptomycin to
bacterial membranes. However, mutations in mprF are also associated with VISA
phenotypes56 due to its role in cell wall synthesis under the direction of VISA regulator
genes like graSR, vraSR and yycFG (also known as walKR)53,115. Evidence in MRSA
strains suggest that mprF mutations conferring daptomycin resistance are also associated
with over-expression of vraSR, and inactivation of vraSR alone can increase daptomycin
sensitivity71,72. Recent work has shown a single missense mutation in mprF can confer
resistance to daptomycin and vancomycin while improving oxacillin susceptibility104.
Further, mutations associated with VISA in genes that are not directly related to cell wall
synthesis, such as rpoB, have been implicated in daptomycin resistance. The diverse and
often interconnected MDR mechanisms used by S. aureus to overcome daptomycin
therapy impedes clinical treatment and further supports the need to examine antibiotic
resistance from a broader pathway activity perspective.
Interestingly, daptomycin has structural similarities to cationic antimicrobial
peptides (CAMPs) made by the mammalian innate immune system from which
polymyxin antibiotics like colistin (i.e., polymyxin E) are derived86,116,117. Colistin is
commonly used as a last option, due to human toxicity issues, to treat gram negative

31
MDR infections118,119. Unfortunately, S. aureus has an intrinsic resistance to polymyxins
in part because of their affinity for lipopolysaccharide (LPS) which is not found in gram
positive bacteria15,117,120. However, genes associated with daptomycin resistance, such as
mprF and graSR, are also associated with intrinsic resistance to CAMPs in S. aureus,
leading researchers to question the overlap of resistance mechanisms76,116.
2.1.4 Linezolid Resistance
Rarely (<1% of clinical isolates), S. aureus infections develop resistance to
linezolid (MIC >4mg/L). One mechanism reported involves changing the large ribosomal
subunit through a single nucleotide chromosomal mutation in the peptidyl transferase
site14. S. aureus has around five ribosomal RNA encoding genes and three ribosomal
proteins L3, L4 and L22, encoded by rplC, rplD and rplV genes, respectively, have been
linked to linezolid resistance52,87,121-123. Researchers theorize that linezolid resistance
arises from multiple ribosomal subunit mutations, which accumulates based on selective
pressure from linezolid exposure, likely in a gene-dosage effect (i.e., as mutations accrue
higher linezolid doses are required for successful treatment)14,52,87,124,125. Another way to
acquire linezolid resistance is through a plasmid containing genes that confer cross-
resistance to other protein synthesis inhibitors87 . For example, the cfr gene that encodes a
methyltransferase that modifies an adenosine in the large ribosomal subunit has been
linked to resistance of phenicol, lincosamide, oxazolidinone, pleuromutilin and
streptogramin A, commonly referred to as the PhLOPSA phenotype87,126,127. Also,
linezolid resistance has been linked to acquiring the lmrS gene that encodes a major
facilitator superfamily protein, an MDR efflux pump49,128. S. aureus uses a variety of
mechanisms to develop linezolid resistance.

32
2.2 Review of Computationally Identified Antibiotic Resistance Mechanisms
While experimental examination has successfully identified several resistance
mechanisms, substantial expertise and resources are needed to accomplish this, which
slows clinical progress in treating resistant infections. Use of computational methods,
such as gene expression and pathway enrichment analyses, can provide insight into
biological processes, thus focusing experimental efforts and speeding clinical progress.
Here, I added to the genome sequencing and mutational analysis just reviewed to discuss
resistance mechanisms identified through gene expression and pathway enrichment
analyses as they pertain to this work.
2.2.1 Documented Gene Expression Analysis Findings
Most gene expression studies, including those used in this work and described
earlier, use gene expression analysis to report changes in individual differentially
expressed genes identified through statistical comparison (e.g., fold change threshold
and/or T-test p-value). Several experimentally established resistance genes have been
identified via gene expression analysis, including most of them finding confirmed
experimentally that I discussed in the prior section76,101,129. For example, gene expression
analysis in studies examining how graSR mutations affect antibiotic resistance in
S. aureus have confirmed the association of mprF and the dltABCD operon with
daptomycin and colistin resistance as determined by fold change ratio difference76,129.
Another study using gene expression analysis found increased expression of VISA
associated cell wall stress genes, vraSR, vraFG, vraDE, fmtA, murZ, and tcaA, were
found in a high level vancomycin and low level daptomycin resistant strain as determined
by fold change ratio difference101, showing that computational gene expression analysis

33
can identify resistance mechanisms. Gene expression analysis can detect changes in
operon expression if several genes in the same operon have similar changes, such as the
vra operon in VISA (vraSR, vraFG, and vraDE). However, operon expression changes
do not directly correlate with pathway activity changes as an operon can belong to
multiple pathways130,131. For this, pathway enrichment analysis is needed.
2.2.2 Documented Pathway Enrichment Analysis Findings
For microbiological studies, Fisher’s Exact Test or one of its variants is used to
calculate the significance of enrichment between the generated gene list and individual
pathways from a pathway knowledgebase. This analysis can be done at the time of gene
expression analysis or can be performed post hoc on publicly accessible mRNA
expression datasets. Few gene expression studies examining antibiotic resistance collect
differentially expressed genes identified through statistical comparison to generate a gene
list for pathway enrichment analysis. One such study performed pathway enrichment
analysis on differentially expressed genes from gene expression data examining
vancomycin resistant phenotypes (i.e., sensitive and VISA strains, both untreated) using
Kyoto Encyclopedia of Genes and Genomes (KEGG) pathways identified decreased
expression of quorum sensing genes, supporting experimental findings that agr, an
accessory gene regulator for a quorum sensing system plays a role in vancomycin
resistance, and implicating the entire arg pathway in the VISA phenotype. This pathway
enrichment analysis with KEGG also implicated some new pathways associated with
vancomycin or linezolid susceptibility (i.e., antibiotic treated versus untreated VISA
strains), like increased glycine, serine, and threonine metabolism, and decreased quorum
sensing56,132. KEGG has been further used in pathway enrichment analysis to identify

34
TCA cycle’s role in vancomycin resistance, a finding which is leading to the
development of new therapeutic co-targets59. In other antibiotics, pathway enrichment
analysis of oxacillin resistance gene expression datasets using KEGG have found up-
regulation of glycolysis, arginine biosynthesis, and TCA cycle and downregulation of
pentose phosphate, amino acid and nitrogen metabolism pathways133. Pathway
enrichment using FET also reported increases in -lactam resistance pathway activity
including over-expressed antimicrobial resistance proteins, VraF and VraG, in methicillin
treated S. aureus biofilms and altered glucose metabolism regulation when MRSA was
treated with water extract from Galla chinensis, a nontoxic Chinese herbal medicine
thought to have antibacterial properties134,135. Unfortunately, there are no pathway
enrichment analysis studies examining linezolid resistance in S. aureus, but pathway
enrichment analysis using FET in other bacterial species, like Enterococcus faecalis, with
both KEGG and Gene Ontology, another pathway knowledgebase, have identified
changes in peptidoglycan biosynthesis, valine, leucine, and isoleucine degradation, and
metabolic processes136. However, these pathway enrichment analyses using Fisher’s
Exact Test are limited because they compare gene list membership based on differential
expression with a statistical cut-off to individual pathways, therefore not considering the
entire genome from a pathway perspective.
The number of studies that use GSEA for pathway enrichment analysis in
microbiology is minute, with only one study that examined macrolide resistance in
Streptococcus pneumoniae that used GSEA to identify genes of interest between gene
expression datasets then used FET to detect pathway enrichment in identified genes137.
This Streptococcus pneumoniae study stated that a substantial percentage of GSEA-

35
identified genes using this approach had genome annotation issues (i.e., hypothetical
proteins), which limited the ability of their approach to detect pathway activity changes
associated with resistance137. My work here used GSEA to generate pathway signatures,
an improvement in pathway enrichment analysis compared to prior studies that have been
performed 1) on S. aureus using FET, and 2) examining antibiotic resistance using GSEA
in any pathogen.
2.3 Review of Gene Set Enrichment Analysis
My study utilized Gene Set Enrichment Analysis (GSEA)67,138 , a method
originally developed by Subramanian, et al., and a software provided by the Broad
Institute. GSEA has been used extensively to examine alterations in human pathways,
single nucleotide polymorphisms, and methylation patterns in cancer67,139 and diabetes138.
However, only a few microbial projects have used GSEA, primarily being applied to
examine connections between viruses and cancer growth66,140,141. In this section I
discussed in detail how GSEA works and its benefits and challenges compared to other
methods used to select differentially expressed genes and compare them to known
pathways.
2.3.1 Method and Software Implementation
The reader familiar with the GSEA software67,138 may skip directly to section 2.3.2.
The overall objective of GSEA is to assess whether members of a gene set appear
enriched at one end of the reference signature. GSEA software begins by creating a
reference signature, which I defined as a list of items (probes, gene symbols, locus tags,
or pathways) ranked in order of differential expression or activity from high to low.
Using a phenotype label file, GSEA identifies which samples in expression dataset

36
correspond to which experimental group. It uses that information to calculate a user
defined statistic, such as Welch T-test, for between two conditions (i.e., untreated and
treated) for each item. This statistical score represents how strong of a connection an item
has to a phenotype. Items are then ranked in order of those statistical values from high to
low, forming the reference signature.
GSEA then goes item by item through the reference signature, comparing each
item to the query gene set, which is an unranked list of items (genes or pathways
corresponding to the type of item in the reference signature) with knowledge-based
biological relevance (i.e., pathway or tail of a reference signature from another study).
GSEA calculates a running-sum statistic, called the enrichment score, which represents
the extent the query gene set is overrepresented at the top or bottom (i.e., most extreme
T-scores) of the reference signature. If an item in the reference signature matches an item
in the query gene set (i.e., hit), the enrichment score changes based on its ranking statistic
value. The Phit equation is: Phit = ΣgjϵS j<i ǀrjǀp/NR, where NR = ΣgjϵS j<i ǀrjǀ
p, gj is the item in
the reference signature under consideration, S represents the query gene set, j is the
position of the item being evaluated, i symbolizes the most recent position evaluated in
the reference signature, rj is the item’s (gj) ranking score (i.e., T-score), and p is 1. To
consider the weight of each item based on its ranking score, p is set to 1. If p is set to 0,
as is done in the Kolmogorov-Smirnov statistic, no consideration is given to the ranking
score of each item. NR becomes a constant for each query gene set, calculated as the sum
of the absolute value of ranking scores for all hits. If an item in the reference signature
does not match any item in the query gene set (i.e., miss), the enrichment score changes
by a constant based on reference signature and query gene set defined as Pmiss = Σgj¢S j<i 1 /

37
(N-NH), where N is the number of items in the reference signature and NH is the number
of items in the query gene set.
The maximum enrichment score, abbreviated ES(S), is the maximum deviation
from Phit-Pmiss to zero with the fewest number of reference signature items. Any hits
located in that range are defined as leading edge items. Leading edge items are the core
of the query gene set that contributes most to the enrichment signal. This is illustrated by
the enrichment plot that GSEA produces (Figure 2).
Figure 2. Example Enrichment Plot
Source: Adopted From Subramanian A, Tamayo P, Mootha VK, Mukherjee S, Ebert BL,
Gillette MA, Paulovich A, Pomeroy SL, Golub TR, Lander ES, Mesirov JP (2005). Gene
set enrichment analysis: a knowledge-based approach for interpreting genome-wide
expression profiles. Proceedings of the National Academy of Sciences, 102(43),
pp.15545-1555067.
Significance of the ES(S) is estimated through 1,000 iterations with permutations of
items from the reference signature. A new ES(S) is calculated per iteration, designated
ES(S,π) where π represents a number 1 to 1,000. The ES(S,π) from all iterations are
38
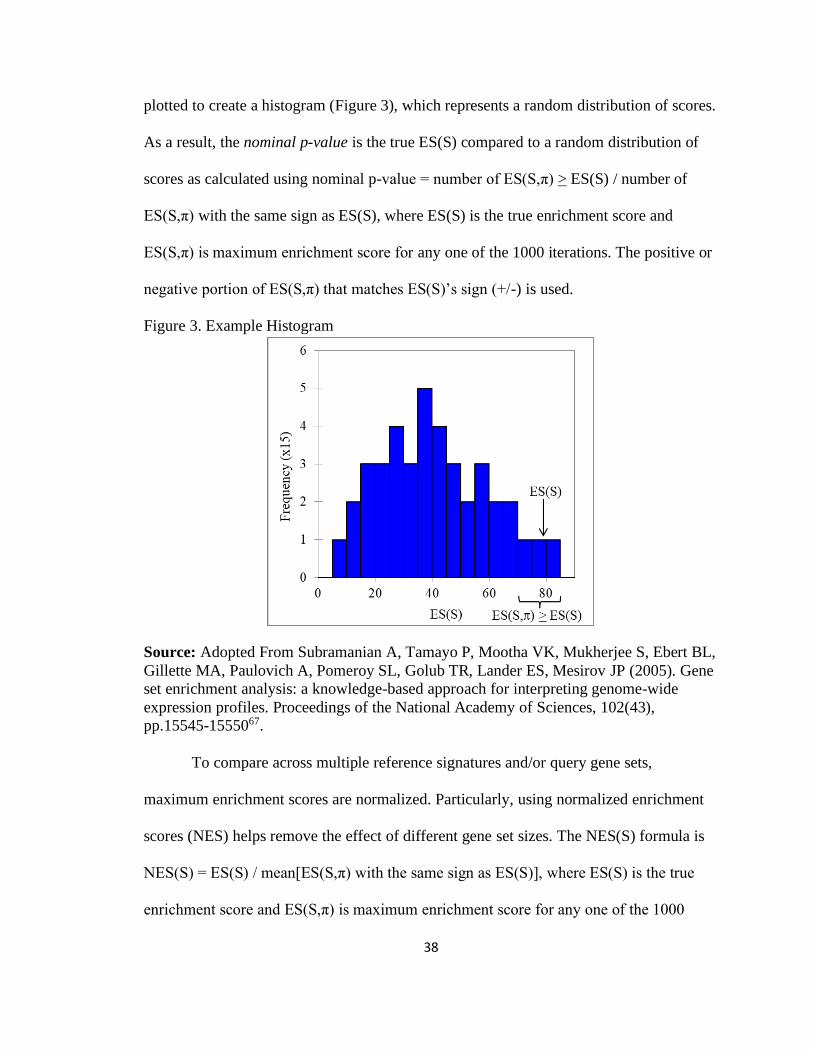
plotted to create a histogram (Figure 3), which represents a random distribution of scores.
As a result, the nominal p-value is the true ES(S) compared to a random distribution of
scores as calculated using nominal p-value = number of ES(S,π) > ES(S) / number of
ES(S,π) with the same sign as ES(S), where ES(S) is the true enrichment score and
ES(S,π) is maximum enrichment score for any one of the 1000 iterations. The positive or
negative portion of ES(S,π) that matches ES(S)’s sign (+/-) is used.
Figure 3. Example Histogram
Source: Adopted From Subramanian A, Tamayo P, Mootha VK, Mukherjee S, Ebert BL,
Gillette MA, Paulovich A, Pomeroy SL, Golub TR, Lander ES, Mesirov JP (2005). Gene
set enrichment analysis: a knowledge-based approach for interpreting genome-wide
expression profiles. Proceedings of the National Academy of Sciences, 102(43),
pp.15545-1555067.
To compare across multiple reference signatures and/or query gene sets,
maximum enrichment scores are normalized. Particularly, using normalized enrichment
scores (NES) helps remove the effect of different gene set sizes. The NES(S) formula is
NES(S) = ES(S) / mean[ES(S,π) with the same sign as ES(S)], where ES(S) is the true
enrichment score and ES(S,π) is maximum enrichment score for any one of the 1000
39
iterations. Similar to nominal p-value, the portion of ES(S,π) that is appropriate (+/-) to
that particular ES(S) is used.
2.3.2 Advantages and Disadvantages of GSEA Compared to Other Methods
Compared to GSEA, Fisher’s Exact Test (FET)142,143 is predominantly used in
microbiology for analyzing mRNA expression data because it is easy to perform and
interpret with no special software or statistical understanding required69. FET determines
if there are non-random associations between groups. Groups are often created by
quantifying the interest of each gene, usually with a T-test or ANOVA p-value, then
counting candidate genes that meet or fall short of an appropriate cut-off
(i.e., p<0.05)69,144,145. FET uses a 2x2 contingency table to compare the proportion of
differentially expressed genes from a dataset found in and excluded from a pathway and
proportion of pathway genes compared to the total number of genes in the database via
and calculates a p-value using hypergeometric (i.e., sampling without replacement)
distribution. Results from FET can have substantial variation based on how differentially
expressed genes are selected and its use on mRNA expression datasets has been criticized
for 1) ignoring biological knowledge regarding how genes work together144, and 2) being
unable to detect significance in gene sets containing several members undergoing subtle
expression changes67.
Subramanian designed GSEA to overcome some of FET’s shortcomings. By
using query sets with an established biological relevance, GSEA results keep within a
biological context67. GSEA is versatile in that query sets can be identified from various
sources including biological pathways, chromosomal locations, computational analysis of
genomic information, or signatures from other gene expression studies67,146. Further,

40
Subramanian and colleagues used human cancer datasets to show that GSEA is sensitive
in identifying gene sets with several members undergoing subtle expression changes that
are statistically insignificant individually via single gene methods (i.e., T-test) yet may be
significant collectively67, since GSEA considers all genes in a dataset rather than those
above a particular cut-off point. However, GSEA has its limitations69,147. It has been
criticized for detecting gene sets without biological relevance (i.e., false positive)147,148
and its inability to distinguish gene sets with biological significance (i.e., false
negative)149. While other algorithms are available to improve GSEA’s error rates, such as
SAM-GS147, Sub-GSE149, and more recently AbsFilterGSEA148, these programs are less
readily available and user-friendly, so GSEA remains a popular software for analyzing
mRNA expression data67,138-141.
Comparison of GSEA and FET has produced varied results. Irizarry, et al., used
the same human cancer datasets Subramanian and colleagues used to introduce
GSEA67,138 to compare GSEA to the 2-test144. The FET and 2-test both compare
independent, not correlated groups to determine independence between two variables,
though the 2-test loses accuracy compared to FET because it assumes large sample sizes
so it uses approximations150. Irizarry and colleagues showed that both GSEA and 2-test
identified the same gene sets as interesting, but GSEA had several false positives that
favor small gene sets144. They recommended the use of the 2-test over GSEA for this
reason, in addition to the 2-test being more user-friendly144. However, Abatangelo and
associates used cancer expression datasets from human cell cultures and patient samples
to find that GSEA is better than FET at detecting gene sets with subtle differences in the
distributions of gene expression levels in a gene set between two phenotypic

41
conditions151. They praised GSEA for its ability to detect true distribution changes
despite phenotypic differences being caused by a wide range of altered pathways, and did
not observe GSEA’s limitations151. Meanwhile, Tintle and his colleagues took an interest
in GSEA for bacterial use, comparing it to FET on both simulation and real expression
data from Salmonella typhimurium and Escherichia coli. They found FET lacked
robustness and power compared to GSEA69. Tintle, et al., also saw that GSEA was overly
sensitive to gene sets with few differentially expressed genes (i.e., false positives), but
they were unable to predict if this was an inherent flaw with GSEA software147 or if
adjusting the weight of GSEA’s weighted K-S-like statistic for bacterial datasets would
overcome this sensitivity issue69. Consideration for potential detection errors will be
given when interpreting results from my S. aureus work here.
2.4 Overview of Pathway Databases
There are several publicly accessible databases that contain pathway information
that can be applied to genes of interest. Subramanian and colleagues introduced the
Molecular Signature Database (MSigDB)152-154 when they introduced the GSEA
software67. MSigDB now houses eight gene set collections with over 10,000 gene sets for
various human genome characteristics and cellular processes, particularly cancer,
metabolic, and immunological gene sets154. Reactome is a free, manually curated, peer
reviewed pathway database, which contains 10,719 human genes which accounts for 53%
of the 20,338 predicted human protein-coding genes155,156. Unfortunately, MSigDB and
Reactome do not have gene sets for S. aureus.
Gene Ontology (GO) is a popular source of cellular information for
bacteria68,157,158 GO is a comprehensive knowledge base of gene functions and products

42
that was designed to unify the representation of genes and proteins across all species159.
GO currently includes experimental findings from almost 140,000 published papers and it
is often used as a part of the genome annotation process157-159. GO classifies gene
functions along three aspects: molecular function (i.e., molecular activities of gene
products), cellular component (i.e., where gene products are active), and biological
process (i.e., pathways and larger processes made up of the activities of multiple gene
products). GO biological processes consist of multiple molecular activities and must have
more than one distinct step157,158. GO provides easy, user-friendly enrichment analysis for
gene lists of interest through collaboration with the Protein Analysis Through
Evolutionary Relationships (PANTHER) Enrichment Analysis Tool160.
For bacterial pathways, the Kyoto Encyclopedia of Genes and Genomes (KEGG)
database is arguably regarded as one of the leading pathway databases in the
field68,159,161,162. KEGG is an integrated database resource containing manually curated
fifteen databases broadly categorized into three information categories: systems,
chemical, and genomic163. The systems information category contains KEGG pathway
and KEGG module databases. The KEGG pathway database consists of manually drawn
pathway maps that represent current knowledge of molecular interaction, reaction, and
relation networks for metabolism, genetic and environmental information processing,
cellular processes, organismal systems, human diseases, and drug development. KEGG
modules are an assortment of manually defined functional units used for biological
interpretation and annotation of sequenced genomes. There are four types of KEGG
modules: pathway modules, signature modules, structural complexes, and functional
sets163. Pathway modules embody tighter functional units than KEGG pathways and are

43
therefore closer to actual biological pathways163,164. Signature modules include markers
of phenotypes, which in the case of S. aureus are exclusively drug resistance gene sets.
Structural complex modules contain genes that form molecular machineries. Any other
type of essential gene set not previously categorized falls into the functional sets module
category. KEGG does not have an easy, user-friendly way to perform enrichment analysis
on a group of genes. External programs, such as Database for Annotation, Visualization
and Integrated Discovery (DAVID), have been developed to provide an interface for
KEGG pathway-based enrichment analysis165,166.
A lesser known source for bacterial pathway information includes the SEED and
its associate database, the Pathosystems Resource Integration Center (PATRIC)167-169. In
2005, the Fellowship for Interpretation of Genomes began the Project to Annotate 1000
Genomes, resulting in the SEED. Their initial data version in 2005 included 180,177
proteins with 2,133 different functional roles across 383 different organisms and the
project has only expanded167. The SEED differs from other resources as it is based on
expert curated groups of functionally related protein families (i.e., subsystems) that span
several diverse genomes whose annotations are computationally extended to new
subsystem members rather than gene-by-gene annotation approaches employed by other
resources167. This produces more accurate and faster annotations since experts in each
subsystem oversee initial annotations that are applied across diverse genomes167. The
SEED constantly assimilates different types of genomic data from a variety of sources,
including KEGG167,169. In 2011, the SEED developers were commissioned by the
National Institute of Allergy and Infectious Diseases to apply the subsystem approach to
annotation to priority disease-causing microbial pathogens, such as S. aureus168,170.

44
PATRIC, an organism-focused resource to provide scientists with genomic information
for priority pathogens, was the result168,170. Like KEGG, PATRIC does not yet have a
user-friendly interface for enrichment analysis nor do DAVID or many other external
programs connect to it.
To explore these pathway database variations in bacteria, Tintle and his
colleagues evaluated gene set consistency across pathway databases, including GO,
KEGG, and the SEED, in 17 diverse bacteria including S. aureus Mu50 (MRSA/VISA)
strain68,171. While KEGG had the least number of gene sets, it had the largest average
gene set size68. Using their consistency metrics, differential expression, absolute
expression, and correlation between expression values, they found GO was more
consistent than KEGG gene sets, regardless of gene set size or organism differences, but
the SEED was able to outperform both GO and KEGG in all consistency metrics68. I
considered pathway database variations in my project, particularly since all
knowledgebases have been extensively updated since Tintle’s study several years ago
(2012) including addition of antibiotic resistant pathways in KEGG’s last update162.
2.5 Conclusion
Gene mutation studies have revealed several mechanisms associated with
individual and multiple antibiotic resistances, such as involvement of vraSR and graSR in
daptomycin, vancomycin and oxacillin resistances. Examination of differential gene
expression for individual genes can also find changes associated with resistances, such as
increased expression of vra operon genes (vraSR, vraFG, and vraDE) associated with
VISA. Pathway enrichment analysis using FET complements differential gene expression
for individual genes by detecting pathway activity changes associated with antibiotic

45
resistances such as decreased TCA cycle associated with vancomycin intermediate
resistance. FET is limited by its requirement to select a subset of genes for enrichment
analysis. GSEA overcomes the limitations of this gene selection requirement by
considering all genes rather than a subset. My innovative project was the first to apply
GSEA to examine S. aureus. However, use of GSEA to examine antibiotic resistance in
Streptococcus pneumoniae by comparing gene expression changes directly was limited
by incomplete and inaccurate genome annotation66. To overcome this limitation, I used
GSEA to define pathway signatures derived from comparing mRNA expression datasets
containing S. aureus samples of antibiotic resistant and sensitive strains with or without
antibiotic treatment to KEGG pathways. The overall goal of this analysis was to elucidate
and verify experimentally pathway activity changes associated with antibiotic sensitivity.

46
CHAPTER 3
ANTIBIOTIC RESISTANCE IN STAPHYLOCOCCUS AUREUS
3.1 Background
Staphylococcus aureus (S. aureus) causes a wide variety of life-threatening
infections21,59. Despite the discovery of a wide array of antibiotics3,13,14, S. aureus
infections are a public health threat due to increasing antibiotic resistance (i.e., clinical
treatment failure)11. The most serious is methicillin resistant Staphylococcus aureus
(MRSA), which is resistant to the -lactam class of antibiotics, like oxacillin and
flucloxacillin11,172, that inhibit cell wall synthesis by directly inactivating transpeptidase
activity21,172. MRSA infections are commonly treated with vancomycin82,90,173, a different
kind of cell wall synthesis inhibitor that indirectly disables transpeptidase activity by
binding to its target, D-alanyl-D-alanine carboxyl terminus of cell wall precursor
molecules45,59,174. Yet, vancomycin treatment is losing favor due to increasing morbidity
and mortality rates from resistant infections175 and worldwide resistance prevalence176. In
cases of vancomycin-resistant infections, the protein synthesis inhibitor linezolid is a
preferred therapy14,177,178. However, clinicians have reported multifocal outbreaks of
linezolid resistant S. aureus52,87,179 with lethal consequences174,180,181. For linezolid
resistant S. aureus infections, the cell-membrane-targeting lipopeptide daptomycin is a
preferred therapy and while rare, daptomycin resistant infections are reported86,116. To
complicate treatment options further, some S. aureus infections are caused by multi-drug
resistant (MDR) strains182. Limited treatment options coupled with increasing mortality
and continued spread of antibiotic resistant S. aureus infections have been major clinical
challenges for infectious disease management11,183.

47
Antibiotic resistant S. aureus infections are particularly troublesome clinically, in
part because of an incomplete understanding of individual and shared resistance
mechanisms. A good example of this is vancomycin resistance. Vancomycin resistant
Staphylococcus aureus (VRSA) arises from acquisition of the vanA operon via horizontal
transfer that replaces D-alanyl-D-alanine with D-alanyl-D-lactate carboxyl termini56,78-81
resulting in sudden high-level (minimum inhibitory concentration >16mg/L) resistance.
Vancomycin intermediate Staphylococcus aureus (VISA), which lacks the vanA operon,
are associated with low-level (minimum inhibitory concentration 2-8mg/L) developing
resistance52,56,184,185 produced from a variety of gene mutations, particularly in cell wall
synthesis genes like two-component switches, graSR, vraSR, and walKR, and the over 40
cell wall “simulon” proteins they directly influence, including mprF, arg, and the
dltABCD operon55,56,99,100,186, with no mutations being consistent across isolates unlike
vanA operon found in all VRSA strains55,56. VRSA clinical isolates are also MRSA,
which occurs through acquiring a mutated transpeptidase (mecA)21,172, and maintain high
level resistance to both vancomycin and methicillin. Some of these isolates also develop
linezolid resistance via acquisition of lmrS that encode a multi-drug efflux pump49,128 or
the cfr ribosomal methyltransferase187.
While the mechanism of vancomycin resistance through the vanA operon is well
characterized, mechanisms for VISA are not completely understood since it seems that
the VISA phenotype can arise through independent and different mutations or
mechanisms. For example, vancomycin and daptomycin resistances may arise either
independently from different mechanisms or simultaneously through genes alterations in
shared resistance producing mechanisms, such as graSR, vraSR, and walKR56,101,129. In

48
either case (daptomycin and vancomycin resistance individually or together) there are no
specific mutations consistent across isolates115,188,189. Cell wall synthesis genes,
particularly those regulated by vraSR, are implicated in resistances to oxacillin that lack
mecA74,75. Despite this overlap in their associated genes, a phenotypic “see-saw” effect
where methicillin resistance reduces when vancomycin resistance increases in VISA
strains is sometimes observed clinically56,104,190,191. To better understand this complex
network of genes potentially contributing to the development of antibiotic resistance,
researchers are now considering a broader perspective based on pathway activity. There
is an on-going effort to target individual molecular pathways to overcome antibiotic
resistance44,59-62, such as restoring vancomycin sensitivity in a VISA strain by inhibiting
amino sugar and purine biosynthesis59. Having robust and comprehensive computational
approaches that accurately identifies pathway changes on a global genome-wide scale in
resistant and sensitive S. aureus, as I use in this work, could better direct such
experimental efforts by revealing phenotypic association44,192.
Biological pathway analysis is often used to assign functional membership to
differentially expressed genes67,160,165,193. First, an appropriate, statistical cut-off (e.g.,
T-test p-value) is used to select the most differentially expressed genes in a dataset
between two phenotypes of interest165. Next, the group of selected genes (i.e., gene set) is
subjected to statistical techniques, such as Fisher’s Exact Test (FET), which estimates the
significance of enrichment (i.e., a degree of overlap between a selected gene set and
established pathways) through an exact p-value estimation method157,158,160,165,194,195.
Pathway activity changes are defined by enrichment significance (e.g., pathway
enrichment with over-expressed gene set represents increased pathway activity). Even

49
though FET is well established and successfully applied, this approach is not suited to
detect cellular processes where a group of genes in a specific pathway undergo subtle
expression changes and miss statistical cut-offs by a small margin yet play a biologically
important role69,144,196. To overcome this limitation, Subramanian, et al, at the Broad
Institute developed Gene Set Enrichment Analysis (GSEA)67,138, an approach widely
utilized to examine molecular changes in oncology and other human disease
mechanisms67,138,197-200, but has not been used to examine antibiotic resistance in
S. aureus. GSEA uses the differential expression levels of all genes in the dataset for
gene ranking (i.e., signature generation) to estimate enrichment based on a normalized
running-sum statistic that represents the extent the query gene set is overrepresented (i.e.,
high overlap) in the overall dataset. By considering all genes rather than just those that
meet a statistical cut-off, GSEA is more sensitive in identifying overlooked gene
groups67. Therefore, examining antibiotic resistance using a GSEA-based approach,
particularly when expanding it to identify pathway activity changes directly from mRNA
expression datasets for multiple pathways simultaneously, as my approach does here, I
can get a pathway-centric view of resistance and its association with an observed
phenotype.
Here I utilized GSEA to analyze publicly accessible mRNA expression data by
defining pathways signatures (i.e., pathway lists ranked by activity changes) to elucidate
molecular changes associated with antibiotic resistance in S. aureus with the goal of
identifying potential co-therapy targets that increase antibiotic susceptibility. Resistance
mechanisms driven by known vraS or graSR mutations are reported, so I first used my
pathway signature approach to detect pathways associated with known mutation-driven

50
resistance (i.e., comparison of resistant and sensitive S. aureus under the same treatment
condition)56,71-76 since it is easier to see how differential gene expression in some
pathways may be correlated to resistance, in addition to known and established mutation
effects. I extended my analysis to identify known and novel pathways associated with
antibiotic response (i.e., comparison of S. aureus with and without antibiotic treatment,
regardless of strain resistance level) and susceptibility (i.e., difference in treatment
response between resistant and sensitive strains) 77 to identify inducible mechanisms that
could contribute to resistance. I first used my approach to examine vancomycin
susceptibility, focusing on vancomycin because of its alarming treatment failure rate
clinically11,56. I then extended my analysis to compare pathway activity changes
associated with vraS-driven resistance to vancomycin, oxacillin, and linezolid
susceptibilities and response in a sensitive strain specifically, to uncover novel activity
changes associated with developing antibiotic resistance. One such pathway is lysine
biosynthesis for which I experimentally demonstrated biological relevance via alterations
in antibiotic sensitivity. I showed here that my approach can identify pathways as
potential co-therapeutic targets. My results are immediately applicable for development
of co-therapy options to overcome antibiotic resistance in S. aureus.
3.2.Results
3.2.1. Pathway Signature Approach Identified Pathway Activity Changes Associated
with Antibiotic Resistance Driven by vraS and graSR Mutations
I began by using a dataset that compared a sensitive mutS strain to the antibiotic
resistant VC40 strain obtained from serial exposure of the mutS strain to vancomycin
(experimental details of this and all datasets used in this study are provided in

51
APPENDIX A) to define the VC40vsmutS pathway signature (as described in Section
3.4.2), representing pathway activity changes resulting from vraS mutation contributing
to antibiotic resistance. GSEA normalized enrichment score (NES), which measures the
extent of gene enrichment in an individual pathway normalized to account for variations
in pathway size67, for pathways in the VC40vsmutS pathway signature ranged from 1.79
to -2.09. From the VC40vsmutS pathway signature, two pathway panels containing the
20 most differentially active pathways from the positive and negative tails of
VC40vsmutS (NES >1.24 and <-1.33 for up- and down-regulated pathways panels,
respectively) were generated. I found pathways containing the genes associated with to
vraS-driven resistance previously identified from single gene expression analysis101, such
as histidine biosynthesis (M00026: NES=1.79, GSEA p-value<0.001) from the up-
regulated panel and amino-acyl tRNA biosynthesis (M00359: NES=-2.08, p-
value<0.001; M00360: NES=-2.03, p-value=0.002) and succinate dehydrogenase
(M00149: NES=-1.56, p-value=0.010) from the down-regulated panel (Table 4). My
approach also identified several statistically significant pathways with no prior
association to resistance, such as up-regulated lysine biosynthesis (M00016: NES=1.63,
p-value=0.021; M00527: NES=1.69, p-value=0.011). I noticed that variations in pathway
panel size (pathway panels sizes ranging from 15 to 25 pathways) and the use of
VC40vsmutS pathway signature to define mutation-driven resistance panels did not alter
these results (APPENDIX B).

52
Table 4. vraS-driven Resistance Pathway Panels
Panel Signature Module number
Up VC40
vsmutS
Histidine biosynthesis (M00026)*, Osmoprotectant transport
system (M00209)*, Biotin biosynthesis BioW pathway
(M00577)*, Lysine biosynthesis via diaminopimelic acid
aminotransferase (M00527)*, Lysine biosynthesis via succinyl-
diaminopimelic acid (M00016)*, Leucine biosynthesis (M00432),
Biotin biosynthesis (M00123), D-Methionine transport system
(M00238), Cationic antimicrobial peptide resistance VraFG
transporter (M00730), Dissimilatory nitrate reduction (M00530),
Putative peptide (M00583), Phosphonate (M00223), Betaine
biosynthesis (M00555), Peptides/nickel (M00239), Cationic
antimicrobial peptide (M00732), Arabinogalactan
oligomer/maltooligosaccharide (M00491), Serine biosynthesis
(M00020), VraS-VraR cell-wall peptidoglycan synthesis
(M00480), Inosine monophosphate biosynthesis (M00048),
Cytochrome D ubiquinol oxidase (M00153)
Down VC40
vsmutS
Amino-acyl tRNA biosynthesis prokaryotes (M00360)*, Amino-
acyl tRNA biosynthesis eukaryotes (M00359)*, TCA cycle
(M00009)*, ABC-2 type (M00254)*, Uridine monophosphate
biosynthesis (M00051)*, Iron complex (M00240)*, Energy-
coupling factor (M00582)*, Nickel complex (M00440)*, TCA
first carbon oxidation (M00010)*, Spermidine/ putrescine
transport system (M00299)*, Succinate dehydrogenase
prokaryotes (M00149)*, ArlS-ArlR virulence regulation
(M00716)*, TCA cycle second carbon oxidation (M00011),
Acylglycerol degradation (M00098)*, Adenine ribonucleotide
biosynthesis (M00049), Menaquinone biosynthesis (M00116),
Molybdate transport system (M00189), DNA polymerase III
complex, bacteria (M00260), Guanine ribonucleotide biosynthesis
(M00050), Shikimate pathway (M00022)
Modules listed in order of normalized enrichment score from most to least change in
pathway activity. * represents Gene Set Enrichment Analysis derived p-value<0.05. Bold
font indicates a pathway with genetic mutation association to vraS-driven resistance.
Pathways that have a * but do not have bold font are pathways with no previous
association with vraS-driven resistance identified from my pathway signature approach.
Next, I demonstrated the ability of my pathway signature approach to detect
known antibiotic resistance mechanisms in another, non-overlapping datasets that
examined resistance changes associated with mutations in graSR. Within this category,
the first dataset compared sensitive strains HG001 (functioning graSR) and SG511
53
(truncated graS) to resistant HG001 and SG511 obtained from serial exposure to
daptomycin. The second dataset compared a wildtype HG001 (WT, functioning graS)
and its mutant strain with a deletion of entire graSR genes (graSR). As is common with
bacterial experiments, these datasets had a small sample size (<5
samples/condition)201,202, so I was not surprised to observe complete separation (i.e., no
overlap) of individual samples, representing two distinct sample populations as detailed
in APPENDIX C, when performing 1) principal component analysis203-205 on all genes or
pathways, 10 or 100 randomly selected genes, or 20 randomly selected pathways, and
2) leave one out cross validation using 1000 randomly selected pathway panels whose
membership excluded pathways from my vraS-driven resistance panels (r2=1.0). Despite
this sample size limitation, I was able to define two pathway signatures: 1)
HG001vsSG511 (GSEA NES ranging from 2.22 to -2.01), which embodies the difference
in resistance mechanisms between strains with different graSR functions, and
2) WTvsgraSR (NES ranging from 2.34 to -2.19), which represents pathway activity
changes associated with graSR-driven resistance mechanisms. When examining the most
differentially active pathways in the HG001vsSG511 and WTvsgraSR pathway
signatures, I again found pathways with single gene associations to graSR-driven
resistance reported. For example, for the most differentially active pathways in the
HG001vsSG511 pathway signature (Table 5), I detected increased KdpD-KdpE
potassium transport (NES=1.80, GSEA p-value=0.002) and decreased SaeS-SaeR
staphylococcal virulence regulation (NES=-1.66, p-value=0.002), C5 isoprenoid
biosynthesis mevalonate pathway (NES=-1.80, GSEA p-value=0.002), and fatty acid
biosynthesis initiation (NES=-1.63, GSEA p-value=0.018), pathways which had reported

54
single gene associations of ≥2-fold change in transcriptional levels129. For the most
differentially active pathways in the WTvsgraSR pathway signature (Table 6), I found
decreased GraS-GraR cationic antimicrobial peptide transport activity (NES=-1.45, p-
value=0.007) as expected for a signature comparing strains known for their graSR genetic
variations76. I also found several significant differentially active pathways with known
graSR-driven resistance, as identified by a ≥1.8-fold change in transcriptional levels and
a P-value (Z-test) ≤3.5×10⁻⁴, such as cationic antimicrobial peptide resistance dltABCD
operon (NES=-1.88, p-value<0.001), cationic antimicrobial peptide resistance lysyl-
phosphatidylglycerol (L-PG) synthase MprF (NES=-1.56, p-value=0.002), LytS-LytR
two-component regulatory system (NES=-1.46, p-value=0.006), and cationic
antimicrobial peptide resistance VraFG transporter (NES=-1.59, p-value=0.002)76. Taken
together, these results highlight the ability of my pathway signature approach to detect
known resistance mechanisms.

55
Table 5. Most Differentially Active Pathways Representing the Difference in
Resistance Mechanisms between Strains with Different graS Functions
Panel Signature Module number
Up HG001
vsSG511
Oligopeptide (M00439)*, Dissimilatory nitrate reduction
(M00530)*, Histidine biosynthesis (M00026)*, Lysine
biosynthesis via diaminopimelic acid aminotransferase
(M00527)*, Arbutin-like (M00268)*, Manganese/zinc
(M00792)*, D-methionine transport (M00018)*, -Lactam
resistance Bla system (M00627)*, Arginine biosynthesis
(M00844)*, Lysine biosynthesis succinyl-diaminopimelic acid
(M00016)*, Glycolysis Embden-Meyerhof pathway (M00001)*,
D-Methionine transport system (M00238)*, Guanine
ribonucleotide biosynthesis (M00050)*, Urea cycle (M00029)*,
Nucleotide sugar biosynthesis prokaryotes (M00362)*, KdpD-
KdpE potassium transport (M00454)*, Glycolysis core module
involving 3-carbon compounds (M00002)*, Reductive pentose
phosphate cycle (M00166)*, Betaine biosynthesis (M00555)*
Down HG001
vsSG511
Iron complex (M00240)*, Mannitol-specific (M00274)*, AgrC-
AgrA exoprotein synthesis (M00495)*, Biotin biosynthesis BioW
pathway (M00577)*, Triacylglycerol biosynthesis (M00089)*, C5
isoprenoid biosynthesis mevalonate pathway (M00095)*, Pentose
phosphate pathway archaea (M00580)*, Spermidine/ putrescine
transport system (M00299)*, Biotin biosynthesis (M00123)*,
Ribosome bacteria (M00178)*, F-type ATPase prokaryotes and
chloroplasts (M00157)*, Inosine monophosphate biosynthesis
(M00048)*, SaeS-SaeR staphylococcal virulence regulation
(M00468)*, Putative ABC (M00211)*, Fatty acid biosynthesis
initiation (M00082)*, Nickel complex (M00440)*, Zinc
(M00242)*, ABC-2 type (M00254)*, Galactitol-specific (M00279)
Modules listed in order of normalized enrichment score from most to least change in
pathway activity. * represents Gene Set Enrichment Analysis derived p-value<0.05. Bold
font indicates a pathway with genetic mutation association to the difference in resistance
mechanisms between strains with different graS functions. Pathways that have a * but do
not have bold font are pathways with no previous association with graS-driven resistance
identified from my pathway signature approach.

56
Table 6. Most Differentially Active Pathways Representing graS-driven Resistance
Panel Signature Module number
Up WTvs
graSR
Lysine biosynthesis via succinyl-diaminopimelic acid (M00016)*,
Lysine biosynthesis via diaminopimelic acid aminotransferase
(M00527)*, Threonine biosynthesis (M00018)*, Riboflavin
biosynthesis (M00125)*, Leucine biosynthesis (M00432)*,
Histidine biosynthesis (M00026)*, Coenzyme A biosynthesis
(M00120)*, Urea cycle (M00029)*, Nickel complex (M00440)*,
Teichoic acid (M00251)*, Arginine biosynthesis (M00844)*,
Isoleucine biosynthesis (M00570), PhoR-PhoB phosphate
starvation response (M00434)*, Arbutin-like (M00268),
Valine/isoleucine biosynthesis (M00019), Biotin biosynthesis
BioW pathway (M00577), Trehalose-specific II component
(M00270), BraS-BraR bacitracin transport (M00734), VraS-VraR
cell-wall peptidoglycan synthesis (M00480), Phosphate (M00222)
Down WTvs
graSR
Inosine monophosphate biosynthesis (M00048)*, Ribosome
bacteria (M00178)*, Amino-acyl tRNA biosynthesis prokaryotes
(M00360)*, Cationic antimicrobial peptide resistance dltABCD
operon (M00725)*, Amino-acyl tRNA biosynthesis eukaryotes
(M00359)*, RNA polymerase bacteria (M00183)*, Nucleotide
sugar biosynthesis prokaryotes (M00362)*, Pyrimidine
deoxyribonuleotide biosynthesis (M00053)*, Guanine
ribonucleotide biosynthesis (M00050)*, Cytochrome aa3-600
menaquinol oxidase (M00416)*, Glutathione biosynthesis
(M00188)*, Cationic antimicrobial peptide resistance VraFG
transporter (M00730)*, Adenine ribonucleotide biosynthesis
(M00049)*, Cationic antimicrobial peptide resistance lysyl-
phosphatidylglycerol (L-PG) synthase MprF (M00726)*,
Glycolysis core module involving three-carbon compounds
(M00002)*, Manganese/zinc (M00792)*, LytS-LytR two-
component regulatory system (M00492)*, Fatty acid biosynthesis
initiation (M00082), GraS-GraR cationic antimicrobial peptide
transport (M00733)*, TCA cycle (M00009)
Modules listed in order of normalized enrichment score from most to least change in
pathway activity. * represents Gene Set Enrichment Analysis derived p-value<0.05. Bold
font indicates a pathway with genetic mutation association to graS-driven resistance.
Pathways that have a * but do not have bold font are pathways with no previous
association with graS-driven resistance identified from my pathway signature approach.
Since graSR and vraSR share control of expression for some genes like
mprF72,206,207, I examined the similarities and differences in pathway activities between
my vraS-driven resistance panels and HG001vsSG511 and WTvsgraSR pathway

57
signatures. I found significant similarities between my up-regulated vraS-driven
resistance panel and positive tails from both HG001vsSG511 and WTvsgraSR pathway
signatures (Figure 4A). I was unable to find similarities for the down-regulated panel
since the WTvsgraSR pathway signature was borderline significant, although the down-
regulated panel in HG001vsSG511 is significantly enriched does not represent a true
enrichment. To see how likely NES calculated for my panels could be achieved
randomly, I re-ran the analysis with 1000 randomly generated 20-pathway panels and
find statistical significance for the same three of four analyses (Figure 4B), confirming
the borderline enrichment observed in the down-regulated panel. These results also
showed enrichment obtained by my up-regulated panel were non-random.

58
Figure 4. Identification of Pathway Activity Change Similarities and Differences
Associated with vraS- and graSR-driven Resistance
(A) Gene Set Enrichment Analysis (GSEA) show pathway activity change similarities
and differences between vraS-driven resistance panels (queries) and the HG001vsSG511
and WTvsgraSR pathway signatures (references). (B) Box and whiskers plots of
normalized enrichment score (NES) from 1000 randomly generated pathway panels
(individual queries) compared to the HG001vsSG511 and WTvsgraSR pathway
signatures (references) illustrate that the NES achieved by comparing reference pathway
signatures to vraS-driven resistance panels used as query in (A) are among the best NES
obtained randomly. (C) Receiver operator characteristic curve calculations quantify the
ability of individual pathways to separate samples by resistance, revealing vraS-driven
resistance pathways that contribute most to graSR-driven resistance. Stars indicate
individual pathways with statistically significance in the VC40vsmutS pathway
signature. AUROC, area under the receiver operator characteristic; ES, enrichment score.
I examined individual pathway activity changes across resistance datasets by
examining which pathways contribute most to GSEA calculating a panel’s maximum
enrichment (i.e., leading-edge pathways, APPENDIX D) between vraS-driven resistance
panels and HG001vsSG511 and WTvsgraSR pathway signatures. I found histidine

59
biosynthesis (M00026), which has an established association with vraS-driven
resistance101 and was significant in the VC40vsmutS signature, was also significant in
both HG001vsSG511 and WTvsgraSR pathway signatures (Table 7). Other panel
pathways with observed associations to resistance were either 1) inconsistently
significant across signatures, such as amino-acyl tRNA biosynthesis (M00359/M00360),
and serine biosynthesis (M00020), or 2) not included in both leading-edges which occurs
when a pathway has insufficient enrichment for it to contribute to achieving the
pathway’s maximum enrichment. For example, succinate dehydrogenase (M00149) was
included in the HG001vsSG511 leading-edge (NES=-1.18, p-value=0.264), but not in the
WTvsgraSR leading-edge (NES=-0.78, p-value=0.732). Lysine biosynthesis pathways,
which were significant in VC40vsmutS, were also significant in both HG001vsSG511
and WTvsgraSR pathway signatures.
Table 7. Shared Leading-edge Pathways Associated with vraS- and graSR-driven
Resistance
Panel Module number VC40vsmutS HG001vsSG511 WTvsgraS
NES p-val NES p-val NES p-val
Up Lysine
biosynthesis via
succinyl-
diaminopimelic
acid (M00016)
1.63 0.021 1.92 <0.001 2.24 <0.001
Serine
biosynthesis
(M00020)
1.30 0.064 1.47 0.006 1.05 0.442
Histidine
biosynthesis
(M00026)
1.79 <0.00
1
2.16 <0.001 1.79 0.002
Leucine
biosynthesis
(M00432)
1.45 0.074 1.72 0.004 1.80 <0.001

60
Panel Module number VC40vsmutS HG001vsSG511 WTvsgraS
NES p-val NES p-val NES p-val
Up Lysine
biosynthesis via
diaminopimelic
acid
aminotransferase
(M00527)
1.69 0.011 2.14 <0.001 2.17 <0.001
Dissimilatory
nitrate reduction
(M00530)
1.34 0.136 2.21 <0.001 0.95 0.507
Betaine
biosynthesis
(M00555)
1.36 0.088 1.76 <0.001 0.97 0.587
Down TCA cycle second
carbon oxidation
(M00011)
-1.49 0.052 -1.15 0.271 -1.43 0.068
Adenine
ribonucleotide
biosynthesis
(M00049)
-1.49 0.053 -1.17 0.272 -1.59 0.005
ABC-2 type
(M00254)
-1.79 0.004 -1.52 0.019 -1.04 0.401
Spermidine/
putrescine
transport system
(M00299)
-1.56 0.035 -1.76 0.004 -0.98 0.531
Amino-acyl tRNA
biosynthesis
eukaryotes
(M00359)
-2.08 <0.00
1
-1.29 0.104 -1.83 0.002
Amino-acyl tRNA
biosynthesis
prokaryotes
(M00360)
-2.03 0.002 -1.26 0.118 -1.93 0.002
Leading-edge pathways identified through Gene Set Enrichment Analysis (GSEA) on
vraS-driven resistance panels (query) and HG001vsSG511 and WTvsgraSR signatures
(references). NES, normalized enrichment score, p-val, GSEA p-value. Bold font
indicates a pathway with known association to vraS- and graSR-driven antibiotic
resistance.
Another way to examine individual pathway activity changes across vraS- and
graSR-driven antibiotic resistance datasets is to calculate area under the receiver operator

61
characteristic (AUROC) curve197,208. I did this for each of the 20 pathways in vraS-driven
resistance panels individually from NES generated from individual samples that made up
HG001vsSG511 and WTvsgraSR to examine which pathways contribute most to
resistance predictions (Figure 4C). I found known resistance pathways, such as histidine
and serine biosynthesis (M00026 and M00020, respectively) from the up-regulated panel
and amino-acyl tRNA biosynthesis (M00359/M00360) from the down-regulated panel,
were among those best (i.e., most consistent across datasets with the appropriate activity
level, 1.00 and <0.01 for up- and down-regulated, respectively) able to separate samples
by resistance levels. Lysine biosynthesis pathways (M00016 and M00527) were also
among the best pathways with other known resistance pathways, indicating their potential
involvement in resistance.
3.2.2. Pathway Signature Approach Detects Pathway Activity Changes Associated with
Vancomycin Susceptibility
I extended analysis with my pathway signature approach to another dataset
dealing with vancomycin susceptibility by repeating the analysis previously described for
the vraS- and graSR-driven resistance signatures. To do this, I used a dataset that
compared vancomycin treated and untreated samples of resistant strains (T8 and C1) and
a sensitive strain (PA). Unfortunately, unlike strains used for the vraS- and graSR-driven
resistance signatures, there was no additional information about the characteristics of T8,
C1, and PA strains available. To generate vancomycin susceptibility pathway panels, I
used data from T8 and PA strains since T8 had a higher resistance level compared to C1,
to define the T8vsPA pathway signature, and used this signature to generate panels as
previously described (GSEA NES ranging from 1.32 to 1.77 and -1.51 to -2.29 for up-
62
and down-regulated pathways panels, respectively, Table 8). My vancomycin
susceptibility panels included several significantly enriched pathways with documented
gene mutation or pathway activity change associations with the vancomycin resistance
phenotype. For example, I saw significant up-regulation of the VraSR two component
system (M00480, NES=1.44, p-value=0.017), which is generally associated with
resistance56, and borderline significance of the pentose phosphate pathways (M00004:
NES=1.42, GSEA p-value=0.073; M00006: NES=1.38, p-value=0.035)59,209. I also
observed significant down-regulation of energy production pathways210-213, such TCA
cycle (M00009: NES=-1.94, p-value<0.001; M00011:, NES=-1.99, p-value<0.001) and
F-type ATPase (M00157, NES=-1.66, p-value=0.006), and translation processes214,215,
like ribosomes (M0178, NES=-2.02, p-value<0.001) and amino-acyl tRNA biosynthesis
(M00359: NES=-2.28, p-value<0.001; M00360: NES=-2.29, p-value<0.001). Further, I
detected statistically significant pathways without current associations to the vancomycin
resistance phenotype, such as increases in amino acid biosynthesis and transport,
specifically threonine and isoleucine biosynthesis and D-methionine transport (M00018:
NES=1.54, p-value=0.036; M00570: NES=1.66, p-value=0.008; M00238: NES=1.49,
p-value=0.046). While lysine biosynthesis pathways were included in the up-regulated
vancomycin susceptibility panel, they did not reach statistical significance (M00016:
NES=1.46, p-value=0.063; M00527: NES=1.43, p-value=0.074).

63
Table 8. Vancomycin Susceptibility Pathway Panels
Panel Signature Module number
Up T8vsPA Uridine monophosphate biosynthesis (M00051)*, Osmoprotectant
transport system (M00209)*, Pantothenate biosynthesis
(M00119)*, Isoleucine biosynthesis (M00570)*, Threonine
biosynthesis (M00018)*, D-Methionine transport system
(M00238)*, Oligopeptide (M00439)*, Formaldehyde assimilation
ribulose monophosphate (M00345)*, Lysine biosynthesis via
succinyl-diaminopimelic acid (M00016), Energy-coupling factor
(M00582), VraS-VraR cell-wall peptidoglycan synthesis
(M00480)*, Lysine biosynthesis via diaminopimelic acid
aminotransferase (M00527), Pentose phosphate cycle (M00004),
Pentose phosphate pathway archaea (M00580), Pentose phosphate
pathway, oxidative phase (M00006)*, Betaine biosynthesis
(M00555)*, Glyoxylate cycle (M00012)*, Riboflavin biosynthesis
(M00125), Putative ABC (M00211), Cationic antimicrobial
peptide resistance VraFG transporter (M00730)
Down T8vsPA Amino-acyl tRNA biosynthesis prokaryotes (M00360)*, Amino-
acyl tRNA biosynthesis eukaryotes (M00359)*, Dissimilatory
nitrate reduction (M00530)*, Ribosome bacteria (M00178)*, TCA
cycle second carbon oxidation (M00011)*, TCA cycle
(M00009)*, Iron complex (M00240)*, Nickel complex
(M00440)*, Siroheme biosynthesis (M00846)*, Cystine
(M00234)*, Fructose-specific (M00273)*, F-type ATPase
prokaryotes and chloroplasts (M00157)*, Putative peptide
(M00583)*, Cytochrome aa3-600 menaquinol oxidase (M00416)*,
Spermidine/ putrescine transport system (M00299)*, Succinate
dehydrogenase prokaryotes (M00149)*, NreB-NreC dissimilatory
nitrate/nitrite reduction (M00483)*, Glucose- specific (M00809)*,
Cytochrome C oxidase (M00154)*, Urea cycle (M00029)
Modules listed in order of normalized enrichment score from most to least change in
pathway activity. * represents Gene Set Enrichment Analysis derived p-value<0.05. Bold
font indicates a pathway with known association to vancomycin intermediate resistance.
Pathways that have a * but do not have bold font are novel pathways associated with
vancomycin intermediate resistance identified from my pathway signature approach.
Next, I examined the pathway activity changes captured by my vancomycin
susceptibility panels in non-overlapping data. To do this, I defined the C1vsPA pathway
signature (NES ranging from 1.91 to -2.21), which was then used as reference for GSEA
against the vancomycin susceptibility panels. I found significant similarities between
vancomycin susceptibility panels and the C1vsPA pathway signature (Figure 5A) that are

64
not randomly generated (Figure 5B). To see if my observed enrichment holds, I generated
vancomycin susceptibility panels from C1vaPA, as done for T8vsPA,and used them for
GSEA against the T8vsPA signature as reference, and did not find a substantial change
(NES=3.30, GSEA p-value<0.001, and NES=-3.31, p-value<0.001; for up- and down-
regulated panels, respectively), supporting the conclusion that both vancomycin
susceptibility panels obtained with GSEA are truly enriched.

65
Figure 5. Identification of Pathway Activity Change Similarities and Differences
Associated with Vancomycin Susceptibility
(A) Gene Set Enrichment Analysis (GSEA) show pathway activity change similarities
between vancomycin (vanco) susceptibility (susc) panels (queries) and the C1vsPA
pathway signature (reference). (B) Box and whiskers plots of normalized enrichment
scores (NES) from 1000 randomly generated pathway panels (individual queries)
compared to the C1vsPA pathway signature (reference) illustrate that the NES achieved
by comparing reference pathway signatures to vancomycin susceptibility panels used as
query in (A) are among the best NES obtained randomly. (C) Receiver operator
characteristic curve calculations quantify the ability of individual pathways to separate
samples by susceptibility, revealing pathways that contribute most to vancomycin
susceptibility. Stars indicate individual pathways with statistically significance in the
T8vsPA pathway signature. AUROC, area under the receiver operator characteristic; ES,
enrichment score.

66
I then examined identified leading-edge pathways (APPENDIX D) and found
several significantly enriched pathways shared across leading-edges with established
genetic or pathway associations to the vancomycin resistance phenotype (Table 9). These
pathways included up-regulated VraSR two component system and down-regulated TCA
cycle, ribosomes, and amino-acyl tRNA biosynthesis. Further, I found significantly
enriched pathways with no current observed association to vancomycin resistance that are
shared between T8vsPA and C1vsPA (Table 9). These pathways included but are not
limited to up-regulated threonine biosynthesis and D-methionine transport and down-
regulated iron and nickel complex and nitrate reduction pathways. I also noted that even
though lysine biosynthesis pathways (M00016 and M00527) were not statistically
significant in the T8vsPA signature, these pathways achieved statistical significance in
the C1vsPA signature (M00016: NES=1.85; M00527: NES=1.80, both p-value=0.002).
Further, isoleucine biosynthesis (M00730), which was significant in the
T8vsPAsignature, did not achieve statistical significance (NES=1.13, p-value=0.307).

67
Table 9. Significantly Enriched Leading-edge Pathways Associated with
Vancomycin Susceptibility
Panel Module number T8vsPA C1vsPA
NES p-val NES p-val
Up Threonine biosynthesis
(M00018)
1.54 0.036 1.87 0.002
Osmoprotectant transport
system (M00209)
1.72 0.016 1.59 0.026
D-Methionine transport system
(M00238)
1.49 0.046 1.81 0.007
Oligopeptide (M00439) 1.47 0.049 1.91 <0.001
VraS-VraR cell-wall
peptidoglycan synthesis
(M00480)
1.44 0.017 1.42 0.028
Down TCA cycle second carbon
oxidation (M00011)
-1.99 <0.001 -1.57 0.024
Cytochrome C oxidase
(M00154)
-1.51 0.015 -1.43 0.039
Ribosome bacteria (M00178) -2.02 <0.001 -1.86 <0.001
Iron complex (M00240) -1.79 <0.001 -2.21 <0.001
Fructose-specific (M00273) -1.70 <0.001 -1.63 0.009
Spermidine/ putrescine
transport system (M00299)
-1.57 0.012 -1.48 0.033
Amino-acyl tRNA biosynthesis
eukaryotes (M00359)
-2.28 <0.001 -2.17 <0.001
Amino-acyl tRNA biosynthesis
prokaryotes (M00360)
-2.29 <0.001 -2.14 <0.001
Nickel complex (M00440) -1.78 <0.001 -1.94 <0.001
NreB-NreC dissimilatory
nitrate/nitrite reduction
(M00483)
-1.52 0.038 -1.47 0.041
Dissimilatory nitrate reduction
(M00530)
-2.08 <0.001 -2.16 <0.001
Glucose- specific (M00809) -1.51 0.013 -1.54 <0.001
Statistically significant leading-edge pathways identified through Gene Set Enrichment
Analysis (GSEA) on vancomycin susceptibility panels (query) and C1vsPA signatures
(reference). NES, normalized enrichment score, p-val, GSEA p-value. Italics font
indicates a pathway with known association to vancomycin intermediate resistance
lacking the vanA operon.
To support my leading-edge findings, I calculated AUROC curves for each
pathway individually and found known up-regulated VraSR two component system
(M00480) and down-regulated translation processes (aminoacyl-tRNA biosynthesis,
68
M00359 and M00360, and ribosome, M00178) and energy production (TCA pathways,
M00009 and M00011, and F-type ATPase, M00157) were among the best pathways to
separate samples based on vancomycin susceptibility (Figure 5C). I also found amino
acid pathways, threonine biosynthesis (M00018), D-methionine transport (M00238), and
lysine biosynthesis (M00016 and M00527), separate samples well (AUROC=1.00), while
isoleucine biosynthesis (M00570) did not (AUROC=0.84).
Next, I expanded my analysis to examine how individual strains respond to
vancomycin treatment by comparing lists of significantly enriched pathways per each tail
(APPENDIX E) from one of four pathway signatures between treated and untreated
samples from the same strain (e.g., PAfromT8treatvsPAfromT8unt). From this analysis, I
identified several pathways with known genetic associations to the VISA phenotype, such
as down-regulated TCA cycle, F-type ATPase, amino-acyl tRNA biosynthesis, and
uridine biosynthesis (Table 10). I found no pathway shared across all four signatures
when comparing statistically significant up-regulated pathways. The VraSR two
component system (M00480) was observed in T8treat only though it is borderline
significant in C1 (NES=1.36, GSEA p-value=0.067) but not in the PA strains
(0.98<NES<1.27, p-value>0.144). I also found pathways without prior association to
vancomycin resistance (Table 10), such as up-regulated threonine biosynthesis
(M00018), D-methionine transport (M00238), and lysine biosynthesis (M00016 and
M00527) in T8 and C1 but not in the PA strains. Interestingly, I found borderline
significance in the other lysine biosynthesis pathway (M00527 T8: NES=1.39, p-
value=0.075; C1: NES=1.63, p-value=0.013; PAfromT8: NES=1.21, p-value=0.245;

69
PAfromC1: NES=1.50, p-value=0.031). For the negative tail lists, only the vancomycin
resistance (VanA, M00651) pathway was statistically significant in all signatures.

70
Table 10. Shared Significantly Enriched Pathways Associated with Vancomycin Response
Panel Module T8 C1 PAfromT8 PAfromC1
NES p-val NES p-val NES p-val NES p-val
Up Lysine biosynthesis via succinyl-diaminopimelic
acid (M00016)
1.52 0.032 1.62 0.014 1.35 0.093 1.42 0.061
Threonine biosynthesis (M00018) 1.74 0.003 1.82 <0.001 1.41 0.093 1.30 0.138
Methionine transport system (M00238) 1.78 0.003 1.66 0.006 1.24 0.213 1.27 0.160
Oligopeptide (M00439) 1.91 <0.001 1.74 <0.001 1.22 0.233 1.11 0.348
Energy-coupling factor (M00582) 1.72 <0.001 1.75 <0.001 1.11 0.331 1.49 0.051
Iron complex (M00240) -1.12 0.292 -1.88 <0.001 1.71 0.006 1.81 <0.001
Down TCA cycle second carbon oxidation (M00011) -2.34 <0.001 -1.77 0.010 -0.66 0.911 0.65 0.915
F-type ATPase prokaryotes and chloroplasts
(M00157)
-1.61 0.036 -1.71 0.029 1.46 0.041 1.00 0.479
Amino-acyl tRNA biosynthesis eukaryotes
(M00359)
-2.28 <0.001 -2.49 <0.001 -0.69 0.920 1.05 0.439
Amino-acyl tRNA biosynthesis prokaryotes
(M00360)
-2.39 <0.001 -2.51 <0.001 0.61 0.957 1.13 0.322
NreB-NreC dissimilatory nitrate/nitrite reduction
two-component regulatory system (M00483)
-1.53 0.024 -1.68 <0.001 0.90 0.659 -1.04 0.412
Nickel complex (M00440) -1.98 <0.001 -2.24 <0.001 1.89 <0.001 1.39 0.079
Dissimilatory nitrate reduction (M00530) -2.33 <0.001 -2.44 <0.001 -0.80 0.734 -0.93 0.558
Uridine monophosphate biosynthesis (M00051) -1.39 0.134 -1.45 0.098 -1.93 <0.001 -2.18 0.003
Putative ABC transport system (M00211) -0.73 0.758 -1.26 0.208 -1.87 <0.001 -1.76 0.006
ABC-2 type transport system (M00254) -1.22 0.175 -1.34 0.120 -1.71 0.006 -1.74 0.023
Modules achieving a Gene Set Enrichment Analysis (GSEA) derived p-value<0.05 in across either vancomycin resistant (T8 and C1)
or sensitive (PAfromT8 and PAfromC1) strains, but not both. Italics font indicates a pathway with known association to vancomycin
intermediate resistance lacking the vanA operon. NES, normalized enrichment score, p-val, GSEA p-value.

71
3.2.3. Comparison of vraS-driven Resistance Panels to Antibiotic Susceptibility and
Response Pathway Signatures Identifies Top Pathway Candidates for
Experimental Examination
Next, I extended this comparison to identify similar pathways between vraS-
driven resistance panels and the most differentially active pathways associated with
oxacillin (1422vs2798 and V3vs923) and linezolid (3577vs378, 5612vs378, 6939vs378,
and 7210vs378) susceptibility and response in a sensitive strain77 (HG001van,
HG001fluc, and HG001line for vancomycin, flucloxacillin, and linezolid, respectively).
By comparing vraS-driven resistance panels to vancomycin susceptibility and response
pathway signatures, I noticed similarities to both pathway panels that are usually
significant (Figure 6A) and not likely the result of random chance since their achieved
NES are frequently significant compared to a random model distribution (Figure 6B). For
oxacillin and linezolid, I saw a reversal in panel activity in sensitive strain signatures
(HG001fluc and HG001line, Figure 6A), which I also observed partially in some
susceptibility signatures, that are not due to random chance (Figure 6B).

72
Figure 6. Pathway Signature Comparison Reveal Similarities and Differences between
vraS-driven Resistance Panel Activity and Pathway Activity Changes in Antibiotic
Susceptibilities and Responses
(A) Normalized enrichment score (NES) heat map (left) generated from comparing vraS-
driven resistance panels (queries) to 11 pathway signatures representing vancomycin
(van), oxacillin (ox), or linezolid susceptibility and response in a sensitive strain
(references) for Gene Set Enrichment Analysis (GSEA) capture similarities and
differences calculated via GSEA enrichment plots (right). (B) NES distribution from
1000 randomly generated pathway panels (individual queries) compared to the 11
pathway signatures (references) show how likely NES achieved by comparing reference
pathway signatures to vraS-driven resistance panels are to be random.
Next, I looked at individual pathway data generated by GSEA across all 11
comparisons between the vraS-driven resistance panels and 11 susceptibility and
response pathway signatures to identify pathways to target in future laboratory
examinations. When considering these computational data to select candidate pathways

73
for future laboratory examinations, I gave priority to up-regulated panel pathways
because of the reproducibility of their enrichment earlier in my analysis (Figure 4).
APPENDIX D lists leading-edge pathways identified per GSEA comparison. Table 11
summarizes pathways shared across dataset leading edges for vancomycin susceptibilities
and responses that may contribute to developing resistance, and Table 12 does the same
for oxacillin. No shared pathways were found across linezolid susceptibilities and
responses. Lysine biosynthesis pathways (M00527 and M00016) had the highest relative
leading-edge frequency among up-regulated panel pathways with representation across
antibiotics (Figure 7), and was easy to establish biological relevance experimentally.
Based on this, I selected lysine biosynthesis for further experimental examination.

74
Table 11. Shared Leading-edge Pathways Associated with Vancomycin Susceptibility
and Response
Panel Module number T8vsPA C1vsPA HG001van
NES p-val NES p-val NES p-val
Up Lysine biosynthesis via
succinyl-diaminopimelic
acid (M00016)
1.46 0.063 1.85 0.002 1.15 0.285
Osmoprotectant transport
system (M00209)
1.72 0.016 1.59 0.026 1.64 0.027
VraS-VraR cell-wall
peptidoglycan synthesis
(M00480)
1.44 0.017 1.42 0.028 1.40 0.057
Lysine biosynthesis via
diaminopimelic acid
aminotransferase
(M00527)
1.43 0.073 1.80 0.002 1.55 0.033
Betaine biosynthesis
(M00555)
1.38 0.038 1.35 0.099 1.37 0.086
Down Menaquinone
biosynthesis (M00116)
-1.19 0.270 -1.21 0.240 -1.48 0.071
Succinate dehydrogenase
prokaryotes (M00149)
-1.52 0.011 -1.24 0.242 -1.29 0.162
Shared leading-edge pathways identified by Gene Set Enrichment Analysis (GSEA)
comparisons between vraS-driven resistance panels and vancomycin susceptibility
(T8vsPA and C1vsPA) and response (HG001van) signatures. NES, normalized
enrichment score, p-val, GSEA p-value. Bold font indicates a pathway with known
association to vancomycin resistance.

75
Table 12. Shared Leading-edge Pathways Associated with Oxacillin Susceptibility and
Flucloxacillin Response
Panel Module number 1422vs2798 V3vs923 HG001fluc
NES p-val NES p-val NES p-val
Up Lysine biosynthesis via
succinyl-diaminopimelic
acid (M00016)
-1.05 0.418 -0.87 0.651 -1.91 <0.001
Inosine monophosphate
biosynthesis (M00048)
-1.32 0.114 -1.66 0.006 -2.31 <0.001
Lysine biosynthesis via
diaminopimelic acid
aminotransferase
(M00527)
-1.19 0.290 -0.67 0.872 -1.66 0.022
Dissimilatory nitrate
reduction (M00530)
-1.37 0.080 -1.67 0.004 -1.80 0.002
Putative peptide
(M00583)
-1.18 0.285 -0.91 0.649 -1.47 0.019
Shared leading-edge pathways identified by Gene Set Enrichment Analysis (GSEA)
comparisons between vraS-driven resistance panels and oxacillin susceptibility
(1422vs2798 and V3vs923) and flucloxacillin response (HG001fluc) signatures. NES,
normalized enrichment score, p-val, GSEA p-value. None of the pathways are already
associated with oxacillin/flucloxacillin resistance.

76
Figure 7. Pathway Signature Comparison Identifies Top Pathway Candidates Across
Antibiotic Susceptibilities and Responses
Gene Set Enrichment Analysis (GSEA) calculates normalized enrichment score (NES)
and identifies leading-edge pathways between vraS-driven resistance panels (queries) and
11 antibiotic (vancomycin (van), oxacillin (ox), flucloxacillin, or linezolid treated and
untreated) susceptibility or response pathway signatures (references) from which relative
frequency of pathway in leading-edges across the 11 reference signatures were
calculated, to determine which pathways may be best to target to overcome multiple
antibiotic resistances.
3.2.4. Antibiotic Sensitivity Changes from Targeting Lysine Biosynthesis Provides
Experimental Evidence to Support Computational Findings
My computational findings predicted that lysine biosynthesis activities might be
involved in resistance to specific antibiotics, so I hypothesized that lysine biosynthesis
plays some role in antibiotic sensitivity. To support this hypothesis, I examined whether
manipulation of lysine biosynthetic pathway alters response of a sensitive strain towards
vancomycin, oxacillin, or linezolid treatment. Aspartate kinase catalyzes the first step in
the lysine biosynthesis pathway and aspartate kinase activity is inhibited by the final

77
product lysine by feedback inhibition (Figure 8A)118. Therefore, I conducted Kirby-Bauer
disk diffusion experiments utilizing changes in the zone of inhibition (i.e., distance of no
growth from antibiotic disk) as an indicator of the effect of amino acid treatment on
S. aureus’s sensitivity to individual antibiotics (vancomycin, oxacillin, or linezolid) as
seen in Figure 8B. I observed a statistically significant (two-tailed Welch’s T-test
p-value<0.05) increase in sensitivity, as seen by increased zone of inhibition, for lysine
compared to vehicle treated samples during vancomycin exposure (Figure 8C). I saw no
change in vancomycin challenged, aspartate treated samples where I might expect to see
increased resistance (i.e., smaller average zone of inhibition). For oxacillin exposure, I
observed significant increases in sensitivity for both lysine and aspartate treatment. For
linezolid exposure, I noted a statistically significant increase in sensitivity in aspartate
compared to vehicle treated samples and no change in sensitivity for lysine treated
samples. For control purposes, I first repeated the disk diffusion experiment using
phenylalanine treatment as a negative control, since the phenylalanine biosynthesis
pathway (M00024) did not have statistically significant changes in activity for any
dataset (data not shown) and I found no change in sensitivity to vancomycin, oxacillin, or
linezolid (T-test p-value>0.204, Figure 8C) with phenylalanine treatment. Second, to
confirm that there are no effects from using vehicle treated rather than no vehicle
treatment (i.e., tryptic soy agar only) samples for controls, I compared triplicate no
treatment plates to vehicle treated plates and found no change in the average zone of
inhibitions for any antibiotic (T-test p-value>0.492).

78
Figure 8. Lysine Biosynthesis from Aspartate is Involved in Vancomycin, Oxacillin, and
Linezolid Sensitivity
(A) Schematic of lysine biosynthesis from aspartate pathway where aspartate, the initial
substrate for lysine biosynthesis, is modified by aspartate kinase for conversion into
lysine, which inhibits aspartate kinase, reducing pathway activity under high
concentrations of lysine and increasing activity under aspartate treatment. (B) Schematic
of disk diffusion experiment where tryptic soy agar (TSA) plates are treated with vehicle
(water) or 20mg/mL of amino acid (lysine, aspartate, or phenylalanine) then S. aureus is
spread across each plate and antibiotic disks applied prior to incubation. After growth,
zone of inhibition (i.e., distance of no growth from edge of antibiotic disk to closest
visible growth) measurements are taken for each disk to determine changes in sensitivity
with larger zones representing more sensitivity. (C) Changes in the average zone of
inhibition from triplicate cultures of the same S. aureus strain plated on TSA treated with
vehicle (water) or 20 mg/mL of lysine, aspartate, or phenylalanine (as a negative control)
then exposed to 30mcg vancomycin (van), 1mcg oxacillin (ox), or 30g linezolid
confirms biological relevance of lysine biosynthesis pathway in antibiotic sensitivity.

79
3.3.Discussion
3.3.1. Summary of Main Findings
Managing antibiotic resistant infections is a major ongoing clinical
challenge8,9,11,17-19. My current understanding of resistance mechanisms is based on
individual genes and pathway enrichment analysis based on statistical threshold that
neglect genes with insufficient changes in expression. While these approaches have been
successful in identifying resistance mechanisms in some infections, another approach
might provide different perspectives on potential mechanisms of resistance for different
antibiotic classes. Here, I used GSEA, a well-established computational tool that takes
into account all changes including those normally do not satisfy arbitrary cutoff in
traditional approach when calculating enrichment, to examine antibiotic resistance, and
am the first to use GSEA on S. aureus. I am also the first to apply a computational
approach using GSEA that defines and compares pathway signatures to detect activity
changes associated with antibiotic resistance and susceptibility across spectra of
antibiotic classes. I began this study by applying my pathway signature approach to
identify pathways associated with vraS-driven resistance. It was shown that my approach
was able to detect the pathways containing the known associations to resistance via single
gene expression analysis (reported using >2 fold-change cutoff between VC40 and
mutS), such as up-regulated histidine biosynthesis76,216-218 and down-regulated amino-
acyl tRNA biosynthesis and succinate dehydrogenase101, as one of the highly enriched
pathways in my analyses (Table 4). I also identified pathways which had no previous
association with antibiotic resistance, such as lysine biosynthesis pathways (Table 4). I
was able to find my up-regulated resistance pathway panel in both graSR-driven
80
resistance pathway signatures (Figure 4A and Figure 4B). More specifically the up-
regulation of histidine and lysine biosynthesis was consistently found to be significantly
enriched (Table 7) and was one of the best able to separate samples by resistance levels
(Figure 4C). When I repeated application of my approach to examine vancomycin
susceptibility and response, I again detected several significantly enriched pathways that
correspond to the pathways with documented gene mutations or pathway enrichment
analyses associated with the vancomycin resistance (i.e., VISA) phenotype (Table 9).
These pathways included up-regulation of VraSR two component system and down-
regulation of energy production pathways210-213, for example F-type ATPase, and
translation processes214,215, such as amino-acyl tRNA biosynthesis, resulting in the slow
growing phenotype reported in VISA strains clinically56. Among identified pathways
with significant enrichment were pathways with no previous association with
vancomycin resistance, such as up-regulated threonine biosynthesis and D-methionine
transport (Table 9). Taken together, these results highlight the ability of my approach to
detect pathways associated with antibiotic resistant phenotypes.
Next, I applied my pathway signature approach to several mRNA datasets
examining resistance and/or response across different antibiotic classes to identify top
pathway candidates affecting development of antibiotic resistance, which was the first
analysis of its kind to the best of my knowledge. I then compared vraS-driven resistance
panels to antibiotic (vancomycin, oxacillin, and linezolid) susceptibility and response
signatures and revealed valuable insight into activity changes associated with the
development of several antibiotic resistances. First, I found similarities that were usually
significant between vraS-driven resistance panels and both vancomycin susceptibility and

81
response signatures (Figure 6). This is an indication of similar activity changes in the
same pathways across signatures, as I observed for example in the osmoprotectant
transport system (M00209), contribute to vancomycin resistance in Figure 7. Further in
Figure 6, the up-regulated vraS-driven resistance panel resulted corresponding pathway
activity changes in oxacillin and linezolid showed all 6 down regulated activities,
representing a complete reversal (i.e., enriched in the opposite tail, such as up-regulated
panel enriched in negative tail). It also showed that the down regulated vraS-driven
resistance panel exhibited only a half of oxacillin and linezolid susceptibility datasets
showed up-regulated pathway activities, representing a 50% partial reversal. These
results support previously reported findings of the occasional resistance “see-saw”
between vancomycin and oxacillin or linezolid56,190,191. When comparing individual
pathway activity changes in vraS-driven resistance panel pathways across antibiotic
susceptibility and response signatures, my approach identified lysine biosynthesis as the
top pathway candidate to target experimentally to alter antibiotic sensitivity (Figure 7).
While lysine biosynthesis has not been previously implicated in antibiotic resistance
directly, aspartate has been shown to play a role in biofilm formation for S. aureus219 and
biofilms are known for their antibiotic resistance220-223. Specifically, D- and L- isoforms
of aspartate inhibited S. aureus biofilm formation in tissue culture plates219. Further,
lysine biosynthesis may contribute to cell wall formation in several different ways.
Lysine biosynthesis generates UDP-N-acetylmuramoyl-L-alanyl--D-glutamyl-meso-2,6-
diaminopimelate, a precursor for peptidoglycan biosynthesis. Lysine itself is part of the
N-acetylmuramic acid pentapeptide that is used for cell wall cross-linkage. Although my
pathway centric computational approach was successful in identifying a pathway that

82
may play a role in development of antibiotic resistance, the determination of exact
mechanisms behind the involvement of lysine biosynthesis in antibiotic sensitivity is
beyond the scope of my approach. However, it was clear from the high relative frequency
in leading-edges across antibiotic susceptibility and response signatures that lysine
biosynthesis was involved in antibiotic sensitivity somehow (Figure 7). Therefore, I
hypothesized lysine biosynthesis would make a good target to alter antibiotic sensitivity
and demonstrated this experimentally (Figure 8).
3.3.2. Implications, Limitations, and Other Considerations
My pathway signature approach provides insight into a different paradigm for
generating antibiotic resistant phenotypes. Most resistance mechanisms identified to date
focus around 1) an enzyme that inactivates the antibiotic, such as -lactamase which
cleaves -lactam rings on penicillin and some of its derivatives14,21, 2) a membrane
transport that pumps the antibiotic out of the bacterial cell, like major facilitator
superfamily multi-drug efflux proteins49,128,224, or 3) a mutation that diminishes the
binding of antibiotic agent such as altered transpeptidase from mecA as a MRSA
mechanism21,172. Instead, my approach provides a broader view examining pathway
activity changes that result from developing resistance. I demonstrated here that by taking
this different perspective, novel targets to improve antibiotic sensitivity, such as lysine
biosynthesis, can be detected.
While my computational approach can give a fresh perspective to antibiotic
resistance mechanisms, my approach does not provide a complete understanding of how
resistance develops. It is also true for our experimental study that showed while aspartate
and lysine supplementation clearly affected antibiotic sensitivity whereas phenylalanine

83
supplementation had no effect, we cannot associate specific biological mechanisms with
our findings. One possibility is that changes in pathway activity could lead to changes in
amino acid concentrations leading to altered sensitivity. By using a single high dose of
amino acid for my experiment, I assumed that regardless of variations in bioavailability
across amino acids due to amino acid configuration (D- vs L-form), the bacterial cell
would become saturated with either aspartate or lysine. While aspartate and/or lysine
saturation would alter lysine biosynthesis pathway activity, it may also alter the activity
of other pathways with shared enzymes. For example, threonine and methionine synthesis
are also derived from an L-aspartate-4-semialdehyde produced in the aspartate to lysine
biosynthesis pathway225. Aspartate kinase isozymes in Escherichia coli and
Corynebacterium pekinense are inhibited by threonine and methionine226,227 while there is
no experimental evidence that aspartate kinase is inhibited by these amino acids in S.
aureus. However, I noted increased threonine biosynthesis and D-Methionine transport
pathway activities were prominent in vancomycin susceptibility, and D-Methionine
transport was part of the HG001vsSG511 up-regulated panel leading-edge (Table 7). This
might suggest that the resistance mechanism I identified from my computational analysis
for vancomycin resistance maybe a previously unknown mechanism. It was
experimentally shown that the SG511 strain, which was able to gain resistance equal to
its HG001 counterpart despite having a truncated graSR, has different sets of up and
down-regulated genes with little overlap129. Unfortunately, there were no threonine
transport, lysine transport, or methionine biosynthesis pathways included in the KEGG
pathways used in this work, so I was unable to better elucidate this resistance mechanism.
However, in version 92.0 which was released on October 1, 2019, KEGG modules were

84
reorganized to focus on metabolism, adding in methionine biosynthesis (M00017) and
removing transporter modules (e.g., D-Methionine transport) and two-component system
modules (e.g., VraSR). This highlights the ever-changing nature of biological databases
and the need for extensive analysis of databases used with my pathway signature
approach since gene set properties, such as gene and pathway inclusion and overlap,
substantially impact the detection ability of my approach.
My analysis also did not detect all pathways associated with antibiotic resistance
that have been reported in the literature. For example, I noticed that the VraDE
transporter (M00737), vraSdriven resistance101 and vancomycin resistance56 was not
selected as a part of pathway panels because it was not enriched enough (i.e., not enough
NES) although ABC transporter genes encoded by vraDE was reported to show high
expression for vraSdriven resistance101 and vancomycin resistance56 in microarray gene
expression analyses. The observed lack of enrichment was not due to a lack of gene
representation (i.e., no genes) of the VraDE transporter pathway in either the KEGG
knowledgebase (74 genes for M00737) or the VC40vsmutS (7 genes) and T8vsPA (9
genes) gene signatures. Of the VraDE transport pathway genes represented in the
VC40vsmutS signature, I noted that no probes for vraD or vraE specifically were
included in the dataset’s platform. For the VraDE transport pathway genes represented in
the T8vsPA and C1vsPA signatures, I noted that they did include probes for vraD or
vraE. When looking at single gene expression for vraD or vraE from vancomycin
susceptibility gene signatures, I found differential expression for vraD in response to
vancomycin between resistant (T8 or C1) and sensitive (PA) strains was not significantly
changed (C1 Welch’s T-test p-value=0.092, T8 p-value=0.599) and vraE was significant

85
for C1 only (C1 p-value=0.033, T8 p-value=0.385). Further, I do not know why some
pathways with known associations to antibiotic resistance in S. aureus via single gene
expression analysis were not represented in S. aureus strains listed in the KEGG
knowledgebase. An example is the WalKR two component system which is associated
with vancomycin and daptomycin resistances56,101, but was not included among S. aureus
KEGG modules at the time of this work. While KEGG included some pathways regulated
by WalKR, such as SaeS-SaeR staphylococcal virulence regulation (M00468), KEGG did
not include all pathways reported to be regulated by WalKR, for example omitting
autolysis or cell wall turnover pathways. If gene lists for missing pathways were
available, they could have been incorporated into my analysis. Though annotation issues
limited my achievable results, these issues did not prevent my pathway signature
approach from detecting novel pathways, such as lysine biosynthesis, that were not
previously detected using other computational methods. Therefore, I expect that my
pathway signature approach’s ability to detect enriched pathways will improve as
genome and pathway knowledgebases are updated, since bacterial genomes commonly
have annotation issues (i.e., incomplete and inaccurate)66,228,229 that reduce pathway
database comprehensiveness (i.e., fewer pathways and genes in each pathway)64,230.
I also noted the vancomycin resistance (VanA, M00651) pathway was included
among significant down-regulated pathways in all vancomycin response signatures from
my vancomycin susceptibility dataset regardless of strain resistance. This finding is
unexpected considering the vanA operon should be expressed more during vancomycin
treatment56. To explain this, I examined individual gene expression for the vanA operon
and found a small set of probes, including the one detecting vanA itself, detect expression

86
(APPENDIX A). I could not find any homologs close enough to these probe sequences to
explain unintended hybridization to non-targeted proteins using Basic Local Alignment
Search Tool (BLAST). Though I could not explain this finding, I noted that vanA
expression should be detectable during vancomycin treatment if T8, C1, and/or PA use it
as a resistance mechanism. This suggests that any resistance in these strains is derived
from a different mechanism, which is not surprising if they are truly VISA strains.
3.3.3. Future Directions
This innovative project holds great potential to improve clinical treatment options
for antibiotic resistant infections. For example, experimental development of therapeutics
that target top pathway candidates, like lysine biosynthesis, identified here could improve
antibiotic sensitivity in S. aureus. More in vitro experimental research is needed to better
understand the meaning of my experimental results. Further experimental research could
examine examining 1) antibiotic response over a time course and with range of amino
acid doses (i.e., titration), 2) kinetics of enzymes in the lysine pathway starting with
aspartate kinase, and/or 3) binding affinity examination of strains with site specific
mutagenesis of genes in the lysine biosynthesis pathway, is needed to elucidate the exact
mechanism of involvement. These studies could involve site-specific mutagenesis
(i.e., creation of genetic mutants) where individual enzymes within lysine biosynthesis
pathways could be altered using CRISPR-Cas9231-233 and alterations in gene expression,
pathway activity, biochemical levels, and phenotypic features like thickened cell walls
and sensitivity measurements can be measured to establish the exact mechanism behind
lysine biosynthesis involvement in antibiotic resistance. A good place to start based on
my results in this work is with site-specific mutagenesis on the meso-2,6-
87
diaminoheptanedioate intermediate and seeing if this changes sensitivity to vancomycin
since, according to KEGG, this intermediate in the lysine biosynthesis pathway can also
be used for peptidoglycan biosynthesis, major cell wall component that is associated with
increased cell wall thickening, characteristic of VISA strains clinically56. To evaluate the
success lysine and aspartate co-treatment may have in vivo, further experiments
beginning with animal models with resistant S. aureus infections are needed. For
example, infection recovery studies using in vivo animal models, where animals are
infected with S. aureus, either a sensitive or resistance strain, and some infected animals
are provided lysine or aspartate supplementation along with their prescribed antibiotic
(e.g., lysine supplementation with vancomycin treatment). The expected outcome of these
experiments, based on the results in this current investigation, should be that animals with
lysine or aspartate supplementation would recover more rapidly than animals given
antibiotics alone. Thus, providing evidence of our pathway signature approach’s
predictive ability. If further experimentation reveals specific lysine biosynthesis pathway
genes involved in antibiotic resistance, targeted interventions could be developed based
on their gene expression pattern. For example, if a lysine biosynthesis gene is
overexpressed, it can be silenced using RNAi approaches while an under-expressed gene
could become overexpressed with additional gene copies delivered via bacteriophage
therapy. Regardless of how lysine biosynthesis is altered, human clinical trials would be
needed before therapeutics that target lysine biosynthesis could be implemented on a
global scale.
Though applied here to S. aureus only, my pathway signature approach is directly
applicable to other antibiotic resistant infections, potentially producing valuable

88
therapeutic directions that could revolutionize the management of deadly infectious
diseases in this era of evolving antibiotic resistance. Thus, I recommend immediate
application of my approach to examine antibiotic resistance in clinically relevant
infections caused by organisms reported by the Center for Disease Control and
Prevention as major public threats , such as Acinetobacter spp., Mycobacterium
tuberculosis, and Clostridium difficile11. Regardless of the intended application, a
thorough review of available pathway knowledge bases specific to the application is
needed to ensure optimal pathway signature creation since knowledgebases vary and are
continually updated. Consideration should be given to gene coverage, gene overlap,
pathway inclusion, and strain/tissue variation. This is especially important when applying
this approach to examining other antibiotic resistant infections as knowledgebases may
differ in their contents across bacterial species230. The pathway knowledgebase selection
process, along with the creation of pathway signatures themselves can be daunting and
time-consuming, particularly for biologists without user-friendly software. While my
pathway signature approach could be used by laboratory and clinical biologists directly
after conducting a mRNA expression study as part of or in addition to RNA-seq analysis
software, such as Rockhopper234,235, the approach can also be used by computational
biologists for data mining as done in this dissertation. I therefore recommend
development of publicly available software, either in collaboration with or in parallel to
what is available for human disease at the Broad Institute in the MSigDB152.
Accomplishing this will require development of user-friendly software for pathway
signature generation, and ongoing semi-automated expansion and maintenance of a
multi-knowledgebase catalog of pathway sets across biological life. Further, use of

89
pathway signatures could be developed into a diagnostic tool to identify resistance
clinically. While my study here ran into sample size limitations, if a dataset were
generated with enough mRNA expression data to produce a successful cross-validation
model, an average multi-variable logistic equation could be generated to predict
resistances. If computing power were improved to be able to examine genome-wide
expression of a patient’s sample without the immobile, expensive chip technology
prominent today, the logistic equation could become the basis for improved diagnostic
methods for antibiotic resistant infections. Taken together, this work could potentially
lead to the development of new clinical advancements, both in drug development and
diagnostics, to treat S. aureus infections. These future directions have the potential to
revolutionize how humanity detects, predicts, and interprets pathway activity from
mRNA expression in several areas throughout microbial science and significantly
enhances understanding of cellular biology. Antibiotic resistant infections continue to be
a foremost medical challenge. My work here addresses this challenge by 1) introducing a
computational approach which define pathway signatures to characterize molecular
changes associated with mutation-driven resistance and vancomycin, oxacillin, and
linezolid susceptibilities and responses in S. aureus, and 2) using that approach to
identify known and novel pathways that can be targeted to improve antibiotic sensitivity
in S. aureus. Further, I lysine biosynthesis is specifically observed to affect vancomycin,
oxacillin, and linezolid sensitivity, suggesting it could become a useful co-therapy target
to treat resistant infections clinically. Examining the antibiotic resistance mechanisms
that involve lysine biosynthesis may lead to the development of new co-therapeutic
options to preclude or overcome antibiotic resistance.

90
3.4.Methods
3.4.1. mRNA Expression Resources
I used GSEA to define pathway signatures (i.e., ranked lists of pathways by
changes in activity based on differential mRNA expression) from Kyoto Encyclopedia of
Genes and Genomes (KEGG) S. aureus pathways (APPENDIX F) and mRNA expression
data (Table 13) as illustrated in Figure 9. More details on all Gene Expression Omnibus
(GEO) datasets are found in APPENDIX A.
Figure 9. Schematic Overview of Approach
Gene signatures are ranked lists of genes from high (red) to low (blue) differential mRNA
expression between Group 1 and Group 2 based on an appropriate statistical method,
such as T-score. Gene signatures are used as references for Gene Set Enrichment
Analysis (GSEA) against 164 Kyoto Encyclopedia of Genes and Genomes (KEGG)
S. aureus pathways (APPENDIX F) as individual query sets to generate 164 normalized
enrichment score (NES), one per pathway, representing the extent of enrichment.
Pathways with the most differential activity change have NES furthest away from zero
(white). Pathway signatures (i.e., pathway lists ranked by NES from high (red) to low
(blue) differential activity between Group 1 and Group 2) are used in this study for three
purposes: 1) discovery of pathway activity changes between two experimental groups, 2)
verification of discovered findings, and 3) comparison to other pathway signatures.

91
Table 13. S. aureus Datasets Utilized for this Study
T Use Dataset Description Group 1 Group 2 S Ranking
None D GSE46887101 Triplicate untreated cultures of resistant (vanco and
daptomycin) VC401 (VraSR mutation) and sensitive mutS
logged with DNA pool2
VC40 mutS 6 T-test
V GSE50842129 Duplicate untreated cultures of resistant (vanco and
daptomycin) progeny of both HG001 (GraSR) and SG5113 (truncated GraSR) logged to their respective sensitive
ancestor strains2
HG001 SG511 4 FC
V GSE2601676 Unlogged triplicate HG001 (WT) and graSR cultures4 WT graSR 6 T-test
Van
co D, C GSE26400 Triplicate replicates of vanco untreated or treated (4mM PA,
16mM C1, 32mM T8) samples of vanco resistant C1 or T8
logged to its respective PA sample by treatment5 over a time
course6
T8 PA 6 T-test
V, C C1 PA 6 T-test
Oxac
illi
n C GSE26282 Triplicate replicates of untreated or oxacillin treated resistant
samples with 2798 logged to 1422 by treatment5 over a time
course6
1422 2798 6 T-test
C GSE26258 Five replicates of oxacillin treated or untreated samples of
oxacillin resistant V3 and 923 logged by treatment5
V3 923 10 T-test
Lin
ezoli
d C GSE26358 Duplicate replicates of linezolid untreated or treated samples
of resistant 3577, 5612, 6939, or 7210 logged to sensitive 378 by treatment5 over a time course6
3577 378 4 FC
C 5612 378 4 FC
C 6939 378 4 FC
C 7210 378 4 FC
Man
y C GSE70040 77 Unlogged cultures6 of antibiotic sensitive strain HG001
either vanco, fluc, or linezolid treated or untreated over a
time course7
Vanco Untreated8 18 T-test
C Fluc Untreated8 18 T-test
C Linezolid Untreated8 18 T-test
C, comparison of pathway signature to pathway panels defined in discovery dataset; D, discovery dataset used to define
pathway panels used for comparison to all other datasets; FC, fold change; fluc, flucloxacillin; S, number of samples used;
T, treatment (datasets with treated samples also have untreated samples); V, verification of discovery findings; vanco,
vancomycin; WT, wild-type. 1 Background strain NCTC8325
2 Values were used as provided by Gene Expression Omnibus 3 HG001 is a derivative (a rsbU+ variant) of strain NCTC 832577

92
4 Samples were z-scored across all samples for normalization
5 Example log by treatment as provided by Gene Expression Omnibus: log2(T8 treated/PA treated), log2(T8 untreated/PA
untreated). Example re-log by strain as used in this study: log2(T8 treated/T8 untreated), log2(PA treated/PA untreated). 6 60min samples were used 7 Samples grown to exponential phase in tryptic soy broth were used for this study 8 Same 15 untreated samples used
93
To identify molecular changes associated with antibiotic resistance I searched the
GEO repository236,237 on June 17 and December 29, 2019. From this I found nine datasets
for use in my study (Table 13). I began by exploring mutation-driven resistance as
produced by known or established vraSR or graSR mutations using three datasets
(GSE46887101 GSE50842129, and GSE2601676) that compared gene expression between
resistant (higher vraSR or graSR function) and sensitive (lower vraSR or graSR function)
strains under the same treatment conditions. GEO provided expression data for
GSE46887 and GSE50842 samples as log10 ratios of resistant strains to either a genomic
DNA pool or sensitive strains, respectively, representing strain differences that reveal
resistance mechanisms in individual strains, so I converted these ratios to log2 ratios for
consistency across data used in this study. GEO provided expression data for GSE26016
as unlogged intensities so I z-scored across all samples so that all data is normalized prior
to use.
I then examined activity changes in S. aureus under antibiotic treatment
conditions (i.e., response). To do this, I first used four datasets (GSE26400, GSE26258,
GSE26282, and GSE26358) that examined gene expression between treated and
untreated samples of strains with varying resistance levels. GEO provided expression
data for these datasets as log2 ratios of high resistant to low resistant strains (e.g., T8
treated/PA treated, T8 untreated/PA untreated). Fortunately, GEO also provided unlogged
intensities for these datasets, so I used intensities to calculate log2 ratios of treated versus
untreated for each strain separately (e.g., T8 treated/T8 untreated, PA treated/PA
untreated), revealing response mechanisms for individual strains, for consistency across
data used in this study. Further, I used one dataset (GSE7004077) to explore antibiotic

94
response in a sensitive strain. For this dataset, GEO provided unlogged intensities so I
z-scored across all samples for normalization prior to use. For all datasets, if a locus tag
had multiple platform probes, I selected the probe with the highest coefficient of variation
to represent that locus tag to remove locus tag replicates in gene signatures. Individual
dataset overviews with experimental information including strain, platform, and media
and normalization details are provided in APPENDIX A.
3.4.2. Signature Definition and Generation
From the datasets found in GEO, I defined gene signatures (i.e., locus tag lists
ranked by differential gene expression as defined by appropriate statistic, Figure 9).
Probes for each platform are converted to locus tags (e.g., SAR1563) when necessary
using GEO provided platform annotation files. Justification for my use of locus tags is
found in APPENDIX B. If multiple probes have the same locus tag, I used the one with
the highest coefficient of variation across all dataset samples and remove locus tag
replicates in gene signatures. Using gene signatures individually, I defined pathway
signatures by comparing a gene signature to each one of 164 KEGG (version 87.0,
APPENDIX F)194,195 pathways using GSEA, javaGSEA Desktop Application version 3.0
from Broad Institute, to calculate NES from 1000 locus tag permutations by which I rank
the 164 pathways (Figure 9). Rationale for my use of KEGG is located in APPENDIX B.
I purposely selected only KEGG pathways with at least 10 locus tags, a requirement for
accurate GSEA calculations, gathered across any one of the 10 fully sequenced S. aureus
strains available with varying methicillin and vancomycin sensitivities used to design
platform probes for datasets used in this study: sensitive to methicillin and vancomycin
(MSSA476, NCTC8325), MRSA strains sensitive to vancomycin (COL, N315, MW2,

95
Newman, MRSA252, USA300_TCH1516, and USA300FPR3757), and MRSA/VISA
(Mu50), to maximize my approach’s detection potential.
3.4.3. Defining Pathway Panels
To detect pathway activity changes associated with antibiotic resistance, I defined
two vraS-driven resistance panels (Table 4) by selecting the 20 most up- and down-
regulated pathways (i.e., best NES) from the VC40vsmutS pathway signature. I used the
same selection process on the T8vsPA pathway signature to define two vancomycin
susceptibility panels (Table 8) to detect pathway activity changes associated with
vancomycin susceptibility.
3.4.4. Comparison Across Pathway Signatures
To verify the accuracy of pathway panel predictions, I first performed GSEA
between vraS-driven resistance panels and HG001vsSG511 and WTvsgraSR pathway
signatures. I repeated this process using vancomycin susceptibility panels and the
C1vsPA pathway signature. Random modelling is done by using 1000 randomly selected
pathway panels consisting of 20 pathways each selected from the 164 KEGG pathways
used to generate pathway signatures as queries for GSEA against HG001vsSG511,
WTvsgraSR, and C1vsPA as reference signatures, generating a null distribution of NES,
to which I compared achieved NES for each reference pathway signature and count the
number of equal or better NES to estimate significance (i.e., distribution p-value). I also
utilized ROC curve analysis197,238 for individual pathway panels via easyROC, version
1.3 to quantify the ability of each pathway panel to separate samples by resistance level
through AUROC curve calculation197,208,238,239.

96
To compare pathway signatures, I used vraS-driven resistance panels as query sets
for GSEA to individual antibiotic susceptibility (vancomycin: T8vsPA and C1vsPA;
oxacillin: 1422vs2798 and V3vs923; and linezolid: 3577vs378, 5612vs378, 6939vs378,
and 7210vs378) and response (HG001van, HG001fluc, and HG001line for vancomycin,
flucloxacillin, and linezolid, respectively) pathway signatures as references. Heat maps
were generated by GENE-E240.
3.4.5. Disk Diffusion Validation of Computational Predictions
To establish biological relevance of predictions made by my pathway signature approach,
I performed Kirby-Bauer disk diffusion tests to observe sensitivity changes between
vehicle (water) and amino acid (lysine, aspartate, or phenylalanine) treatment during
antibiotic exposure. I prepare amino acid (DL-Aspartic Acid, L-Lysine, or DL-
Phenylalanine powder acquired from Carolina #843600 resuspended in sterile water, then
filter sterilized) solutions and applied equal amounts of either sterile water or amino acid
solution (final concentration on plate at 20mg/mL) separately to a pre-manufactured tryptic
soy agar (TSA, Carolina #822022) plate. Next, I applied equal amounts of S. aureus
(Carolina # 155554A) from one of triplicate overnight TSB cultures to each plate (i.e.,
technical replicates) and allowed to dry before applying 30mcg (i.e., g) vancomycin
(Carolina #843600), 1mcg oxacillin (Carolina #806278), and 30g linezolid (Fisher
#BD231761) disks and incubated overnight at 37oC with standard atmospheric conditions.

97
CHAPTER 4
CONCLUSION
In prior chapters, I described S. aureus as a causative agent of potentially life-
threatening infections and discussed how modern medicine relies on antibiotic therapies,
like vancomycin, oxacillin, and linezolid, to cure S. aureus infections. I provided an
overview of the global antibiotic resistance problem menacing humanity, increasing
mortality from once curable infections. Unfortunately, gene level examination alone has
been only partially effective in identifying antibiotic resistance mechanisms, so I decided
to take a broader perspective by examining pathway activity. To do this, I discussed the
rationale and steps for a pathway signature approach that identified pathways with the
most differential activity from mRNA expression data and applied it to elucidate pathway
activity changes associated with mutation-driven resistance and vancomycin
susceptibility. I then compared pathway activity changes associated with mutation-driven
resistance to changes associated with vancomycin, oxacillin, or linezolid susceptibilities
and responses to identify top pathway candidates for further laboratory characterization. I
used this analysis to select lysine biosynthesis and demonstrated the biological relevance
of this prediction to improve antibiotic sensitivity using disk diffusion. In this chapter, I
summarized the importance and share future directions for my work.
This work was the first to use Gene Set Enrichment Analysis (GSEA), a well-
established computational tool that does not neglect genes with insignificant changes
when calculating enrichment, to examine antibiotic resistance in Staphylococcus aureus
(S. aureus). Further, I was the first to apply a new computational approach using GSEA
that defines and compares pathway signatures to detect activity changes associated with

98
antibiotic resistance that is immediately applicable to examine activity changes associated
with resistance in other bacterial pathogens. This has the potential of providing valuable
computational predictions to expedite the development of co-therapy options to overcome
or preclude antibiotic resistance. By applying my pathway signature approach to multiple
resistance studies across different antibiotic classes to identify pathways affecting
development of antibiotic resistance, I established a precedence for this type of analysis
in the field of microbiology. I am already applying my pathway signature approach to
identify potential co-therapeutic targets associated with antibiotic resistance in several
other pathogens, such as Pseudomonas aeruginosa, Escherichia coli, and Streptococcal
species. My innovative computational approach can also be applied to other microbial
questions outside of antibiotic resistance that require combining mRNA expression and
biological pathway activity analyses. For example, I am starting to apply my approach to
analyze mRNA expression differences between bacterial strains in cow lumen to identify
pathway targets to reduce methane production, a known greenhouse gas and climate
change contributor. Finally, my computational approach uncovered several top pathway
candidates as potential co-therapeutic targets, such as lysine biosynthesis, to overcome
antibiotic resistance in S. aureus. I successfully verified the biological relevance for
lysine biosynthesis experimentally. With more experimental work, co-therapies targeting
lysine biosynthesis and/or other top pathway candidates identified here can be developed
and have the potential to save thousands of lives from antibiotic resistant infections.
When the gravity of the potential of my results in S. aureus presented here is
compounded by the breath of microbial work using my approach currently ongoing and
proposed for the future, the impact of this dissertation work is truly exciting.

99
REFERENCES
1. Govindarajan R, Duraiyan J, Kaliyappan K, Palanisamy M. Microarray and its applications. J Pharm Bioallied Sci. 2012;4(Suppl 2):S310-312.
2. Jaksik R, Iwanaszko M, Rzeszowska-Wolny J, Kimmel M. Microarray experiments and factors which affect their reliability. Biol Direct. 2015;10:46.
3. Madigan MT, Bender KS, Buckley DH, Sattley WM, Stahl DA. Brock biology of microorganisms. Fifteenth edition. ed. Ny, Ny: Pearson; 2018.
4. Sender R, Fuchs S, Milo R. Are We Really Vastly Outnumbered? Revisiting the Ratio of Bacterial to Host Cells in Humans. Cell. 2016;164(3):337-340.
5. Thorpe KE, Joski P, Johnston KJ. Antibiotic-Resistant Infection Treatment Costs Have Doubled Since 2002, Now Exceeding $2 Billion Annually. Health Aff (Millwood). 2018;37(4):662-669.
6. Health NIo. Understanding emerging and re-emerging infectious diseases. Biological sciences curriculum study NIH Curriculum Supplement Series National Institutes of Health, Bethesda, MD. 2007.
7. Price LB, Hungate BA, Koch BJ, Davis GS, Liu CM. Colonizing opportunistic pathogens (COPs): The beasts in all of us. PLoS Pathog. 2017;13(8):e1006369.
8. Woolhouse M, Waugh C, Perry MR, Nair H. Global disease burden due to antibiotic resistance - state of the evidence. J Glob Health. 2016;6(1):010306.
9. Nathan C, Cars O. Antibiotic resistance--problems, progress, and prospects. N Engl J Med. 2014;371(19):1761-1763.
10. Chiavazzo E, Isaia M, Mammola S, et al. Cave spiders choose optimal environmental factors with respect to the generated entropy when laying their cocoon. Sci Rep. 2015;5:7611.
11. Ventola CL. The antibiotic resistance crisis: part 1: causes and threats. P T. 2015;40(4):277-283.
12. Van Boeckel TP, Gandra S, Ashok A, et al. Global antibiotic consumption 2000 to 2010: an analysis of national pharmaceutical sales data. Lancet Infect Dis. 2014;14(8):742-750.
13. Kapoor G, Saigal S, Elongavan A. Action and resistance mechanisms of antibiotics: A guide for clinicians. J Anaesthesiol Clin Pharmacol. 2017;33(3):300-305.
14. Pantosti A, Sanchini A, Monaco M. Mechanisms of antibiotic resistance in Staphylococcus aureus. Future Microbiol. 2007;2(3):323-334.
15. Velkov T, Roberts KD, Nation RL, Thompson PE, Li J. Pharmacology of polymyxins: new insights into an 'old' class of antibiotics. Future Microbiol. 2013;8(6):711-724.
16. Rossolini GM, Arena F, Pecile P, Pollini S. Update on the antibiotic resistance crisis. Curr Opin Pharmacol. 2014;18:56-60.
17. Woolhouse M, Farrar J. Policy: An intergovernmental panel on antimicrobial resistance. Nature. 2014;509(7502):555-557.
18. Laxminarayan R, Matsoso P, Pant S, et al. Access to effective antimicrobials: a worldwide challenge. Lancet. 2016;387(10014):168-175.
19. Munita JM, Arias CA. Mechanisms of Antibiotic Resistance. Microbiol Spectr. 2016;4(2). 20. Golkar Z, Bagasra O, Pace DG. Bacteriophage therapy: a potential solution for the
antibiotic resistance crisis. J Infect Dev Ctries. 2014;8(2):129-136. 21. Peacock SJ, Paterson GK. Mechanisms of Methicillin Resistance in Staphylococcus aureus.
Annu Rev Biochem. 2015;84:577-601.

100
22. Grundmann H, Aires-de-Sousa M, Boyce J, Tiemersma E. Emergence and resurgence of meticillin-resistant Staphylococcus aureus as a public-health threat. Lancet. 2006;368(9538):874-885.
23. de Kraker ME, Stewardson AJ, Harbarth S. Will 10 Million People Die a Year due to Antimicrobial Resistance by 2050? PLoS Med. 2016;13(11):e1002184.
24. Ippolito G, Leone S, Lauria FN, Nicastri E, Wenzel RP. Methicillin-resistant Staphylococcus aureus: the superbug. Int J Infect Dis. 2010;14 Suppl 4:S7-11.
25. Cosgrove SE, Qi Y, Kaye KS, Harbarth S, Karchmer AW, Carmeli Y. The impact of methicillin resistance in Staphylococcus aureus bacteremia on patient outcomes: mortality, length of stay, and hospital charges. Infect Control Hosp Epidemiol. 2005;26(2):166-174.
26. Bartlett JG, Gilbert DN, Spellberg B. Seven ways to preserve the miracle of antibiotics. Clin Infect Dis. 2013;56(10):1445-1450.
27. Gould IM, Reilly J, Bunyan D, Walker A. Costs of healthcare-associated methicillin-resistant Staphylococcus aureus and its control. Clin Microbiol Infect. 2010;16(12):1721-1728.
28. Gould IM. Costs of hospital-acquired methicillin-resistant Staphylococcus aureus (MRSA) and its control. Int J Antimicrob Agents. 2006;28(5):379-384.
29. Kopp BJ, Nix DE, Armstrong EP. Clinical and economic analysis of methicillin-susceptible and -resistant Staphylococcus aureus infections. Ann Pharmacother. 2004;38(9):1377-1382.
30. Holden MT, Feil EJ, Lindsay JA, et al. Complete genomes of two clinical Staphylococcus aureus strains: evidence for the rapid evolution of virulence and drug resistance. Proc Natl Acad Sci U S A. 2004;101(26):9786-9791.
31. Jensen SO, Lyon BR. Genetics of antimicrobial resistance in Staphylococcus aureus. Future Microbiol. 2009;4(5):565-582.
32. Skinner D, Keefer CS. Significance of bacteremia caused by staphylococcus aureus: A study of one hundred and twenty-two cases and a review of the literature concerned with experimental infection in animals. Archives of Internal Medicine. 1941;68(5):851-875.
33. Charles HR, Thelma M. Resistance of Staphylococcus aureus to the Action of Penicillin. Proceedings of the Society for Experimental Biology and Medicine. 1942;51(3):386-389.
34. Jevons MP. “Celbenin” - resistant Staphylococci. British Medical Journal. 1961;1(5219):124-125.
35. del Rio A, Cervera C, Moreno A, Moreillon P, Miro JM. Patients at risk of complications of Staphylococcus aureus bloodstream infection. Clin Infect Dis. 2009;48 Suppl 4:S246-253.
36. Fluit AC, Jones ME, Schmitz FJ, Acar J, Gupta R, Verhoef J. Antimicrobial susceptibility and frequency of occurrence of clinical blood isolates in Europe from the SENTRY antimicrobial surveillance program, 1997 and 1998. Clin Infect Dis. 2000;30(3):454-460.
37. Brisse S, Milatovic D, Fluit AC, et al. Molecular surveillance of European quinolone-resistant clinical isolates of Pseudomonas aeruginosa and Acinetobacter spp. using automated ribotyping. J Clin Microbiol. 2000;38(10):3636-3645.
38. Dantes R, Mu Y, Belflower R, et al. National burden of invasive methicillin-resistant Staphylococcus aureus infections, United States, 2011. JAMA Intern Med. 2013;173(21):1970-1978.
39. Rodvold KA, McConeghy KW. Methicillin-resistant Staphylococcus aureus therapy: past, present, and future. Clin Infect Dis. 2014;58 Suppl 1:S20-27.
40. Stryjewski ME, Corey GR. Methicillin-resistant Staphylococcus aureus: an evolving pathogen. Clin Infect Dis. 2014;58 Suppl 1:S10-19.

101
41. Livermore DM. Has the era of untreatable infections arrived? J Antimicrob Chemother. 2009;64 Suppl 1:i29-36.
42. Laxminarayan R, Bhutta ZA. Antimicrobial resistance-a threat to neonate survival. Lancet Glob Health. 2016;4(10):e676-677.
43. Chen L, Todd R, Kiehlbauch J, Walters M, Kallen A. Notes from the Field: Pan-Resistant New Delhi Metallo-Beta-Lactamase-Producing Klebsiella pneumoniae-Washoe County, Nevada, 2016. MMWR Morbidity and mortality weekly report. 2017;66(1):33-33.
44. Petchiappan A, Chatterji D. Antibiotic Resistance: Current Perspectives. ACS Omega. 2017;2(10):7400-7409.
45. Gardete S, Tomasz A. Mechanisms of vancomycin resistance in Staphylococcus aureus. J Clin Invest. 2014;124(7):2836-2840.
46. Dinesh N, Sharma S, Balganesh M. Involvement of efflux pumps in the resistance to peptidoglycan synthesis inhibitors in Mycobacterium tuberculosis. Antimicrob Agents Chemother. 2013;57(4):1941-1943.
47. Chopra I, Roberts M. Tetracycline antibiotics: mode of action, applications, molecular biology, and epidemiology of bacterial resistance. Microbiol Mol Biol Rev. 2001;65(2):232-260 ; second page, table of contents.
48. Hooper DC, Jacoby GA. Mechanisms of drug resistance: quinolone resistance. Ann N Y Acad Sci. 2015;1354:12-31.
49. Floyd JL, Smith KP, Kumar SH, Floyd JT, Varela MF. LmrS is a multidrug efflux pump of the major facilitator superfamily from Staphylococcus aureus. Antimicrob Agents Chemother. 2010;54(12):5406-5412.
50. Schumacher A, Trittler R, Bohnert JA, Kummerer K, Pages JM, Kern WV. Intracellular accumulation of linezolid in Escherichia coli, Citrobacter freundii and Enterobacter aerogenes: role of enhanced efflux pump activity and inactivation. J Antimicrob Chemother. 2007;59(6):1261-1264.
51. Nikaido H. Multidrug resistance in bacteria. Annu Rev Biochem. 2009;78:119-146. 52. Quiles-Melero I, Gomez-Gil R, Romero-Gomez MP, et al. Mechanisms of linezolid
resistance among Staphylococci in a tertiary hospital. J Clin Microbiol. 2013;51(3):998-1001.
53. Tran TT, Munita JM, Arias CA. Mechanisms of drug resistance: daptomycin resistance. Ann N Y Acad Sci. 2015;1354:32-53.
54. Foster TJ. Antibiotic resistance in Staphylococcus aureus. Current status and future prospects. FEMS Microbiol Rev. 2017;41(3):430-449.
55. Bosi E, Monk JM, Aziz RK, Fondi M, Nizet V, Palsson BO. Comparative genome-scale modelling of Staphylococcus aureus strains identifies strain-specific metabolic capabilities linked to pathogenicity. Proc Natl Acad Sci U S A. 2016;113(26):E3801-3809.
56. McGuinness WA, Malachowa N, DeLeo FR. Vancomycin Resistance in Staphylococcus aureus. Yale J Biol Med. 2017;90(2):269-281.
57. Stinear TP, Holt KE, Chua K, et al. Adaptive change inferred from genomic population analysis of the ST93 epidemic clone of community-associated methicillin-resistant Staphylococcus aureus. Genome Biol Evol. 2014;6(2):366-378.
58. Hiramatsu K, Katayama Y, Matsuo M, et al. Multi-drug-resistant Staphylococcus aureus and future chemotherapy. J Infect Chemother. 2014;20(10):593-601.
59. Gardner SG, Marshall DD, Daum RS, Powers R, Somerville GA. Metabolic Mitigation of Staphylococcus aureus Vancomycin Intermediate-Level Susceptibility. Antimicrob Agents Chemother. 2018;62(1).

102
60. Peng B, Su YB, Li H, et al. Exogenous alanine and/or glucose plus kanamycin kills antibiotic-resistant bacteria. Cell Metab. 2015;21(2):249-262.
61. Su YB, Peng B, Li H, et al. Pyruvate cycle increases aminoglycoside efficacy and provides respiratory energy in bacteria. Proc Natl Acad Sci U S A. 2018;115(7):E1578-E1587.
62. Vilcheze C, Hartman T, Weinrick B, et al. Enhanced respiration prevents drug tolerance and drug resistance in Mycobacterium tuberculosis. Proc Natl Acad Sci U S A. 2017;114(17):4495-4500.
63. Wadi L, Meyer M, Weiser J, Stein LD, Reimand J. Impact of outdated gene annotations on pathway enrichment analysis. Nat Methods. 2016;13(9):705-706.
64. Khatri P, Sirota M, Butte AJ. Ten years of pathway analysis: current approaches and outstanding challenges. PLoS Comput Biol. 2012;8(2):e1002375.
65. de Leeuw CA, Neale BM, Heskes T, Posthuma D. The statistical properties of gene-set analysis. Nat Rev Genet. 2016;17(6):353-364.
66. Goad B, Harris LK. Identification and prioritization of macrolide resistance genes with hypothetical annotation in Streptococcus pneumoniae. Bioinformation. 2018;14(9):488-498.
67. Subramanian A, Tamayo P, Mootha VK, et al. Gene set enrichment analysis: a knowledge-based approach for interpreting genome-wide expression profiles. Proc Natl Acad Sci U S A. 2005;102(43):15545-15550.
68. Tintle NL, Sitarik A, Boerema B, Young K, Best AA, Dejongh M. Evaluating the consistency of gene sets used in the analysis of bacterial gene expression data. BMC Bioinformatics. 2012;13:193.
69. Tintle NL, Best AA, DeJongh M, et al. Gene set analyses for interpreting microarray experiments on prokaryotic organisms. BMC Bioinformatics. 2008;9:469.
70. Michael CA, Dominey-Howes D, Labbate M. The antimicrobial resistance crisis: causes, consequences, and management. Front Public Health. 2014;2:145.
71. Taglialegna A, Varela MC, Rosato RR, Rosato AE. VraSR and Virulence Trait Modulation during Daptomycin Resistance in Methicillin-Resistant Staphylococcus aureus Infection. mSphere. 2019;4(1).
72. Mehta S, Cuirolo AX, Plata KB, et al. VraSR two-component regulatory system contributes to mprF-mediated decreased susceptibility to daptomycin in in vivo-selected clinical strains of methicillin-resistant Staphylococcus aureus. Antimicrob Agents Chemother. 2012;56(1):92-102.
73. Kuroda M, Kuroda H, Oshima T, Takeuchi F, Mori H, Hiramatsu K. Two-component system VraSR positively modulates the regulation of cell-wall biosynthesis pathway in Staphylococcus aureus. Mol Microbiol. 2003;49(3):807-821.
74. Gardete S, Wu SW, Gill S, Tomasz A. Role of VraSR in antibiotic resistance and antibiotic-induced stress response in Staphylococcus aureus. Antimicrob Agents Chemother. 2006;50(10):3424-3434.
75. Boyle-Vavra S, Yin S, Jo DS, Montgomery CP, Daum RS. VraT/YvqF is required for methicillin resistance and activation of the VraSR regulon in Staphylococcus aureus. Antimicrob Agents Chemother. 2013;57(1):83-95.
76. Falord M, Mader U, Hiron A, Debarbouille M, Msadek T. Investigation of the Staphylococcus aureus GraSR regulon reveals novel links to virulence, stress response and cell wall signal transduction pathways. PLoS One. 2011;6(7):e21323.
77. Mader U, Nicolas P, Depke M, et al. Staphylococcus aureus Transcriptome Architecture: From Laboratory to Infection-Mimicking Conditions. PLoS Genet. 2016;12(4):e1005962.

103
78. Blaskovich MAT, Hansford KA, Butler MS, Jia Z, Mark AE, Cooper MA. Developments in Glycopeptide Antibiotics. ACS Infect Dis. 2018;4(5):715-735.
79. Limbago BM, Kallen AJ, Zhu W, Eggers P, McDougal LK, Albrecht VS. Report of the 13th vancomycin-resistant Staphylococcus aureus isolate from the United States. J Clin Microbiol. 2014;52(3):998-1002.
80. Walters MS, Eggers P, Albrecht V, et al. Vancomycin-Resistant Staphylococcus aureus-Delaware, 2015. MMWR Morbidity and mortality weekly report. 2015;64(37):1056-1056.
81. Perichon B, Courvalin P. VanA-type vancomycin-resistant Staphylococcus aureus. Antimicrob Agents Chemother. 2009;53(11):4580-4587.
82. Capriotti T. Resistant 'superbugs' create need for novel antibiotics. Dermatol Nurs. 2007;19(1):65-70.
83. Nikolaidis I, Favini-Stabile S, Dessen A. Resistance to antibiotics targeted to the bacterial cell wall. Protein Sci. 2014;23(3):243-259.
84. Baltz RH. Daptomycin: mechanisms of action and resistance, and biosynthetic engineering. Curr Opin Chem Biol. 2009;13(2):144-151.
85. Taylor SD, Palmer M. The action mechanism of daptomycin. Bioorg Med Chem. 2016;24(24):6253-6268.
86. Miller WR, Bayer AS, Arias CA. Mechanism of Action and Resistance to Daptomycin in Staphylococcus aureus and Enterococci. Cold Spring Harb Perspect Med. 2016;6(11).
87. Tian Y, Li T, Zhu Y, Wang B, Zou X, Li M. Mechanisms of linezolid resistance in staphylococci and enterococci isolated from two teaching hospitals in Shanghai, China. BMC Microbiol. 2014;14:292.
88. Swaney SM, Aoki H, Ganoza MC, Shinabarger DL. The oxazolidinone linezolid inhibits initiation of protein synthesis in bacteria. Antimicrob Agents Chemother. 1998;42(12):3251-3255.
89. Lambert T. Antibiotics that affect the ribosome. Rev Sci Tech. 2012;31(1):57-64. 90. Thati V, Shivannavar CT, Gaddad SM. Vancomycin resistance among methicillin resistant
Staphylococcus aureus isolates from intensive care units of tertiary care hospitals in Hyderabad. Indian J Med Res. 2011;134(5):704-708.
91. Walters MS, Eggers P, Albrecht V, et al. Vancomycin-Resistant Staphylococcus aureus - Delaware, 2015. MMWR Morb Mortal Wkly Rep. 2015;64(37):1056.
92. Weigelt JA. MRSA, Second Edition. CRC Press; 2016. 93. Nelson JL, Rice KC, Slater SR, et al. Vancomycin-intermediate Staphylococcus aureus
strains have impaired acetate catabolism: implications for polysaccharide intercellular adhesin synthesis and autolysis. Antimicrob Agents Chemother. 2007;51(2):616-622.
94. Cui L, Ma X, Sato K, et al. Cell wall thickening is a common feature of vancomycin resistance in Staphylococcus aureus. J Clin Microbiol. 2003;41(1):5-14.
95. Sieradzki K, Tomasz A. Inhibition of cell wall turnover and autolysis by vancomycin in a highly vancomycin-resistant mutant of Staphylococcus aureus. J Bacteriol. 1997;179(8):2557-2566.
96. Lowy FD. Antimicrobial resistance: the example of Staphylococcus aureus. J Clin Invest. 2003;111(9):1265-1273.
97. Cui L, Iwamoto A, Lian JQ, et al. Novel mechanism of antibiotic resistance originating in vancomycin-intermediate Staphylococcus aureus. Antimicrob Agents Chemother. 2006;50(2):428-438.
98. Kim W, Hendricks GL, Tori K, Fuchs BB, Mylonakis E. Strategies against methicillin-resistant Staphylococcus aureus persisters. Future Med Chem. 2018;10(7):779-794.

104
99. Howden BP, Davies JK, Johnson PD, Stinear TP, Grayson ML. Reduced vancomycin susceptibility in Staphylococcus aureus, including vancomycin-intermediate and heterogeneous vancomycin-intermediate strains: resistance mechanisms, laboratory detection, and clinical implications. Clin Microbiol Rev. 2010;23(1):99-139.
100. Bonev BB, Brown NM. Bacterial Resistance to Antibiotics: From Molecules to Man. Wiley; 2019.
101. Berscheid A, Francois P, Strittmatter A, et al. Generation of a vancomycin-intermediate Staphylococcus aureus (VISA) strain by two amino acid exchanges in VraS. J Antimicrob Chemother. 2014;69(12):3190-3198.
102. Meehl M, Herbert S, Gotz F, Cheung A. Interaction of the GraRS two-component system with the VraFG ABC transporter to support vancomycin-intermediate resistance in Staphylococcus aureus. Antimicrob Agents Chemother. 2007;51(8):2679-2689.
103. Crossley KB, Jefferson KK, Archer GL, Fowler VG. Staphylococci in human disease. John Wiley & Sons; 2009.
104. Chen FJ, Lauderdale TL, Lee CH, et al. Effect of a Point Mutation in mprF on Susceptibility to Daptomycin, Vancomycin, and Oxacillin in an MRSA Clinical Strain. Front Microbiol. 2018;9:1086.
105. Howden BP, Stinear TP, Allen DL, Johnson PD, Ward PB, Davies JK. Genomic analysis reveals a point mutation in the two-component sensor gene graS that leads to intermediate vancomycin resistance in clinical Staphylococcus aureus. Antimicrob Agents Chemother. 2008;52(10):3755-3762.
106. McAleese F, Wu SW, Sieradzki K, et al. Overexpression of genes of the cell wall stimulon in clinical isolates of Staphylococcus aureus exhibiting vancomycin-intermediate- S. aureus-type resistance to vancomycin. J Bacteriol. 2006;188(3):1120-1133.
107. Alexander EL, Gardete S, Bar HY, Wells MT, Tomasz A, Rhee KY. Intermediate-type vancomycin resistance (VISA) in genetically-distinct Staphylococcus aureus isolates is linked to specific, reversible metabolic alterations. PLoS One. 2014;9(5):e97137.
108. Chen CJ, Lin MH, Shu JC, Lu JJ. Reduced susceptibility to vancomycin in isogenic Staphylococcus aureus strains of sequence type 59: tracking evolution and identifying mutations by whole-genome sequencing. J Antimicrob Chemother. 2014;69(2):349-354.
109. Mwangi MM, Wu SW, Zhou Y, et al. Tracking the in vivo evolution of multidrug resistance in Staphylococcus aureus by whole-genome sequencing. Proc Natl Acad Sci U S A. 2007;104(22):9451-9456.
110. Cui L, Isii T, Fukuda M, et al. An RpoB mutation confers dual heteroresistance to daptomycin and vancomycin in Staphylococcus aureus. Antimicrob Agents Chemother. 2010;54(12):5222-5233.
111. Matsuo M, Hishinuma T, Katayama Y, Cui L, Kapi M, Hiramatsu K. Mutation of RNA polymerase beta subunit (rpoB) promotes hVISA-to-VISA phenotypic conversion of strain Mu3. Antimicrob Agents Chemother. 2011;55(9):4188-4195.
112. Watanabe Y, Cui L, Katayama Y, Kozue K, Hiramatsu K. Impact of rpoB mutations on reduced vancomycin susceptibility in Staphylococcus aureus. J Clin Microbiol. 2011;49(7):2680-2684.
113. Herbert S, Bera A, Nerz C, et al. Molecular basis of resistance to muramidase and cationic antimicrobial peptide activity of lysozyme in staphylococci. PLoS Pathog. 2007;3(7):e102.
114. Draper LA, Cotter PD, Hill C, Ross RP. Lantibiotic resistance. Microbiol Mol Biol Rev. 2015;79(2):171-191.

105
115. Sabat AJ, Tinelli M, Grundmann H, et al. Daptomycin Resistant Staphylococcus aureus Clinical Strain With Novel Non-synonymous Mutations in the mprF and vraS Genes: A New Insight Into Daptomycin Resistance. Front Microbiol. 2018;9:2705.
116. Barros EM, Martin MJ, Selleck EM, Lebreton F, Sampaio JLM, Gilmore MS. Daptomycin Resistance and Tolerance Due to Loss of Function in Staphylococcus aureus dsp1 and asp23. Antimicrob Agents Chemother. 2019;63(1).
117. Vestergaard M, Nohr-Meldgaard K, Bojer MS, et al. Inhibition of the ATP Synthase Eliminates the Intrinsic Resistance of Staphylococcus aureus towards Polymyxins. mBio. 2017;8(5).
118. Pogue JM, Ortwine JK, Kaye KS. Clinical considerations for optimal use of the polymyxins: A focus on agent selection and dosing. Clin Microbiol Infect. 2017;23(4):229-233.
119. Falagas ME, Kasiakou SK. Toxicity of polymyxins: a systematic review of the evidence from old and recent studies. Crit Care. 2006;10(1):R27.
120. Trimble MJ, Mlynarcik P, Kolar M, Hancock RE. Polymyxin: Alternative Mechanisms of Action and Resistance. Cold Spring Harb Perspect Med. 2016;6(10).
121. de Almeida LM, de Araujo MR, Sacramento AG, et al. Linezolid resistance in Brazilian Staphylococcus hominis strains is associated with L3 and 23S rRNA ribosomal mutations. Antimicrob Agents Chemother. 2013;57(8):4082-4083.
122. Locke JB, Hilgers M, Shaw KJ. Mutations in ribosomal protein L3 are associated with oxazolidinone resistance in staphylococci of clinical origin. Antimicrob Agents Chemother. 2009;53(12):5275-5278.
123. Locke JB, Hilgers M, Shaw KJ. Novel ribosomal mutations in Staphylococcus aureus strains identified through selection with the oxazolidinones linezolid and torezolid (TR-700). Antimicrob Agents Chemother. 2009;53(12):5265-5274.
124. Marshall SH, Donskey CJ, Hutton-Thomas R, Salata RA, Rice LB. Gene dosage and linezolid resistance in Enterococcus faecium and Enterococcus faecalis. Antimicrob Agents Chemother. 2002;46(10):3334-3336.
125. Besier S, Ludwig A, Zander J, Brade V, Wichelhaus TA. Linezolid resistance in Staphylococcus aureus: gene dosage effect, stability, fitness costs, and cross-resistances. Antimicrob Agents Chemother. 2008;52(4):1570-1572.
126. Kehrenberg C, Schwarz S, Jacobsen L, Hansen LH, Vester B. A new mechanism for chloramphenicol, florfenicol and clindamycin resistance: methylation of 23S ribosomal RNA at A2503. Mol Microbiol. 2005;57(4):1064-1073.
127. Long KS, Poehlsgaard J, Kehrenberg C, Schwarz S, Vester B. The Cfr rRNA methyltransferase confers resistance to Phenicols, Lincosamides, Oxazolidinones, Pleuromutilins, and Streptogramin A antibiotics. Antimicrob Agents Chemother. 2006;50(7):2500-2505.
128. Costa SS, Viveiros M, Amaral L, Couto I. Multidrug Efflux Pumps in Staphylococcus aureus: an Update. Open Microbiol J. 2013;7:59-71.
129. Muller A, Grein F, Otto A, et al. Differential daptomycin resistance development in Staphylococcus aureus strains with active and mutated gra regulatory systems. Int J Med Microbiol. 2018;308(3):335-348.
130. Bratlie MS, Johansen J, Drablos F. Relationship between operon preference and functional properties of persistent genes in bacterial genomes. BMC Genomics. 2010;11:71.
131. Du W, Cao Z, Wang Y, Blanzieri E, Zhang C, Liang Y. Operon prediction by Markov clustering. Int J Data Min Bioinform. 2014;9(4):424-443.

106
132. Subramanian D, Natarajan J. RNA-seq analysis reveals resistome genes and signalling pathway associated with vancomycin-intermediate Staphylococcus aureus. Indian J Med Microbiol. 2019;37(2):173-185.
133. Choe D, Szubin R, Dahesh S, et al. Genome-scale analysis of Methicillin-resistant Staphylococcus aureus USA300 reveals a tradeoff between pathogenesis and drug resistance. Sci Rep. 2018;8(1):2215.
134. Liu J, Yang L, Hou Y, et al. Transcriptomics Study on Staphylococcus aureus Biofilm Under Low Concentration of Ampicillin. Front Microbiol. 2018;9:2413.
135. Wu S, Liu Y, Zhang H, Lei L. The Pathogenicity and Transcriptome Analysis of Methicillin-Resistant Staphylococcus aureus in Response to Water Extract of Galla chinensis. Evid Based Complement Alternat Med. 2019;2019:3276156.
136. Hua R, Xia Y, Wu W, Yan J, Yang M. Whole transcriptome analysis reveals potential novel mechanisms of low-level linezolid resistance in Enterococcus faecalis. Gene. 2018;647:143-149.
137. Goad B, Harris LK. Identification and prioritization of macrolideresistance genes with hypothetical annotation inStreptococcus pneumoniae. Bioinformation. 2018;14(9):488-498.
138. Mootha VK, Lindgren CM, Eriksson KF, et al. PGC-1alpha-responsive genes involved in oxidative phosphorylation are coordinately downregulated in human diabetes. Nat Genet. 2003;34(3):267-273.
139. Mitrofanova A, Aytes A, Zou M, Shen MM, Abate-Shen C, Califano A. Predicting Drug Response in Human Prostate Cancer from Preclinical Analysis of In Vivo Mouse Models. Cell Rep. 2015;12(12):2060-2071.
140. Zhang W, Zeng Z, Zhou Y, et al. Identification of aberrant cell cycle regulation in Epstein-Barr virus-associated nasopharyngeal carcinoma by cDNA microarray and gene set enrichment analysis. Acta Biochim Biophys Sin (Shanghai). 2009;41(5):414-428.
141. Kato H, Karube K, Yamamoto K, et al. Gene expression profiling of Epstein-Barr virus-positive diffuse large B-cell lymphoma of the elderly reveals alterations of characteristic oncogenetic pathways. Cancer Sci. 2014;105(5):537-544.
142. Khatri P, Draghici S. Ontological analysis of gene expression data: current tools, limitations, and open problems. Bioinformatics. 2005;21(18):3587-3595.
143. Man MZ, Wang X, Wang Y. POWER_SAGE: comparing statistical tests for SAGE experiments. Bioinformatics. 2000;16(11):953-959.
144. Irizarry RA, Wang C, Zhou Y, Speed TP. Gene set enrichment analysis made simple. Stat Methods Med Res. 2009;18(6):565-575.
145. Schwartz JM, Gaugain C, Nacher JC, de Daruvar A, Kanehisa M. Observing metabolic functions at the genome scale. Genome Biol. 2007;8(6):R123.
146. Efron B, Tibshirani R. On testing the significance of sets of genes. Ann Appl Stat. 2007;1(1):107-129.
147. Dinu I, Potter JD, Mueller T, et al. Improving gene set analysis of microarray data by SAM-GS. BMC Bioinformatics. 2007;8:242.
148. Yoon S, Kim SY, Nam D. Improving Gene-Set Enrichment Analysis of RNA-Seq Data with Small Replicates. PLoS One. 2016;11(11):e0165919.
149. Yan X, Sun F. Testing gene set enrichment for subset of genes: Sub-GSE. BMC Bioinformatics. 2008;9:362.
150. Kim HY. Statistical notes for clinical researchers: Chi-squared test and Fisher's exact test. Restor Dent Endod. 2017;42(2):152-155.

107
151. Abatangelo L, Maglietta R, Distaso A, et al. Comparative study of gene set enrichment methods. BMC Bioinformatics. 2009;10:275.
152. Liberzon A, Subramanian A, Pinchback R, Thorvaldsdottir H, Tamayo P, Mesirov JP. Molecular signatures database (MSigDB) 3.0. Bioinformatics. 2011;27(12):1739-1740.
153. Liberzon A, Birger C, Thorvaldsdottir H, Ghandi M, Mesirov JP, Tamayo P. The Molecular Signatures Database (MSigDB) hallmark gene set collection. Cell Syst. 2015;1(6):417-425.
154. Liberzon A. A description of the Molecular Signatures Database (MSigDB) Web site. Methods Mol Biol. 2014;1150:153-160.
155. Fabregat A, Jupe S, Matthews L, et al. The Reactome Pathway Knowledgebase. Nucleic Acids Res. 2018;46(D1):D649-D655.
156. Croft D, Mundo AF, Haw R, et al. The Reactome pathway knowledgebase. Nucleic Acids Res. 2014;42(Database issue):D472-477.
157. The Gene Ontology C. Expansion of the Gene Ontology knowledgebase and resources. Nucleic Acids Res. 2017;45(D1):D331-D338.
158. Ashburner M, Ball CA, Blake JA, et al. Gene ontology: tool for the unification of biology. The Gene Ontology Consortium. Nat Genet. 2000;25(1):25-29.
159. Zhulin IB. Databases for Microbiologists. J Bacteriol. 2015;197(15):2458-2467. 160. Mi H, Huang X, Muruganujan A, et al. PANTHER version 11: expanded annotation data
from Gene Ontology and Reactome pathways, and data analysis tool enhancements. Nucleic Acids Res. 2017;45(D1):D183-D189.
161. Altman T, Travers M, Kothari A, Caspi R, Karp PD. A systematic comparison of the MetaCyc and KEGG pathway databases. BMC Bioinformatics. 2013;14:112.
162. Kanehisa M, Sato Y, Kawashima M, Furumichi M, Tanabe M. KEGG as a reference resource for gene and protein annotation. Nucleic Acids Res. 2016;44(D1):D457-462.
163. Kanehisa M, Goto S, Sato Y, Furumichi M, Tanabe M. KEGG for integration and interpretation of large-scale molecular data sets. Nucleic Acids Res. 2012;40(Database issue):D109-114.
164. Kanehisa M, Araki M, Goto S, et al. KEGG for linking genomes to life and the environment. Nucleic Acids Res. 2008;36(Database issue):D480-484.
165. Huang da W, Sherman BT, Lempicki RA. Bioinformatics enrichment tools: paths toward the comprehensive functional analysis of large gene lists. Nucleic Acids Res. 2009;37(1):1-13.
166. Huang da W, Sherman BT, Lempicki RA. Systematic and integrative analysis of large gene lists using DAVID bioinformatics resources. Nat Protoc. 2009;4(1):44-57.
167. Overbeek R, Begley T, Butler RM, et al. The subsystems approach to genome annotation and its use in the project to annotate 1000 genomes. Nucleic Acids Res. 2005;33(17):5691-5702.
168. Gillespie JJ, Wattam AR, Cammer SA, et al. PATRIC: the comprehensive bacterial bioinformatics resource with a focus on human pathogenic species. Infect Immun. 2011;79(11):4286-4298.
169. Overbeek R, Olson R, Pusch GD, et al. The SEED and the Rapid Annotation of microbial genomes using Subsystems Technology (RAST). Nucleic Acids Res. 2014;42(Database issue):D206-214.
170. Greene JM, Collins F, Lefkowitz EJ, et al. National Institute of Allergy and Infectious Diseases bioinformatics resource centers: new assets for pathogen informatics. Infect Immun. 2007;75(7):3212-3219.

108
171. Kuroda M, Ohta T, Uchiyama I, et al. Whole genome sequencing of meticillin-resistant Staphylococcus aureus. Lancet. 2001;357(9264):1225-1240.
172. Munita JM, Bayer AS, Arias CA. Evolving resistance among Gram-positive pathogens. Clin Infect Dis. 2015;61 Suppl 2:S48-57.
173. Loomba PS, Taneja J, Mishra B. Methicillin and Vancomycin Resistant S. aureus in Hospitalized Patients. J Glob Infect Dis. 2010;2(3):275-283.
174. Rasmussen RV, Fowler VG, Jr., Skov R, Bruun NE. Future challenges and treatment of Staphylococcus aureus bacteremia with emphasis on MRSA. Future Microbiol. 2011;6(1):43-56.
175. Chaiwongkarjohn S, Pramyothin P, Suwantarat N, et al. A report on the first case of vancomycin-intermediate Staphylococcus aureus (VISA) in Hawai'i. Hawaii Med J. 2011;70(11):233-236.
176. Moravvej Z, Estaji F, Askari E, Solhjou K, Naderi Nasab M, Saadat S. Update on the global number of vancomycin-resistant Staphylococcus aureus (VRSA) strains. Int J Antimicrob Agents. 2013;42(4):370-371.
177. Endimiani A, Blackford M, Dasenbrook EC, et al. Emergence of linezolid-resistant Staphylococcus aureus after prolonged treatment of cystic fibrosis patients in Cleveland, Ohio. Antimicrob Agents Chemother. 2011;55(4):1684-1692.
178. Liu C, Bayer A, Cosgrove SE, et al. Clinical practice guidelines by the infectious diseases society of america for the treatment of methicillin-resistant Staphylococcus aureus infections in adults and children: executive summary. Clin Infect Dis. 2011;52(3):285-292.
179. Gu B, Kelesidis T, Tsiodras S, Hindler J, Humphries RM. The emerging problem of linezolid-resistant Staphylococcus. J Antimicrob Chemother. 2013;68(1):4-11.
180. Sanchez Garcia M, De la Torre MA, Morales G, et al. Clinical outbreak of linezolid-resistant Staphylococcus aureus in an intensive care unit. JAMA. 2010;303(22):2260-2264.
181. Bhattacharya PK. Emergence of antibiotic-resistant bacterial strains, methicillin-resistant Staphylococcus aureus, extended spectrum beta lactamases, and multi-drug resistance is a problem similar to global warming. Rev Soc Bras Med Trop. 2014;47(6):815-816.
182. Magiorakos AP, Srinivasan A, Carey RB, et al. Multidrug-resistant, extensively drug-resistant and pandrug-resistant bacteria: an international expert proposal for interim standard definitions for acquired resistance. Clin Microbiol Infect. 2012;18(3):268-281.
183. Flamm RK, Mendes RE, Hogan PA, Streit JM, Ross JE, Jones RN. Linezolid Surveillance Results for the United States (LEADER Surveillance Program 2014). Antimicrob Agents Chemother. 2016;60(4):2273-2280.
184. Zhang S, Sun X, Chang W, Dai Y, Ma X. Systematic Review and Meta-Analysis of the Epidemiology of Vancomycin-Intermediate and Heterogeneous Vancomycin-Intermediate Staphylococcus aureus Isolates. PLoS One. 2015;10(8):e0136082.
185. Liu C, Bayer A, Cosgrove SE, et al. Clinical practice guidelines by the infectious diseases society of america for the treatment of methicillin-resistant Staphylococcus aureus infections in adults and children. Clin Infect Dis. 2011;52(3):e18-55.
186. Hu Q, Peng H, Rao X. Molecular Events for Promotion of Vancomycin Resistance in Vancomycin Intermediate Staphylococcus aureus. Front Microbiol. 2016;7:1601.
187. Azhar A, Rasool S, Haque A, et al. Detection of high levels of resistance to linezolid and vancomycin in Staphylococcus aureus. J Med Microbiol. 2017;66(9):1328-1331.
188. Roch M, Gagetti P, Davis J, et al. Daptomycin Resistance in Clinical MRSA Strains Is Associated with a High Biological Fitness Cost. Front Microbiol. 2017;8:2303.

109
189. Ma Z, Lasek-Nesselquist E, Lu J, et al. Characterization of genetic changes associated with daptomycin nonsusceptibility in Staphylococcus aureus. PLoS One. 2018;13(6):e0198366.
190. Ortwine JK, Werth BJ, Sakoulas G, Rybak MJ. Reduced glycopeptide and lipopeptide susceptibility in Staphylococcus aureus and the "seesaw effect": Taking advantage of the back door left open? Drug Resist Updat. 2013;16(3-5):73-79.
191. Barber KE, Ireland CE, Bukavyn N, Rybak MJ. Observation of "seesaw effect" with vancomycin, teicoplanin, daptomycin and ceftaroline in 150 unique MRSA strains. Infect Dis Ther. 2014;3(1):35-43.
192. Mazharul Islam M, Thomas VC, Van Beek M, et al. An integrated computational and experimental study to investigate Staphylococcus aureus metabolism. NPJ Syst Biol Appl. 2020;6(1):3.
193. Madigan MT, Martinko JM, Dunlap PV, Clark DP. Brock biology of microorganisms 12th edn. Int Microbiol. 2008;11:65-73.
194. Wixon J, Kell D. The Kyoto encyclopedia of genes and genomes--KEGG. Yeast. 2000;17(1):48-55.
195. Kanehisa M, Goto S. KEGG: kyoto encyclopedia of genes and genomes. Nucleic Acids Res. 2000;28(1):27-30.
196. Tilford CA, Siemers NO. Gene set enrichment analysis. Methods Mol Biol. 2009;563:99-121.
197. Panja S, Hayati S, Epsi NJ, Parrott JS, Mitrofanova A. Integrative (epi) Genomic Analysis to Predict Response to Androgen-Deprivation Therapy in Prostate Cancer. EBioMedicine. 2018;31:110-121.
198. Murohashi M, Hinohara K, Kuroda M, et al. Gene set enrichment analysis provides insight into novel signalling pathways in breast cancer stem cells. Br J Cancer. 2010;102(1):206-212.
199. Cai B, Jiang X. Revealing Biological Pathways Implicated in Lung Cancer from TCGA Gene Expression Data Using Gene Set Enrichment Analysis. Cancer Inform. 2014;13(Suppl 1):113-121.
200. Livshits A, Git A, Fuks G, Caldas C, Domany E. Pathway-based personalized analysis of breast cancer expression data. Mol Oncol. 2015;9(7):1471-1483.
201. Altekruse SF, Elvinger F, Wang Y, Ye K. A model to estimate the optimal sample size for microbiological surveys. Appl Environ Microbiol. 2003;69(10):6174-6178.
202. Mandal S. Emerging Statistical Methodologies in the Field of Microbiome Studies. In: Handbook of Statistics. Vol 37. Elsevier; 2017:37-52.
203. Mansournia MA, Geroldinger A, Greenland S, Heinze G. Separation in Logistic Regression: Causes, Consequences, and Control. Am J Epidemiol. 2018;187(4):864-870.
204. van Smeden M, de Groot JA, Moons KG, et al. No rationale for 1 variable per 10 events criterion for binary logistic regression analysis. BMC Med Res Methodol. 2016;16(1):163.
205. Sinkovec H, Geroldinger A, Heinze G. Bring More Data!-A Good Advice? Removing Separation in Logistic Regression by Increasing Sample Size. Int J Environ Res Public Health. 2019;16(23).
206. Yang SJ, Bayer AS, Mishra NN, et al. The Staphylococcus aureus two-component regulatory system, GraRS, senses and confers resistance to selected cationic antimicrobial peptides. Infect Immun. 2012;80(1):74-81.
207. Falord M, Karimova G, Hiron A, Msadek T. GraXSR proteins interact with the VraFG ABC transporter to form a five-component system required for cationic antimicrobial peptide

110
sensing and resistance in Staphylococcus aureus. Antimicrob Agents Chemother. 2012;56(2):1047-1058.
208. Hanley JA, McNeil BJ. The meaning and use of the area under a receiver operating characteristic (ROC) curve. Radiology. 1982;143(1):29-36.
209. Ayar-Kayali H. Pentose phosphate pathway flux analysis for glycopeptide antibiotic vancomycin production during glucose-limited cultivation of Amycolatopsis orientalis. Prep Biochem Biotechnol. 2011;41(1):94-105.
210. Thomas VC, Kinkead LC, Janssen A, et al. A dysfunctional tricarboxylic acid cycle enhances fitness of Staphylococcus epidermidis during beta-lactam stress. MBio. 2013;4(4).
211. Wang Y, Bojer MS, George SE, et al. Inactivation of TCA cycle enhances Staphylococcus aureus persister cell formation in stationary phase. Sci Rep. 2018;8(1):10849.
212. Gaupp R, Lei S, Reed JM, et al. Staphylococcus aureus metabolic adaptations during the transition from a daptomycin susceptibility phenotype to a daptomycin nonsusceptibility phenotype. Antimicrob Agents Chemother. 2015;59(7):4226-4238.
213. Onyango LA, Alreshidi MM. Adaptive Metabolism in Staphylococci: Survival and Persistence in Environmental and Clinical Settings. J Pathog. 2018;2018:1092632.
214. Gefen O, Gabay C, Mumcuoglu M, Engel G, Balaban NQ. Single-cell protein induction dynamics reveals a period of vulnerability to antibiotics in persister bacteria. Proc Natl Acad Sci U S A. 2008;105(16):6145-6149.
215. Wood TK, Knabel SJ, Kwan BW. Bacterial persister cell formation and dormancy. Appl Environ Microbiol. 2013;79(23):7116-7121.
216. Belcheva A, Golemi-Kotra D. A close-up view of the VraSR two-component system. A mediator of Staphylococcus aureus response to cell wall damage. J Biol Chem. 2008;283(18):12354-12364.
217. Kato Y, Suzuki T, Ida T, Maebashi K. Genetic changes associated with glycopeptide resistance in Staphylococcus aureus: predominance of amino acid substitutions in YvqF/VraSR. J Antimicrob Chemother. 2010;65(1):37-45.
218. Muzamal U, Gomez D, Kapadia F, Golemi-Kotra D. Diversity of two-component systems: insights into the signal transduction mechanism by the Staphylococcus aureus two-component system GraSR. F1000Res. 2014;3:252.
219. Yang H, Wang M, Yu J, Wei H. Aspartate inhibits Staphylococcus aureus biofilm formation. FEMS Microbiol Lett. 2015;362(7).
220. McCarthy H, Rudkin JK, Black NS, Gallagher L, O'Neill E, O'Gara JP. Methicillin resistance and the biofilm phenotype in Staphylococcus aureus. Front Cell Infect Microbiol. 2015;5:1.
221. Ciofu O, Tolker-Nielsen T. Tolerance and Resistance of Pseudomonas aeruginosa Biofilms to Antimicrobial Agents-How P. aeruginosa Can Escape Antibiotics. Front Microbiol. 2019;10:913.
222. Preda VG, Sandulescu O. Communication is the key: biofilms, quorum sensing, formation and prevention. Discoveries (Craiova). 2019;7(3):e100.
223. Zhang K, Du Y, Si Z, et al. Enantiomeric glycosylated cationic block co-beta-peptides eradicate Staphylococcus aureus biofilms and antibiotic-tolerant persisters. Nat Commun. 2019;10(1):4792.
224. Marklevitz J, Harris LK. Prediction driven functional annotation of hypothetical proteins in the major facilitator superfamily of S. aureus NCTC 8325. Bioinformation. 2016;12(4):254-262.
225. Shimizu K. 1 - Main metabolism. In: Shimizu K, ed. Bacterial Cellular Metabolic Systems. Woodhead Publishing; 2013:1-54.

111
226. Min W, Li H, Li H, Liu C, Liu J. Characterization of Aspartate Kinase from Corynebacterium pekinense and the Critical Site of Arg169. Int J Mol Sci. 2015;16(12):28270-28284.
227. Ogawa-Miyata Y, Kojima H, Sano K. Mutation analysis of the feedback inhibition site of aspartokinase III of Escherichia coli K-12 and its use in L-threonine production. Biosci Biotechnol Biochem. 2001;65(5):1149-1154.
228. Ijaq J, Chandrasekharan M, Poddar R, Bethi N, Sundararajan VS. Annotation and curation of uncharacterized proteins- challenges. Front Genet. 2015;6:119.
229. School K, Marklevitz J, W KS, L KH. Predictive characterization of hypothetical proteins in Staphylococcus aureus NCTC 8325. Bioinformation. 2016;12(3):209-220.
230. Soh D, Dong D, Guo Y, Wong L. Consistency, comprehensiveness, and compatibility of pathway databases. BMC Bioinformatics. 2010;11:449.
231. Lander ES. The Heroes of CRISPR. Cell. 2016;164(1-2):18-28. 232. Hsu PD, Lander ES, Zhang F. Development and applications of CRISPR-Cas9 for genome
engineering. Cell. 2014;157(6):1262-1278. 233. Gupta RM, Musunuru K. Expanding the genetic editing tool kit: ZFNs, TALENs, and CRISPR-
Cas9. J Clin Invest. 2014;124(10):4154-4161. 234. McClure R, Balasubramanian D, Sun Y, et al. Computational analysis of bacterial RNA-Seq
data. Nucleic Acids Res. 2013;41(14):e140. 235. Tjaden B. De novo assembly of bacterial transcriptomes from RNA-seq data. Genome Biol.
2015;16:1. 236. Edgar R, Domrachev M, Lash AE. Gene Expression Omnibus: NCBI gene expression and
hybridization array data repository. Nucleic Acids Res. 2002;30(1):207-210. 237. Barrett T, Wilhite SE, Ledoux P, et al. NCBI GEO: archive for functional genomics data sets-
-update. Nucleic Acids Res. 2013;41(Database issue):D991-995. 238. Hajian-Tilaki K. Receiver Operating Characteristic (ROC) Curve Analysis for Medical
Diagnostic Test Evaluation. Caspian J Intern Med. 2013;4(2):627-635. 239. Goksuluk D, Korkmaz S, Zararsiz G, Karaagaoglu AE. easyROC: an interactive web-tool for
ROC curve analysis using R language environment. R Journal. 2016;8(213):e30. 240. Gould J. GENE-E. https://software.broadinstitute.org/GENE-E/, 2017. 241. Charbonnier Y, Gettler B, Francois P, et al. A generic approach for the design of whole-
genome oligoarrays, validated for genomotyping, deletion mapping and gene expression analysis on Staphylococcus aureus. BMC Genomics. 2005;6:95.
242. Koessler T, Francois P, Charbonnier Y, et al. Use of oligoarrays for characterization of community-onset methicillin-resistant Staphylococcus aureus. J Clin Microbiol. 2006;44(3):1040-1048.
243. Aligholi M, Emaneini M, Jabalameli F, Shahsavan S, Dabiri H, Sedaght H. Emergence of high-level vancomycin-resistant Staphylococcus aureus in the Imam Khomeini Hospital in Tehran. Med Princ Pract. 2008;17(5):432-434.
244. Stapleton PD, Taylor PW. Methicillin resistance in Staphylococcus aureus: mechanisms and modulation. Sci Prog. 2002;85(Pt 1):57-72.
245. Altschul SF, Madden TL, Schaffer AA, et al. Gapped BLAST and PSI-BLAST: a new generation of protein database search programs. Nucleic Acids Res. 1997;25(17):3389-3402.
246. Mohan R, Venugopal S. Computational structural and functional analysis of hypothetical proteins of Staphylococcus aureus. Bioinformation. 2012;8(15):722-728.

112
247. Wattam AR, Davis JJ, Assaf R, et al. Improvements to PATRIC, the all-bacterial Bioinformatics Database and Analysis Resource Center. Nucleic Acids Res. 2017;45(D1):D535-D542.

113
APPENDIX A. Overview of mRNA Expression Resources
Here, we detail the mRNA expression datasets provided by the Gene Expression
Omnibus (GEO) used in this study. We first use three datasets (GSE46887, GSE50842,
and GSE26016) containing untreated samples of antibiotic resistant and sensitive
S. aureus strains to identify pathway activity changes based on mRNA expression
resulting in antibiotic resistance from established mutations in vraSR or graSR53,56,75.
GSE46887 contained triplicate untreated samples of an antibiotic sensitive strain
(NCTC 8325) with a mutS (mismatch repair gene) deletion mutation (mutS) to its
antibiotic resistant progeny strain (VC40) that was generated from 30 serial passages of
mutS with increasing vancomycin exposure, grown in brain heart infusion broth to
exponential growth phase before mRNA collection (samples (S)=6)101. Among other
mutations, VC40 had two VraSR mutations (L114S and D242G) that resulted in high
level vancomycin resistance (MIC ≥48 mg/L) and low level daptomycin resistance
(MIC=4 mg/L) with oxacillin sensitivity (MIC=1mg/L) and was not tested for linezolid
resistance as determined through genetic reconstitution of the NCTC8325 genome
(i.e., same mutations introduced to sensitive NCTC8325 resulting in increased
vancomycin (MIC≥3mg/L) and daptomycin (MIC= 2mg/L) resistance)101. Samples were
profiled on Agilent-021782 Custom S. aureus V6 Array (GEO accession GPL10537) to
measure mRNA expression. This non-commercial, validated microarray platform241,242
had 10 807 60-mer oligonucleotide probes specific to S. aureus covering >95% of ORFs
annotated in S. aureus strains of varying methicillin and vancomycin sensitivities:
sensitive to methicillin and vancomycin (MSSA476 and NCTC8325), MRSA strains
sensitive to vancomycin (COL, N315, MW2, MRSA252, and USA300FPR3757), and

114
MRSA/VISA (Mu50), according to the published paper for this dataset101. However, we
note that GEO provided 7266 probes containing 6888 unique probes (non-overlapping
gene coverage, i.e., different probes targeting same gene) from other strains, some of
which we verified from performing Basic Local Alignment Search Tool (BLAST) on
probe nucleotide sequences (Table A-1). Further, we note that this platform does not
include probes for the vanA operon, indicating we cannot assess the mechanism of
vancomycin resistance in VC40, though the fact VC40 was generated from repeated
increasing exposure to vancomycin indicates it is a VISA strain. We also notice that the
VraS (SAOUHSC_02099) probe does not cover the regions where single polymorphism
mutations in VraS were documented in VC40, making it impossible to distinguish
between WT and mutant expression. GEO provided mRNA expression data for
GSE46887 as log10(sample/gDNA pool) values. We convert these log10 ratios to log2
ratios for consistency across data used in this study.

115
Table A-1. Platform coverage
Strain GPL10537 GPL7137 GPL10597 GPL5879 GPL20586
NCTC8325 26551 352 0 0 2836
COL 0 904 240 1335 0
N315 0 2437 88 87 0
Mu50 0 560 1462 1490 0
MW2 0 172 83 106 0
USA300 419 902 1262 0 0
MRSA252 0 744 720 745 0
MSSA476 0 432 634 649 0
UAMS-1 491 0 0 0 0
Newman 726 1 0 0 0
JH-1 0 3 0 0 0
JH-9 0 24 0 0 0
SAW1 2114 0 0 0 0
Plasmids 0 67 23 9 0
Tiling region 222 0 0 0 1192
Obsolete 0 0 75 125 0
Control 261 0 500 510 0
Total tags 6888 6598 5087 5056 4028 1 Stain 564 was used, which is a derivative of strain NCTC 8325.
GSE50842 contained duplicate untreated samples (S=4) of wildtype (antibiotic
sensitive) HG001 (normal GraSR) and SG511 (truncated GraSR) strains, both rsbU+
(phosphoserine phosphatase that positively regulates RNA polymerase B activity during
stress-response) derivatives of NCTC8235, and their antibiotic resistant progeny after
four months of incrementally increasing daptomycin exposure grown in Mueller Hinton
broth until exponential phase129. Antibiotic resistant progeny had intermediate
vancomycin resistance (MIC=4mg/L), high daptomycin resistance (MIC=31mg/L) and
were noted to be more susceptible to oxacillin and linezolid (MIC not reported)129.
Samples were profiled on the customized commercial platform Agilent-017903 S. aureus
V5 Bis 15K, basic version, array (GEO accession GPL7137), which had 6608 60-mer
oligonucleotide probes with 6598 unique locus tags from various strains (Table A-1).

116
GEO or Agilent did not provide sequences for probes for this platform, so it is not
possible to assess how the graSR mutation may impact gene expression in this dataset.
Further, this platform does not include probes for the vanA operon, indicating we cannot
assess the mechanism of vancomycin resistance in resistant HG001 and SG511, though
given their low level resistance (MIC=4mg/L) they are unlikely to use the vanA operon,
which is associated with immediate high level resistance (MIC>16mg/L)56. GEO
provided mRNA expression data for GSE50842 as log10(resistant progeny/sensitive wild
type in same strain) values. We convert these log10 ratios to log2 ratios for consistency
across data used in this study.
GSE26016 contained triplicate samples (S=6) of wildtype HG001 (WT) and its
mutant strain with a graSR entire gene (i.e., coding sequence) deletion (graSR) grown to
mid-exponential phase in tryptic soy broth (TSB) containing 50mg/L colistin for graSR
induction76. Only resistance to colistin, another cell membrane disruptor with similar
structure to daptomycin, was established for GSE26016 strains76. The WT strain was
colistin resistance (MIC=700mg/L) while the graSR strain was colistin sensitive
(MIC=100mg/L), and resistance in the (graS) mutant was completely restored
(MIC=700mg/L) via genetic reconstitution76. GEO provided this mRNA expression data
was provided as unlogged median-normalized gene-level intensities so we z-score across
all samples so that all data is normalized prior to use. Samples were profiled on the same
platform used for GSE46887 which has a probe to detect graSR expression. We note that,
while around 2-fold higher than WT, the experiment was able to detect graSR expression
in the graSR mutant.

117
To examine molecular changes associated with vancomycin, oxacillin, or
linezolid susceptibilities individually, we used four datasets (GSE26400, GSE26282,
GSE26358, and GSE26258) that contained untreated and antibiotic treated samples of
strains with varying resistance levels. Three datasets (GSE26400, GSE26282, and
GSE26358) compared untreated and antibiotic (vancomycin, oxacillin, or linezolid,
respectively) treated S. aureus strains grown in TSB over a time course (30min, 60min,
90min, and 120min post-inoculation into treated media for early exponential, mid-
exponential, late exponential, and early stationary growth phases, respectively).
GSE26400 contained triplicate samples of untreated and vancomycin treated strains (S=3
per each treatment condition, S=6 samples total per time point, S=48 total), with T8
(32mM vancomycin) and C1 (16mM vancomycin), and PA (4mM vancomycin).
GSE26282 contained triplicate samples of untreated and oxacillin treatment strains 1422
and 2798 to characterize a new methicillin resistant isolate lacking mecA (S=24).
GSE26358 contained duplicate samples of untreated (S=32) and linezolid (S=31)
treatment for four linezolid resistant strains: 3577 (S=16), 5612 (S=16), 6939 (S=15), and
7210 (S=16), compared to the linezolid sensitive strain 378. All samples for GSE26400,
GSE26282, and GSE26358 were profiled on J. Craig Venter Institute (JCVI) S. aureus
16K v9 array designed primarily based on strain USA300 (GEO accession GPL10597).
This non-commercial set contains 5087 probes of 70-mer oligonucleotides (Table A-1),
including 4368 unique genes with 88 unique genes having multiple probes (P=232 with
overlapping gene coverage). Plasmid derived probes for this platform came from
pLW043, the plasmid containing Tn1546 transposon with the van operon. GEO values
were provided as both log2 ratios of differing strains of the same treatment condition

118
(e.g., T8treated/PAtreated and T8untreated/PAuntreated) and their associated integrated
intensity values.GSE26258 studies oxacillin resistance by examining five replicates
grown in tryptic soy broth (TSB) of oxacillin treated and untreated samples of VC30 and
923 (S=10), profiled on JCVI PFGRC S. aureus 22K v6 array designed primarily based
on strain COL (GEO accession GPL5879). This non-commercial platform with 5056 70-
mer probes with 4783 unique probes. GEO provided probe sequences for this platform.
GEO values were provided as both integrated intensity values and log2 ratios of differing
treatments and strains (e.g., 923treated/923untreated and V3untreated/923untreated). For
these datasets, we use intensities to calculate log2 ratios of treated versus untreated for
each strain separately (e.g., T8 treated/T8 untreated, PA treated/PA untreated), revealing
response mechanisms for individual strains, for consistency across data used in this study.
One limitation to using these antibiotic susceptibility datasets is that they have not
undergone proper peer review and there is a lack of information consistency on how data
was generated experimentally. For example, there are no available MIC data for strains
from GSE26400 (PA, C1, T8), GSE26358 (3577, 5612, 6939, 7210, and 378), GSE26258
(VC30 and 923), and GSE26282 (1422 and 2798), so we cannot confirm the level of
resistance for samples used in my work. Therefore, we assume that antibiotic
concentrations used were close to MICs for each strain but cannot confirm this
assumption. Antibiotic concentrations used to generate mRNA expression data were not
provided for samples from GSE26282, GSE26258, or GSE26358. In GSE26400, the
concentration was reported at mM rather than the clinical standard of mg/L92. Conversion
of 16mM to mg/L would be over 23,000mg/L, around 4300% of the highest MIC
reported (512mg/L)243, therefore we believe the mM to be a GEO typographical error

119
indicating C1 and T8 are high-level vancomycin resistant strains. Unfortunately, we
attempted to communicate with the depositors of these datasets several times to clarify
this confusion but did not receive any reply. Also, we do not know the details of how the
experiment was performed, so it is possible parallel PA cultures were used to standardize
C1 and T8 intensities (e.g., T8treated/PAtreated) since these were performed as two
separate runs that may have occurred simultaneously. However, it is also possible that the
PAfromT8 strain may have mutations not present in the PAfromC1 strain which could
occur if the two runs were performed at different times. For this reason, we treat
PAfromT8 and PAfromC1 as separate strains for this work. Finally, we do not know
mechanisms, such as vanA, used by these strains to produce an antibiotic resistance
phenotype, and sequenced genomes are not available for strains used in these studies.
Probe sequences were available for these datasets though, so we used them to attempt to
determine resistance mechanisms. We first select probe sequences for genes in operons
with well-established associations to vancomycin resistance (VRSA, vanA operon)56 and
methicillin resistance (MRSA, mecA operon)14,244. We also included the bla operon
which has been associated methicillin resistance in the absence of the mecA operon14,244.
We verify gene identify using these probe sequences using BLAST. Since GEO provided
values as log ratios of differing strains of the same treatment condition
(e.g., T8treated/PAtreated) with each raw intensity used for ratio calculations, we
examine provided raw intensity values to better understand resistance mechanisms used
by these strains (APPENDIX A). While we confirm that oxacillin samples (1422 and
2798) do not have mecA expression, we notice for vancomycin resistant samples (T8, C1,
and PA) that vanA operon gene expression can sometimes be detected in untreated

120
samples but not in treated samples (e.g., VRA0037, VRA0038, VRA0039, VRA0040,
VRA0041, VRA0042, and VRA0043 for vraR, vraS, vraH, vraA, vraX, vraY, and vraZ,
respectively), the opposite of what would be expected in a VRSA strain since the vanA
operon has been shown to be constitutively or inducible expressed suggesting that
detection should occur in vancomycin treated samples56. We fail to find another gene
with sequence homology to these probes that might explain this expression pattern using
BLAST. While these limitations can complicate conclusions drawn from this work, they
are not significant enough to preclude the use of these datasets to examine antibiotic
resistance in S. aureus.
Figure A-1. Gene Expression Examination for Known Resistance Operons Provides
Insight into Potential Resistance Mechanisms
Gene expression heat map of raw intensity values for probes from GPL10597 for well-
characterized resistance operons, vanA for VRSA and mecA and bla for MRSA.

121
To examine vancomycin, oxacillin, or linezolid responses in a sensitive strain, we
use data from antibiotic sensitive HG001 samples at GEO accession GSE7004077. This
dataset contained 156 samples of over 40 experimental conditions including treatment
with no antibiotic, 0.63mg/L vancomycin, 0.02mg/L flucloxacillin (like oxacillin), and
0.10mg/L linezolid in TSB collected during both exponential phase and four hours after
entrance into stationary phase, post-inoculation into treated media. Samples were profiled
on gene level BaSysBio S. aureus T1 385K array 080604_SA_JH_Tiling (GEO accession
GPL20586) on probes corresponding to a unique gene or complementary strand
nucleotide sequence though exact probe sequences used for the platform are not provided
(Table A-1). We note that this platform does not include probes for the vanA operon.
GEO reported mRNA expression as quantile-normalized gene-level intensity values so
we z-scored across all samples for normalization prior to use.
122
APPENDIX B. Justification Supplemental
Justification for use of 20 pathways per panel and VC40vsmutS pathway signature
to define vraS-driven resistance panels
We begin by using mutation-driven resistance pathway signatures,VC40vsmutS,
HG001vsSG511, and WTvsgraS, for further analysis to justify the use of 20 pathways
per panel in my study, which captures approximately 25% of the 164 S. aureus pathways
from KEGG, 12.5% per tail. To do this, we define vraS-driven resistance pathway panels
from the VC40vsmutS pathway signature as done in my study for the 20 pathway
panels, except with 10, 13, 15, 18, 22, 25, 28, and 30 pathways per panel instead. We
compare these new pathway panels as query against HG001vsSG511 and WTvsgraSR
pathway signatures as reference using GSEA. From this analysis, we note that using
panels containing 13 to 25 pathways do not substantially change similarities uncovered
by GSEA when compared to verification signatures, while 28 and 30 panel pathways no
longer detected similarities in WTvsgraSR and 10 panel pathways loses detection for
the up-regulated panel and HG001vsSG511 (Figure B-1). We note that use of 15 and 25
pathways per panel detect enrichment in the down-regulated panel for the signature that
18, 20, and 22 pathways per panel does not detect. We will re-address this issue
momentarily.

123
Figure B-1. Using 20 Pathways per Panel Does Not Affect Pathway Panel Enrichment
Results
Heat map of normalized enrichment scores (NES) achieved from Gene Set Enrichment
Analysis (GSEA) of verification signatures HG001vsSG511 and WTvsgraSR
(references) and various sized pathway panels defined from VC40vsmutS illustrates the
use of 20 pathways/panel does not substantially alter obtained results.
As justification for my use of the VC40vsmutS pathway signature to define
vraS-driven resistance panels in my study, we examine how results may change if panels
are derived from other datasets. To do this, we define graSR-driven pathway panels from
HG001vsSG511 and WTvsgraSR in the same manner performed to derive the vraS-
driven resistance panels used in my study. We use the graSR-driven pathway panels as
queries for GSEA versus the VC40vsmutS pathway signature as reference. We do not
find a substantial change for up-regulated panels, despite variations in pathway panel size

124
(Figure B-2), supporting the conclusion that my up-regulated pathway panel is truly
enriched. We lose enrichment in my down-regulated panel which confirms what was
observed when pathway panels are defined from the VC40vsmutS pathway signature.
We also note that using 15 or 25 pathways per panel lost enrichment in one of the two up-
regulated panels (Figure B-2), supporting my decision to select 20 pathways per panel
rather than 15 or 25 pathways per panel for use in the remainder of this study. We finally
note that lysine biosynthesis pathways (M00016 and M00527) are the only pathways
shared across leading-edges when we define panels from HG001vsSG511 (NES>1.91, p-
value<0.001) and WTvsgraSR (NES>2.16, p-value<0.001), showing my overall
findings regarding lysine biosynthesis are not lost when graSR-driven resistance panels
are used.

125
Figure B-2. Using Verification Signatures to Derive Pathway Panels Does Not Affect
Pathway Panel Enrichment Results
Heat map of normalized enrichment scores (NES) achieved from GSEA of
VC40vsmutS signature (reference) and various sized pathway panels defined from
HG001vsSG511 and WTvsgraSR signatures confirms true enrichment of up-regulated
pathway panels not seen in down-regulated pathway panels.
Justification for use of locus tags
We use locus tags (e.g., SAUSA300_2200) rather than gene symbols (e.g., rpsS) to
increase gene signature lengths and ensure pathway query set sizes are greater than 10
since multiple locus tags can map to the same gene symbol (e.g., locus tags
SAOUHSC_02989 and SAOUHSC_02491 from S. aureus NCTC 8325 have secY as their
gene symbol in NCBI Genome), and longer gene signatures and query sets above 10
items allow GSEA to calculate more robust NES for pathway signature generation65,67.
While using locus tags increases the length of gene signatures, it does not improve
126
genome annotation since we notice in the platform used to profile most datasets used in
this work (GPL10597) that a substantial number (26.8%) of probes have hypothetical
annotation (i.e., no gene symbol and description) when probes are converted to gene
symbols using NCBI databases and Position-Specific Iterative Basic Local Alignment
Search Tool (PSI-BLAST)245, and find similar percentages when examining genome
annotation across the seven S. aureus strains of varying methicillin and vancomycin
sensitivities GPL10597 probes were designed to target, which is a common finding
among bacterial genomes229,246. Unfortunately, lack of complete genome annotation
weakens the detection ability of any gene expression and pathway enrichment analyses,
including the approach used here, due to incomplete pathway database information.
Justification for use of KEGG
To address pathway database completeness, we evaluate several knowledgebases,
including Molecular Signatures Database (MSigDB) version 6.267,152, Reactome version
67155, Gene Ontology version 12.068,157,158, and Pathosystems Resource Integration Center
(PATRIC) version 3.5.7168,247, for gene, pathway, and strain inclusion, all important
considerations when selecting a pathway database65. We find these knowledgebases
differ substantially in gene coverage (G=2458, G=730, G=657, and G=0 for KEGG, GO,
PATRIC, and Reactome, respectively), when we compare the number of unique locus
tags for the 12 S. aureus species with targeted genes on platforms used for datasets in this
work. KEGG and PATRIC both have locus tags and gene symbols available whereas GO
only has gene symbols, which limited my ability to use GO. Further, we find KEGG had
326 pathways specific to S. aureus with 53 strains with varying resistances represented
while PATRIC had 94 pathways with one strain represented. Therefore, we use KEGG

127
for this work since it has the largest number of genes, pathways, and represented
S. aureus genomes between knowledgebases at the time of this study, though we
acknowledge that knowledgebases are constantly updated as biological understanding
advances so we recommend a thorough knowledgebase analysis be done prior to any use
of my pathway signature approach.

128
APPENDIX C. Complete Separation Data
Compared to human trials, bacterial experiments frequently have a small sample size (<5
samples/condition)201,202, which can lead to complete separation during random model
validation methods (i.e., principal component analysis (PCA) and logistic regression
analysis)203-205. For example, we observe complete separation in both graSR-driven
resistance datasets when unlogged or raw intensity gene expression values, for
GSE50842 and GSE26016 respectively, are used for individual samples in PCA on 10 or
100 randomly selected genes or when all dataset genes are selected (Figure C-1). We also
find complete sample separation when using NES from 10 or 20 randomly selected
pathways for PCA (data not shown). This separation is confirmed via leave one out cross
validation (LOOCV) where we achieve 98% complete sample separation (r2=1.0) from
1000 randomly selected 20-pathway panels whose membership excluded pathways from
my vraS-driven resistance panels in both datasets. For this reason, we use a GSEA-based
pathway signature comparison approach with a random modeling component to verify
my vraS-driven and vancomycin susceptibility panels.

129
Figure C-1. Principal Component Analysis of Randomly Selected Genes
Principal component analysis (PCA) shows complete separation of GSE50842 and
GSE26016 samples regardless of number of genes selected, suggesting these datasets
separate naturally and would not be good for traditional random model validation
methods (i.e., principal component analysis (PCA) and logistic regression analysis).

130
Figure C-2. Principal Component Analysis of Randomly Selected Pathways
Principal component analysis (PCA) shows complete separation of GSE50842 and
GSE26016 samples regardless of number of pathways selected, suggesting these datasets
separate naturally and would not be good for traditional random model validation
methods (i.e., principal component analysis (PCA) and logistic regression analysis).
To assess if use of a dataset with more samples could introduce enough variation
in gene expression to make PCA and logistic regression analysis work, we compare raw
intensities for GSE26016 sample populations and find differences in variance (WT:
172.9; graSR: 147.0) between WT and graSR (Table C-1). When looking at individual
sample distributions, we note overlap of sample means and ranges, suggesting that more
samples has the potential to produce enough variation though more work is needed to
determine how many samples is enough. Experimental generation of a mRNA expression

131
dataset with enough samples for successful logistic regression analysis with random
modeling could improve random modeling results using PCA and LOOCV.
Table C-1. Individual Sample Statistics for GSE26016 Show Overlap Between WT
and graSR Samples
WT graSR
GSM 638321 638322 638323 638324 638325 638326
Mean 5.89 5.36 5.95 5.11 6.21 5.54
Range
min
0.19 0.14 0.14 0.13 0.13 0.12
Range
max
113.19 71.70 82.85 78.34 76.05 72.98
GSM refers to sample identification label in Gene Expression Omnibus (e.g.,
GSM638321).
132
APPENDIX D. Leading-edge Pathway Tables
Table D-1 is derived from Gene Set Enrichment Analysis (GSEA) using vraS-driven
resistance panels defined from the VC40vsmutS signature (query) and HG001vsSG511
and WTvsgraSR resistance signatures (references).
Table D-2 is derived from GSEA using vancomycin susceptibility (i.e., difference in
response between resistant and sensitive strains) panels defined from the T8vsPA
susceptibility signature (query) and C1vsPA susceptibility signature (reference).
Table D-3 is derived from GSEA using vraS-driven resistance panels (query) and
T8vsPA and C1vsPA vancomycin susceptibility signatures (references).
Table D-4 is derived from GSEA using vraS-driven resistance panels (query) and
1422vs2798 and V3vs923 oxacillin susceptibility signatures (references).
Table D-5 is derived from GSEA using vraS-driven resistance panels (query) and
3577vs378, 5612vs378, 6939vs378, and 7210vs378 linezolid susceptibility signatures
(references).
Table D-6 is derived from GSEA using vraS-driven resistance panels (query) and
HG001van, HG001fluc, and HG001line response signatures in a sensitive strain for
vancomycin, flucloxacillin (like oxacillin), and linezolid responses, respectively
(references).

133
Table D-1. Leading-edge Pathways Associated with vraS- and graSR-driven
Resistance
Panel Signature Module number
Up HG001vs
SG511
Dissimilatory nitrate reduction (M00530)*, Lysine biosynthesis
via diaminopimelic acid aminotransferase (M00527)*,
Histidine biosynthesis (M00026)*, Lysine biosynthesis via
succinyl-diaminopimelic acid (M00016)*, D-Methionine
transport system (M00238)*, Betaine biosynthesis (M00555)*,
Arabinogalactan oligomer/maltooligosaccharide (M00491)*,
Leucine biosynthesis (M00432)*, Phosphonate (M00223)*,
Serine biosynthesis (M00020)*
WTvs
graS
Lysine biosynthesis via succinyl-diaminopimelic acid
(M00016)*, Lysine biosynthesis via diaminopimelic acid
aminotransferase (M00527)*, Leucine biosynthesis (M00432)*,
Histidine biosynthesis (M00026)*, Biotin biosynthesis BioW
pathway (M00577), VraS-VraR cell-wall peptidoglycan
synthesis (M00480), Biotin biosynthesis (M00123), Putative
peptide (M00583), Osmoprotectant transport system (M00209),
Serine biosynthesis (M00020), Cationic antimicrobial peptide
(M00732), Betaine biosynthesis (M00555), Dissimilatory
nitrate reduction (M00530)
Down HG001vs
SG511
Iron complex (M00240)*, Spermidine/ putrescine transport
system (M00299)*, Nickel complex (M00440)*, ABC-2 type
(M00254)*, ArlS-ArlR virulence regulation (M00716),
Menaquinone biosynthesis (M00116), Amino-acyl tRNA
biosynthesis eukaryotes (M00359), Amino-acyl tRNA
biosynthesis prokaryotes (M00360), Adenine ribonucleotide
biosynthesis (M00049), TCA cycle second carbon oxidation
(M00011)
WTvs
graS
Amino-acyl tRNA biosynthesis prokaryotes (M00360)*,
Amino-acyl tRNA biosynthesis eukaryotes (M00359)*,
Guanine ribonucleotide biosynthesis (M00050)*, Adenine
ribonucleotide biosynthesis (M00049)*, TCA cycle (M00009),
TCA cycle second carbon oxidation (M00011), Succinate
dehydrogenase prokaryotes (M00149), Acylglycerol
degradation (M00098), ABC-2 type (M00254), Uridine
monophosphate biosynthesis (M00051), TCA first carbon
oxidation (M00010), Energy-coupling factor (M00582),
Spermidine/ putrescine transport system (M00299)
Modules listed in order of normalized enrichment score from most to least change in
pathway activity. * represents Gene Set Enrichment Analysis derived p-value<0.05.
HG001vsSG511 signature represents the difference in resistance between strains with
graSR mutations. WTvsgraSR signature approximates graS-driven resistance. Bold font
indicates a pathway with known association to antibiotic resistance (vraSR or graSR-

134
driven). Pathways that have a * but do not have bold font are novel pathways associated
with antibiotic resistance identified from my pathway signature approach.

135
Table D-2. Leading-edge Pathways Associated with Vancomycin Susceptibility in
S. aureus
Panel Signature Module number
Up C1vsPA Oligopeptide (M00439)*, Threonine biosynthesis (M00018)*,
Lysine biosynthesis via succinyl-diaminopimelic acid
(M00016)*, D-Methionine transport system (M00238)*, Lysine
biosynthesis via diaminopimelic acid aminotransferase
(M00527)*, Riboflavin biosynthesis (M00125)*,
Osmoprotectant transport system (M00209)*, Energy-coupling
factor (M00582), VraS-VraR cell-wall peptidoglycan synthesis
(M00480)*, Pantothenate biosynthesis (M00119), Betaine
biosynthesis (M00555), Isoleucine biosynthesis (M00570),
Formaldehyde assimilation ribulose monophosphate (M00345),
Uridine monophosphate biosynthesis (M00051), Cationic
antimicrobial peptide resistance VraFG transporter (M00730),
Glyoxylate cycle (M00012)
Down C1vsPA Iron complex (M00240)*, Amino-acyl tRNA biosynthesis
prokaryotes (M00360)*, Dissimilatory nitrate reduction
(M00530)*, Amino-acyl tRNA biosynthesis eukaryotes
(M00359)*, Nickel complex (M00440)*, Ribosome bacteria
(M00178)*, Fructose-specific (M00273)*, TCA cycle second
carbon oxidation (M00011)*, Glucose- specific (M00809)*,
Spermidine/ putrescine transport system (M00299)*, NreB-
NreC dissimilatory nitrate/nitrite reduction (M00483)*,
Putative peptide (M00583), Cytochrome C oxidase (M00154)*,
TCA cycle (M00009), F-type ATPase prokaryotes and
chloroplasts (M00157), Urea cycle (M00029), Siroheme
biosynthesis (M00846), Cytochrome aa3-600 menaquinol
oxidase (M00416), Succinate dehydrogenase prokaryotes
(M00149), Cystine (M00234)
Modules listed in order of normalized enrichment score from most to least change in
pathway activity. * represents Gene Set Enrichment Analysis derived p-value<0.05.
Italics font indicates a pathway with known association to vancomycin intermediate
resistance lacking the vanA operon. Pathways that have a * but do not have bold font are
novel pathways associated with vancomycin intermediate resistance identified from my
pathway signature approach.

136
Table D-3 Leading-edge Pathways Associated with vraS-driven Resistance and
Vancomycin Susceptibility in S. aureus
Panel Signature Module number
Up T8 vs PA Osmoprotectant transport system (M00209)*, D-Methionine
transport system (M00238)*, Lysine biosynthesis via succinyl-
diaminopimelic acid (M00016), VraS-VraR cell-wall
peptidoglycan synthesis (M00480)*, Lysine biosynthesis via
diaminopimelic acid aminotransferase (M00527), Betaine
biosynthesis (M00555)*, Cationic antimicrobial peptide
resistance VraFG transporter (M00730)
C1 vs PA Lysine biosynthesis via succinyl-diaminopimelic acid
(M00016)*, D-Methionine transport system (M00238)*,
Lysine biosynthesis via diaminopimelic acid aminotransferase
(M00527)*, Osmoprotectant transport system (M00209)*,
VraS-VraR cell-wall peptidoglycan synthesis (M00480)*,
Betaine biosynthesis (M00555)
Down T8 vs PA Amino-acyl tRNA biosynthesis prokaryotes (M00360)*,
Amino-acyl tRNA biosynthesis eukaryotes (M00359)*, TCA
cycle second carbon oxidation (M00011)*, TCA cycle
(M00009)*, Iron complex (M00240)*, Nickel complex
(M00440)*, Spermidine/ putrescine transport system
(M00299)*, Succinate dehydrogenase prokaryotes (M00149)*,
ArlS-ArlR two-component regulatory system (M00716),
Guanine ribonucleotide biosynthesis (M00050), Menaquinone
biosynthesis (M00116), Adenine ribonucleotide biosynthesis
(M00049), Shikimate pathway (M00022)
C1 vs PA Iron complex (M00240)*, Amino-acyl tRNA biosynthesis
prokaryotes (M00360)*, Amino-acyl tRNA biosynthesis
eukaryotes (M00359)*, Nickel complex (M00440)*, TCA
cycle second carbon oxidation (M00011)*, Adenine
ribonucleotide biosynthesis (M00049)*, Spermidine/
putrescine transport system (M00299)*, Guanine
ribonucleotide biosynthesis (M00050), TCA cycle (M00009),
Succinate dehydrogenase prokaryotes (M00149), ArlS-ArlR
virulence regulation (M00716), Menaquinone biosynthesis
(M00116)
Modules listed in order of normalized enrichment score from most to least change in
pathway activity. * represents Gene Set Enrichment Analysis derived p-value<0.05. Bold
font indicates a pathway with known association to vraS-driven antibiotic resistance.
Italics font indicates a pathway with known association to vancomycin intermediate
resistance lacking the vanA operon. Pathways that have a * but do not have bold font are
novel pathways associated with vancomycin intermediate resistance identified from my
pathway signature approach.

137
Table D-4. Leading-edge Pathways Associated with vraS-driven Resistance and
Oxacillin Susceptibility in S. aureus
Panel Signature Module number
Up 1422vs2798 Leucine biosynthesis (M00432)*, Dissimilatory nitrate
reduction (M00530), Inosine monophosphate biosynthesis
(M00048), Cytochrome D ubiquinol oxidase (M00153),
Betaine biosynthesis (M00555), Phosphonate (M00223),
Putative peptide (M00583), Lysine biosynthesis via
diaminopimelic acid aminotransferase (M00527), Histidine
biosynthesis (M00026), Lysine biosynthesis via succinyl-
diaminopimelic acid (M00016), Cationic antimicrobial
peptide (M00732)
V3vs923 Dissimilatory nitrate reduction (M00530)*, Inosine
monophosphate biosynthesis (M00048)*, Osmoprotectant
transport system (M00209)*, Peptides/nickel (M00239),
Cationic antimicrobial peptide (M00732), Serine
biosynthesis (M00020), VraS-VraR cell-wall peptidoglycan
synthesis (M00480), D-Methionine transport system
(M00238), Cationic antimicrobial peptide resistance VraFG
transporter (M00730), Putative peptide (M00583), Lysine
biosynthesis via succinyl-diaminopimelic acid (M00016),
Biotin biosynthesis (M00123), Biotin biosynthesis BioW
pathway (M00577), Lysine biosynthesis via diaminopimelic
acid aminotransferase (M00527)
Down 1422vs2798 TCA cycle (M00009)*, TCA cycle second carbon oxidation
(M00011)*, Molybdate transport system (M00189),
Succinate dehydrogenase prokaryotes (M00149), ArlS-ArlR
virulence regulation (M00716), Acylglycerol degradation
(M00098), TCA first carbon oxidation (M00010), ABC-2
type transport system (M00254)
V3vs923 TCA cycle (M00009)*, Uridine monophosphate
biosynthesis (M00051)*, TCA cycle second carbon
oxidation (M00011)*, TCA first carbon oxidation
(M00010)*, Nickel complex (M00440), Molybdate
transport system (M00189), Menaquinone biosynthesis
(M00116), Adenine ribonucleotide biosynthesis (M00049),
Succinate dehydrogenase prokaryotes (M00149),
Acylglycerol degradation (M00098), Iron complex
(M00240), Spermidine/ putrescine transport system
(M00299), Energy-coupling factor (M00582)
Modules listed in order of normalized enrichment score from most to least change in
pathway activity. * represents Gene Set Enrichment Analysis derived p-value<0.05. Bold
font indicates a pathway with known association to vraS-driven antibiotic resistance.
Italics font indicates a pathway with known association to vancomycin intermediate
resistance lacking the vanA operon. Underlined pathways indicate as oxacillin resistance

138
association. Pathways that have a * but are not underlined are novel pathways associated
with oxacillin intermediate resistance identified from my pathway signature approach.

139
Table D-5. Leading-edge Pathways Associated with vraS-driven Resistance and Linezolid Susceptibility in S. aureus
Panel Signature Module number
Up 3577vs378 D-Methionine transport system (M00238)*, Lysine biosynthesis
via diaminopimelic acid aminotransferase (M00527)*, Inosine
monophosphate biosynthesis (M00048)*, Cationic antimicrobial
peptide (M00732), Leucine biosynthesis (M00432), Lysine
biosynthesis via succinyl-diaminopimelic acid (M00016), Cationic
antimicrobial peptide resistance VraFG transporter (M00730)
5612vs378 Inosine monophosphate biosynthesis (M00048)*, D-Methionine
transport system (M00238)*, Lysine biosynthesis via succinyl-
diaminopimelic acid (M00016)*, Lysine biosynthesis via
diaminopimelic acid aminotransferase (M00527)*, Histidine
biosynthesis (M00026), Leucine biosynthesis (M00432),
Phosphonate (M00223)
6939vs378 Inosine monophosphate biosynthesis (M00048)*, D-Methionine
transport system (M00238), Peptides/nickel (M00239),
Arabinogalactan oligomer/maltooligosaccharide (M00491), Lysine
biosynthesis via succinyl-diaminopimelic acid (M00016), Lysine
biosynthesis via diaminopimelic acid aminotransferase (M00527)*,
VraS-VraR cell-wall peptidoglycan synthesis (M00480), Serine
biosynthesis (M00020), Cationic antimicrobial peptide resistance
VraFG transporter (M00730), Cationic antimicrobial peptide
(M00732)
7210vs378 Dissimilatory nitrate reduction (M00530)*, Osmoprotectant
transport system (M00209)*, Phosphonate (M00223)*
Down 3577vs378 TCA cycle second carbon oxidation (M00011)*, Molybdate
transport system (M00189)*, TCA cycle (M00009)*, Menaquinone
biosynthesis (M00116), Succinate dehydrogenase prokaryotes
(M00149)*
5612vs378 TCA cycle (M00009)*, TCA cycle second carbon oxidation
(M00011)*, Spermidine/ putrescine transport system (M00299)*,
Succinate dehydrogenase prokaryotes (M00149)*, Menaquinone
biosynthesis (M00116), TCA cycle first carbon oxidation
(M00010), Molybdate transport system (M00189), Amino-acyl
tRNA biosynthesis prokaryotes (M00360)
6939vs378 Uridine monophosphate biosynthesis (M00051)*, Iron complex
(M00240)*, Energy-coupling factor (M00582), TCA cycle first
carbon oxidation (M00010), ABC-2 type transport system
(M00254)
7210vs378 TCA cycle (M00009)*, TCA cycle second carbon oxidation
(M00011), Amino-acyl tRNA biosynthesis eukaryotes (M00359),
Spermidine/ putrescine transport system (M00299), Adenine
ribonucleotide biosynthesis (M00049), Succinate dehydrogenase
prokaryotes (M00149), Amino-acyl tRNA biosynthesis
prokaryotes (M00360), Nickel complex (M00440), Molybdate
transport system (M00189), Menaquinone biosynthesis (M00116)

140
Modules listed in order of normalized enrichment score from most to least change in pathway
activity. * represents Gene Set Enrichment Analysis derived p-value<0.05. Bold font
indicates a pathway with known association to vraS-driven antibiotic resistance. Italics font
indicates a pathway with known association to vancomycin intermediate resistance
lacking the vanA operon. Green font indicates a pathway with known association to
linezolid resistance.

141
Table D-6. Leading-edge Pathways Associated with vraS-driven Resistance and
Responses
Panel Signature Module number
Up HG001van
(vancomycin
treated vs
untreated)
Leucine biosynthesis (M00432)*, Osmoprotectant
transport system (M00209)*, Lysine biosynthesis via
diaminopimelic acid aminotransferase (M00527)*, Biotin
biosynthesis BioW pathway (M00577), Biotin biosynthesis
(M00123), VraS-VraR cell-wall peptidoglycan synthesis
(M00480), Betaine biosynthesis (M00555), Lysine
biosynthesis via succinyl-diaminopimelic acid (M00016)
HG001fluc
(flucloxacillin
treated vs
untreated)
Inosine monophosphate biosynthesis (M00048)*, Lysine
biosynthesis via succinyl-diaminopimelic acid (M00016)*,
Dissimilatory nitrate reduction (M00530)*, D-Methionine
transport system (M00238)*, Histidine biosynthesis
(M00026)*, Lysine biosynthesis via diaminopimelic acid
aminotransferase (M00527)*, Osmoprotectant transport
system (M00209)*, Putative peptide (M00583)*
HG001line
(linezolid
treated vs
untreated)
Inosine monophosphate biosynthesis (M00048)*,
Dissimilatory nitrate reduction (M00530)*, Lysine
biosynthesis via diaminopimelic acid aminotransferase
(M00527), Putative peptide (M00583)*, Lysine
biosynthesis via succinyl-diaminopimelic acid (M00016),
Leucine biosynthesis (M00432), Serine biosynthesis
(M00020)
Down HG001van
(vancomycin
treated vs
untreated)
Menaquinone biosynthesis (M00116), Energy-coupling
factor (M00582), Uridine monophosphate biosynthesis
(M00051),
ABC-2 type (M00254), Succinate dehydrogenase
prokaryotes (M00149), Shikimate pathway (M00022),
Molybdate transport system (M00189)
HG001fluc
(flucloxacillin
treated vs
untreated)
Iron complex (M00240)*, Spermidine/ putrescine transport
system (M00299)*, Amino-acyl tRNA biosynthesis
prokaryotes (M00360)*, Nickel complex (M00440)*,
Amino-acyl tRNA biosynthesis eukaryotes (M00359),
Menaquinone biosynthesis (M00116), Energy-coupling
factor (M00582)
HG001line
(linezolid
treated vs
untreated)
Iron complex (M00240)*, Spermidine/ putrescine transport
system (M00299)*, Menaquinone biosynthesis
(M00116)*, Uridine monophosphate biosynthesis
(M00051), Amino-acyl tRNA biosynthesis prokaryotes
(M00360), Amino-acyl tRNA biosynthesis eukaryotes
(M00359), TCA first carbon oxidation (M00010)*,
Energy-coupling factor (M00582)
Modules listed in order of normalized enrichment score from most to least change in
pathway activity. * represents Gene Set Enrichment Analysis derived p-value<0.05. Bold

142
font indicates a pathway with known association to vraS-driven antibiotic resistance.
Italics font indicates a pathway with known association to vancomycin intermediate
resistance lacking the vanA operon. Underlined pathways indicate as oxacillin resistance
association. Green font indicates a pathway with known association to linezolid
resistance.

143
APPENDIX E. Significant Pathways Associated with Vancomycin Response in S. aureus
Panel Signature Module number
Up T8treatvsT8unt Oligopeptide (M00439), Methionine transport system (M00238), Threonine biosynthesis
(M00018), Energy-coupling factor (M00582), C5 isoprenoid biosynthesis mevalonate
pathway(M00095), Twin-arginine translocation system (M00336), Lysine biosynthesis via
succinyl-diaminopimelic acid (M00016), Formaldehyde assimilation ribulose monophosphate
(M00345), Osmoprotectant transport system (M00209), VraS-VraR cell-wall peptidoglycan
synthesis (M00480), Glyoxylate cycle (M00012), Betaine biosynthesis (M00555)
C1treatvsC1unt Threonine biosynthesis (M00018), VraDE transporter (M00737), Cationic antimicrobial
peptide resistance lysyl-phosphatidylglycerol (L-PG) synthase MprF (M00726), Cationic
antimicrobial peptide resistance VraFG transporter (M00730), Energy-coupling factor
(M00582), Oligopeptide (M00439), D-Methionine transport system (M00238), Bacitracin
transport system (M00314), Lysine biosynthesis via diaminopimelic acid aminotransferase
(M00527), Lysine biosynthesis via succinyl-diaminopimelic acid (M00016), GraS-GraR two-
component regulatory system (M00733), Riboflavin biosynthesis (M00125), Glyoxylate cycle
(M00012), Inositol phosphate metabolism (M00131)
PAfromT8treatvs
PAfromT8unt
Nickel complex (M00440), Iron complex (M00240), Spermidine/putrescine transport system
(M00299), Multidrug resistance efflux pump MepA (M00705), F-type ATPase prokaryotes
and chloroplasts (M00157), Glyoxylate cycle (M00012)
PAfromC1treatvs
PAfromC1unt
Iron complex (M00240), Cationic antimicrobial peptide resistance VraFG transporter
(M00730), Histidine biosynthesis (M00026), -Lactam resistance Bla system (M00627), GraS-GraR two-component regulatory system (M00733), Lysine biosynthesis via
diaminopimelic acid aminotransferase (M00527), Cationic antimicrobial peptide resistance,
lysyl-phosphatidylglycerol synthase MprF (M00726), Peptides/nickel transport system
(M00239), Betaine biosynthesis (M00555), Zinc transport system (M00242), Cytochrome c
oxidase (M00154), Biotin biosynthesis (M00577)

144
Panel Signature Module number
Down T8treatvsT8unt Amino-acyl tRNA biosynthesis prokaryotes (M00360), TCA cycle second carbon oxidation
(M00011), Dissimilatory nitrate reduction (M00530), Amino-acyl tRNA biosynthesis
eukaryotes (M00359), Ribosome bacteria (M00178), Vancomycin resistance (M00651), TCA
cycle (M00009), Nickel complex (M00440), Urea cycle (M00029), Siroheme biosynthesis
(M00846), Pyruvate oxidation (M00307), Arginine biosynthesis (M00844), Glucose-specific
II component (M00809), Cytochrome c oxidase (M00154), Succinate dehydrogenase
(M00149), F-type ATPase prokaryotes and chloroplasts (M00157), Cystine transport system
(M00234), Arginine biosynthesis (M00845), Trehalose-specific II component (M00270),
Lysine degradation (M00032), NreB-NreC dissimilatory nitrate/nitrite reduction two-
component regulatory system (M00483), Polyamine biosynthesis (M00134), Maltose and
glucose-specific II component (M00266), N,N'-Diacetylchitobiose transport system (M00606),
Glucose/mannose transport system (M00605)
C1treatvsC1unt Ribosome bacteria (M00178), Amino-acyl tRNA biosynthesis prokaryotes (M00360), Amino-
acyl tRNA biosynthesis eukaryotes (M00359), Dissimilatory nitrate reduction (M00530),
Nickel complex (M00440), Vancomycin resistance (M00651), Siroheme biosynthesis
(M00846), Iron complex (M00240), RNA polymerase bacteria (M00183), Pyruvate oxidation
(M00307), TCA cycle second carbon oxidation (M00011), Glucose-specific II component
(M00809), F-type ATPase prokaryotes and chloroplasts (M00157), Molybdate transport
system (M00189), NreB-NreC dissimilatory nitrate/nitrite reduction two-component
regulatory system (M00483), Phosphate acetyltransferase-acetate kinase pathway (M00579),
Cytochrome aa3-600 menaquinol oxidase (M00416), Fructose-specific II component
(M00273), Spermidine/putrescine transport system (M00299), ResE-ResD two-component
regulatory system (M00458)
PAfromT8treatvs
PAfromT8unt
Vancomycin resistance (M00651), Uridine monophosphate biosynthesis (M00051), Putative
ABC transport system (M00211), Isoleucine biosynthesis (M00570), ABC-2 type transport
system (M00254), Inosine monophosphate biosynthesis (M00048), Pyruvate oxidation
(M00307), Pentose phosphate pathway archaea (M00580), Maltose and glucose-specific II
component (M00266)

145
Panel Signature Module number
Down PAfromC1treatvs
PAfromC1unt
Vancomycin resistance (M00651), Uridine monophosphate biosynthesis (M00051), Ribosome
bacteria (M00178), Siroheme biosynthesis (M00846), Molybdate transport system (M00189),
Putative ABC transport system (M00211), Glucose-specific II component (M00809), ABC-2
type transport system (M00254), Glycolysis core module involving three-carbon compounds
(M00002), Pentose phosphate pathway, non-oxidative phase (M00007), Cytochrome aa3-600
menaquinol oxidase (M00416), Phosphate acetyltransferase-acetate kinase pathway
(M00579), LytS-LytR two-component regulatory system (M00492), Maltose and glucose-
specific II component (M00266), ResE-ResD two-component regulatory system (M00458)
Modules listed in order of normalized enrichment score from most to least change in pathway activity with all pathways
achieving a Gene Set Enrichment Analysis derived p-value<0.05. Italics font indicates a pathway with known association to
vancomycin intermediate resistance lacking the vanA operon. Red font are pathways associated with vancomycin resistance via
the vanA operon.

146
APPENDIX F. KEGG Pathways Used in Pathway Signature Generation
Category Subcategory No.a Module Descriptionsa
Carbohydrate and lipid
metabolism pathway
modules
Central
carbohydrate
metabolism
M00001 Glycolysis (Embden-Meyerhof pathway)
M00002 Glycolysis core module involving 3-carbon compounds
M00003 Gluconeogenesis
M00004 Pentose phosphate cycle
M00005 Phosphoribosyl diphosphate biosynthesis
M00006 Pentose phosphate pathway, oxidative phase
M00007 Pentose phosphate pathway non-oxidative phase
M00008 Entner-Doudoroff pathway
M00009 Citrate cycle (TCA cycle, Kreb’s cycle)
M00010 Citrate cycle first carbon oxidation
M00011 Citrate cycle second carbon oxidation
M00307 Pyruvate oxidation
M00580 Pentose phosphate pathway archaea
Other carbohydrate
metabolism
M00012 Glyoxylate cycle
M00549 Nucleotide sugar biosynthesis
M00632 Galactose degradation (Leloir pathway)
Fatty acid
metabolism
M00082 Fatty acid biosynthesis initiation
M00083 Fatty acid biosynthesis elongation
M00086 -Oxidation acyl-CoA synthesis
M00087 -Oxidation
Lipid metabolism M00093 Phosphatidylethanolamine biosynthesis
M00131 Inositol phosphate metabolism
Terpenoid backbone
biosynthesis
M00095 C5 isoprenoid biosynthesis (mevalonate pathway)
M00096 C5 isoprenoid biosynthesis (non-mevalonate pathway)
M00364 C10-C20 isoprenoid biosynthesis bacteria
M00365 C10-C20 isoprenoid biosynthesis archaea
M00367 C10-C20 isoprenoid biosynthesis non-plant eukaryotes

147
Category Subcategory No.a Module Descriptionsa
Nucleotide and amino acid
metabolism pathway
modules
Purine metabolism
M00048 Inosine monophosphate biosynthesis
M00049 Adenine ribonucleotide biosynthesis
M00050 Guanine ribonucleotide biosynthesis
Pyrimidine
metabolism
M00051 Uridine monophosphate biosynthesis
M00052 Pyrimidine ribonucleotide biosynthesis
M00053 Pyrimidine deoxyribonuleotide biosynthesis
M00089 Triacylglycerol biosynthesis
M00098 Acylglycerol degradation
Serine and threonine
metabolism
M00018 Threonine biosynthesis
M00020 Serine biosynthesis
M00555 Betaine biosynthesis
Cysteine and
methionine
metabolism
M00021 Cysteine biosynthesis
M00034 Methionine salvage pathway
M00035 Methionine degradation
Branched-chain
amino acid
metabolism
M00019 Valine/isoleucine biosynthesis
M00036 Leucine degradation
M00432 Leucine biosynthesis
M00570 Isoleucine biosynthesis
Lysine metabolism
M00016 Lysine biosynthesis (succinyl-diaminopimelic acid)
M00032 Lysine degradation
M00527 Lysine biosynthesis (diaminopimelic acid
aminotransferase)
Arginine and proline
metabolism
M00015 Proline biosynthesis
M00028 Ornithine biosynthesis
M00029 Urea cycle
M00844 Arginine biosynthesis (ornithine => arginine)
M00845 Arginine biosynthesis (glutamate => arginine)
Polyamine
biosynthesis
M00134 Polyamine biosynthesis
M00135 GABA biosynthesis eukaryotes
Histidine
metabolism
M00026 Histidine biosynthesis
M00045 Histidine degradation

148
Category Subcategory No.a Module Descriptionsa
Nucleotide and amino acid
metabolism pathway
modules
Aromatic amino acid
metabolism
M00022 Shikimate pathway
M00023 Tryptophan biosynthesis
M00024 Phenylalanine biosynthesis
M00025 Tyrosine biosynthesis
Other amino acid
metabolism M00027 GABA (gamma-Aminobutyrate) shunt
Cofactor and vitamin
biosynthesis
M00115 NAD biosynthesis
M00116 Menaquinone biosynthesis
M00119 Pantothenate biosynthesis
M00120 Coenzyme A biosynthesis
M00123 Biotin biosynthesis
M00125 Riboflavin biosynthesis
M00126 Tetrahydrofolate biosynthesis
M00140 C1-unit interconversion prokaryotes
M00141 C1-unit interconversion eukaryotes
M00577 Biotin biosynthesis BioW pathway
M00842 Tetrahydrobiopterin biosynthesis
M00846 Siroheme biosynthesis
Energy metabolism
pathway modules
Carbon fixation
M00166 Reductive pentose phosphate cycle
M00375 Hydroxypropionate-hydroxybutylate cycle
M00579 Phosphate acetyltransferase-acetate kinase
Nitrogen metabolism M00530 Dissimilatory nitrate reduction
Sulfur metabolism M00176 Assimilatory sulfate reduction
Genetic information
processing structural
complexes
Methane metabolism M00345 Formaldehyde assimilation ribulose monophosphate
DNA M00260 DNA polymerase III complex, bacteria
RNA M00183 RNA polymerase bacteria
M00394 RNA degradosome
Ribosome M00178 Ribosome bacteria

149
Category Subcategory No.a Module Descriptionsa
Environmental information
processing structural
complexes
Mineral and organic
ion transport system
M00188 Glutathione biosynthesis
M00189 Molybdate transport system
M00190 Iron(III) transport system
M00209 Osmoprotectant transport system
M00299 Spermidine/ putrescine transport system
Bacterial secretion
system
M00335 Secretion (sec) system
M00336 Twin-arginine translocation (Tat) system
M00429 Competence-related DNA transformation transporter
Phosphotransferase
system (PTS) II
component
M00266 Maltose and glucose-specific
M00267 N-acetylglucosamine-specific
M00268 Arbutin-like
M00270 Trehalose-specific
M00273 Fructose-specific
M00274 Mannitol-specific
M00279 Galactitol-specific
M00281 Lactose-specific
M00283 Ascorbate-specific
M00809 Glucose- specific
Environmental information
processing
ABC-2 type and other
transport systems
M00251 Teichoic acid
M00254 ABC-2 type
M00257 Hemin
M00258 Putative ABC
M00314 Bacitracin
M00583 Putative peptide
M00731 Bacitracin
M00732 Cationic antimicrobial peptide
M00817 Lantibiotic transport system

150
Category Subcategory No.a Module Descriptionsa
Environmental
information
processing
Metallic cation, iron-
siderophore and
vitamin B12 transport
system
M00240 Iron complex
M00242 Zinc
M00581 Biotin transport system
M00582 Energy-coupling factor
M00792 Manganese/zinc
Peptide and nickel
transport system
M00239 Peptides/nickel
M00439 Oligopeptide
M00440 Nickel
Phosphate and amino
acid transport system
M00222 Phosphate
M00223 Phosphonate
M00234 Cystine
M00238 D-Methionine transport system
Saccharide, polyol,
and lipid transport
system
M00196 Multiple sugar transport system
M00211 Putative ABC
M00491 Arabinogalactan oligomer/maltooligosaccharide
M00605 Glucose/mannose transport system
M00606 N,N'-Diacetylchitobiose transport system
Energy metabolism
structural complexes ATP synthesis
M00149 Succinate dehydrogenase prokaryotes
M00153 Cytochrome D ubiquinol oxidase
M00154 Cytochrome C oxidase
M00157 F-type ATPase prokaryotes and chloroplasts
M00416 Cytochrome aa3-600 menaquinol oxidase
Metabolism
functional set
modules
Amino-acyl tRNA M00359 Amino-acyl tRNA biosynthesis eukaryotes
M00360 Amino-acyl tRNA biosynthesis prokaryotes
Nucleotide sugar M00361 Nucleotide sugar biosynthesis eukaryotes
M00362 Nucleotide sugar biosynthesis prokaryotes

151
Category Subcategory No.a Module Descriptionsa
Environmental
information
processing functional
set modules
Drug efflux
transporter/pump M00737 Bacitracin resistance VraDE transporter
Two-component
regulatory system
M00434 PhoR-PhoB (phosphate starvation response)
M00454 KdpD-KdpE (potassium transport)
M00458 ResE-ResD (aerobic and anaerobic respiration)
M00459 VicK-VicR (cell wall metabolism)
M00468 SaeS-SaeR (staphylococcal virulence regulation)
M00479 DesK-DesR (membrane lipid fluidity regulation)
M00480 VraS-VraR (cell wall peptidoglycan synthesis)
M00483 NreB-NreC (dissimilatory nitrate/nitrite reduction)
M00492 LytS-LytR
M00495 AgrC-AgrA (exoprotein synthesis)
M00716 ArlS-ArlR (virulence regulation)
M00733 GraS-GraR (cationic antimicrobial peptide transport)
M00734 BraS-BraR (bacitracin transport)
Signature gene set
module
Metabolic capability M00616 Nitrate assimilation
Drug resistance
M00625 Methicillin resistance
M00627 -Lactam resistance Bla system
M00651 Vancomycin resistance
M00700 Multi-drug resistance efflux pump AbcA
M00702 Multi-drug resistance efflux pump NorB
M00704 Tetracycline resistance efflux pump Tet38
M00705 Multi-drug resistance efflux pump MepA
M00725 Cationic antimicrobial peptide resistance dltABCD operon
M00726 Cationic antimicrobial peptide resistance lysyl-
phosphatidylglycerol synthase MprF
M00729 Fluoroquinolone resistance
M00730 Cationic antimicrobial peptide resistance VraFG transporter
M00742 Aminoglycoside resistance
No. = KEGG Module number, a Listed respectively.