pathological non-response to chemotherapy in a neoadjuvant
TRANSCRIPT
LUND UNIVERSITY
PO Box 117221 00 Lund+46 46-222 00 00
Pathological non-response to chemotherapy in a neoadjuvant setting of breast cancer:an inter-institutional study
Balmativola, D.; Marchio, C.; Maule, M.; Chiusa, L.; Annaratone, L.; Maletta, F.; Montemurro,F.; Kulka, J.; Figueiredo, P.; Varga, Z.; Liepniece-Karele, I.; Cserni, G.; Arkoumani, E.;Amendoeira, I.; Callagy, G.; Reiner-Concin, A.; Cordoba, A.; Bianchi, S.; Decker, T.; Glaeser,D.; Focke, C.; van Diest, P.; Grabau, Dorthe; Lips, E.; Wesseling, J.; Arisio, R.; Medico, E.;Wells, C.; Sapino, A.Published in:Breast Cancer Research and Treatment
DOI:10.1007/s10549-014-3192-3
2014
Link to publication
Citation for published version (APA):Balmativola, D., Marchio, C., Maule, M., Chiusa, L., Annaratone, L., Maletta, F., Montemurro, F., Kulka, J.,Figueiredo, P., Varga, Z., Liepniece-Karele, I., Cserni, G., Arkoumani, E., Amendoeira, I., Callagy, G., Reiner-Concin, A., Cordoba, A., Bianchi, S., Decker, T., ... Sapino, A. (2014). Pathological non-response tochemotherapy in a neoadjuvant setting of breast cancer: an inter-institutional study. Breast Cancer Researchand Treatment, 148(3), 511-523. https://doi.org/10.1007/s10549-014-3192-3Total number of authors:29
General rightsUnless other specific re-use rights are stated the following general rights apply:Copyright and moral rights for the publications made accessible in the public portal are retained by the authorsand/or other copyright owners and it is a condition of accessing publications that users recognise and abide by thelegal requirements associated with these rights. • Users may download and print one copy of any publication from the public portal for the purpose of private studyor research. • You may not further distribute the material or use it for any profit-making activity or commercial gain • You may freely distribute the URL identifying the publication in the public portal
Read more about Creative commons licenses: https://creativecommons.org/licenses/Take down policyIf you believe that this document breaches copyright please contact us providing details, and we will removeaccess to the work immediately and investigate your claim.
Download date: 10. Oct. 2021
PRECLINICAL STUDY
Pathological non-response to chemotherapy in a neoadjuvantsetting of breast cancer: an inter-institutional study
D. Balmativola • C. Marchio • M. Maule • L. Chiusa • L. Annaratone •
F. Maletta • F. Montemurro • J. Kulka • P. Figueiredo • Z. Varga •
I. Liepniece-Karele • G. Cserni • E. Arkoumani • I. Amendoeira •
G. Callagy • A. Reiner-Concin • A. Cordoba • S. Bianchi • T. Decker •
D. Glaser • C. Focke • P. van Diest • D. Grabau • E. Lips • J. Wesseling •
R. Arisio • E. Medico • C. Wells • A. Sapino
Received: 25 August 2014 / Accepted: 31 October 2014 / Published online: 14 November 2014
� The Author(s) 2014. This article is published with open access at Springerlink.com
Abstract To identify markers of non-response to neo-
adjuvant chemotherapy (NAC) that could be used in the
adjuvant setting. Sixteen pathologists of the European
Working Group for Breast Screening Pathology reviewed
the core biopsies of breast cancers treated with NAC and
recorded the clinico-pathological findings (histological
type and grade; estrogen, progesterone receptors, and
HER2 status; Ki67; mitotic count; tumor-infiltrating lym-
phocytes; necrosis) and data regarding the pathological
response in corresponding surgical resection specimens.
Analyses were carried out in a cohort of 490 cases by
comparing the groups of patients showing pathological
complete response (pCR) and partial response (pPR) with
the group of non-responders (pathological non-response:
pNR). Among other parameters, the lobular histotype and
the absence of inflammation were significantly more
common in pNR (p \ 0.001). By ROC curve analyses, cut-
off values of 9 mitosis/2 mm2 and 18 % of Ki67-positive
cells best discriminated the pNR and pCR ? pPR catego-
ries (p = 0.018 and \ 0.001, respectively). By multivari-
able analysis, only the cut-off value of 9 mitosis
discriminated the different response categories (p = 0.036)
in the entire cohort. In the Luminal B/HER2- subgroup, a
mitotic count \9, although not statistically significant,
showed an OR of 2.7 of pNR. A lobular histotype and the
absence of inflammation were independent predictors of
pNR (p = 0.024 and \0.001, respectively). Classical
morphological parameters, such as lobular histotype andElectronic supplementary material The online version of thisarticle (doi:10.1007/s10549-014-3192-3) contains supplementarymaterial, which is available to authorized users.
D. Balmativola � C. Marchio � L. Chiusa � L. Annaratone �F. Maletta � A. Sapino (&)
Division of Pathology, Department of Medical Sciences,
University of Turin, via Santena 7, Turin, Italy
e-mail: [email protected]
M. Maule
Cancer Epidemiology Unit, CeRMS and CPO-Piemonte,
Department of Medical Sciences, University of Turin, Turin,
Italy
F. Montemurro
Unit of Investigative Clinical Oncology (INCO), Institute for
Cancer Research and Treatment (IRCCs), Candiolo, Italy
J. Kulka
2nd Department of Pathology, Semmelweis University,
1091 Budapest, Hungary
P. Figueiredo
Laboratorio De Histopatologica, Centro Regional De Oncologia
De Coimbra, Coimbra, Portugal
Z. Varga
Institute of Surgical Pathology, University Hospital Zurich,
8091 Zurich, Switzerland
I. Liepniece-Karele
State Pathology Center, Riga East Clinical University Hospital,
Riga, Latvia
G. Cserni
Department of Pathology, Bacs-Kiskun County Teaching
Hospital, Nyiri ut 38, 6000 Kecskemet, Hungary
E. Arkoumani
Michael Letcher Department of Cellular Pathology, The Princess
Alexandra Hospital, Harlow, Essex, UK
I. Amendoeira
Instituto de Patologia e Imunologia Molecular da Universidade
do Porto e Servico de Anatomia Patologica, Hospital S Joao,
4200 Porto, Portugal
123
Breast Cancer Res Treat (2014) 148:511–523
DOI 10.1007/s10549-014-3192-3
inflammation, confirmed their predictive value in response
to NAC, particularly in the Luminal B/HER2- subgroup,
which is a challenging breast cancer subtype from a ther-
apeutic point of view. Mitotic count could represent an
additional marker but has a poor positive predictive value.
Keywords Breast cancer � Neoadjuvant therapy � Non-
response � Mitotic count � Proliferation
Introduction
Breast cancer is a heterogeneous disease and the different
therapeutic modalities used for breast cancer patients reflect
this heterogeneity. As highlighted in the 13th St. Gallen
International Breast Cancer Conference [1], endocrine
therapy (often used alone) is recommended for Luminal
A-like breast cancers, anti-HER2 therapy is the most crucial
intervention in HER2 positive disease, whereas the only
available approach for triple-negative tumors is the use of
cytotoxic chemotherapy. Luminal B/HER2- carcinomas
represent an intermediate entity from a clinico-therapeutic
point of view as endocrine therapy is recommended for all
patients and cytotoxic therapy for most of them [1]. Sig-
nificant efforts are currently being employed to discriminate
patients who will benefit from chemotherapy. Multi-gene
assays appear to help recognize patients with Luminal dis-
ease for whom chemotherapy is not effective, i.e, patients
with a low Recurrence Score (RS) by Oncotype DX [2, 3]
and those with a ‘‘good prognosis signature’’ with the
70-gene signature assay [4]. Similar results were obtained in
the neoadjuvant setting: no or very few pathological com-
plete responses (pCR) to neoadjuvant chemotherapy (NAC)
were observed among patients with low risk of recurrence
(ROR) based on PAM50 [5]. Additionally, both the 70-gene
good prognosis signature and a low 21-gene RS predict a
low probability of pCR [6, 7]. The proliferative activity of
tumors as assessed with immunohistochemical detection of
the cell-cycle-specific antigen Ki67 has been extensively
studied [8–12] and is presently one of the parameters used
to address systemic adjuvant therapy for patients with
Luminal breast cancers [13]. A recent study has shown a
beneficial effect of the addition of chemotherapy to hor-
mone therapy in Luminal B/HER2- carcinomas with a high
proliferative index (Ki67 [ 32 %) [14]. A significant
impact in breast cancer prognosis has also been suggested
for the mitotic count [15, 16], but few studies have con-
sidered its predictive value in the response to chemotherapy
[17, 18]. Cytotoxic drugs, such as taxanes, which target
microtubules, are believed to be more effective on cells that
proliferate rapidly. However, it is known that the mitotic
count is low in many chemosensitive human cancers [19].
Despite this observation, no studies have been carried out to
solve this specific issue in breast cancer.
The neoadjuvant setting offers an invaluable opportunity
to test the response to therapy, considering that the selec-
tion of regimens for NAC generally follows guidelines
similar to those applied in the conventional adjuvant setting
[20]. However, the majority of studies have focused their
attention on pCR as the primary endpoint for response to
G. Callagy
Department of Pathology, Clinical Sciences Institute, National
University of Ireland, Costello Road, Galway, Ireland
A. Reiner-Concin
Department of Pathology, Danube Hospital, Vienna, Austria
A. Cordoba
Servicio de Anatomıa Patologica, Complejo Hospitalario de
Navarra, Pamplona, Navarra, Spain
S. Bianchi
Division of Pathological Anatomy, Department of Surgery and
Translational Medicine, AOU Careggi, Florence, Italy
T. Decker � D. Glaser � C. Focke
Department of Pathology, Dietrich Bonhoeffer Medical Centre,
Allendestraße 30, 17036 Neubrandenburg, Germany
P. van Diest
Department of Pathology, University Medical Center Utrecht,
3508 GA Utrecht, The Netherlands
D. Grabau
Department of Pathology, Skane University Hospital, University
of Lund, 221 85 Lund, Sweden
E. Lips
Department of Molecular Pathology, The Netherlands Cancer
Institute, Amsterdam, The Netherlands
E. Lips � J. Wesseling
Division of Pathology, Cancer Systems Biology Centre and
Cancer Genomics Centre, The Netherlands Cancer Institute,
Amsterdam, The Netherlands
R. Arisio
Division of Pathology, Sant’Anna Hospital, Azienda Ospedaliera
Citta della Salute e della Scienza di Torino, Turin, Italy
E. Medico
Laboratory of Oncogenomics, Department of Oncology, Institute
for Cancer Research and Treatment (IRCCs), Candiolo, Italy
C. Wells
Department of Pathology, University College Hospital, London,
UK
512 Breast Cancer Res Treat (2014) 148:511–523
123

chemotherapy because of its prognostic value [21, 22].
Thus, statistical analyses performed on neoadjuvant studies
tend to group together partial response and non-response to
treatment. To our knowledge, studies focusing on the non-
responsive breast cancer category are not on record.
Taking all these data together, the main goal of the
present study was to identify markers of non-response to
NAC that could be used in the adjuvant setting, in partic-
ular markers for the Luminal B/HER2- category. The
analyses were performed by comparing the group of
patients showing some response (from partial to complete)
to NAC with the group of patients lacking any response.
Furthermore, we investigated for the first time the potential
value of the mitotic index in offering additional informa-
tion about the likelihood of non-response to treatment with
taxane-based regimens.
Patients and methods
Study design
Sixteen pathologists of the European Working Group for
Breast Screening Pathology from different European
Institutions (Citta della Salute e della Scienza di Torino,
Turin, Italy; 2nd Department of Pathology, Semmelweis
University, Budapest, Hungary; Centro Regional De Onc-
ologia De Coimbra, Coimbra, Portugal; University Hospi-
tal Zurich, Switzerland; State Pathology Center, Riga,
Latvia; Bacs-Kiskun County Teaching Hospital, Ke-
cskemet, Hungary; Hospital S. Joao, Porto, Portugal;
Clinical Sciences Institute, Galway, Ireland; Donauspital
am SMZO, Vienna, Austria; Complejo Hospitalario de
Navarra, Pamplona, Navarra, Spain; AOU Careggi, Flor-
ence, Italy; Dietrich Bonhoeffer Medical Centre, Neu-
brandenburg, Germany; University Medical Center
Utrecht, Utrecht, The Netherlands; Skane University Hos-
pital, Lund, Sweden; The Netherlands Cancer Institute,
Amsterdam, The Netherlands; The Princess Alexandra
Hospital, Harlow, Essex, United Kingdom; University
College Hospital, London, United Kingdom) were asked to
participate to the study. These pathologists reviewed the
core biopsy histology slides pertaining to patients with
breast cancer treated with NAC at their Institutions. The
number of core biopsies available for each patient ranged
from 2 to 4, depending on the Institution protocol. The
single Institutions recorded a list of clinico-pathological
features in a dedicated database, as specified below.
Data collection and definitions
The data recorded were as follows: (i) in the pre-treatment
biopsy: the histological type and grade [23], mitotic count,
Ki67 proliferation index, presence of inflammation, pre-
sence of necrosis, Estrogen Receptor (ER), Progesterone
Receptor (PgR), and HER2 status (based on both the
immunostaining score and in situ hybridization analysis for
score 2?); (ii) in the histological examination of the post-
treatment surgical specimens, the degree of response to
therapy was categorized following Pinder et al. [24]
(Supplementary Table 1) in pathological complete
response (pCR) if no residual invasive tumor was found
(in situ carcinoma may be present), pathological partial
response (pPR) if residual disease or minor signs of
response were present on the surgical specimens compared
to the tumor cellularity of the pre-treatment core biopsies,
pathological non-response (pNR) if no evidence of
response to therapy was detected (the presence of lymph
node metastasis was not taken into account); and (iii) from
the clinical records: the diameter of the tumor before NAC
and the type of NAC. The response in lymph nodes was
evaluated as detailed in Supplementary Table 1.
With regard to the definition of molecular subtypes, we
referred to the St. Gallen recommendations from 2013 [1]
that include five categories (Luminal A, Luminal
B/HER2-, Luminal B/HER2?, HER2? and triple nega-
tive). In particular, the Luminal B/HER2- category
included ER positive carcinomas with[14 % of Ki67 [13]
and/or PgR \20 % [25].
To define the methods to assess mitoses and Ki67, the
participants had a preliminary meeting. The mitotic figures
were counted in 10 high power fields of each core biopsy if
possible, and the mitotic count was reported as the mean
value. The results were then normalized as the number of
mitosis per 2 mm2, i.e., an area equal to 10 fields at high
magnification (409) with a 0.51-mm objective diameter.
Ki67 scoring (all centers used the MIB-1 antibody clone)
was performed by counting a range of 100–500 cells
(depending on the cellularity of the specimen), including
also hot spot areas.
Inflammation was defined in two ways: (i) presence/
absence of any clearly detectable tumor-infiltrating lym-
phocytes (TILs) within tumor cells (intra-tumoral) and/or
stroma (stromal) at H&E; (ii) percentage of stromal TILs
(st-TILs%) as recently recommended [26] (i.e., area occu-
pied by mononuclear inflammatory cells over total intra-
tumoral stromal area).
The final cohort comprised 506 cases, 490 of which had
information available about their response to NAC.
Statistical analysis
For the purpose of defining the tumors that will not benefit
from chemotherapy, univariate analyses were conducted by
dividing the cohort of patients into two sets: pNR and
pCR ? pPR.
Breast Cancer Res Treat (2014) 148:511–523 513
123

Differences in the distribution of the characteristics
between the specimens of the patients with pCR or pPR
and the patients with pNR were evaluated using Pearson’s
Chi-Square Test and Fisher’s Exact Test for comparison of
nominal variables and performing independent sample
Nonparametric Test (Mann–Whitney U-Test) for compar-
ison with continuous variables.
The cut-offs for Ki67 %, for the number of mitoses, and
for st-TILs% that are able to discriminate the response to
treatment (pNR vs pCR ? pPR) were assessed for the
entire cohort of breast cancer patients by receiver operating
characteristic (ROC) curve analysis, in which the sensi-
tivity (SE) is plotted as a function of 1-specificity (1-SP).
The Youden Index (J), one of the main summary statistics
of the ROC curve, defines the maximum potential effec-
tiveness of a biomarker. J can be formally defined as
J = maxc {SE (c) ? SP (c) - 1}. The cut-off value that
achieves this maximum is referred to as the optimal cut-off
point that optimizes the biomarker’s discriminating power
when the sensitivity and specificity bear equal weight [27,
28].
The interactions between the response to treatment
(pNR vs pCR ? pPR) and the variables statistically sig-
nificant at univariate analysis were tested in the entire
cohort and in the Luminal B/HER2- cohort in a multi-
variable binary regression model.
All reported p values (p) were two-sided and p \ 0.05
was considered to be statistically significant. All analyses
were carried out using SPSS version 20 (SPSS Inc, Chi-
cago, IL, USA) and STATA version 12.0 (Stata Corpora-
tion, College Station, Texas) statistical software. This
article was written in accordance with the guidelines of the
Reporting Recommendations for Tumor Marker Prognostic
Studies (REMARK criteria) [29].
Results
Entire cohort analysis
The clinical and histopathological features of the entire
population are summarized in Table 1. The analyses of
response to treatment were performed either considering
primary tumor and lymph node response (454 cases) or
tumor response only (490 cases). No statistically significant
differences in terms of final distribution in response cate-
gories were observed between these separate analyses
(Supplementary Tables 2, 3, and 4); therefore, we took into
account the response on primary tumors only, which
allowed us to perform the analysis in a larger number of
cases (Supplementary Table 4).
To evaluate the impact of the heterogeneity of standard
of care in the different Institutions, we first analyzed by
Chi-Square Test the difference of response taking into
account the different treatment protocols. Twenty-one
different treatment schemes were reported. We decided to
cluster them in 3 main groups: 259 cases with taxanes, 135
without taxanes, and 87 with Herceptin. The two response
categories (pNR vs pCR ? pPR) were not significantly
different in terms of treatment protocols as reported in
Table 2. In particular, by excluding HER2 ? carcinomas
treated with Herceptin, we found that taxanes were used in
association with other cytotoxic drugs in 217 cases (66 %)
out of 328 patients with a pCR ? pPR. Of 66 patients with
a pNR, taxanes were used in the chemotherapy protocols in
42 cases (64 %).
With regard to tumor size before NAC, no differences
were observed between pNR and pCR ? pPR (mean val-
ues 35.3 mm (SD: 16.3 mm) and 37.6 mm (SD: 22.2 mm),
respectively; p = 0.881). Similarly, tumor necrosis was
found at a similar rate in both response groups.
The tumors in the patients with pNR were less fre-
quently of high histological grade (G3) (25 vs 45 %) and
more frequently ER ? (81 vs 63 %), PgR ? (72 vs 53 %)
and HER2- (89 vs 77 %) than were the tumors in the
pCR ? pPR category (Table 2). A lobular histotype was
also more common in the pNR than in the pCR ? pPR
category (19 vs 6 %). On the contrary, the presence of TILs
was significantly less common in the pNR (51 %) than in
the pCR ? pPR (77 %) category (Table 2). Similarly, the
st-TILs % was differently distributed within pNR and
pCR ? pPR categories (mean values: 7 vs 12 %; SDs:
12.42 vs 17.51 %) (p = 0.002) (Supplementary Fig. 1a).
Based on ROC curve analysis, the area under the curve was
0.639 (95 % CI 0.544–0.734) and the cut-off values of 1 %
of st-TILs (J: 0.297) significantly discriminated the pNR
from pCR ? pPR group. In particular, to discriminate pNR
tumors, a TILs% B1 had a sensitivity of 64 %, a specificity
of 64 %, a positive predictive value (PPV) of 21 %, and a
negative predictive value (NPV) of 92 % (Supplementary
Fig. 1c).
Both the mitotic numbers and Ki67 percentages were
differently distributed in the pNR and pCR ? pPR cate-
gories (mean values: 8.5 vs 11.3 for mitosis and 27.9 vs
38.4 % for Ki67; SDs: 10.2 vs 12.1 for mitosis and 14.9 vs
25.7 % for Ki67) (p = 0.046 and 0.001, respectively)
(Fig. 1). To determine the cut-offs for proliferation that
best discriminate between the pNR and pCR ? pPR cate-
gories, we performed ROC curve analyses (Fig. 2a, b). The
area under the curve was 0.575 (95 % CI 0.506–0.644) for
mitoses and 0.635 (95 % CI 0.555–0.715) for Ki67. The
cut-off values of 9 mitosis/2 mm2 (J: 0.169) and 18 % of
Ki67 positivity (J: 0.253) significantly discriminated the
pNR from pCR ? pPR groups (Fisher’s exact test
p = 0.018 and \0.001, respectively). In particular, to dis-
criminate pNR tumors, the cut-off of 9 mitosis had a
514 Breast Cancer Res Treat (2014) 148:511–523
123
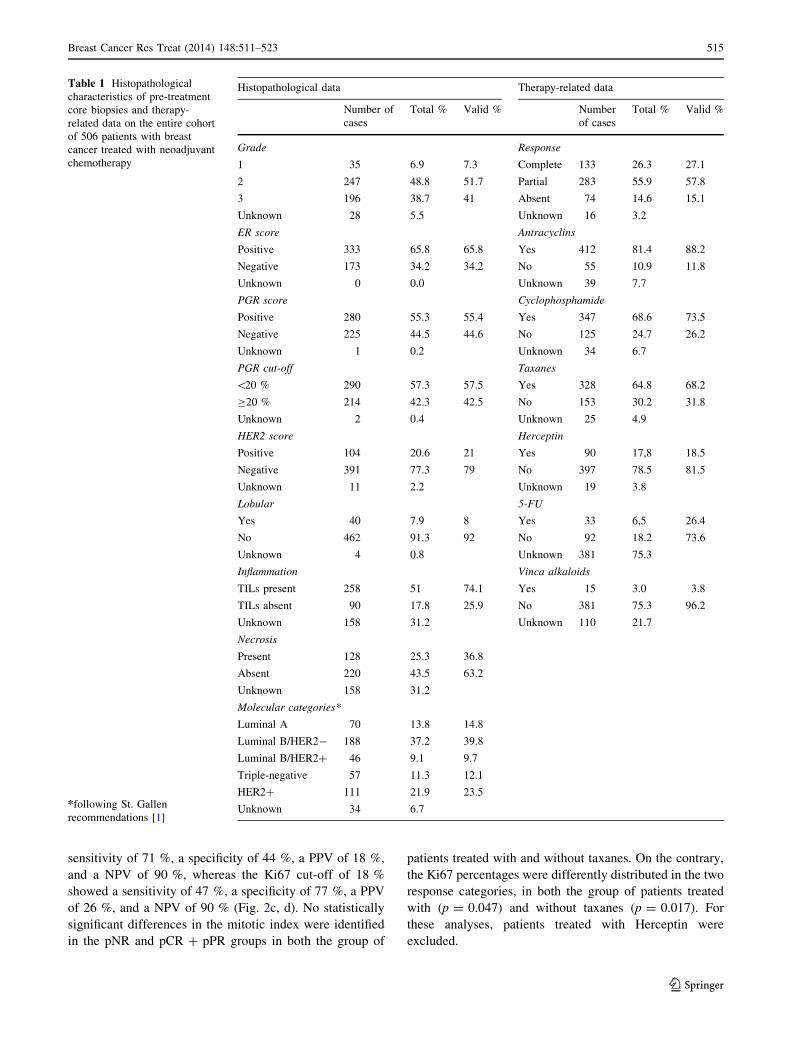
sensitivity of 71 %, a specificity of 44 %, a PPV of 18 %,
and a NPV of 90 %, whereas the Ki67 cut-off of 18 %
showed a sensitivity of 47 %, a specificity of 77 %, a PPV
of 26 %, and a NPV of 90 % (Fig. 2c, d). No statistically
significant differences in the mitotic index were identified
in the pNR and pCR ? pPR groups in both the group of
patients treated with and without taxanes. On the contrary,
the Ki67 percentages were differently distributed in the two
response categories, in both the group of patients treated
with (p = 0.047) and without taxanes (p = 0.017). For
these analyses, patients treated with Herceptin were
excluded.
Table 1 Histopathological
characteristics of pre-treatment
core biopsies and therapy-
related data on the entire cohort
of 506 patients with breast
cancer treated with neoadjuvant
chemotherapy
*following St. Gallen
recommendations [1]
Histopathological data Therapy-related data
Number of
cases
Total % Valid % Number
of cases
Total % Valid %
Grade Response
1 35 6.9 7.3 Complete 133 26.3 27.1
2 247 48.8 51.7 Partial 283 55.9 57.8
3 196 38.7 41 Absent 74 14.6 15.1
Unknown 28 5.5 Unknown 16 3.2
ER score Antracyclins
Positive 333 65.8 65.8 Yes 412 81.4 88.2
Negative 173 34.2 34.2 No 55 10.9 11.8
Unknown 0 0.0 Unknown 39 7.7
PGR score Cyclophosphamide
Positive 280 55.3 55.4 Yes 347 68.6 73.5
Negative 225 44.5 44.6 No 125 24.7 26.2
Unknown 1 0.2 Unknown 34 6.7
PGR cut-off Taxanes
\20 % 290 57.3 57.5 Yes 328 64.8 68.2
C20 % 214 42.3 42.5 No 153 30.2 31.8
Unknown 2 0.4 Unknown 25 4.9
HER2 score Herceptin
Positive 104 20.6 21 Yes 90 17,8 18.5
Negative 391 77.3 79 No 397 78.5 81.5
Unknown 11 2.2 Unknown 19 3.8
Lobular 5-FU
Yes 40 7.9 8 Yes 33 6,5 26.4
No 462 91.3 92 No 92 18.2 73.6
Unknown 4 0.8 Unknown 381 75.3
Inflammation Vinca alkaloids
TILs present 258 51 74.1 Yes 15 3.0 3.8
TILs absent 90 17.8 25.9 No 381 75.3 96.2
Unknown 158 31.2 Unknown 110 21.7
Necrosis
Present 128 25.3 36.8
Absent 220 43.5 63.2
Unknown 158 31.2
Molecular categories*
Luminal A 70 13.8 14.8
Luminal B/HER2- 188 37.2 39.8
Luminal B/HER2? 46 9.1 9.7
Triple-negative 57 11.3 12.1
HER2? 111 21.9 23.5
Unknown 34 6.7
Breast Cancer Res Treat (2014) 148:511–523 515
123

Molecular subtype analysis
According to the St. Gallen recommendations [1], 70 tumors
were Luminal A-like, 188 were Luminal B/HER2-, 46 were
Luminal B/HER2?, 57 were HER2?, and 111 were triple-
negative (Table 1). To evaluate the reliability of our data, we
first assessed the distribution of patients with pCR in the
different molecular subtypes. As expected, the lowest rate of
Table 2 Treatment protocols
and distribution of
histopathological findings
obtained from pre-treatment
core biopsies in patients with no
response (pNR) and with
complete and partial response
(pCR ? pPR) to neoadjuvant
chemotherapy in 490 cases
pNR (n = 74) pCR ? pPR (n = 416) p values
Number
of cases
Total % Valid % Number
of cases
Total % Valid %
Treatment protocols
with taxanes 42 56.8 57.5 217 52.2 53.2 0.693
without taxanes 24 32.4 32.9 111 26.7 27.2
with Herceptin 7 9.5 9.6 80 19.2 19.6
Unknown 1 1.4 8 1.9
Grade
1 6 8.1 8.3 27 6.5 6.9 0.007
2 48 64.9 66.7 189 45.4 48.3
3 18 24.3 25.0 175 42.1 44.8
Unknown 2 2.7 25 6.0
ER score
Positive 60 81.1 81.1 261 62.7 62.7 0.002
Negative 14 18.9 18.9 155 37.3 37.3
Unknown 0 0.0 0 0.0
PgR score
Positive 53 71.6 71.6 219 52.6 52.8 0.003
Negative 21 28.4 28.4 196 47.1 47.2
Unknown 0 0.0 1 0.2
PGR cut-off
\20 % 30 40.5 40.5 249 59.9 60.1 0.002
C 20 % 44 59.5 59.5 165 39.7 39.9
Unknown 0 0.0 2 0.5
HER2 score
Positive 8 10.8 11.1 93 22.4 22.9 0.027
Negative 64 86.5 88.9 314 75.5 77.1
Unknown 2 2.7 9 2.2
Lobular
Yes 14 18.9 19.2 24 5.8 5.8 \0.001
No 59 79.7 80.8 389 93.5 94.2
Unknown 1 1.4 3 0.7
Inflammation
TILs present 23 31.1 51.1 229 55.0 77.4 \0.001
TILs absent 22 29.7 48.9 67 16.1 22.6
Unknown 29 39.2 120 28.8
St-TILs score
[1% 16 21.6 36.4 189 45.4 63.9 0.001
B1% 28 37.8 63.6 107 25.7 36.1
Unknown 30 40.5 120 28.8
Necrosis
Present 19 25.7 42.2 107 25.7 36.1 0.508
Absent 26 35.1 57.8 189 45.4 63.9
Unknown 29 39.2 120 28.8
516 Breast Cancer Res Treat (2014) 148:511–523
123

pCR was observed in Luminal A (3 %) followed by Luminal
B/HER2- (16 %). However, the response rate was signifi-
cantly different between the two subtypes (p = 0.01), and
both of them showed a significant difference of response
compared with the other subtypes (all of p \ 0.01). The
highest rates of pCR were achieved in the HER2? (58 %)
and in triple-negative (43 %) subtypes. On the other hand,
the Luminal A cancers showed the highest percentage of
pNR (31.3 %) (Table 3).
Histological grade, radiological tumor diameter pre-CT,
necrosis, and mitotic count did not show a significant dif-
ference between different response categories (all
p [ 0.05). The presence of a lobular histotype varied
among the different molecular subtypes (15 % in Luminal
A; 8.5 % in Luminal B/HER2-; 2.2 % in Luminal
B/HER2?; 5.3 % in HER2, and 1.8 % in triple negative)
with the highest frequency in the Luminal subtypes.
However, the lobular histotype (26 % vs 5 %) significantly
differed between the pNR and pCR ? pPR tumors
(p \ 0.00) only in the Luminal B/HER2- cancers (sensi-
tivity: 26 %; specificity: 95 %; PPV: 48 %; NPV: 88 %)
(Fig. 3a), although this histotype was more frequent in
Luminal A. The absence of TILs was also distributed dif-
ferently between the pNR and pCR ? pPR categories (69
vs 23 %) in the Luminal B/HER2- breast cancers
(p \ 0.000) (sensitivity: 69 %; specificity: 77 %; PPV:
28 %; NPV: 95 %) (Fig. 3b), and st-TILs % also resulted
differentially distributed in pNR and pCR ? pPR
categories (mean values: 3 vs 10 %; SDs: 5.73 vs 17.23 %)
(p = 0.002) in this molecular subtype (Supplementary
Fig. 1b). A TILs % B1 was significantly related with pNR
(p = 0.002) (sensitivity: 81 %; specificity: 61 %; PPV:
22 %; NPV: 96 %) (Supplementary Fig. 1d).
The distribution and cut-off of the percentage of Ki67
were not analyzed in the Luminal subtypes as proliferation
is one of the parameters used to define the Luminal A and
B categories.
In HER2 ? and in triple-negative carcinomas, neither
the distribution nor the cut-off value of Ki67 of 18 % were
able to discriminate between the different response cate-
gories (p [ 0.05).
Multivariable analyses
We performed a logistic binary regression on both the
entire cohort and the Luminal B/HER2- carcinomas sub
vs group. When two different variables of the same
parameter (e.g., PgR: score or cut-off; TILs: presence/
absence or st-TILS score) were available, the most sig-
nificant at univariate analysis was used for multivariable
test.
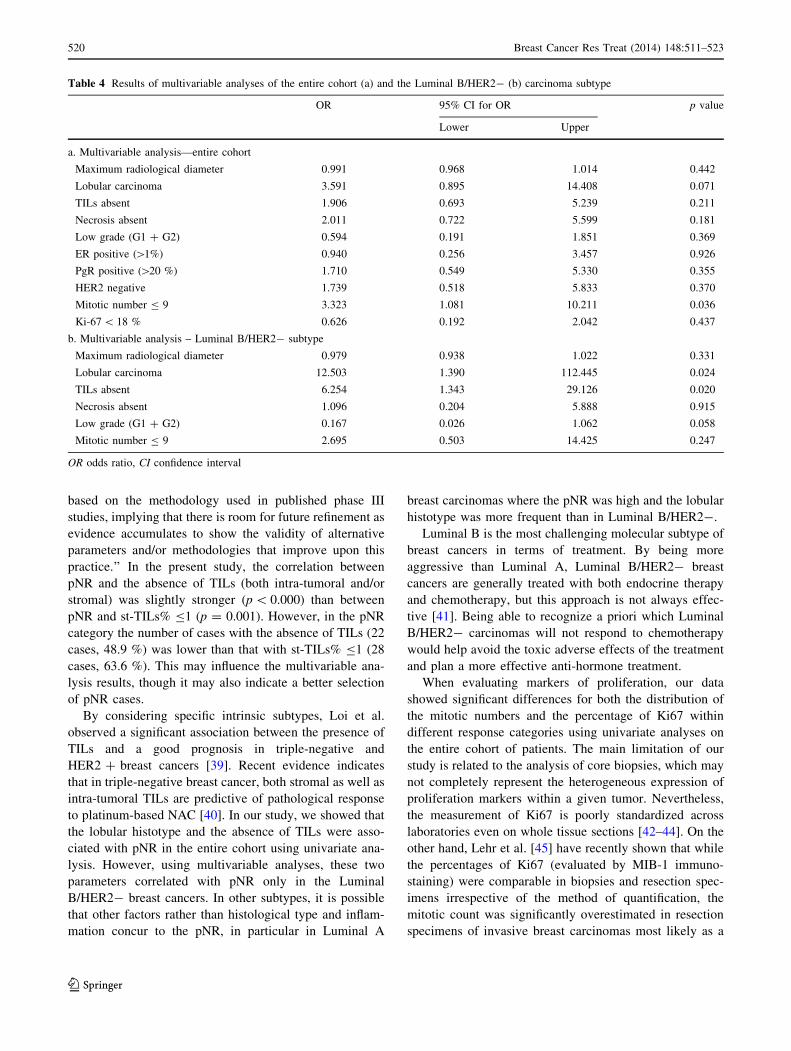
In the entire cohort, the cut-off of 9 mitosis was statis-
tically related to different response categories (p = 0.036);
in particular, the Odds Ratio (OR) for patients with pNR
was 3.3 times higher for carcinomas with B9 mitoses than
for patients whose tumors had [9 mitoses. A trend for
Fig. 1 Box plots showing the
correlations between the
pathological response (pNR vs
pCR ? pPR) and distribution of
Ki67% (a) and mitotic counts
(b) in the entire cohort. Box plot
explanation: upper and lower
horizontal bars of the
box = standard error;
horizontal bar within the
box = mean; upper and lower
horizontal bars outside the
box = standard deviation.
Outliers were not included
Breast Cancer Res Treat (2014) 148:511–523 517
123
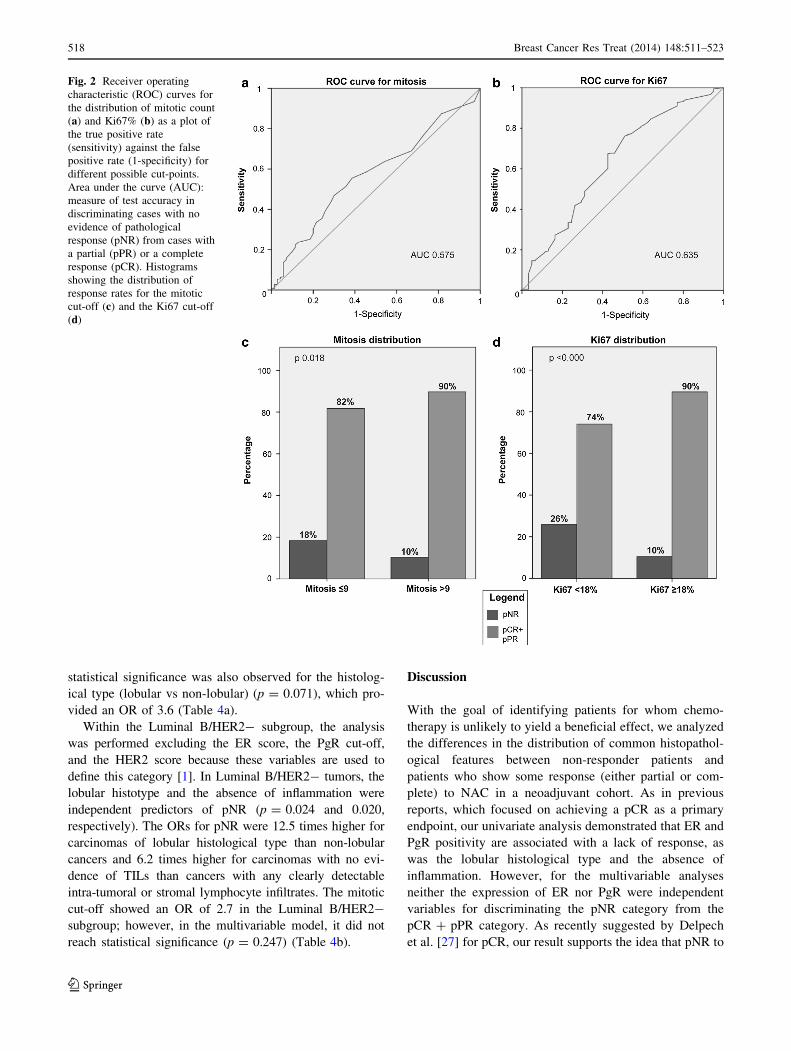
statistical significance was also observed for the histolog-
ical type (lobular vs non-lobular) (p = 0.071), which pro-
vided an OR of 3.6 (Table 4a).
Within the Luminal B/HER2- subgroup, the analysis
was performed excluding the ER score, the PgR cut-off,
and the HER2 score because these variables are used to
define this category [1]. In Luminal B/HER2- tumors, the
lobular histotype and the absence of inflammation were
independent predictors of pNR (p = 0.024 and 0.020,
respectively). The ORs for pNR were 12.5 times higher for
carcinomas of lobular histological type than non-lobular
cancers and 6.2 times higher for carcinomas with no evi-
dence of TILs than cancers with any clearly detectable
intra-tumoral or stromal lymphocyte infiltrates. The mitotic
cut-off showed an OR of 2.7 in the Luminal B/HER2-
subgroup; however, in the multivariable model, it did not
reach statistical significance (p = 0.247) (Table 4b).
Discussion
With the goal of identifying patients for whom chemo-
therapy is unlikely to yield a beneficial effect, we analyzed
the differences in the distribution of common histopathol-
ogical features between non-responder patients and
patients who show some response (either partial or com-
plete) to NAC in a neoadjuvant cohort. As in previous
reports, which focused on achieving a pCR as a primary
endpoint, our univariate analysis demonstrated that ER and
PgR positivity are associated with a lack of response, as
was the lobular histological type and the absence of
inflammation. However, for the multivariable analyses
neither the expression of ER nor PgR were independent
variables for discriminating the pNR category from the
pCR ? pPR category. As recently suggested by Delpech
et al. [27] for pCR, our result supports the idea that pNR to
Fig. 2 Receiver operating
characteristic (ROC) curves for
the distribution of mitotic count
(a) and Ki67% (b) as a plot of
the true positive rate
(sensitivity) against the false
positive rate (1-specificity) for
different possible cut-points.
Area under the curve (AUC):
measure of test accuracy in
discriminating cases with no
evidence of pathological
response (pNR) from cases with
a partial (pPR) or a complete
response (pCR). Histograms
showing the distribution of
response rates for the mitotic
cut-off (c) and the Ki67 cut-off
(d)
518 Breast Cancer Res Treat (2014) 148:511–523
123

NAC is more related to intrinsic tumor characteristics than
to ER expression. Many studies have shown that the
response to NAC is lower in terms of pCR in locally
advanced lobular carcinomas than in invasive ductal car-
cinomas [30–34]. The presence of inflammation has instead
been proposed as a predictive factor of response to che-
motherapy in breast cancer in general [1, 35–38]. A recent
study for harmonization of the evaluation of TILs recom-
mends considering only the stromal inflammation [26];
however, the authors specify that ‘‘this recommendation is
Table 3 Response distribution (a) and statistical correlations (b) in different molecular subtypes
Molecular subtypes a. Response distribution
pCR vs pPR ? pNR pNR vs pCR ? pPR
pCR pCR % pPR ? pNR pPR ? pNR % pNR pNR % pCR ? pPR pCR ? pPR %
Luminal A 2 3 65 97 21 31.3 46 68.7
Luminal B/HER2- 29 16 152 84 27 14.9 154 85.1
Luminal B/HER2? 18 40 27 60 5 11.1 40 88.9
HER2? 32 58.2 23 41.8 3 5.4 52 94.6
Triple-negative 128 42.1 62 56.9 11 10.1 98 89.9
Comparison of molecular subtypes b. Statistical correlations of the response distribution (p values)
pCR vs pPR ? pNR pNR vs pCR ? pPR
Luminal A vs Luminal B/HER2- 0.01 0.006
Luminal A vs Luminal B/HER2? 0.0001 0.002
Luminal A vs HER2? 0.0001 0.0008
Luminal A vs Triple-negative 0.0001 0.0008
Luminal B/HER2- vs Luminal B/HER2? 0.0008 0.67
Luminal B/HER2- vs HER2? 0.0001 0.1
Luminal B/HER2- vs Triple-negative 0.0001 0.3
Luminal B/HER2? vs HER2? 0.1 0.5
Luminal B/HER2? vs Triple-negative 0.8 0.8
HER2? vs Triple-negative 0.09 0.47
pCR pathological complete response, pPR pathological partial response, pNR pathological non-response
Fig. 3 Histograms showing the
distribution of response rates for
the histotype (a) and the
inflammation (b). TILs tumor
infiltrating lymphocytes
Breast Cancer Res Treat (2014) 148:511–523 519
123
based on the methodology used in published phase III
studies, implying that there is room for future refinement as
evidence accumulates to show the validity of alternative
parameters and/or methodologies that improve upon this
practice.’’ In the present study, the correlation between
pNR and the absence of TILs (both intra-tumoral and/or
stromal) was slightly stronger (p \ 0.000) than between
pNR and st-TILs% B1 (p = 0.001). However, in the pNR
category the number of cases with the absence of TILs (22
cases, 48.9 %) was lower than that with st-TILs% B1 (28
cases, 63.6 %). This may influence the multivariable ana-
lysis results, though it may also indicate a better selection
of pNR cases.
By considering specific intrinsic subtypes, Loi et al.
observed a significant association between the presence of
TILs and a good prognosis in triple-negative and
HER2 ? breast cancers [39]. Recent evidence indicates
that in triple-negative breast cancer, both stromal as well as
intra-tumoral TILs are predictive of pathological response
to platinum-based NAC [40]. In our study, we showed that
the lobular histotype and the absence of TILs were asso-
ciated with pNR in the entire cohort using univariate ana-
lysis. However, using multivariable analyses, these two
parameters correlated with pNR only in the Luminal
B/HER2- breast cancers. In other subtypes, it is possible
that other factors rather than histological type and inflam-
mation concur to the pNR, in particular in Luminal A
breast carcinomas where the pNR was high and the lobular
histotype was more frequent than in Luminal B/HER2-.
Luminal B is the most challenging molecular subtype of
breast cancers in terms of treatment. By being more
aggressive than Luminal A, Luminal B/HER2- breast
cancers are generally treated with both endocrine therapy
and chemotherapy, but this approach is not always effec-
tive [41]. Being able to recognize a priori which Luminal
B/HER2- carcinomas will not respond to chemotherapy
would help avoid the toxic adverse effects of the treatment
and plan a more effective anti-hormone treatment.
When evaluating markers of proliferation, our data
showed significant differences for both the distribution of
the mitotic numbers and the percentage of Ki67 within
different response categories using univariate analyses on
the entire cohort of patients. The main limitation of our
study is related to the analysis of core biopsies, which may
not completely represent the heterogeneous expression of
proliferation markers within a given tumor. Nevertheless,
the measurement of Ki67 is poorly standardized across
laboratories even on whole tissue sections [42–44]. On the
other hand, Lehr et al. [45] have recently shown that while
the percentages of Ki67 (evaluated by MIB-1 immuno-
staining) were comparable in biopsies and resection spec-
imens irrespective of the method of quantification, the
mitotic count was significantly overestimated in resection
specimens of invasive breast carcinomas most likely as a
Table 4 Results of multivariable analyses of the entire cohort (a) and the Luminal B/HER2- (b) carcinoma subtype
OR 95% CI for OR p value
Lower Upper
a. Multivariable analysis—entire cohort
Maximum radiological diameter 0.991 0.968 1.014 0.442
Lobular carcinoma 3.591 0.895 14.408 0.071
TILs absent 1.906 0.693 5.239 0.211
Necrosis absent 2.011 0.722 5.599 0.181
Low grade (G1 ? G2) 0.594 0.191 1.851 0.369
ER positive ([1%) 0.940 0.256 3.457 0.926
PgR positive ([20 %) 1.710 0.549 5.330 0.355
HER2 negative 1.739 0.518 5.833 0.370
Mitotic number B 9 3.323 1.081 10.211 0.036
Ki-67 \ 18 % 0.626 0.192 2.042 0.437
b. Multivariable analysis – Luminal B/HER2- subtype
Maximum radiological diameter 0.979 0.938 1.022 0.331
Lobular carcinoma 12.503 1.390 112.445 0.024
TILs absent 6.254 1.343 29.126 0.020
Necrosis absent 1.096 0.204 5.888 0.915
Low grade (G1 ? G2) 0.167 0.026 1.062 0.058
Mitotic number B 9 2.695 0.503 14.425 0.247
OR odds ratio, CI confidence interval
520 Breast Cancer Res Treat (2014) 148:511–523
123
result of a delay of tissue fixation. Another critical issue
may be the high standard deviation values for both mitoses
and Ki67; however, with ROC curve analysis, we identified
two cut-off values (9 for mitosis count and 18 % for Ki67
expression) that performed well in differentiating the pNR
and pPR ? pCR categories using univariate analyses. In
addition, the mitotic count was the only independent var-
iable in the entire cohort of patients but not in any of the
molecular subtypes. This finding could stem from the low
number of cases available for each category, and larger
studies are warranted to investigate further the utility of
mitotic counts within distinct molecular subgroups. The
hypothesis that a low mitotic count would characterize
non-responsive patients treated with taxanes was not sup-
ported by our results. This finding is consistent with studies
that suggest that drugs damaging DNA or microtubules are
active through non-mitotic mechanisms [19].
In conclusion, although the pNR category has been
neglected in the literature, the non-responsive patients
could merit further investigation by using genetic signa-
tures, particularly in breast cancers that do have the option
of chemotherapy, such as Luminal B/HER2- breast
carcinomas.
Acknowledgments This work was supported by Ricerca Sanitaria
Finalizzata (RF-2010-2310674 to AS) and by the Italian Association
for Cancer Research—AIRC (MFAG13310 to CM).
Conflict of interest The authors declare that they have no conflict
of interest.
Open Access This article is distributed under the terms of the
Creative Commons Attribution Noncommercial License which per-
mits any noncommercial use, distribution, and reproduction in any
medium, provided the original author(s) and the source are credited.
References
1. Goldhirsch A, Winer EP, Coates AS, Gelber RD, Piccart-Gebhart
M, Thurlimann B, Senn HJ (2013) Personalizing the treatment of
women with early breast cancer: highlights of the St Gallen
international expert consensus on the primary therapy of early
breast cancer 2013. Ann Oncol 24(9):2206–2223
2. Albain KS, Barlow WE, Shak S, Hortobagyi GN, Livingston RB,
Yeh IT, Ravdin P, Bugarini R, Baehner FL, Davidson NE, Sledge
GW, Winer EP, Hudis C, Ingle JN, Perez EA, Pritchard KI,
Shepherd L, Gralow JR, Yoshizawa C, Allred DC, Osborne CK,
Hayes DF (2010) Prognostic and predictive value of the 21-gene
recurrence score assay in postmenopausal women with node-
positive, oestrogen-receptor-positive breast cancer on chemo-
therapy: a retrospective analysis of a randomised trial. Lancet
Oncol 11(1):55–65
3. Paik S, Tang G, Shak S, Kim C, Baker J, Kim W, Cronin M,
Baehner FL, Watson D, Bryant J, Costantino JP, Geyer CE Jr,
Wickerham DL, Wolmark N (2006) Gene expression and benefit
of chemotherapy in women with node-negative, estrogen recep-
tor-positive breast cancer. J Clin Oncol 24(23):3726–3734
4. Hassett MJ, Silver SM, Hughes ME, Blayney DW, Edge SB,
Herman JG, Hudis CA, Marcom PK, Pettinga JE, Share D,
Theriault R, Wong YN, Vandergrift JL, Niland JC, Weeks JC
(2012) Adoption of gene expression profile testing and associa-
tion with use of chemotherapy among women with breast cancer.
J Clin Oncol 30(18):2218–2226
5. Parker JS, Mullins M, Cheang MC, Leung S, Voduc D, Vickery
T, Davies S, Fauron C, He X, Hu Z, Quackenbush JF, Stijleman
IJ, Palazzo J, Marron JS, Nobel AB, Mardis E, Nielsen TO, Ellis
MJ, Perou CM, Bernard PS (2009) Supervised risk predictor of
breast cancer based on intrinsic subtypes. J Clin Oncol
27(8):1160–1167
6. Gianni L, Zambetti M, Clark K, Baker J, Cronin M, Wu J,
Mariani G, Rodriguez J, Carcangiu M, Watson D, Valagussa P,
Rouzier R, Symmans WF, Ross JS, Hortobagyi GN, Pusztai L,
Shak S (2005) Gene expression profiles in paraffin-embedded
core biopsy tissue predict response to chemotherapy in women
with locally advanced breast cancer. J Clin Oncol
23(29):7265–7277
7. Straver ME, Glas AM, Hannemann J, Wesseling J, van de Vijver
MJ, Rutgers EJ, Vrancken Peeters MJ, van Tinteren H, Van’t
Veer LJ, Rodenhuis S (2010) The 70-gene signature as a response
predictor for neoadjuvant chemotherapy in breast cancer. Breast
Cancer Res Treat 119(3):551–558
8. Denkert C, Loibl S, Muller BM, Eidtmann H, Schmitt WD,
Eiermann W, Gerber B, Tesch H, Hilfrich J, Huober J, Fehm T,
Barinoff J, Jackisch C, Prinzler J, Rudiger T, Erbstosser E,
Blohmer JU, Budczies J, Mehta KM, von Minckwitz G (2013)
Ki67 levels as predictive and prognostic parameters in prethera-
peutic breast cancer core biopsies: a translational investigation in
the neoadjuvant GeparTrio trial. Ann Oncol 24(11):2786–2793
9. Fasching PA, Heusinger K, Haeberle L, Niklos M, Hein A, Bayer
CM, Rauh C, Schulz-Wendtland R, Bani MR, Schrauder M,
Kahmann L, Lux MP, Strehl JD, Hartmann A, Dimmler A,
Beckmann MW, Wachter DL (2011) Ki67, chemotherapy
response, and prognosis in breast cancer patients receiving neo-
adjuvant treatment. BMC Cancer 11:486
10. Niikura N, Iwamoto T, Masuda S, Kumaki N, Xiaoyan T, Shirane
M, Mori K, Tsuda B, Okamura T, Saito Y, Suzuki Y, Tokuda Y
(2012) Immunohistochemical Ki67 labeling index has similar
proliferation predictive power to various gene signatures in breast
cancer. Cancer Sci 103(8):1508–1512
11. Sheri A, Dowsett M (2012) Developments in Ki67 and other
biomarkers for treatment decision making in breast cancer. Ann
Oncol 23(Suppl 10):x219–x227
12. Sueta A, Yamamoto Y, Hayashi M, Yamamoto S, Inao T, Ibusuki
M, Murakami K, Iwase H (2014) Clinical significance of pre-
therapeutic Ki67 as a predictive parameter for response to neo-
adjuvant chemotherapy in breast cancer; is it equally useful
across tumor subtypes? Surgery 155(5):927–935
13. Cheang MC, Chia SK, Voduc D, Gao D, Leung S, Snider J,
Watson M, Davies S, Bernard PS, Parker JS, Perou CM, Ellis MJ,
Nielsen TO (2009) Ki67 index, HER2 status, and prognosis of
patients with luminal B breast cancer. J Natl Cancer Inst
101(10):736–750
14. Criscitiello C, Disalvatore D, De Laurentiis M, Gelao L, Fuma-
galli L, Locatelli M, Bagnardi V, Rotmensz N, Esposito A,
Minchella I, De Placido S, Santangelo M, Viale G, Goldhirsch A,
Curigliano G (2014) High Ki-67 score is indicative of a greater
benefit from adjuvant chemotherapy when added to endocrine
therapy in Luminal B HER2 negative and node-positive breast
cancer. Breast 23(1):69–75
15. Klintman M, Strand C, Ahlin C, Beglerbegovic S, Fjallskog ML,
Grabau D, Gudlaugsson E, Janssen EA, Lovgren K, Skaland I,
Bendahl PO, Malmstrom P, Baak JP, Ferno M (2013) The
prognostic value of mitotic activity index (MAI), phosphohistone
Breast Cancer Res Treat (2014) 148:511–523 521
123

H3 (PPH3), cyclin B1, cyclin A, and Ki67, alone and in combi-
nations, in node-negative premenopausal breast cancer. PLoS
One 8(12):e81902
16. Lende TH, Janssen EA, Gudlaugsson E, Voorhorst F, Smaaland
R, van Diest P, Soiland H, Baak JP (2011) In patients younger
than age 55 years with lymph node-negative breast cancer, pro-
liferation by mitotic activity index is prognostically superior to
adjuvant! J Clin Oncol 29(7):852–858
17. Penault-Llorca F, Abrial C, Raoelfils I, Chollet P, Cayre A,
Mouret-Reynier MA, Thivat E, Mishellany F, Gimbergues P,
Durando X (2008) Changes and predictive and prognostic value
of the mitotic index, Ki-67, cyclin D1, and cyclo-oxygenase-2 in
710 operable breast cancer patients treated with neoadjuvant
chemotherapy. Oncologist 13(12):1235–1245
18. Vincent-Salomon A, Rousseau A, Jouve M, Beuzeboc P, Sigal-
Zafrani B, Freneaux P, Rosty C, Nos C, Campana F, Klijanienko
J, Al Ghuzlan A, Sastre-Garau X (2004) Proliferation markers
predictive of the pathological response and disease outcome of
patients with breast carcinomas treated by anthracycline-based
preoperative chemotherapy. Eur J Cancer 40(10):1502–1508
19. Mitchison TJ (2012) The proliferation rate paradox in antimitotic
chemotherapy. Mol Biol Cell 23(1):1–6
20. von Minckwitz G, Fontanella C (2013) Selecting the neoadjuvant
treatment by molecular subtype: how to maximize the benefit?
Breast 22(Suppl 2):S149–S151
21. Marchio C, Sapino A (2011) The pathologic complete response
open question in primary therapy. J Natl Cancer Inst Monogr
43:86–90
22. Penault-Llorca F, Abrial C, Raoelfils I, Cayre A, Mouret-Reynier
MA, Leheurteur M, Durando X, Achard JL, Gimbergues P,
Chollet P (2008) Comparison of the prognostic significance of
Chevallier and Sataloff’s pathologic classifications after neoad-
juvant chemotherapy of operable breast cancer. Hum Pathol
39(8):1221–1228
23. Elston CW, Ellis IO (1991) Pathological prognostic factors in
breast cancer. I. The value of histological grade in breast cancer:
experience from a large study with long-term follow-up. Histo-
pathology 19(5):403–410
24. Pinder SE, Provenzano E, Earl H, Ellis IO (2007) Laboratory
handling and histology reporting of breast specimens from
patients who have received neoadjuvant chemotherapy. Histo-
pathology 50(4):409–417. doi:10.1111/j.1365-2559.2006.02419.x
25. Prat A, Cheang MC, Martin M, Parker JS, Carrasco E, Caballero
R, Tyldesley S, Gelmon K, Bernard PS, Nielsen TO, Perou CM
(2013) Prognostic significance of progesterone receptor-positive
tumor cells within immunohistochemically defined luminal A
breast cancer. J Clin Oncol 31(2):203–209. doi:10.1200/JCO.
2012.43.4134
26. Salgado R, Denkert C, Demaria S, Sirtaine N, Klauschen F,
Pruneri G, Wienert S, Van den Eynden G, Baehne FL, Penault-
Llorca F, Perez EA, Thompson EA, Symmans WF, Richardson
AL, Brock J, Criscitiello C, Bailey H, Ignatiadis M, Floris G,
Sparano J, Kos Z, Nielsen T, Rimm DL, Allison KH, Reis-Filho
JS, Loibl S, Sotiriou C, Viale G, Badve S, Adams S, Willard-
Gallo K, Loi S (2014) Harmonization of the evaluation of tumor
infiltrating lymphocytes (TILs) in breast cancer: recommenda-
tions by an international TILs-working group 2014. Ann Oncol.
doi:10.1093/annonc/mdu450
27. Faraggi D (2000) The effect of random measurement error on
receiver operating characteristic (ROC) curves. Stat Med 19(1):61–70
28. Reiser B (2000) Measuring the effectiveness of diagnostic
markers in the presence of measurement error through the use of
ROC curves. Stat Med 19(16):2115–2129
29. McShane LM, Altman DG, Sauerbrei W, Taube SE, Gion M, Clark
GM (2006) Reporting recommendations for tumor marker prog-
nostic studies (REMARK). Breast Cancer Res Treat 100(2):229–235
30. Cocquyt VF, Blondeel PN, Depypere HT, Praet MM, Schelfhout
VR, Silva OE, Hurley J, Serreyn RF, Daems KK, Van Belle SJ
(2003) Different responses to preoperative chemotherapy for
invasive lobular and invasive ductal breast carcinoma. Eur J Surg
Oncol 29(4):361–367
31. Cristofanilli M, Gonzalez-Angulo A, Sneige N, Kau SW, Broglio
K, Theriault RL, Valero V, Buzdar AU, Kuerer H, Buchholz TA,
Hortobagyi GN (2005) Invasive lobular carcinoma classic type:
response to primary chemotherapy and survival outcomes. J Clin
Oncol 23(1):41–48
32. Delpech Y, Coutant C, Hsu L, Barranger E, Iwamoto T, Barcenas
CH, Hortobagyi GN, Rouzier R, Esteva FJ, Pusztai L (2013)
Clinical benefit from neoadjuvant chemotherapy in oestrogen
receptor-positive invasive ductal and lobular carcinomas. Br J
Cancer 108(2):285–291
33. Loibl S, Volz C, Mau C, Blohmer JU, Costa SD, Eidtmann H,
Fasching PA, Gerber B, Hanusch C, Jackisch C, Kummel S,
Huober J, Denkert C, Hilfrich J, Konecny GE, Fett W, Stickeler
E, Harbeck N, Mehta KM, Nekljudova V, von Minckwitz G,
Untch M (2014) Response and prognosis after neoadjuvant che-
motherapy in 1,051 patients with infiltrating lobular breast car-
cinoma. Breast Cancer Res Treat 144(1):153–162
34. Petrelli F, Barni S (2013) Response to neoadjuvant chemotherapy
in ductal compared to lobular carcinoma of the breast: a meta-
analysis of published trials including 1,764 lobular breast cancer.
Breast Cancer Res Treat 142(2):227–235
35. Denkert C, Loibl S, Noske A, Roller M, Muller BM, Komor M,
Budczies J, Darb-Esfahani S, Kronenwett R, Hanusch C, von
Torne C, Weichert W, Engels K, Solbach C, Schrader I, Dietel M,
von Minckwitz G (2010) Tumor-associated lymphocytes as an
independent predictor of response to neoadjuvant chemotherapy
in breast cancer. J Clin Oncol 28(1):105–113
36. Gu-Trantien C, Loi S, Garaud S, Equeter C, Libin M, de Wind A,
Ravoet M, Le Buanec H, Sibille C, Manfouo-Foutsop G, Veys I,
Haibe-Kains B, Singhal SK, Michiels S, Rothe F, Salgado R,
Duvillier H, Ignatiadis M, Desmedt C, Bron D, Larsimont D,
Piccart M, Sotiriou C, Willard-Gallo K (2013) CD4(?) follicular
helper T cell infiltration predicts breast cancer survival. J Clin
Investig 123(7):2873–2892
37. Gu-Trantien C, Willard-Gallo K (2013) Tumor-infiltrating fol-
licular helper T cells: the new kids on the block. Oncoimmu-
nology 2(10):e26066
38. Loi S, Sirtaine N, Piette F, Salgado R, Viale G, Van Eenoo F,
Rouas G, Francis P, Crown JP, Hitre E, de Azambuja E, Quinaux
E, Di Leo A, Michiels S, Piccart MJ, Sotiriou C (2013) Prog-
nostic and predictive value of tumor-infiltrating lymphocytes in a
phase III randomized adjuvant breast cancer trial in node-positive
breast cancer comparing the addition of docetaxel to doxorubicin
with doxorubicin-based chemotherapy: BIG 02-98. J Clin Oncol
31(7):860–867
39. Loi S, Michiels S, Salgado R, Sirtaine N, Jose V, Fumagalli D,
Kellokumpu-Lehtinen PL, Bono P, Kataja V, Desmedt C, Piccart
MJ, Loibl S, Denkert C, Smyth MJ, Joensuu H, Sotiriou C (2014)
Tumor infiltrating lymphocytes are prognostic in triple negative
breast cancer and predictive for trastuzumab benefit in early breast
cancer: results from the FinHER trial. Ann Oncol 25(8):1544–1550
40. Vinayak S, Gray RJ, Adams S, Jensen KC, Manola J, Afghahi A,
Goldstein LJ, Ford JM, Badve SS, Telli ML (2014) Association
of increased tumor-infiltrating lymphocytes (TILs) with immu-
nomodulatory (IM) triple-negative breast cancer (TNBC) subtype
and response to neoadjuvant platinum-based therapy in PrE-
COG0105. J Clin Oncol 32:S1000
41. Turner N, Biganzoli L, Malorni L, Migliaccio I, Moretti E, Pe-
strin M, Sanna G, Siclari O, Di Leo A (2013) Adjuvant chemo-
therapy: which patient? What regimen? Am Soc Clin Oncol Educ
Book 4:3-8
522 Breast Cancer Res Treat (2014) 148:511–523
123

42. Dowsett M, Nielsen TO, A’Hern R, Bartlett J, Coombes RC,
Cuzick J, Ellis M, Henry NL, Hugh JC, Lively T, McShane L,
Paik S, Penault-Llorca F, Prudkin L, Regan M, Salter J, Sotiriou
C, Smith IE, Viale G, Zujewski JA, Hayes DF (2011) Assessment
of Ki67 in breast cancer: recommendations from the international
Ki67 in breast cancer working group. J Natl Cancer Inst
103(22):1656–1664
43. Luporsi E, Andre F, Spyratos F, Martin PM, Jacquemier J,
Penault-Llorca F, Tubiana-Mathieu N, Sigal-Zafrani B, Arnould
L, Gompel A, Egele C, Poulet B, Clough KB, Crouet H, Fourquet
A, Lefranc JP, Mathelin C, Rouyer N, Serin D, Spielmann M,
Haugh M, Chenard MP, Brain E, de Cremoux P, Bellocq JP
(2012) Ki-67: level of evidence and methodological consider-
ations for its role in the clinical management of breast cancer:
analytical and critical review. Breast Cancer Res Treat
132(3):895–915
44. Polley MY, Leung SC, McShane LM, Gao D, Hugh JC, Mast-
ropasqua MG, Viale G, Zabaglo LA, Penault-Llorca F, Bartlett
JM, Gown AM, Symmans WF, Piper T, Mehl E, Enos RA, Hayes
DF, Dowsett M, Nielsen TO (2013) An international Ki67
reproducibility study. J Natl Cancer Inst 105(24):1897–1906
45. Lehr HA, Rochat C, Schaper C, Nobile A, Shanouda S, Vijgen S,
Gauthier A, Obermann E, Leuba S, Schmidt M, CCR, Delaloye
JF, Simiantonaki N, Schaefer SC (2013) Mitotic figure counts are
significantly overestimated in resection specimens of invasive
breast carcinomas. Mod Pathol 26(3):336–342
Breast Cancer Res Treat (2014) 148:511–523 523
123