passive optical top-of-rack interconnect for data center
TRANSCRIPT

Passive Optical Top-Of-Rack Interconnect for DataCenter Networks
YUXIN CHENG
Licentiate Thesis in Information and Communication TechnologySchool of Information and Communication Technology
KTH Royal Institute of TechnologyStockholm, Sweden 2017

TRITA-ICT 2017:12ISBN 978-91-7729-387-3
KTH School of Information andCommunication Technology
SE-164 40 KistaSWEDEN
Akademisk avhandling som med tillstånd av Kungl Tekniska högskolan framläg-ges till offentlig granskning för avläggande av licentiatexamen i Informations- ochkommunikationsteknik måndagen den 12 juni 2017 klockan 10:00 i Ka-Sal C (SalSven-Olof Öhrvik), Electrum, Kungl Tekniska högskolan, Kistagången 16, Kista.
© Yuxin Cheng, juni 2017
Tryck: Universitetsservice US AB

iii
Abstract
Optical networks offering ultra-high capacity and low energy consumptionper bit are considered as a good option to handle the rapidly growing trafficvolume inside data center (DCs). Consequently, several optical interconnectarchitectures for DCs have already been proposed. However, most of thearchitectures proposed so far are mainly focused on the aggregation/core tiersof the data center networks (DCNs), while relying on the conventional top-of-rack (ToR) electronic packet switches (EPS) in the access tier. A large numberof ToR switches in the current DCNs brings serious scalability limitations dueto high cost and power consumption. Thus, it is important to investigate andevaluate new optical interconnects tailored for the access tier of the DCNs.
We propose and evaluate a passive optical ToR interconnect (POTORI)architecture for the access tier. The data plane of POTORI consists mainly ofpassive components to interconnect the servers within the rack as well as theinterfaces toward the aggregation/core tiers. Using the passive componentsmakes it possible to significantly reduce power consumption while achievinghigh reliability in a cost-efficient way.
Meanwhile, our proposed POTORI’s control plane is based on a central-ized rack controller, which is responsible for coordinating the communicationsamong the servers in the rack. It can be reconfigured by software-definednetworking (SDN) operation. A cycle-based medium access control (MAC)protocol and a dynamic bandwidth allocation (DBA) algorithm are designedfor POTORI to efficiently manage the exchange of control messages and thedata transmission inside the rack.
Simulation results show that under realistic DC traffic scenarios, POTORIwith the proposed DBA algorithm is able to achieve an average packet delaybelow 10 µs with the use of fast tunable optical transceivers. Moreover, wefurther quantify the impact of different network configuration parameters (i.e.,transceiver’s tuning time, maximum transmission time of each cycle) on theaverage packet delay. The results suggest that in order to achieve packet-levelswitching granularity for POTORI, the transceiver’s tuning time should beshort enough (i.e., below 30% of the packet transmission time), while for thecase of a long tuning time, an acceptable packet delay performance can beachieved if the maximum transmission time of each cycle is greater than threetimes of transceiver’s tuning time.
Keywords: Optical communications, data center interconnects, MACprotocol, dynamic bandwidth allocation.

iv

v
Sammanfattning
Optiska nätverk erbjuder extremt hög kapacitet och låg energikonsumtionper bit och anses därför vara ett bra alternativ för att klara den snabbt ökan-de trafikvolymen inuti datacenter (DCs). Till följd av detta så har flertaletarkitekturer för sammankoppling av optiska nätverk redan presenterats. Deflesta hittills föreslagna arkitekturer fokuserar dock på aggregering av lageri datacenters nätverk (DCN) och förlitar sig konventionell top-of-rack (ToR)elektroniska paket switchar (EPS) i access lagret. Ett stort antal av ToR swit-char i nuvarande DCNs leder till allvarliga begränsningar när det kommer tillskalbarhet på grund av hög kostnad och energiförbrukning.
Vi föreslår och utvärderar en passiv optisk ToR sammankoppling (PO-TORI) arkitektur för accesslagret. Datalagret of POTORI består mestadelsav passiva komponenter för att sammankoppla servrar i samma serverracksamt kommunikationsgränssnitt mot aggregations/grund lagren. Användningav passiva komponenter gör det möjligt att markant minska energiförbruk-ningen och samtidigt uppnå hög pålitlighet på ett kostnadseffektivt sätt.
Vår föreslagna POTORIs kontrollager är baserat på en centraliserad rack-kontroller som är ansvarig för koordinering av kommunikation mellan serv-rarna i serverracket. Den går att konfigurera med software-defined networking(SDN) operationer. Ett cykelbaserat medium access control (MAC) protokolloch en dynamisk bandbreddsallokering (DBA) algorithm har designats föratt POTORI ska kunna effektivt hantera utbyte av kontrollmeddelanden ochdataöverföring inuti serverracket.
Resultat från simuleringar visar att under realistiska DC trafikförhållan-den, POTORI med föreslagna DBA algoritmer kan uppnå en snitt paketför-dröjning på under 10 µs vid användning av snabbt justerbara optiska transcei-vers. Dessutom kvantifierar vi påverkan av nätverkskonfigurations parametrar(t.ex. transceivers justeringstid, maximal sändningstid för varje cykel) på snittpaketfördröjningen. Resultaten visar på att för att kunna uppnå paketnivåswitching granularitet för POTORI så måste justeringstiden för transceivernvara tillräckligt kort (under 30% av paketsändningstiden), medan för falletmed lång justeringstid, en acceptabel paketfördröjning prestanda kan upp-nås om den maximala sändningstiden för varje cykel är större än tre gångertransceiverns justeringstid.
Keywords: Optiska kommunikation, data center sammankoppling, MACprotokoll, dynamisk bandbreddsallokering.

vi

vii
Acknowledgements
Study and work as a Ph.D. student at KTH is one of the best decisions I have evermade in my life.
Firstly, I would like to express my sincere gratitude to my supervisor AssociateProfessor Jiajia Chen for accepting me as her Ph.D. student and for all her guidanceand support during these years. I also want to offer my special thanks to my co-supervisors Professor Lena Wosinska and Dr. Matteo Fiorani for the continuoussupport and countless invaluable discussions for my Ph.D. study. I feel really happyand lucky to work with my supervisors.
I would like to thank Associate Professor Markus Hidell for the advance reviewof my licentiate thesis with the insightful and helpful comments and feedbacks. Iam also grateful to Dr. Qiong Zhang for accepting the role of opponent of mylicentiate defense and my friend Kim Persson for helping with Swedish translationof the abstract.
I also like to express my appreciation to my colleges working in the VR DataCenter project for their support and sharing their knowledge. Also I would like tothank all my friends and colleges in the Optical Network Lab (ONLab) for creatinga friendly work environment.
Last but not the least, I would like to thank my family: my mother HuaixinTao, my father Gang Cheng, and my girlfriend Xi Li for all their endless love,encouragement and support. Thank you.
Yuxin Cheng,Stockholm, April 2017.

viii

Contents
Contents ix
List of Figures xi
List of Tables xii
List of Acronyms xiii
List of Papers xv
1 Introduction 11.1 Problem Statement . . . . . . . . . . . . . . . . . . . . . . . . . . . . 11.2 Contribution of the Thesis . . . . . . . . . . . . . . . . . . . . . . . . 3
1.2.1 Reliable and Cost-Efficient Data Plane Design of POTORI . 31.2.2 Centralized Control Plane Design of POTORI . . . . . . . . . 3
1.3 Research Methodology . . . . . . . . . . . . . . . . . . . . . . . . . . 31.4 Sustainability Aspects . . . . . . . . . . . . . . . . . . . . . . . . . . 41.5 Organization of the Thesis . . . . . . . . . . . . . . . . . . . . . . . . 4
2 Reliable and Cost Efficient Data Plane of POTORI 72.1 Passive Optical Interconnects . . . . . . . . . . . . . . . . . . . . . . 82.2 Reliability and Cost Model . . . . . . . . . . . . . . . . . . . . . . . 102.3 Performance Evaluation . . . . . . . . . . . . . . . . . . . . . . . . . 12
3 Centralized Control Plane of POTORI 153.1 Overview of the control plane of POTORI . . . . . . . . . . . . . . . 153.2 Medium Access Control Protocol . . . . . . . . . . . . . . . . . . . . 17
3.2.1 Related Work . . . . . . . . . . . . . . . . . . . . . . . . . . . 183.2.2 The proposed MAC Protocol for POTORI . . . . . . . . . . . 18
3.3 Dynamic Bandwidth Allocation Algorithm . . . . . . . . . . . . . . . 193.3.1 Related Work . . . . . . . . . . . . . . . . . . . . . . . . . . . 203.3.2 Largest First . . . . . . . . . . . . . . . . . . . . . . . . . . . 22
3.4 Performance Evaluation . . . . . . . . . . . . . . . . . . . . . . . . . 22
ix

x CONTENTS
4 Conclusions and Future Work 274.1 Conclusions . . . . . . . . . . . . . . . . . . . . . . . . . . . . . . . . 274.2 Future Work . . . . . . . . . . . . . . . . . . . . . . . . . . . . . . . 28
Bibliography 29
Summary of the Original Works 33

List of Figures
1.1 Global Data Center IP Traffic Growth . . . . . . . . . . . . . . . . . . . 2
2.1 Passive Optical Interconnects . . . . . . . . . . . . . . . . . . . . . . . . 92.2 Wavelength plan for AWG based POI. . . . . . . . . . . . . . . . . . . . 102.3 Reliability block diagrams . . . . . . . . . . . . . . . . . . . . . . . . . . 112.4 Unavailability v.s. total cost of three POIs for different MTTR values . 13
3.1 POTORI based on: (N+1)×(N+1) Coupler and N×2 Coupler . . . . . . 163.2 POTORI’s Rack Controller . . . . . . . . . . . . . . . . . . . . . . . . . 173.3 POTORI’s MAC Protocol . . . . . . . . . . . . . . . . . . . . . . . . . . 193.4 Traffic Demand Matrix . . . . . . . . . . . . . . . . . . . . . . . . . . . . 203.5 Largest First Algorithm . . . . . . . . . . . . . . . . . . . . . . . . . . . 213.6 Average Packet Delay and Packet Drop Ratio . . . . . . . . . . . . . . . 233.7 Average Packet Delay of Different TM and TT u . . . . . . . . . . . . . . 24
xi

List of Tables
2.1 MTBF and cost of the network elements . . . . . . . . . . . . . . . . . . 12
xii

List of Acronyms
AWG Arrayed waveguide gratingsBvN Birkhoff-von-NeumannBS Base stationCAGR Compound annual growth rateCSMA/CD Carrier sense multiple access with collision detectionDBA Dynamic bandwidth allocationDC Data centerDCN Data center networkE/O Electrical-to-opticalEPON Ethernet passive optical networksEPS Electronic packet switchHEAD High-efficient distributed accessLF Largest firstMAC Media access controlMPCP Multipoint control protocolMTBF Mean time between failuresMTTR Mean time to repairOCS Optical circuit switchO/E Optical-to-electricalOLT Optical line terminalONI Optical network interfaceONU Optical network unitPOI Passive optical interconnectPOTORI Passive optical top-of-rack interconnectRBD Reliability block diagramRX ReceiverSFP Small form-factor pluggable transceiverTD Traffic demandToR Top-of-Rack
xiii

xiv LIST OF ACRONYMS
WDM Wavelength division multiplexingWTF Wavelength tunable filterWTT Wavelength tunable transmitterWSS Wavelength selective switch

List of Papers
Papers Included in the Thesis
Paper I. Y. Cheng, M. Fiorani, L. Wosinska, and J. Chen, “Reliable andCost Efficient Passive Optical Interconnects for Data Centers,” inIEEE Communications Letters, vol. 19, pp. 1913-1916, Nov. 2015.
Paper II. Y. Cheng, M. Fiorani, L. Wosinska, and J. Chen,“Centralized Con-trol Plane for Passive Optical Top-of-Rack Interconnects in DataCenters,” in Proc. IEEE Global Communications Conference (GLOBE-COM), Dec. 2016.
Paper III. Y. Cheng, M. Fiorani, R. Lin, L. Wosinska, and J. Chen,“POTORI:A Passive Optical Top-of-Rack Interconnect Architecture for DataCenters,” in IEEE/OSA Journal of Optical Communications andNetworking (JOCN), to appear, 2017.
xv


Chapter 1
Introduction
The overall data center (DC) traffic has been dramatically increasing since the lastdecade, due the continuously growing popularity of modern Internet applications,such as cloud computing, video streaming, social networking, etc. Fig. 1.1 showsCisco statistics forecasting that DC traffic will keep increasing at a compoundannual growth rate (CAGR) of 27% up to 2020, reaching 15.3 zettabyte per year[1]. It is also expected that by 2020 the majority, i.e. 77%, of the total DC trafficwill stay within the DCs [?].
The rapidly increasing intra-DC traffic makes it important to upgrade the cur-rent data center network (DCN) infrastructures. For example, Facebook has up-graded their servers and switches to support 10 Gb/s transmission data rate [?].Dell proposed DCN design for 40G and 100G Ethernet [?]. However, developinglarge (in terms of the number of ports) electronic packet switch (EPS) operatingat high data rates is challenging, due to the power consumption and bottleneck ofI/O bandwidth of the chip [?]. For large-scale DCs, there would be a high volumeof the EPSs deployed in DCN to scale to a huge number of servers. This leads to aserious energy consumption problem [5]. It has been reported in [6] that the EPS inDCN accounts for 30% of the total energy consumption of the IT devices (includingservers, storages, switches, etc.) in the DCs. One important reason of such highenergy consumption of DCN is that there is a great number of power demandingelectrical-to-optical (E/O) and optical-to-electrical (O/E) conversions deployed inDCN. Currently, optical fibers are used in DCNs only for the data transmissionbetween the servers and switches. Small form-factor pluggable transceivers (SFP)are deployed on both server and switches for the E/O and O/E conversions, sinceEPSs are switching and processing data in the electronic domain.
1.1 Problem Statement
In this regard, optical interconnects are considered to be a promising solution tosolve the power consumption problem of the DCNs. Comparing to the EPS, optical
1

2 CHAPTER 1. INTRODUCTION
Figure 1.1: Global Data Center IP Traffic Growth [1]
interconnects are able to support high transmission rates and switching capacity in acost- and energy-efficient way. By replacing the EPS with the optical interconnects,the overall cost and power consumption of the DCN will decrease dramatically, duethe reduction of E/O and O/E conversions [7].
In recent years, different optical interconnect architectures for the DCNs havebeen proposed in the literature. Some of the proposed architectures (e.g., c-through[8] and HOS [9]) are hybrid solutions, where both the EPS and optical interconnectare used. Particularly, the EPS is used to transmit short-lived traffic flows (e.g.,mice flows) and optical circuit switch (OCS) is used to transmit long-lived andbandwidth-consuming traffic flows (e.g., elephant flows). However, these architec-tures require the prediction or the classification of the data traffic to distinguishsmall and large flows so that the OCS can be properly configured, which might bechallenging for DC operators.
The other proposed optical architectures (e.g., [10] - [12]) are all-optical, whereoptical switches are deployed in DCN to replace the EPS. However, most of theproposed all-optical interconnects mainly target the aggregation and core tier of theDCNs, where the access tier always relies on electronic top-of-rack (ToR) switches,i.e., one or multiple conventional EPSs are used to connect all the servers in onerack. Due to the strong locality of traffic pattern for some applications (e.g. MapRe-duce) in DCN [13], the access tier carries a large amount of overall data centertraffic. The electronic ToR switches are responsible for the major part of cost andenergy consumption [14].
So far, there are not too many works focusing on the optical architecture for theaccess tier of DCN. Therefore, it is essential to design efficient optical interconnectarchitectures for the access tier of DCN. Optical architectures have the advantagesin terms of the cost and reliability comparing to the EPS, due to the less number of

1.2. CONTRIBUTION OF THE THESIS 3
power-hungry components used. The numerical results on the cost and reliabilitywill further illustrate these advantages. Moreover, network performance (i.e., packetdelay, packet drop ratio) of the optical interconnects should be evaluated. Thenetwork performance should be competitive with EPS, otherwise it will be hard toconvince DC operators to deploy the optical architecture solutions at the expenseof increasing packet delay or packet drop ratio.
1.2 Contribution of the Thesis
This thesis presents POTORI: a passive optical top-of-rack interconnect that isdesigned for the access tier of the DCNs. The data plane of POTORI is mainlybased on passive optical components to interconnect servers in a rack. On theother hand, to avoid traffic conflict, POTORI requires a proper control protocolto efficiently coordinate the data transmission inside the rack. The contribution ofthe thesis can be divided into the design of the data plane and the control plane ofPOTORI.
1.2.1 Reliable and Cost-Efficient Data Plane Design of POTORIModern fault-tolerant data centers require very high availability of the overall in-frastructure. As the result, the availability of the connection established for thecommunication among the servers should be even higher. In POTORI, the passivenature of the interconnect components brings the obvious advantages in terms ofthe cost, power consumption and reliability performance. Paper I of this the-sis presents the data plane design of POTORI and provides a cost and reliabilityanalysis. The results show that POTORI is able to achieve intra-rack connectionavailability higher than 99.995% in a cost-efficient way.
1.2.2 Centralized Control Plane Design of POTORIPaper II and III of the thesis present a novel control plane tailored for POTORI.The control plane of POTORI is based on a rack controller, which manages thecommunications inside a rack. Each server exchanges control messages with therack controller through a dedicated control link. A media access control (MAC)protocol for POTORI defines the procedure of the control message exchange anddata transmission in the rack. Moreover, the rack controller is running the pro-posed dynamic bandwidth allocation (DBA) algorithm determining the resource(i.e., wavelength and time) allocation used by the servers.
1.3 Research Methodology
We apply a quantitative method in our research project. First, we propose the dataplane of the passive optical interconnects (POIs) architecture which addresses the

4 CHAPTER 1. INTRODUCTION
aforementioned issues. Numerical results of cost and availability are calculated byapplying the cost and reliability model to the different schemes of the POIs. Then,we design the control plane (including a media access control (MAC) protocol anda dynamic bandwidth allocation (DBA) algorithm) for the proposed POI. Theperformance (i.e., average packet delay, packet drop ratio) of the architecture isevaluated by a customized event-driven simulator. Finally, we are planning toexperimentally evaluate the architecture, including both data plane and controlplane, in the future work.
1.4 Sustainability Aspects
As academic researchers, we should contribute to a sustainable world. We considerthree major types of the sustainability in our research: environmental, economic,and societal sustainability.
Environmental SustainabilityThe increasing energy consumed by DCs is becoming a more and more challengingissue. A non-neglected proportion (about 4% to 12% [5]) of total power is consumedby DCN. By replacing the electronic packet ToR switches with the proposed POIin the thesis, the total power consumption of the DCN can be reduced significantly.
Economic SustainabilityOptical interconnects are considered more cost-efficient and reliable compared tothe modern electronic packet switches [7]. As mentioned in the previous sections,DC operators are considering optical architectures for the aggregation and core tierof DCN. The work presented in this thesis proposed is the POI for the access tierof DCN, which can be integrated to the existing optical architectures seamlessly.
Societal SustainabilityNormally, the ordinary users will not own private DCs. However, by saving thebills on the cost and power consumption, DC operators can offer services withlower price, which makes all kinds of applications running in DCs more affordableby common users.
1.5 Organization of the Thesis
The thesis is organized as follows:
• Chapter 2 introduces different passive optical interconnect (POI) architec-tures that can be used as POTORI’s data plane. Specifically, the cost and

1.5. ORGANIZATION OF THE THESIS 5
reliability models as well as the corresponding numerical results of these POIsare presented.
• Chapter 3 presents the detailed control plane design of POTORI, includingthe proposed MAC protocol and DBA algorithm. In the simulation results,the performance in terms of the average packet delay and packet drop ratiois compared with the EPS. Moreover, the impact of different network config-uration of POTORI on the average packet delay is presented.
• Chapter 4 concludes the thesis and highlights the possible future work.
• Finally, there is a brief summary of the papers included in the thesis alongwith the candidate’s contributions to each paper.


Chapter 2
Reliable and Cost Efficient DataPlane of POTORI
Modern data center operators are upgrading their network devices (e.g. switches,routers) to higher data rates (e.g., 10 Gb/s) in order to serve the fast increasingtraffic volume within data center networks [2], while in the future even higher datarates, i.e., 40 Gb/s and 100 Gb/s, are expected to be used [3]. As a result, the costand energy consumption will increase dramatically in order to scale data centernetwork to such high transmission capacity. On the other hand, the higher trans-mission rate, the greater volume of data center traffic will be affected in case ofa network failure. A fault-tolerant data center infrastructure, including electricalpower supply for servers and network devices as well as storage system and dis-tribution facilities, should be able to achieve high availability (e.g., 99.995% [15]).Consequently, connection availability in data center networks (DCNs) should behigher than the required availability level of the total data center infrastructure,since the DCN is only a part of the overall service chain offered by the data centerinfrastructure. Different topologies (e.g., fat-tree[16], Quartz[17]) are proposed toimprove the resiliency by providing redundancy in the aggregation and core tiersof DCN. However, the access tier is usually unprotected due to the high cost ofintroducing redundant ToR switches for every rack in data center.
Meanwhile, the use of an optical optical interconnect is a promising solutionto solve the scalability problem brought by the conventional EPS DCN. Particu-larly, passive optical interconnects (POIs) are able to support ultra-high capacityin reliable, energy- and cost-efficient way due to the passive feature of the appliedoptical components (e.g., couplers, arrayed wavelength gratings (AWGs)). Manyworks have been done to show the advantage of POI in terms of cost and energyconsumption [7] [14], but the reliability performance of POI is first addressed inthe frame of this thesis.
This chapter presents and analyzes different reliable and cost-efficient POI basedschemes that can be used as POTORI’s data plane. Moreover, one of the schemes
7

8CHAPTER 2. RELIABLE AND COST EFFICIENT DATA PLANE OF
POTORI
can further enhance the reliability by introducing extra redundant components.The reliability and cost models of these schemes are described and the numericalresults in terms of the cost and connection unavailability are shown and comparedwith the conventional EPS.
2.1 Passive Optical Interconnects
Paper I presents three POIs, see Fig. 2.1, that can be used as the data plane ofPOTORI. In these three POI schemes, each server in a rack is equipped with anoptical network interface (ONI), which consists of a wavelength tunable transceiver.It allows one server to transmit and receive data on different wavelengths in a givenspectrum range (e.g., C-band). The following paragraphs briefly introduce thesethree POI schemes.
Scheme I: AWG based POIThe POI shown in Fig 2.1 (a) uses an (N+K)×(N+K) arrayed waveguide grating(AWG) as the switching fabric where each wavelength tunable transmitter (WTT)and receiver (RX) in ONI is connected to a pair of input and output ports ofthe AWG, respectively. Here N is the maximum supported number of servers fora rack and K is the number of uplink ports that can be connected to the otherracks or the switches in aggregation/core tier. This scheme is inspired by thePOI proposed in [18]. In this scheme, N+K wavelengths are required to supportintra-rack communications between any pair of servers within the rack and inter-rack communications between servers and uplink ports. Fig 2.2 gives a properwavelength plan for Scheme I based on the cyclic property of the AWG. The greyfields in Fig 2.2 indicate that no wavelength is needed, since there is no trafficpassing through the POI destined to the same source server (i.e. fields in thediagonal) or between K uplink ports (i.e. fields in the right bottom corner) orbetween different ports connecting to the outside of the rack.
Scheme II: (N+1)×(N+1) coupler based POIFig 2.1 (b) shows Scheme II. In this POI, an (N+1)×(N+1) coupler interconnectsN servers in a rack. Similar to Scheme I, each ONI on server is connected toone pair of the input and output ports of the coupler. One input and outputport of the coupler is reserved to connect to a wavelength selective switch (WSS).Unlike AWG-based Scheme (i.e., Scheme I) which requires a fixed predeterminedwavelength plan, Scheme II has higher flexibility in wavelength allocation due thebroadcast nature of the coupler. The WTT in ONI is able to transmit data trafficon any available wavelength. The data will be broadcast to all the output ports ofthe coupler. A wavelength tunable filter (WTF) in ONI is used to select the specificwavelength assigned to the communication and filter out the rest of signals. The

2.1. PASSIVE OPTICAL INTERCONNECTS 9
Figure 2.1: (a) Scheme I: (N+K)×(N+K) AWG based POI, (b) Scheme II:(N+1)×(N+1) coupler based POI and (c) Scheme III: N×4 coupler based POI(WTT: Wavelength Tunable Transmitter, AWG: Arrayed Waveguide Grating, ONI:Optical Network Interface, RX: Receiver, WTF: Wavelength Tunable Filter, WSS:Wavelength Selective Switch). © 2015 IEEE (Paper I)

10CHAPTER 2. RELIABLE AND COST EFFICIENT DATA PLANE OF
POTORI
Figure 2.2: Wavelength plan for AWG based POI. © 2015 IEEE (Paper I)
WSS will also select the wavelengths assigned to the inter-rack communication andblock the wavelengths for the intra-rack communication.
Scheme III: N×4 coupler based POIScheme III is shown in Fig 2.1 (c). It enhances the reliability of POI which isproposed in [7]. In this scheme, the ONI on server is connected to only one side ofthe coupler. The ports on another side of the coupler are connected to a WSS. Allthe traffic sent by servers is received first by the WSS, which loops back the wave-lengths assigned to the intra-rack communication to the coupler, and forwards thewavelength assigned to the inter-rack communication through the rest of interfaces.Similar to the Scheme II, a WTF is needed in the ONI to select the signal destinedto the corresponding server. In this scheme, WSS is the key component since allthe traffic will pass it and it is responsible to separate intra- and inter-rack datatraffic based on the wavelength assignment. WSS is an active component whichhas lower availability than the passive component (i.e., coupler). A backup WSS isintroduced to further improve the reliability performance of this POI.
2.2 Reliability and Cost Model
In this section, we focus on the analysis of intra-rack communication. The samemethodology can be applied to inter-rack communication or aggregation/core tier.Fig 2.3 shows the reliability block diagrams (RBDs) of the intra-rack communi-cation for the EPS and the three POIs described in the previous chapter. RBDillustrates the availability model of a system or connection. Series configurationrepresent the system (or connection) which is available only and only if all theconnected blocks are available. On the other hand, in parallel configuration atleast one branch of connected blocks need to be available. Here, each block ofRBD represents different active or passive component for the intra-rack communi-cation. We compare the connection availability of Scheme I, Scheme II, and SchemeIII (with and without protection) with connection availability of the regular EPS

2.2. RELIABILITY AND COST MODEL 11
Figure 2.3: Reliability block diagrams. © 2015 IEEE (Paper I)
based scheme. Connection availability of a scheme is defined as the probabilitythat the connection between two transceivers within a rack has not failed. In Fig.2.3 (a) - (d), the overall availability of intra-rack communication can be derived bycalculating the product of the availabilities of each individual component (block).In Fig. 2.3 (e) some redundant components are connected in parallel, so the overallconnection availability is improved compared to the unprotected schemes. Moredetails about the reliability models are given in Paper I.
The total cost of POI is calculated as the sum of the cost of all the networkcomponents inside a rack. First, the cost of a single ONI is the sum of the cost ofthe components that the ONI is built of (e.g., WTT, RX, WTF). Then, the totalcost of ONIs in N servers inside a rack can be calculated as the cost of single ONImultiplied by N. Finally, the cost of a POI can be obtained by adding the cost ofthe remaining components (e.g., coupler, AWG, WSS, etc.) to the total cost of theONIs. More details on the cost model can be found in Paper I.

12CHAPTER 2. RELIABLE AND COST EFFICIENT DATA PLANE OF
POTORI
Table 2.1: MTBF and cost of the network elements [?].Components MTBF1 Cost
10GE Electronic Switch 150 000 h 3 CU2(port)10Gbps Grey Transceiver 600 000 h 0.5CU
10Gbps Tunable Transceiver 500 000 h 1.3CUWSS 300 000 h 8.3CUAWG 4 000 000 h 0.1 CU(port)
Coupler 6 000 000 h 0.02 CU(port)Isolator 12 000 000 h 0.3CU
Circulator 12 000 000 h 0.7 CUWavelength Tunable Filter 4 000 000 h 0.3 CU
1. Mean Time Between Failures2. CU is the cost unit. 1 CU = 150 USD.
2.3 Performance Evaluation
With the reliability model and cost model presented in the previous section, we canevaluate performance of the proposed POIs in terms of connection unavailabilityand cost. We consider a rack with 48 servers, and the transmission data rate of10 Gb/s. We compare POI based schemes to the EPS scheme. The results areshown in Fig. 2.4. Table 2.1 shows the mean time between failures (MTBF) andcost of each network component in the POIs and EPS. Note that for the y axis ofFig. 2.4, the unavailability of a system is defined as the probability that systemfails at an arbitrary instant of time, and it can be defined as 1 - A, where A is theavailability of the system. The calculation of the unavailability values is based onMTBF of components and mean time to repair (MTTR). The MTTR is dependenton the data center operator’s maintenance policy. In Fig 2.4, we consider two typeof MTTR (4h in (a) and 24h in (b)) representing fast and slow reparation timebased on different policies.
Ideally, the data center operator would prefer a scheme with low cost and lowunavailability of the connection. It can be seen that all of the proposed POIsshow a great advantage compared to the EPS. Specifically, Scheme I and Scheme IIperform better than other schemes, i.e. they have the lowest cost and also obtainmuch lower unavailability compared to the other schemes. On the other hand, theunprotected Scheme III shows the higher cost due to the extra circulator in eachONI, and it has the similar connection unavailability as the EPS. However, theprotected Scheme III with a redundant WSS further improves the availability tothe similar level as obtained by Scheme I and Scheme II, at the expense of a slightlyincreased cost. More detailed analysis and comparison of the performance can befound in Paper I.

2.3. PERFORMANCE EVALUATION 13
Figure 2.4: Unavailability v.s. total cost of three POIs for different MTTR values.© 2015 IEEE (Paper I)


Chapter 3
Centralized Control Plane ofPOTORI
As mentioned in the previous chapter, the coupler-based passive POIs have moreflexibility in the wavelength allocation for managing the communication inside arack comparing to the AWG-based POI. Thus, in this chapter, we focus on thecontrol plane for the couple-based POIs. Note that a similar control plane approachcan be applied to AWG-based POI as well.
With wavelength tunable transceiver deployed in ONI, the data transmission inPOTORI is done in the optical domain. Specifically, the transmitter of the sourceserver and receiver of the destination server need to be tuned to the same wave-length so that a successful data transmission can be achieved. Moreover, concurrentcommunications inside the rack must be carried on different wavelengths in orderto avoid collision in the coupler. As a consequence, a proper control plane design isneeded for managing the intra-rack and inter-rack communication in both spectrumand time domains.
This chapter gives an overview of the control plane of POTORI. Our proposedPOTORI’s control plane relies on a centralized control entity namely rack con-troller. The rack controller is in charge of running resource allocation algorithmand communicating with servers by exchanging control messages. The tailoredMAC protocol and dynamic bandwidth allocation (DBA) algorithms are shown inthe following subsections. Finally, the performance of the proposed control schemesin terms of the average packet delay and packet drop ratio are illustrated and ana-lyzed.
3.1 Overview of the control plane of POTORI
The centralized control plane of POTORI is referred to as a rack controller, whichis shown in Fig 3.1. The rack controller and servers’ ONIs are connected via dedi-cated control links. In order to coordinate the communications of servers, the rack
15

16 CHAPTER 3. CENTRALIZED CONTROL PLANE OF POTORI
Figure 3.1: POTORI based on: (a) (N+1)×(N+1) Coupler, (b) N×2 Coupler ©2016 IEEE (Paper II)

3.2. MEDIUM ACCESS CONTROL PROTOCOL 17
Figure 3.2: POTORI’s Rack Controller © 2017 IEEE (Paper III)
controller needs to first collect relevant information (e.g. buffer size, destinationserver of data transmission, etc.) from each ONI. The POTORI’s MAC protocoldefines the format of control messages and message exchanging procedures for therack controller and servers. After receiving the servers’ information and doing theregular switch table lookup (i.e., map the source and destination server to the inputport and output port of coupler), the rack controller runs a DBA algorithm, deter-mining the wavelength and timeslot assigned for different data transmissions for allthe servers in a rack. Finally, these decisions will be sent back to all the servers,and the servers transmit/receive data on the specified wavelengths and timeslots.
The control plane of POTORI can be easily integrated into the overall controlarchitecture of the whole data center. The rack controller can be connected to ahigher layer DC controller. Specifically, the rack controller can be equipped with aconfigurable switch table (e.g., an OpenFlow [19] switch table) and a configurableresource allocation module (see Fig. 3.2), so that the flow rules and employedDBA algorithm can be dynamically updated by the DC controller. In this thesis,we consider a simpler case of rack controller which only performs simple layer 2function and runs a fixed DBA algorithm, and we leave the configurable modulesfor the future work.
3.2 Medium Access Control Protocol
Due the the broadcast nature of the coupler, a proper MAC protocol is required forPOTORI in order to efficiently manage the communications without any collisioninside the rack. Several MAC protocols have been proposed for different networkscenarios, but as it is shown in the following subsection, the framework presentedin this thesis is the first that can be directly applied to POTORI. In this regard, wepropose a novel centralized cycle-based MAC protocol that is tailored for POTORI.

18 CHAPTER 3. CENTRALIZED CONTROL PLANE OF POTORI
3.2.1 Related Work
Depending on whether a central controller is involved or not, the existing MACprotocols can be categorized as distributed and centralized. In the distributed MACprotocol, each node in the network makes its own decision on the resources about thedata transmission based on the control information collected from other nodes. Oneexample is the carrier sense multiple access with collision detection (CSMA/CD)[20], which is the standard MAC protocol of the old version of Ethernet (with 10Mb/s, 100 Mb/s), but is not practical for Ethernet with a higher data rates (e.g., 10Gb/s). Another interesting example is the high-efficient distributed access (HEAD)protocol proposed in POXN [21]. In the HEAD protocol, the control information isbroadcast from one server to all the other servers in a rack. As the author stated,the collision of transmitting control information may occur during the broadcast.In the case of collision, the server needs to wait for a random back-off period,which introduces a significant control overhead and decreases the performance ofthe network (e.g., packet delay).
In the centralized MAC protocol, a centralized controller exchanges control in-formation with the nodes inside a network and manage the data transmission amongall nodes. One typical example is the IEEE 802.11 protocols [22] used for Wi-Fi,and another example would be the multipoint control protocol (MPCP) [23] usedfor the Ethernet passive optical networks (EPON). In EPON, each optical networkunit (ONU) transmits both control information and data packets to the opticalline terminal (OLT). However, these centralized MAC protocols are not applica-ble to POTORI, since they either do not support wavelength division multiplexing(WDM) scenarios, or do not support multipoint-to-multipoint communications,both of which are essential for POTORI.
3.2.2 The proposed MAC Protocol for POTORI
Fig. 3.3 shows the proposed MAC protocol. The centralized POTORI’s MACprotocol is cycle-based, and it follows a Request-Grant approach. Thanks to thededicated control channel between servers and rack controller, the control informa-tion exchanging and data transmission can be done in parallel. From the controlplane’s perspective, at the beginning of each cycle, each server needs to report tothe rack controller in the Request message about the information of the stored datain its buffer. Based on the received Request message from all the servers in a rackas well as the interfaces towards the outside of the rack, the rack controller runs theDBA algorithm and computes the allocation of the wavelength and timeslot of thedata transmission for the servers. These resource allocation decisions are then sentback to the servers with the Grant message. The Grant message contains all thenecessary information for the data transmission of a server (e.g., the wavelengthand timeslot used by the server to transmit/receive the data, the ending timestampof the cycle, etc.).
On the other hand, servers transmit and receive data according to the Grant

3.3. DYNAMIC BANDWIDTH ALLOCATION ALGORITHM 19
Figure 3.3: POTORI’s MAC Protocol © 2017 IEEE (Paper III)
message received on the NEXT cycle (relative to the cycle mentioned for the controlplane). At the beginning of the NEXT cycle, the servers first tune its transceiver tothe specified wavelength. Here we consider that the tuning time of the transceiveris not negligible comparing to the transmission time of the data at high data rate.Then, each server transmits the data to the specified destination server. The cyclelasts until the ending timestamp, which is also the beginning of the following cycle.Then the whole procedure repeats. More detailed information on the MAC protocolas well as the structure of the Request and Grant message can be found in PaperIII.
3.3 Dynamic Bandwidth Allocation Algorithm
As mentioned in the previous sections, in each cycle the rack controller needs tomake decision on allocating resources in both wavelength and time domain for allservers in a rack. Thus, the DBA algorithm running at the rack controller has agreat impact on the overall network performance (e.g., packet delay).
After receiving the Request messages from all servers and uplink interfaces, therack controller can build a traffic demand (TD) matrix, where each row representsthe amount of traffic (in bytes) addressed to different output ports (destination)reported by a certain input port (source). Based on the TD matrix of each cycle, aDBA algorithm computes a feasible solution of the wavelength assignment for thedifferent traffic demands without any wavelength conflict. A wavelength conflicthappens when different traffic demands are assigned with the same wavelength (i.e.data collision in coupler), or there is more than one wavelength assigned in a row

20 CHAPTER 3. CENTRALIZED CONTROL PLANE OF POTORI
Figure 3.4: Traffic Demand Matrix
or column (i.e. wavelength clash at a transmitter or receiver). Fig. 3.4 givesan example of TD matrix and a feasible solution of DBA algorithm. The trafficdemands that are assigned with wavelengths are shown in different colors. Withthis result gained from the DBA algorithm, the rack controller is able to form theGrant messages containing the relevant information and send them back to all theservers.
In this section we discuss different algorithms that can be applied to POTORIand propose a new heuristic algorithm, namely “Largest First”.
3.3.1 Related WorkThe problem described above is similar to finding bipartite matching in a N-verticesgraph [24], which has been widely studied and applied in the classical electronicpacket switch scheduling problems. In the EPS, the incoming data are stored inthe buffers at different input ports and then forwarded to the output ports. Thetraditional crossbar switch is able to forward data from multiple input ports to dif-

3.3. DYNAMIC BANDWIDTH ALLOCATION ALGORITHM 21
ferent output ports simultaneously without any collision. Different EPS schedulingalgorithms have been proposed over decades to achieve high throughput and lowpacket delay.
An example is the algorithm based on the Birkhoff-von-Neumann (BvN) [25].The BvN algorithm is able to decompose any TD matrix into a combination of dif-ferent permutation matrix, where each permutation matrix can be used as a feasiblesolution for matching input and output ports. The authors in [26] have proposedan EPS based on the BvN algorithm. Similarly, the authors in [27] have applied theBvN algorithm to find scheduling solutions to configure the optical circuit switch inDCs. However, the high running-time complexity of matrix decomposition in thecomputation makes the BvN algorithm unsuitable for POTORI.
Another example for scheduling is the famous iSLIP algorithm [28], which hasbeen widely used in the EPS. The iSLIP algorithm is an advanced round-robinalgorithm and has a much lower running-time complexity compared to BvN. More-over, it can be easily implemented in the hardware for the EPS. However, the iSLIPalgorithm is not designed to support WDM. Therefore, we adapt the iSLIP algo-rithm with supporting wavelength allocation in POTORI as the benchmark DBAalgorithm, and compare it to our proposed algorithm. More details on the iSLIPand its adaption to POTORI can be found in Paper III.
Algorithm 1 Largest First Algorithm1: Input: M; W; const R2: %Input: traffic demand matrix M, wavelength list W, transceiver data rate R3: tX ← [None,None...]; txT ime← [0, 0]4: rX ← [None,None...]; rxT ime← [0, 0]5: ListT←M.sort()6: repeat7: D ← T[0]8: if D.tX is None and D.rX is None then9: D.assigned← True
10: tX[D.src]← [W[0] : [0, D.size/R]]11: rX[D.dst]← [W[0] : [0, D.size/R]]12: txT ime[D.src]← D.size/R13: rxT ime[D.dst]← D.size/R14: delete W[0]15: delete T[0]16: until T or W is Empty17: return tX, rX
Figure 3.5: Largest First Algorithm

22 CHAPTER 3. CENTRALIZED CONTROL PLANE OF POTORI
3.3.2 Largest First
We propose a greedy heuristic DBA algorithm, namely “Largest First” (LF). Fig.3.5 gives the pseudo code of LF. The input of the algorithm is the TD matrix (M)of the current cycle, the number of available wavelength (W) for the assignment,and a constant value of the data rate (R) (Line 1 in Fig. 3.5). The LF algorithmfirst sorts the elements (traffic demands) of the TD matrix into a list T in thedescending ordering (Line 5 in Fig. 3.5). Then starting from the first (i.e., largest)element in T, a wavelength is assigned to a traffic demand if and only if there isno wavelength clash at the transceiver, i.e., both the transmitter and receiver as-sociated to this demand are not assigned with any wavelength in the current cycle(Line 8 in Fig. 3.5). The corresponding information (e.g., the assigned wavelength,transmitting/receiving timestamps) is updated in the transceiver list tX and re-ceiver list rX (Line 10-14 in Fig. 3.5). In the case of wavelength clash, the trafficdemand is skipped and left for the next cycle. The iteration stops when there areno more available wavelengths that can be assigned or the last traffic demand isserved (Line 16 in Fig. 3.5). The output of the LF algorithm (i.e., trX and rX) isused by the rack controller to generate the Grant message.
3.4 Performance Evaluation
In this section, we mainly focus on the evaluation of two performance indicators ofPOTORI, i.e., the average packet delay and packet drop ratio, and we compare thesimulation results with the conventional EPS. We also illustrate the impact of thetuning time of the transceiver (TT u) and the maximum transmission time of eachcycle (TM ) on the performance of average packet delay under different load. In thesimulation, we consider a rack with 64 servers and 16 uplink interfaces, and thereare 80 available wavelengths. The data rate of the tunable transceiver is 10 Gb/s.The traffic model of the simulation is derived from [13] and [29], which is close to thereal traffic pattern in DCs. More detailed aspects of the performance evaluation,including the parameters of the input traffic model, salability and impact of thenumber of wavelengths, can be found in Paper III.
A. POTORI vs. EPS
Fig 3.6 shows the average packet delay and packet drop ratio of POTORI with LFand iSLIP DBA algorithm as well as the EPS with iSLIP. The tuning time of thetransceiver (TT u) is 50 ns [30] and the maximum transmission time of each cycle(TM ) is 1.2 µs. It can be seen in Fig 3.6 (a) that POTORI with LF has the bestperformance. Under the load lower than 0.5, LF can achieve an average packetdelay lower than 10 µs, which is similar to the one obtained for EPS. Fig 3.6 (b)shows the packet drop ratio. It can be seen that LF performs slightly better thanEPS (around 2% difference). The average packet delay of iSLIP under load lower

3.4. PERFORMANCE EVALUATION 23
Figure 3.6: (a) Average Packet Delay (b) Packet Drop Ratio © 2017 IEEE (PaperIII)
than 0.5 is double as high as that of LF. Moreover, POTORI with iSLIP also showsthe highest packet drop ratio among all the tested schemes.

24 CHAPTER 3. CENTRALIZED CONTROL PLANE OF POTORI
Figure 3.7: Average Packet Delay of (a) TM = 1.2 µs with different TT u; (b) TT u
= 2 µs (c) TT u = 5 µs with different ratio between TM and TT u
B. Transceiver’s Tuning Time v.s. Cycle’s MaximumTransmission TimeAs it is shown in the previous subsection, with an ultra-fast tuning time TT u =50ns and a maximum transmission time of TM = 1.2 µs, POTORI with LF is able toachieve a good performance similar to the EPS. Setting TM = 1.2 µs for POTORIis equivalent to a packet-level switching granularity, since there is at most onepacket transmitted in each cycle under the data rate of 10 Gb/s. However, ifTT u increases, achieving packet-level switching granularity in POTORI while stillmaintaining average packet delay < 100 µs is challenging, due to a larger tuningoverhead. Fig 3.7 (a) shows the average packet delay with different TT u given TM
= 1.2 µs. With TT u of 50 ns and 240 ns, the average packet delay is lower than 100µs under a load of 0.6. With a larger TT u, the performance is much worse undermedium load (e.g., 0.6).
In order to achieve a better performance with larger TT u, the TM should beincreased so that the tuning overhead can be reduced. Figures 3.7 (b) and (c) show

3.4. PERFORMANCE EVALUATION 25
the average packet delay of POTORI as a function of TM/TT u,where TT u is equalto 2 µs and 5 µs, respectively. If the ratio is as low as 1 or 2, the packet delaycan be as high as 104 µs under load = 0.6. With a higher ratio (i.e., >=3), theperformance is obviously better under load = 0.6. More detailed analyses on theTT u and TM can be found in Paper III.


Chapter 4
Conclusions and Future Work
This chapter concludes the thesis and describes the extension work that is plannedto be done in the future.
4.1 Conclusions
This thesis presents a passive optical interconnect designed for the access tierof DCN, referred to as POTORI. Compared to the conventional EPS, POTORIachieves lower power consumption and cost, and higher reliability while maintain-ing good network performance (e.g., average packet delay lower than 10 µs).
The overall POTORI architecture can be divided into data plane and controlplane. The POTORI’s data plane is based on passive components to interconnectthe servers in a rack. The passive components in POTORI bring obvious advan-tages in terms of cost, energy consumption and reliability compared to the activeEPS. The cost and connection availability of POTORI and EPS are evaluated.The results show that POTORI has lower cost and higher connection availability(i.e., >99.995% and beyond) at the high data rate (i.e., 10 Gb/s) and verify thatPOTORI is able to achieve high reliability in a cost-efficient way.
The control plane of POTORI is based on a centralized controller, which co-ordinates the intra-rack and inter-rack communications. A centralized cycle-basedMAC protocol is proposed to manage the control message exchange and data trans-mission in the rack. Moreover, the rack controller runs a tailored DBA algorithm,namely Largest First (LF), which determines the resource (i.e., wavelength andtime) used by servers. The simulation results show that with ultra-fast tunabletransceiver, POTORI with LF is able to achieve an average packet delay lowerthan 10 µs, which outperforms the EPS. Moreover, the impact of transceiver’stuning time and maximum transmission time of each cycle on the average packetdelay is evaluated. The results reveal that POTORI is able to achieve a packet-levelswitching granularity with a tuning time of the transceivers that is 30% shorter thanthe packet transmission time. If the tuning time is longer, increasing the maximum
27

28 CHAPTER 4. CONCLUSIONS AND FUTURE WORK
transmission time of each cycle (i.e. to greater than 2 times of transceiver’s tuningtime) is still able to achieve an average packet delay under 100 µs.
4.2 Future Work
In the current work, the performance results are obtained from the simulation.In the future, we plan to experimentally validate the POTORI’s control plane.A demo of POTORI’s control plane will be developed, where the reconfigurablemodules (e.g., switch tables, DBA algorithm) of the rack controller can be updatedby a DC controller. This demo will be able to prove the concept of POTORI aswell as investigate the possibility to integrate the POTORI’s controller with theoverall DCN’s control plane.
On the other hand, the current POTORI control plane is designed for the ac-cess tier of DCN only. After integrating POTORI with the optical aggregation/coretier, a new control scheme coordinating the intra-DC traffic should be designed. Itwould also be interesting to consider inter-DC scenario, where all-optical connec-tions between POTORIs at different DC are established. In this case, the dataplane and the control plane of the optical aggregation/core tier would need to becarefully designed and evaluated.

Bibliography
[1] Cisco Global Cloud Index: Forecast and Methodology, 2015-2020, Cisco WhitePaper
[2] A. Andreyev, “Introducing data center fabric, the next-generation Facebookdata center network.”https://code.facebook.com/posts/360346274145943, 2014.
[3] Data Center Design Considerations with 40 GbE and 100 GbE, Aug. 2013,Dell white paper.
[4] N. Binkert et al., “The role of optics in future high radix switch design,” inProc. IEEE ISCA, 2011, pp.437-447.
[5] R.Priesetal. et al.,“Power consumption analysis of data center architectures,”in Green Communications and Networking, 2012.
[6] C. Kachris et al, Optical Interconnects for Future Data Center Networks. 2013.
[7] M. Fiorani et al., “Energy-efficient elastic optical interconnect architecture fordata centers,” in IEEE Communications Letters, vol.18, pp. 1531-1534, Sept.2014.
[8] G. Wan et al., “c-through: part-time optics in data centers,” in Proc. ACMSIGCOMM Conf., 2010, pp. 327-338.
[9] M.Fiorani et al., “Hybrid Optical Switching for Data Center Networks,” inHindawi Journal of Electrical and Computer Engineering, Vol. 2014, ArticleID 139213, 13 pages, 2014.
[10] F. Yan et al., “Novel Flat Data Center Network Architecture Based on OpticalSwitches With Fast Flow Control,” in IEEE Photonics Journal, vol. 8, number2, April 2016.
[11] M. Yuang et al., “OPMDC: Architecture Design and Implementation of a NewOptical Pyramid Data Center Network,” in IEEE/OSA Journal of LightwaveTechnology, vol. 33, issue 10, pages 2019-2031, May 2015.
29

30 BIBLIOGRAPHY
[12] M. Fiorani et al., “Optical spatial division multiplexing for ultra-high- capacitymodular data centers,” in Proc. IEEE/OSA Opt. Fiber Commun. Conf. 2016,Paper Tu2h.2
[13] A. Roy et al., “Inside the Social Network’s (Datacenter) Network,” in Proc.ACM SIGCOMM Conf., 2015 pp. 123-237.
[14] J. Chen et al., “Optical Interconnects at Top of the Rack for Energy- EfficientDatacenters,” in IEEE Communications Magazine, vol. 53, pp. 140-148, Aug.2015.
[15] Data center site infrastructure tier standard: topology”, uptime institute, 2010.
[16] R.N. Mysore, et al., ”Portland: a scalable fault-tolerant layer 2 data center net-work fabric”, in Proc. of ACM SIGCOMM Computer Communication Review,vol. 39, pp. 39-50, Oct. 2009.
[17] Y. Liu, et al., ”Quartz: a new design element for low latency DCNs”, in Proc.ACM SIGCOMM Conf., 2014
[18] Y. Yawei et al., ”LIONS: An AWGR-based low-latency optical switch for high-performance computing and data centers”, in IEEE J. Sel. Topics QuantumElectron., vol. 19, no. 2, p. 360- 409, Mar./Apr. 2013.
[19] N. McKeown et al., “OpenFlow: Enabling innovation in campus net- works,”in ACM SIGCOMM Computer Communication, Review 38, April 2008.
[20] “802.3-2012 - IEEE Standard for Ethernet”.
[21] W. Ni et al., “POXN: a new passive optical cross-connection network for lowcost power efficient datacenters,” in IEEE/OSA Journal of Lightwave Tech-nology, vol. 32, pp. 1482-1500, Apr. 2014.
[22] “IEEE Standard for Information technology-Telecommunications and informa-tion exchange between systems Local and metropolitan area networks-Specificrequirements Part 11: Wireless LAN Medium Access Control (MAC) andPhysical Layer (PHY) Specifications”.
[23] L. Khermosh, “Managed Objects of Ethernet Passive Optical Networks(EPON),” RFC 4837, July 2007.
[24] T. Anderson, S. Owicki, J. Saxe, and C. Thacker, “High speed switch schedul-ing for local area networks,” in ACM Trans. Comput. Syst., vol. 11, no. 4, pp.319-352, Nov. 1993.
[25] 25 G. Birkhoff. Tres Observaciones Sobre el Algebra Lineal. Univ. Nac. Tu-cuman Rev. Ser. A, 5:147-151, 1946.

BIBLIOGRAPHY 31
[26] C. Chang, et al., “Load balanced Birkhoff-von Neumann switches,” IEEEWorkshop on High Performance Switching and Routing, Dallas, TX, 2001,pp. 276-280.
[27] G. Poter et al., “Integrating microsecond circuit switching into the data cen-ter,” in Proc. ACM SIGCOMM Conf., 2013 pp. 447-458.
[28] N. McKeown, “The iSLIP Scheduling Algorithm for Input-Queued Switches,”in IEEE/ACM Trans. on Networking, vol. 7, no 2, pp.188-201, 1999.
[29] S. Kandula et al., “The Nature of Datacenter Traffic: Measurement and Anal-ysis,” in Proc. ACM SIGCOMM Internet Eas. Conf., 2009, pp. 202-208
[30] S. Matsuo et al., “Microring-resonator-based widely tunable lasers,” in IEEEJ. Sel. Topics Quantum Electron, vol. 15, no. 3, pp. 545-554, 2009.


Summary of the Original Works
Paper I. Y. Cheng, M. Fiorani, L. Wosinska, and J. Chen, “Reliable andCost Efficient Passive Optical Interconnects for Data Centers,” inIEEE Communications Letters, vol. 19, pp. 1913-1916, Nov. 2015.In this paper, three schemes of passive optical interconnect (POI) forthe access tier of the data center networks are presented. Moreover,these three schemes as well as electronic packet switch (EPS) basedscheme are analyzed in terms of the cost and reliability. The resultsshow that compared to the EPS scheme, POI schemes are able toachieve higher availability in a cost-efficient way.Contribution of author : Cost and reliability calculations for differentPOI architectures, analysis and interpretation of results, preparationof the first draft and updated versions of the manuscript.
Paper II. Y. Cheng, M. Fiorani, L. Wosinska, and J. Chen,“Centralized Con-trol Plane for passive Optical Top-of-Rack Interconnects in DataCenters,” in Proc. IEEE Global Communications Conference (GLOBE-COM), Dec. 2016. In this work, we state our novel rain detectionalgorithm in the context of patent.In this paper, the centralized control plane of POTORI is presented,including the MAC protocol and dynamic bandwidth allocation (DBA)algorithms. A rack controller is proposed to coordinate the commu-nication in the rack by exchanging the control messages with serversand running the proposed DBA algorithm. The simulation resultsshow that the proposed DBA algorithms outperform the benchmarkalgorithm in terms of the average packet delay and packet drop ratio.Contribution of author : Proposing and implementation of the MACprotocol and DBA algorithms, development of the simulator, collec-tion of simulation results, analysis and interpretation results, prepa-ration of the first draft and updated versions of the manuscript,preparation of the presentation slides for the conference.
Paper III. Y. Cheng, M. Fiorani, R. Lin, L. Wosinska, and J. Chen,“POTORI:A Passive Optical Top-of-Rack Interconnect Architecture for Data
33

Centers,” in IEEE/OSA Journal of Optical Communications andNetworking (JOCN), to appear, 2017.This paper extends Paper II. II by introducing the following newcontributions: (1) illustration of how POTORI as the access tiercan be integrated into the overall data center network; (2) Extensiveperformance comparison among POTORI with different DBA algo-rithms as well as electronic packet switch; (3) Evaluating the impactof different network configurations on the performance of POTORI.Contribution of author : Run simulation, collection of simulation re-sults, analysis and interpretation results, preparation of the firstdraft and updated versions of the manuscript,


IEEE COMMUNICATIONS LETTERS 1
Reliable and Cost Efficient Passive OpticalInterconnects for Data Centers
Yuxin Cheng, Matteo Fiorani, Lena Wosinska, and Jiajia Chen
Abstract—To address the sustainability, scalability and re-liability problems that data centers are currently facing, wepropose three passive optical interconnect (POI) architec-tures on top of the rack. The evaluation results show that allthree architectures offer high reliability performance (con-nection availability for intra-rack interconnections higherthan 99.999%) in a cost-efficient way.
Index Terms—Optical communications, data center inter-connects, reliability analysis, cost models.
I. INTRODUCTION
The growing popularity of cloud applications is drasticallyincreasing the traffic volumes that data centers have tohandle [1]. Consequently, the transmission capacity insidethe data centers is rapidly growing. The majority of theservers today are equipped with 1Gbps or 10Gbps interfacesfor communications, while in the future higher transmissionrates are expected to be used (e.g., 40Gbps or 100Gbps perserver) [2]. These trends lead to scalability problem for thenetwork providing connectivity among severs inside the datacenter and toward the Internet.
Current data center interconnection networks include sev-eral tiers, such as edge, aggregation and core, and are basedon electronic commodity switches. Scaling these networksto support very high transmission capacity may lead todramatic increase in the total equipment cost and powerconsumption [3]. In this regard, optical communication hasbeen considered as a promising technology for data centerinterconnects due to the ultra-high capacity that can beoffered in cost- and energy- efficient way.
Several optical switching architectures have been recentlyproposed for data center networks [4][5][6][7]. They arebased on either optical switches [4][5] or passive opticalcomponents [6][7] at the aggregation and core tiers. How-ever, in these architectures the edge tier is still based onelectronic top-of-rack (ToR) switches, which limits the overallcost and energy savings [3]. Paper [8] has explored differentpossibilities for optical interconnection solutions at ToR andidentified that using POI for inter-server communication(such as the architectures proposed in [6][7]) can potentiallyoffer significant energy saving while at the relatively lowcost.
Meanwhile, the higher transmission rate, the larger thevolume of traffic and number of cloud services can be affectedin case of a failure in the network. The required avail-ability of fault-tolerant data center infrastructure (includingelectrical power supply, storage and distribution facilities)should be higher than 99.995% [9]. Thus, the availability forany connection established within the data center needs tobe even higher, since the communication system is only a
Manuscript received June 18, 2015; revised August 10, 2015;accepted September 8, 2015. This work was supported by theSwedish Foundation for Strategic Research (SSF), Vetenskapsradet,and Goran Gustafssons Stiftelse. The associate editor coordinatingthe review of this paper and approving it for publication was W.Fawaz. (Corresponding author: Jiajia Chen.)
All the authors are with KTH Royal Institute of Technology,Communication Systems Department (CoS), Electrum 229, SE-164 40 Stockholm, Sweden (e-mail: [email protected]; [email protected];[email protected]; [email protected]).
part of the site infrastructure. Several topologies, e.g., fat-tree [10] and Quartz [11], have been proposed in order toimprove the resiliency of large-scale data center networks.These topologies introduce redundancy in the aggregationand core tiers to increase reliability in the central part ofthe data center network. However, the edge tier is usuallyunprotected due to the high cost of introducing redundantToR switches as well as due to the belief that edge tier canbe self-healing (i.e., in case the connection to a certain serverwould be down, the task can be re-assigned and carried outby another server). Unfortunately, it may not be true inthe scenario where the servers within the racks are highlyloaded making it difficult to find resources to be allocated fora possible backup.
Therefore, the expected growth of traffic volume insidethe data centers brings the need for highly reliable, yetcost and energy efficient, interconnection at the edge tier.In [3][8] several passive optical interconnects for the edgetier of data center networks have been presented showingthat by replacing the electronic ToR switches with passiveoptical components it is possible to significantly reduce theoverall energy consumption while offering high capacityinterconnection.
On the other hand, such optical interconnects may lead tohigher capacities needed in the aggregation and core tiersof the data center network because of the lack of statisticalmultiplexing in the optical domain. However, this problemcan be mitigated by employing burst mode transceivers anda control protocol that is able to perform an efficient dynamicbandwidth allocation strategy [6][7].
Despite of the growing importance of fault tolerance ofinterconnects at ToR, this aspect has not been studied yet.In this letter, we focus on highly reliable and cost efficientpassive optical interconnects and propose three architecturesfor interconnections at ToR. They can be integrated withany topology supporting large-scale data center networks,e.g., fat-tree and Quartz. We also evaluate the proposedarchitectures in terms of connection availability and cost.Our results verify that ultra-high connection availability, i.e.,close to 5 nines (99.999%), can be achieved with both 1Gbpsand 10Gbps server interfaces. In addition, the cost of theproposed passive optical interconnects scale more efficientlywith the server capacity compared to electronic commodityswitches.
II. RELIABLE PASSIVE OPTICAL INTERCONNECTS
In this section, three passive optical interconnects (POIs)for the edge tier are presented. The first one is based on anarrayed waveguide grating (AWG), while the other two arebased on a coupler which broadcasts the traffic sent by oneinput port to all the output ports. The proposed POIs areshown in Fig. 1. In all three schemes servers are equippedwith optical network interfaces (ONIs) sending and receivingoptical signals. The communication can be either intra-rack(shown as red solid lines) or to outside the rack (inter-rackor to/from the Internet, shown as blue dashed lines).
It should be noted that the dynamicity and programma-bility for POIs are provided by the ONIs of the servers.Therefore, all the presented POIs have the ONIs equipped
IEEE COMMUNICATIONS LETTERS 2
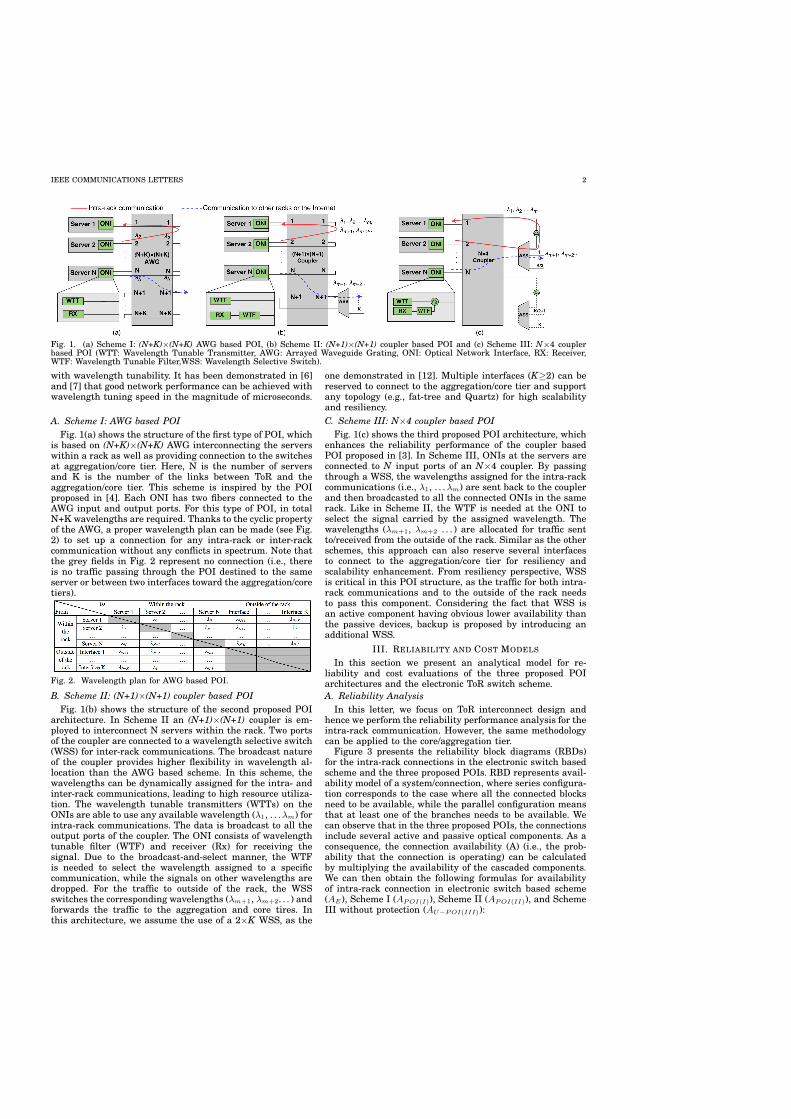
Fig. 1. (a) Scheme I: (N+K)×(N+K) AWG based POI, (b) Scheme II: (N+1)×(N+1) coupler based POI and (c) Scheme III: N×4 couplerbased POI (WTT: Wavelength Tunable Transmitter, AWG: Arrayed Waveguide Grating, ONI: Optical Network Interface, RX: Receiver,WTF: Wavelength Tunable Filter,WSS: Wavelength Selective Switch).
with wavelength tunability. It has been demonstrated in [6]and [7] that good network performance can be achieved withwavelength tuning speed in the magnitude of microseconds.
A. Scheme I: AWG based POIFig. 1(a) shows the structure of the first type of POI, which
is based on (N+K)×(N+K) AWG interconnecting the serverswithin a rack as well as providing connection to the switchesat aggregation/core tier. Here, N is the number of serversand K is the number of the links between ToR and theaggregation/core tier. This scheme is inspired by the POIproposed in [4]. Each ONI has two fibers connected to theAWG input and output ports. For this type of POI, in totalN+K wavelengths are required. Thanks to the cyclic propertyof the AWG, a proper wavelength plan can be made (see Fig.2) to set up a connection for any intra-rack or inter-rackcommunication without any conflicts in spectrum. Note thatthe grey fields in Fig. 2 represent no connection (i.e., thereis no traffic passing through the POI destined to the sameserver or between two interfaces toward the aggregation/coretiers).
Fig. 2. Wavelength plan for AWG based POI.
B. Scheme II: (N+1)×(N+1) coupler based POIFig. 1(b) shows the structure of the second proposed POI
architecture. In Scheme II an (N+1)×(N+1) coupler is em-ployed to interconnect N servers within the rack. Two portsof the coupler are connected to a wavelength selective switch(WSS) for inter-rack communications. The broadcast natureof the coupler provides higher flexibility in wavelength al-location than the AWG based scheme. In this scheme, thewavelengths can be dynamically assigned for the intra- andinter-rack communications, leading to high resource utiliza-tion. The wavelength tunable transmitters (WTTs) on theONIs are able to use any available wavelength (λ1, . . .λm) forintra-rack communications. The data is broadcast to all theoutput ports of the coupler. The ONI consists of wavelengthtunable filter (WTF) and receiver (Rx) for receiving thesignal. Due to the broadcast-and-select manner, the WTFis needed to select the wavelength assigned to a specificcommunication, while the signals on other wavelengths aredropped. For the traffic to outside of the rack, the WSSswitches the corresponding wavelengths (λm+1, λm+2. . . ) andforwards the traffic to the aggregation and core tires. Inthis architecture, we assume the use of a 2×K WSS, as the
one demonstrated in [12]. Multiple interfaces (K≥2) can bereserved to connect to the aggregation/core tier and supportany topology (e.g., fat-tree and Quartz) for high scalabilityand resiliency.C. Scheme III: N×4 coupler based POI
Fig. 1(c) shows the third proposed POI architecture, whichenhances the reliability performance of the coupler basedPOI proposed in [3]. In Scheme III, ONIs at the servers areconnected to N input ports of an N×4 coupler. By passingthrough a WSS, the wavelengths assigned for the intra-rackcommunications (i.e., λ1, . . .λm) are sent back to the couplerand then broadcasted to all the connected ONIs in the samerack. Like in Scheme II, the WTF is needed at the ONI toselect the signal carried by the assigned wavelength. Thewavelengths (λm+1, λm+2 . . . ) are allocated for traffic sentto/received from the outside of the rack. Similar as the otherschemes, this approach can also reserve several interfacesto connect to the aggregation/core tier for resiliency andscalability enhancement. From resiliency perspective, WSSis critical in this POI structure, as the traffic for both intra-rack communications and to the outside of the rack needsto pass this component. Considering the fact that WSS isan active component having obvious lower availability thanthe passive devices, backup is proposed by introducing anadditional WSS.
III. RELIABILITY AND COST MODELS
In this section we present an analytical model for re-liability and cost evaluations of the three proposed POIarchitectures and the electronic ToR switch scheme.A. Reliability Analysis
In this letter, we focus on ToR interconnect design andhence we perform the reliability performance analysis for theintra-rack communication. However, the same methodologycan be applied to the core/aggregation tier.
Figure 3 presents the reliability block diagrams (RBDs)for the intra-rack connections in the electronic switch basedscheme and the three proposed POIs. RBD represents avail-ability model of a system/connection, where series configura-tion corresponds to the case where all the connected blocksneed to be available, while the parallel configuration meansthat at least one of the branches needs to be available. Wecan observe that in the three proposed POIs, the connectionsinclude several active and passive optical components. As aconsequence, the connection availability (A) (i.e., the prob-ability that the connection is operating) can be calculatedby multiplying the availability of the cascaded components.We can then obtain the following formulas for availabilityof intra-rack connection in electronic switch based scheme(AE), Scheme I (APOI(I)), Scheme II (APOI(II)), and SchemeIII without protection (AU−POI(III)):

IEEE COMMUNICATIONS LETTERS 3
(a) Electronic switch based scheme (b) Scheme I (c) Scheme II
(d) Scheme III without protection (e) Scheme III with protectionFig. 3. Reliability block diagrams.
TABLE IMTBF AND COST OF THE NETWORK ELEMENTS [8][13][14].
Components MTBF1 Cost1GE Electronic Switch 150 000 h 0.67 CU2(port)
10GE Electronic Switch 150 000 h 3 CU1Gbps Grey Transceiver 3 000 000 h 0.1 CU10Gbps Grey Transceiver 600 000 h 0.5CU
1Gbps Tunable Transceiver 1 000 000 h 0.67CU10Gbps Tunable Transceiver 500 000 h 1.3CU
WSS 300 000 h 8.3CUAWG 4 000 000 h 0.1 CU(port)
Coupler 6 000 000 h 0.02 CU(port)Isolator 12 000 000 h 0.3CU
Circulator 12 000 000 h 0.7 CUWavelength Tunable Filter 4 000 000 h 0.3 CU
1. Mean Time Between Failures2. CU is the cost unit. 1 CU = 150 USD.
AE = A2GTRX×AES , (1)
APOI(I) = ATRX×AAWG, (2)APOI(II) = ATRX×ACP×AWTF , (3)
AU−POI(III) = ATRX×ACL×ACP×AWSS×AIS×AWTF . (4)
Here, ATRX represents the availability of the tunabletransceiver (note that transmitter and receiver are embed-ded on the same board). Meanwhile, we denote AGTRX , AES ,AAWG, ACL, ACP , AWSS , AIS , and AWTF as the availabilityof the grey transceiver, electronic switch, AWG, circulator,coupler, WSS, isolator and WTF, respectively. The availabil-ity of each component can be obtained as the ratio betweenthe mean lifetime and the mean time between failures(MTBF) [15]. In the protected Scheme III, the reliability isimproved by the redundancy of WSS and isolator comparingto the unprotected one. The availability can be obtainedaccording to the following formula:
AP−POI(III) = (1− (1−AWSS×AIS)2)×ATRX
×ACL×ACP×AWTF .(5)
B. Cost AnalysisTo calculate the equipment cost for the three proposed
POIs, we employ a similar approach as in [3]. We define thetotal cost of a POI (CPOI ) as the sum of all the networkcomponents inside the rack. As a consequence, the totalcost for electronic switch based scheme (CE), Scheme I(CPOI(I)), Scheme II (CPOI(II)), and the unprotected SchemeIII (CU−POI(III)), can be calculated according to the follow-ing formulas:
CE = 2×N×CGTRX + CES , (6)CPOI(I) = N×CTRX + CAWG, (7)
CPOI(II) = N×(CTRX + CWTF ) + CCP + CWSS , (8)CU−POI(III) = N×(CTRX + CCL + CWTF )
+ CCP + CWSS + CIS .(9)
Here, N is the number of servers in the rack and CTRX isthe cost of a tunable optical transceiver. Moreover, CGTRX ,CES , CWTF , CAWG, CCP , CWSS , CCL, and CIS are the costof grey transceiver, electronic switch, WTF, AWG, coupler,WSS, circulator and isolator, respectively. In the protectedScheme III, additional WSS and isolator are used inside the
Fig. 4. Total cost for electronic ToR switch and the three proposedPOI architecturesrack to improve resiliency. Accordingly, the total cost of theprotected Scheme III (CP−POI(III)) can be obtained throughthe following formula:
CP−POI(III) = N×(CTRX + CCL + CWTF )
+ CCP + 2×(CWSS + CIS).(10)
IV. NUMERICAL RESULTSIn this section, we evaluate and compare the cost and
reliability of the proposed POIs. We consider a conventionalelectronic ToR switch as benchmark. The overall resultscover the cases of 1Gbps and 10Gbps transmission capacityper server.
Table 1 shows the MTBF and the cost values for theinvolved components [8][13][14], which are used to evalu-ate the reliability and the total cost of the proposed POIarchitectures. Figure 4 shows the total cost of the proposedPOIs and the conventional electronic ToR switch given thedifferent number of total servers in a rack (48, 64 and128) and 2 interfaces towards the aggregation/core tier. Asreflected in the cost formulas, all the considered schemesshow a linear increase in the total cost as a function ofthe number of servers. Considering the case with 1Gbps perserver, Scheme I and Scheme II show a similar total costas the electronic ToR switch. On the other hand, the costof Scheme III without protection is almost doubled due tothe use of an additional circulator in the ONI. However, thecirculator makes cabling easier since one server only hasone fiber port for interconnection. The protected Scheme IIIshows a small increase in the total cost, since additionalWSS and the isolator are needed for backup. For the casewith 10Gbps interface per server, the three POIs show greatadvantage in terms of cost comparing to electronic switches.The price of commercial electronic ToR switches operating at10Gbps is much more expensive than the price of electronicToR switches operating at 1Gbps. On the other hand, theincrease of cost of three POIs from 1Gbps to 10Gbps ismuch lower than electronic switches. This is mainly dueto the reason that for POIs the major cost increase is attransceivers side for higher data rate while the passiveoptical switch components remain the same. However, forsolution based on commodity switches, cost increase occursat both transceivers at the servers and the switches forinterconnection.

IEEE COMMUNICATIONS LETTERS 4
Fig. 5. Unavailability vs. total cost of three POIs for different MTTR values and server transmission capacities.
It is worth noting that, due to the lack of statisticalmultiplexing, the POIs may require more capacity, and thushigher costs, in the aggregation and core tiers. The costresults in [3] have shown that impact of the absence of statis-tical multiplexing in the edge tier on the overall data centernetwork cost highly depends on the switching techniquesadopted in core and aggregation tier. However, despite of thelack of additional statistical multiplexing in the edge tier,the cost reduction for the overall data center can still beachieved in many cases compared to the solution based onthe conventional electronic switches [3].
Unavailability of a component or system is defined asthe probability that it is failed and can be expressed as1-A, where A denotes availability. Our calculation of theunavailability values of the three POIs is based on the MTBFof components presented in Table 1. Regarding mean timeto repair (MTTR), it is dependent on the maintenance policyadopted by the data center operator. We assume two valuesof MTTR (4h and 24h) reflecting different fault managementpolicies in respect to the length of reparation time. Figure5 shows the unavailability of intra-rack connection versustotal cost of 48 servers in a rack for the three consideredoptical intra-rack interconnects at 1Gbps and 10Gbps. It canbe seen that Scheme I and Scheme II performs best, i.e.,showing the lowest connection unavailability. In the case afast reparation time (e.g., MTTR=4 hours), the intra-rackconnection availability for Scheme I and Scheme II can reach5 nines (99.999%), meeting the reliability requirement forfault-tolerant site infrastructure, i.e., availability of 99.995%[9]. On the other hand, unprotected Scheme III supportssimilar level of connection availability as its electronic coun-terpart, while with the proposed redundancy of the WSS, itsintra-rack connection availability can reach 5 nines. Evenfor a relatively long reparation time (e.g., MTTR=24 hours),the availabilities up to 4 nines (99.99%) can be obtained forScheme I, Scheme II and the protected Scheme III, whichis much better than availability of ToR based on electronicswitches. Advantages of POIs at 10Gbps on reliability per-formance compared to the electronic interconnect is moreobvious than at 1Gbps. It is mainly because the reliabilityperformance of the passive devices is not dependent on thedata rate.
V. CONCLUSIONSIn this letter we proposed reliable optical interconnect
architectures for the edge tier of data center interconnection
networks. We have evaluated their cost and reliability per-formance and compared with the traditional commodity ToRswitch. The results show that the proposed POIs outperformthe electronic ToR switches in terms of both connection avail-ability and cost. Compared to electronic commodity switches,the benefits of optical POIs are more obvious at the higherdata rate. Therefore, our proposed POIs make it possible toreach the required connection availability of 99,995% andbeyond at high data rates in the intra-data center networks.
REFERENCES
[1] Cisco Global Cloud Index: Forecast and Methodology, 2013-2018, Sept. 2014, Cisco white paper.
[2] Data Center Design Considerations with 40 GbE and 100 GbE,Aug. 2013, Dell white paper.
[3] M. Fiorani, et al, ”Energy-efficient elastic optical interconnectarchitecture for data centers”, IEEE Communications Letters,vol.18, pp. 1531-1534, Sept. 2014.
[4] Y. Yawei et al., ”LIONS: An AWGR-based low-latency opticalswitch for high-performance computing and data centers”,IEEE J. Sel. Topics Quantum Electron., vol. 19, no. 2, p. 360-409, Mar./Apr. 2013.
[5] K. Chen et al., ”OSA: An optical switching architecture for datacenter networks with unprecedented flexibility,” IEEE/ACMTrans. Netw., vol. 22, no. 2, pp. 498511, Apr. 2014.
[6] W. Ni, et al., ”POXN: a new passive optical cross-connectionnetwork for low cost power efficient datacenters”, IEEE/OSAJLT, vol. 32, pp. 1482-1500, Apr. 2014.
[7] R.M. Indre, et al., ”POPI: A passive optical Pod interconnectfor high performance data centers”, Proc. of ONDM, pp.84-89,May 2014.
[8] J. Chen, et al., ”Optical interconnects at top of the rack forenergy-efficient datacenters”, IEEE Communications Maga-zine, to appear, 2015.
[9] ”Data center site infrastructure tier standard: topology”, up-time institute, 2010.
[10] R.N. Mysore, et al., ”Portland: a scalable fault-tolerant layer2 data center network fabric”, Proc. of ACM SIGCOMM Com-puter Communication Review, vol. 39, pp. 39-50, Oct. 2009.
[11] Y. Liu, et al., ”Quartz: a new design element for low latencyDCNs”, ACM SIGCOMM, 2014
[12] K. Fontaine, et al., ”N×M Wavelength Selective Crossconnectwith Flexible Passbands”, Proc. of OFC, 2012
[13] EU project: Discus (The DIStributed Core for unlimited band-width supply for all Users and Services).
[14] K. Grobe, et al., ”Cost and Energy Consumption Analysis ofAdvanced WDM-PONs”, IEEE Communications Magazine, vol.49, pp. s25-s32, February 2011.
[15] J. Chen, et al., ”Analysis of Protection Schemes in PON Com-patible with Smooth Migration from TDM-PON to HybridWDM/TDM PON”, OSA Journal of Optical Networking, vol. 6,pp. 514-526, May, 2007


Centralized Control Plane for Passive OpticalTop-of-Rack Interconnects in Data Centers
Yuxin Cheng, Matteo Fiorani, Lena Wosinska, and Jiajia ChenCommunication Systems Department, KTH Royal Institute of Technology, Stockholm, Sweden
{yuxinc, matteof, wosinska, jiajiac}@kth.se
Abstract—To efficiently handle the fast growing traffic insidedata centers, several optical interconnect architectures have beenrecently proposed. However, most of them are targeting theaggregation and core tiers of the data center network, whilerelying on conventional electronic top-of-rack (ToR) switches toconnect the servers inside the rack. The electronic ToR switchespose serious limitations on the data center network in termsof high cost and power consumption. To address this problem,we recently proposed a passive optical top-of-rack interconnectarchitecture, where we focused on the data plane design utilizingsimple passive optical components to interconnect the serverswithin the rack. However, an appropriate control plane tailoredfor this architecture is needed to be able to analyze the networkperformance, e.g., packet delay, drop rate, etc., and also obtaina holistic network design for our passive optical top-of-rackinterconnect, which we refer to as POTORI. To fill in this gap,this paper proposes the POTORI control plane design whichrelies on a centralized rack controller to manage the communi-cations inside the rack. To achieve high network performance inPOTORI, we also propose a centralized medium access control(MAC) protocol and two dynamic bandwidth allocation (DBA)algorithms, namely Largest First (LF)and Largest First with VoidFilling (LFVF). Simulation results show that POTORI achievespacket delays in the order of microseconds and negligible packetloss probability under realistic data center traffic scenarios.
Index Terms—Optical interconnect architectures, data centernetworks, medium access control (MAC), dynamic bandwidthallocation (DBA).
I. INTRODUCTION
The network traffic inside the data centers has been in-creasing rapidly during the last decade, due to the growingpopularity of applications such as cloud computing, socialnetworking and video streaming [1]. In order to deal withthis tremendous traffic increase, data center operators areupgrading the transmission rate and switching capacity oftheir network equipment [2]-[3]. However, current data centernetworks are based on electronic packet switches, whosecost and power consumption scale almost linearly with thetransmission rate and switching capacity, bringing seriousprofitability and sustainability problems [4]-[5].
Optical interconnect architectures are considered as apromising solution to address the limitations of electronicpacket switches in data centers thanks to their ability tosupport high transmission rates and switching capacities ina cost- and energy-efficient way. Several optical interconnectarchitectures for core and aggregation tiers have already beenproposed in the literature, e.g., in [6]-[7]. They rely on theuse of conventional electronic top-of-rack (ToR) switchesin the access tier, i.e., the network segment in charge ofinterconnecting the servers in the same rack and the interfacestoward the other network tiers. The electronic ToR switchesare usually responsible for the majority of the cost and power
consumption in the data center network. This is due to the factthat the access tier carries a large amount of the overall datacenter traffic because most of the traffic stays locally in thesame rack [9]. As a consequence, efficient optical interconnectarchitectures for the access tier in data centers are needed.
In [11] and [12] we proposed new passive optical top-of-rack interconnect data plane (POTORI data plane) architecturefor the access tier in data centers. The POTORI data planemakes use of a passive optical coupler to interconnect theservers in the rack and employs the broadcast-and-select man-ner. The passive optical coupler offers relatively low cost andpower consumption as well as high reliability. However, thereis no control mechanism available for efficient managementof the communications among the servers in the same rackas well as the interfaces to outside of the rack. Therefore, itis not possible to analyze the network performance, such aspacket delay, packet drop rate, of the proposed POTORI dataplane design.
In this paper we propose the POTORI control plane designenabling efficient management of the communications insidethe rack. Some related works (e.g., [8]) introduced the controlplane approaches based on distributed control mechanismsfor passive optical interconnects. However, such solutions canbring a large control overhead. They may still be appropriatefor the aggregation/core tiers of data center networks, handlingthe aggregated traffic from the ToR. However, they can resultin a poor network performance of intra-rack interconnects,which is usually characterized by short-lived traffic flows.Therefore, in this paper we propose a centralized control planefor POTORI that has a separated rack controller responsiblefor the efficient management of the communications inside therack and toward the other network tiers. We also introduce anew centralized medium access control (MAC) protocol andtwo dynamic bandwidth allocation (DBA) algorithms, namelyLargest First (LF) and Largest First with Void Filling (LFVF),to obtain high bandwidth utilization in POTORI. The simula-tion results verify that POTORI can achieve end-to-end packetdelays in the order of microseconds and negligible packet lossprobability under realistic data center traffic scenarios. Thenumerical results also show that the proposed DBA algorithmsfor POTORI outperform another popular switch schedulingalgorithm from the literature [13].
The rest of the paper is organized as follows. In Section II,the POTORI data and control plane architectures are presented.In Section III the proposed centralized MAC is elaborated andin Section IV two novel DBA algorithms for POTORI areintroduced. The simulation results are presented in Section Vshowing evaluation of the proposed DBA algorithms in termsof packet delay and packet drop ratio. Finally, the conclusions

Fig. 1: POTORI based on: (a) (N+1)×(N+1) Coupler, (b) N×2 Coupler
are given in Section VI.
II. PASSIVE OPTICAL TOP-OF-RACK INTERCONNECTS(POTORI)
In POTORI both control plane and data plane architecturesare considered. The control plane contains a rack controllerwhile the data plane can have two options (see Fig. 1). In thePOTORI architecture, each server is equipped with an opticalnetwork interface (ONI) composed of two optical transceivers.One is a tunable transceiver connected to the POTORI dataplane. The other is a grey small form factor pluggable (SFP)transceiver connected to the POTORI control plane. In thefollowing we describe the POTORI data and control planearchitectures in detail. We define N as the number of serversin the rack.
Data Plane
The POTORI data plane is based on a passive opticalcoupler that interconnects the servers within the rack in abroadcast-and-select manner. The POTORI data plane waspreviously introduced in [11]-[12].
The first option, shown in Fig. 1(a), is based on an(N+1)×(N+1) coupler. Each ONI is connected to one inputand one output port of the coupler using two separate fibers.The tunable transceiver in the ONI is composed of a wave-length tunable transmitter (WTT) connected to the input portof the coupler for sending data and a wavelength tunable filter(WTF) as well as a receiver connected to the output port ofthe coupler for receiving data. The coupler is equipped withan additional input and output port connected to a wavelengthselective switch (WSS), which forwards the traffic to (from)the aggregation and core tiers.
The second option, shown in Fig. 1(b), is based on anN×2 coupler. In this case each ONI is connected only to oneinput port of the coupler using a single bidirectional fiber. Thetunable transceiver in the ONI is equipped with a circulatorthat forwards the traffic generated by the WTT toward thecoupler and directs the traffic from the coupler toward theWTF and the receiver. All the traffic passes through the WSSthat is responsible for separating the local flows that are looped
back to the coupler and broadcast to the servers in the rack,from the traffic toward the outside of the rack. An isolator isused to guarantee the correct direction of the communicationsbetween the WSS and the coupler.
Although both architectures utilize the broadcast nature ofcoupler, the difference between these two is that in the firstarchitecture, both intra- and inter-rack data transmitted by oneserver are broadcasted and received by all the servers withinthe same rack as well as the WSS connected to the coupler’soutput ports, while in the second architecture, only intra-racktraffic is filtered out by the WSS, and then broadcast to all theservers within the same rack.
Control Plane
Due to the broadcast nature of the coupler, the destinationONI needs to be tuned on the correct wavelength in order toreceive the traffic from the desired source ONI. In addition,in order to avoid conflicts occurring in the coupler, concurrentcommunications inside the rack need to be assigned to dif-ferent wavelengths. Consequently, a control plane that is ableto schedule resources in both spectrum and time domains isrequired in POTORI for managing the communications insidethe rack and toward the aggregation and core tiers.
We propose a centralized control mechanism for POTORI,referred to as a rack controller (see Fig. 1). It is equippedwith N grey SFP transceivers to transmit (receive) the controlinformation to (from) the servers. The rack controller is basedon a centralized MAC protocol and a DBA algorithm todynamically tune the WTT and WTF in each ONI to the properwavelengths for transmitting and receiving the traffic whileavoiding wavelength clash in the coupler. Specifically, theMAC protocol defines the controlling procedure and formatsof the control message. The DBA algorithm is employed tocompute the resources, including both the wavelengths andtime duration, that are assigned to the servers for intra-rackand inter-rack communications. In the following sections, weconcentrate on control plane and describe the proposed MACprotocol along with two tailored DBA algorithms for POTORI.

Fig. 2: The MAC Protocol and the Request-Grant Messages of POTORI
III. MAC PROTOCOL
A proper MAC protocol is essential to efficiently managethe communications among the servers in POTORI. Theexisting MAC protocols that might be applied in POTORI canbe classified as distributed and centralized. Distributed MACprotocols rely on the direct exchange of control informationamong the servers, i.e., without the mediation with a central-ized controller. Typical examples are the carrier sense multipleaccess with collision detection (CSMA/CD) [15], which hasbeen widely employed in the Ethernet, and the HEAD protocolwhich was proposed for the passive optical cross-connectionnetwork (POXN) architecture in [8]. However, the distributedMAC protocols bring a control overhead because the controlmessages need to be flooded to all the servers in the rack.This control overhead might be significant for the intra-rackcommunications that are characterized by a large amount ofshort lived traffic flows. As a consequence, we believe thatthey are not good candidates for POTORI.
The centralized MAC protocols rely on a centralized con-troller to manage the exchange of control information. Typicalexamples are the multipoint control protocol (MPCP) [17]which is used in Ethernet passive optical networks (EPONs)and the IEEE 802.11 standards [18] that are used in Wi-Finetworks. The MPCP protocol cannot be applied in POTORIbecause it supports only multipoint-to-point communications,while the POTORI requires multipoint-to-multipoint commu-nications. Also the IEEE 802.11 standards cannot be employedin POTORI because they do not support wavelength divisionmultiplexing (WDM) scenarios. With this in mind, we proposea new centralized MAC protocol for the POTORI controlplane.
The proposed MAC protocol is depicted in Fig. 2. It followsa Request-Grant approach. The data transmission of serversis divided into different time cycles. Servers send a Requestmessage to the rack controller containing the current bufferedpackets for different destination servers. After receiving theRequest messages from all the servers, the rack controllergenerates the traffic matrix and runs the DBA algorithm tocalculate the allocated wavelengths and transmission time forall the servers in the next time cycle. Afterwards, the controller
informs the servers about the decisions using Grant messages.After receiving the Grant message, each server tunes the WTTand WTF to the assigned wavelengths for transmitting andreceiving data during the specified time cycle. For example,in Fig. 2, Server 3 is informed by the Grant message to tune thetransmitter to λ3 and receiver to λ2 in cycle C. The traffic fromServer 3 is transmitted by using λ3 from the moment TC0 toTC3 in this cycle. Thanks to the dedicated connection betweeneach server and the rack controller, there is no collision duringthe control message exchange.
Note that each server only transmits the granted data packetsaccording to the Grant message, which can be only a portionof the total number of buffered packets that was reported inthe Request message. To make sure that the Grant messagesarrive to each server in time, the Request and Grant messagesfor cycle C can be exchanged at the moment TRG−C beforethe end of previous cycle C-1 (i.e., TC), where TRG−C isthe starting time to transmit Request messages at each severin cycle C (see Fig. 2). We consider the Request messagesare sent at least the time period PControl before the end ofthe cycle, where PControl equals to the transmission time oftwo maximum Ethernet frames plus their propagation delay aswell as computation time of DBA for the next cycle. Therefore,each server is guaranteed to receive the Grant messages beforethe data transmission starts in the next cycle.
A. Request Message
An example of the Request message is shown in Fig. 2. Thefirst field of the Request message contains the identifier of thecurrent time cycle (e.g., C shown in Fig. 2), which is usedby the rack controller to check whether the received controlmessages are outdated or not. If yes, it is discarded. Thesecond field contains the MAC address of the source server,i.e., the server that generates the Request message (e.g., Server1). This is followed by N fields containing all the possibledestination MAC addresses (N-1 for the other servers in therack plus one for the interface towards the aggregation/coretier) with the corresponding number of buffered bytes, i.e., thebytes that are ready to be transmitted at the source server. The

Fig. 3: Traffic Demand Matrix.
length in bytes of the Request message (LR) can be calculatedas:
LR = LCH + LSRCMAC +N × (LDSTMACi + LSi) (1)
Where LCH is the length of the first field for the identifier ofthe time cycle, LSRCMAC and LDSTMACi are the length ofsource and the ith destination MAC address (6 bytes for eachMAC address), and LSi is the length of reported size of thetraffic sent to the ith destination. Assuming LCH = 8 bytesand LSi = 4 bytes, one Request message as an Ethernet framewith a maximum size of 1518 bytes can support up to morethan 140 servers in a rack, which is sufficient for a typicalsize of ToR interconnect in the data center.
B. Grant MessageAn example of the Grant message is shown in Fig. 2. The
first field contains the identifier of the current cycle (e.g., Cshown in Fig. 2), while the second field contains the timestampof the next cycle (e.g., TC+1 in Fig 2.) for which the Grantis valid. The third field contains the MAC address for theserver for which the Grant message is intended (e.g., Server3 in Fig 2.). The following three fields specify: (i) a timeslot with starting timestamp (e.g., TC0 in Fig. 2) and endingtimestamp (e.g., TC3 in Fig. 2); (ii) the assigned wavelengthsfor transmitter (e.g., λ3 in Fig.2) and receiver (e.g., λ2 in Fig.2)during this time slot; (iii) the destination MAC address (Server1) as well as the granted size (e.g., 800 bytes in Fig.2) for thetransmission during this time slot. The time slot can be eitherthe entire time cycle or a part of the time cycle. This allows theDBA to assign multiple time slots to the same source serverduring a single time cycle. In this way the source server cansend traffic to different destinations during the same time cycleimproving the bandwidth utilization. As an example, in Fig.2 Server 2 is assigned two time slots in the same time cycle:one for transmitting to Server 3 and one for transmitting toServer 1. Note that this might require reconfiguring the ONIseither at the source (i.e., tuning the WTT of Server 2 to λ3)or at the destination server (i.e., tuning the WTF of Server 1to λ2).
The length of a Grant message LG can be calculated as:
LG =LCH + LSRCMAC + LNCT+
K × (2×LTS + 2×LWI + LDSTMAC + LS)(2)
where LNCT and LTS are the timestamp length of next cycleand starting/ending moment for data transmission, respectively
(e.g. the timestamp of TC+1, TC0 and TC3 in Fig. 2), Kis the number of assigned time slots according to the DBAalgorithm (which will be elaborated in the next section), andLWI is the length of wavelength identifier. The other symbolshave the same meaning as in the Request message. If weconsider an 8-byte timestamp and 1-byte wavelength identifier,the maximum Ethernet frame (1518 bytes) can include up to 50tunings in one cycle in the Grant message. Note that tuning thetransceiver takes time, and too many tunings can decrease thebandwidth utilization in one cycle. Thus, we set the maximumallowable tuning times in one DBA cycle to less than 50.
IV. DYNAMIC BANDWIDTH ALLOCATION ALGORITHMS
In each cycle the rack controller collects the Requestmessages from the servers and accordingly builds the trafficmatrix. An example of the traffic matrix generated by therack controller is shown on the left side of Fig. 3. Therows and columns indicate the source and destination servers,respectively. Each element represents the amount of bytes thatare ready to be transmitted between the corresponding sourceand destination servers. The DBA algorithm is responsible forassigning the available wavelengths to different elements inthe matrix, while making sure that there is no collision inthe network (i.e., the DBA needs to make sure that there isno wavelength clash and that the same transmitter/receiver isnot assigned to more than one wavelength at the same time).A collision happens every time multiple elements within onerow or one column are assigned the same wavelengths. On theright side of Fig. 3 there is an example of the results generatedby the DBA algorithm. Note that assigning a wavelength toan element in the traffic matrix is equivalent to the tuning theWTT and WTF of the corresponding source and destinationservers to this wavelength.
The problem described above is similar to the classicalswitch scheduling problem for which several optimal algo-rithms have already been proposed. These optimal algorithmsare usually based on matrix decomposition. An example is theBirkhoff von Neumann (BvN) algorithm which was used in[7] for finding the optimal scheduling solutions to configurethe circuit switches in data centers. However, due to thehigh complexity of the matrix decomposition process suchalgorithms are not suitable for POTORI.
Other suboptimal algorithms have been proposed to reducethe complexity of solving the switch scheduling problem. Forexample, one algorithm that has gained a lot of attentionfor application in electronic switches is iSLIP [13]. However,iSLIP is not designed to support WDM and thus it cannot bedirectly applied in POTORI. In this section, we first modifythe iSLIP algorithm to adapt for POTORI as the benchmark,and then introduce two new greedy DBA algorithms designedspecifically for POTORI, namely Largest First (LF) andLargest First with Void Filling (LFVF).
A. Benchmark: Adapted iSLIP
In electronic packet switching scheduling, the iSLIP algo-rithm is an improved Round-Robin Matching (RRM) algo-rithm. It associates two Round-Robin (RR) schedulers witheach input and output port of a crossbar switch fabric. Thereare three key steps in the iSLIP algorithm: Request, Grant,and Accept. (1) Each input port first sends the Request to the

Algorithm 1 Largest First Algorithm
1: Input: M; W; const R2: %Input: TDM M, wavelength list W, transceiver data rate R3: tX ← [None,None...]; txT ime← [0, 0]4: rX ← [None,None...]; rxT ime← [0, 0]5: List T← M.sort()6: repeat7: D ← T[0]8: if D.tX is None and D.rX is None then9: D.assigned← True
10: tX[D.src]← [W[0] : [0, D.size/R]]11: rX[D.dst]← [W[0] : [0, D.size/R]]12: txT ime[D.src]← D.size/R13: rxT ime[D.dst]← D.size/R14: delete W[0]
15: delete T[0]16: until T or W is Empty17: return tX, rX
Fig. 4: Largest First Algorithmoutput port according to its buffered traffic elements. (2) Eachoutput RR scheduler chooses an input from all the requestedelements to this output as a Grant according to the outputarbiter. (3) Each input RR scheduler then Accepts one outputfrom the replies of output RR scheduler according to the inputarbiter to complete the match. The arbiters of the input andoutput RR are updated only if the match is completed. TheiSLIP algorithm is easy to implement in the hardware, and itachieves 100% throughput for uniformly distributed Bernoulliarrivals, but may not be efficient for the other arrival trafficpatterns such as lognormal distribution [13][14], which is oftenused to model the real traffic pattern for data centers. TheiSLIP algorithm finds up to N matches of the input and outputfrom a traffic demand matrix, where N is the size of the matrix.A wavelength can be assigned to each match. In the case wherethe total number of the available wavelengths W is lower thanthe number of matches N, we randomly pick W pairs fromthe result of iSLIP to assign the wavelengths.
B. Largest First
The Largest First (LF) is a greedy heuristic algorithm (Fig.4). It prioritizes the largest elements in the traffic matrix. First,the matrix elements are sorted into a traffic list in a descendingorder according to the size (Line 5 in Fig. 4). Then, the firstelement is extracted from the list and an available wavelengthis assigned to this element if there is no collision (Line 7-8 inFig. 4). A collision occurs when either the transmitter or thereceiver associated to the element has already been assignedto another wavelength. In this case, the element is skippedand left for the next cycle. If an element is assigned to awavelength, the related information such as source, destinationand transmission time will be updated in the Grant message(Line 10-14 in Fig. 4). The iteration stops when all theavailable wavelengths are assigned or the last element in thedemand list is reached (Line 16 in Fig. 4). Note that the actualcycle length is decided by the data transmission time of thelargest element scheduled for transmission.
C. Largest First with Void Filling
Since the size of each element in the traffic matrix isdifferent, in LF algorithm the assigned wavelengths for the
Algorithm 2 Largest First with Void Filling Algorithm
1: Input: M; W; const R,Tt,TtnMax=50; %Same to the LF withthe tuning time Ttn and max number of tuning 50
2: Same to the LF Line 3 - Line 163: Ttn ← [1, 1...]4: List T’← M.sort()5: Tmac ← T’[0]/R6: for D′ in T’ do7: if D′.assigned is False and Ttn[D′.src]<TtnMax then8: if txT ime[D′.src],rxT ime[D′.dst]<Tmax then9: ts ←max(txT ime[D′.src],rxT ime[D′.dst])+Tt
10: tX[D′.src].append(rx[D′.dst]:[ts,ts+D′.size/R])11: rX[D′.dst].append(rx[D′.dst]:[ts,ts+D′.size/R])12: txT ime[D.src]← ts+D′.size/R13: rxT ime[D.dst]← ts+D′.size/R14: Ttn[D′src]++15: return tX, rX
Fig. 5: Largest First with Void Filling Algorithmelements lasts different duration of time within one cycle. Forexample, one wavelength can be assigned to an element withsize of 1 Kbytes while another wavelength is assigned to anelement with size of 600 bytes. In the channel of the latterwavelength, there is an idle time at least for 400 bytes untilthe next cycle. We refer to it as the void in the LF algorithm.The Largest First with Void Filling (LFVF) is an extensionof the LF algorithm, which tries to fill in the void with theunassigned elements in the traffic matrix. A skipped elementin the LF algorithm can be assigned a wavelength when bothtransmitter and receiver of this element are done with theprevious transmission of the other elements (Line 6-8 in Fig.5). Similar to the LF algorithm, the wavelength assignment isdone in a descending ordering (i.e., starting from the largestskipped element). The Grant Message can be extended byincluding the new assigned demand with the information ofthe wavelength, transmission time as well as the destination(Line 10-13 in Fig. 5).
V. PERFORMANCE EVALUATION
In this section we evaluate the latency and packet dropperformance of POTORI. We examine two proposed DBAalgorithms, LF, LFVF and the benchmark adapted iSLIP usinga custom-built discrete-event-driven simulator implemented inPython. All the results shown in the following subsections arewith 95% confidence level.
Traffic Model
The traffic model utilized for the simulations is derivedfrom [9] and [10]. The packet inter-arrival time follows alognormal distribution and the size of the packets follows abimodal distribution (i.e., with most of the packets having sizeof either 64-100 bytes or 1500 bytes) [9]. The data rate ofthe tunable transceivers on the ONIs is set to 10 Gb/s. Theoversubscription rate (Ro) is set to 1:4. For example, if weconsider 96 servers in one rack, there are 24 transceivers eachwith data rate of 10Gb/s as the uplink ports to handle the trafficfrom/to the aggregate/core layer. The servers and the uplinkports generate packets to different destinations. We assume that80% of the traffic generated by the servers is the local intra-rack traffic, whose destination is uniformly distributed to allthe other servers in the rack. The remaining 20% of the traffic

Fig. 6: (a) average packet delay of three DBA algorithms; (b) CDF of packet delay under (b1) load=0.1 and (b2) 0.5; (c)average packet delay with different N; (d) average packet delay with different α
is inter-rack traffic that is destined to the interfaces towardthe aggregation/core tier, and is also uniformly distributedamong all the uplink ports. We set the buffer size on eachONI to 5MB, the propagation delay to 50 ns (correspondingto 10m fibers for interconnection within the rack) and the fasttuning time of the transceivers to 200 ns [16]. We define twoparameters N and α, where N is the number of servers in arack and α is the ratio between the number of wavelengths andN(1+Ro) (i.e., the sum of the number of servers and uplinkport transceivers). For example, given the Ro=1:4, N=96, andα=100%, it means that the number of the total availablewavelengths is 120.
A. Packet DelayIn Fig. 6 we present the packet delays under different load.
Fig. 6(a) shows the average packet delays in a rack with 96servers (i.e., N=96) and α=100%. In the iSLIP algorithm, atraffic demand in the Request messages is assigned a wave-length if and only if the arbiters of input RR scheduler andoutput RR scheduler are rotated to the source and destinationof the demand, respectively. This may take several cycleseven under the very low load, which results in the dramaticincrease of the packet delay. LF and LFVF, on the otherhand, outperform iSLIP, especially under low load condition.It can be seen that LFVF introduces significantly lower delays(up to 60%) compared to LF under medium loads, thanksto its ability of filling the voids in the data transmission.However, the difference in performance between LF and LFVFis insignificant if the load is very low (i.e., lower than 0.1) orvery high (i.e., higher than 0.8). This is due to the fact that inthe low load condition the traffic matrix is sparse and all theelements are assigned a wavelength by the LF algorithm, sothat there are no or very few elements left that the LFVF canuse to fill potential voids. On the other hand, in the high loadcondition most of the wavelengths are fully utilized even in the
LF algorithm so that there are very few voids to fill in by theLFVF. In the real traffic scenario in the data centers, the loadis normally between 0.1 and 0.5 and can reach peaks of 0.8[10], so in the average working conditions LFVF outperformsthe other considered algorithms.
Fig. 6(b1) and Fig. 6(b2) show the cumulative distributionfunctions (CDFs) of the packet delay under load = 0.1 and 0.5,which represent low and high load scenarios, respectively. Fig.6(b1) shows that at load = 0.1 using both LF and LFVF allthe packets experience delays lower than 20 µs. However, Fig.6(b2) shows that at load = 0.5 the packet delays can vary from10 µs to up to 1 ms. The long tail at load = 0.5 is due to thefact that both LF and LFVF prioritize the transmission of thelargest traffic demands. This can potentially bring a problemfor the network fairness (i.e., some packets that belong to smalltraffic demands may experience relatively long delays). Wewill address this issue in our future work.
Fig.6(c) shows the average packet delays for LF and LFVFas a function of the number of servers in the rack (i.e.,N=32, 64, 96). As we may expect, the delay performancedegrades with the increase of the number of servers in therack. This is due to the fact that the number of elementsin the traffic matrix increases significantly with the numberof servers, while given a fixed value of α, the number ofavailable wavelengths increases linearly with the number ofservers. In low load condition (i.e., load = 0.2) the differencein the average packet delays for different values of N is verysmall. However, with higher load values (i.e., load = 0.4, 0.6and 0.8) the average packet delays with N=96 become almostdouble as high as with N=32 and 50% higher than with N=64.
Fig. 6(d) shows the packet delay with different valuesof α. Given a fixed number of servers in the rack, i.e.,N=96, we examine the impact of the number of availablewavelengths on the packet delays, i.e., we vary α in the

Fig. 7: Packet Drop Ratio of (a) three DBA algorithms with α= 100%; (b) α= 100%, 80%, 60% in the LF algorithm
range 100% (120 wavelengths), 80% (96 wavelengths) and60% (72 wavelengths). Under low load (i.e., load = 0.2), thepacket delays are almost the same for the considered valuesof α. This indicates that although in low load scenarios fewerwavelengths can be assigned to POTORI good performancein terms of packet delays (i.e., lower than 10 µs) can bemaintained. However, with higher load values, the packetdelays with α=60% are much higher than the ones withα=80% and α=100%.On the other hand, the difference interms of average packet delays with α=80% and α=100% arenot very significant.
B. Packet Drop RatioIn POTORI packet drop can happen when the network
is congested. In this situation new packets generated bythe servers will be dropped at the ONIs. Note that in oursimulation we set the size of the buffers at the ONIs to 5 MB.
In Fig. 7(a) we compare the packet drop ratio achieved withLF, LFVF and iSLIP assuming N=96 and α=100%. It can beobserved that for load values lower than 0.9 the packet dropratio of LF and LFVF ratio is negligible. LF and LFVF havethe same performance due to the fact that at very high loadthey behave in the same way (the reason is that at very highload there are not that many voids to be filled, as explainedpreviously). On the other hand, iSLIP shows higher packetdrop ratio. It is worth noting that in the access tier of datacenters the load usually does not reach values higher than 0.9[9] so that LF and LFVF can achieve negligible packet dropratio and 100% throughput in most cases.
Fig. 7(b) shows the impact of changing the parameter α onthe packet drop ratio. Since the packet drop ratio of LFVFis the same as of LF, we are only showing the performanceof LF. In the LF algorithm, when α equals to 60% (80%) thenetwork gets congested and starts dropping packet at load=0.6(0.8), which can also be observed by the sudden increase inthe packet delays in Fig. 6.
VI. CONCLUSION
In this paper we proposed and evaluated a control plane forthe passive optical ToR interconnect (POTORI) architecture. Itis based on a centralized rack controller, which is responsiblefor the management of the communications inside the rackand toward the aggregation/core tires. A MAC protocol andtwo DBA algorithms, namely Largest First and Largest Firstwith Void Filling, are also proposed aiming to achieve highnetwork performance in POTORI.
The simulation results prove that POTORI obtain send-to-end packet delays in the order of microseconds and negligible
packet loss probability under realistic data center traffic scenar-ios. In addition, the simulation results show that the proposedDBA algorithms for POTORI outperform the performance ofa representative existing switch scheduling algorithm.
ACKNOWLEDGMENT
This work was supported by the Swedish Foundation forStrategic Research (SSF), Swedish Research Council (VR),Goran Gustafssons Stiftelse and National Natural ScienceFoundation of China (Grant No. 61550110240).
REFERENCES
[1] Cisco Global Cloud Index: Forecast and Methodology, 2014-2019,October 2015, Cisco white paper.
[2] A. Andreyev, “Introducing data center fabric, the next-generation Face-book data center network.”https://code.facebook.com/posts/360346274145943, 2014.
[3] Data Center Design Considerations with 40 GbE and 100 GbE, Aug.2013, Dell white paper.
[4] R. Pries et al.,“Power consumption analysis of data center architectures,”Green Communications and Networking, 2012.
[5] M. Fiorani et al., “Energy-efficient elastic optical interconnect architec-ture for data centers,” IEEE Communications Letters, vol.18, pp. 1531-1534, Sept. 2014.
[6] K. Chen et al., “OSA: An optical switching architecture for data centernetworks with unprecedented flexibility,” IEEE/ACM Trans. Networking,vol. 22, no. 2, pp. 498-511, Apr. 2014.
[7] G. Poter et al., “Integrating microsecond circuit switching into the datacenter,” in Proc. ACM SIGCOMM Conf., 2013 pp. 447-458.
[8] W. Ni et al., “POXN: a new passive optical cross-connection network forlow cost power efficient datacenters,” IEEE/OSA Journal of LightwaveTechnology, vol. 32, pp. 1482-1500, Apr. 2014.
[9] A. Roy et al., “Inside the Social Network’s (Datacenter) Network,” inProc. ACM SIGCOMM Conf., 2015 pp. 123-237.
[10] S. Kandula et al., “The Nature of Datacenter Traffic: Measurement&Analysis,” in Proc. ACM SIGCOMM Internet Eas. Conf., 2009, pp.202-208.
[11] J. Chen et al., “Optical Interconnects at Top of the Rack for Energy-Efficient Datacenters,” IEEE Communications Magazine, vol. 53, pp.140-148, Aug. 2015.
[12] Y. Cheng et al., “Reliable and Cost Efficient Passive Optical Intercon-nects for Data Centers,” IEEE Communications Letters, vol. 19, pp.1913-1916, Nov. 2015.
[13] N. McKeown, “The iSLIP Scheduling Algorithm for Input-QueuedSwitches,” IEEE/ACM Trans. on Networking, vol. 7, no 2, pp.188-201,1999.
[14] T. Javadi et al., “A high-Throughput Algorithm for Buffered CrossbarSwitch Fabric,” Proceedings IEEE ICC, pp. 1581- 1591, June 2001.
[15] IEEE 802.3 ETHERNET WORKING GROUP,http://www.ieee802.org/3/
[16] R. Maher et al., “Fast Wavelength Switching 112 Gb/s Coherent BurstMode Transceiver for Dynamic Optical Networks,” In ECOC, 2012.
[17] L. Khermosh, “Managed Objects of Ethernet Passive Optical Networks(EPON)”, RFC 4837, July 2007.
[18] “IEEE Standard for Information technology–Telecommunications andinformation exchange between systems Local and metropolitan areanetworks–Specific requirements Part 11: Wireless LAN Medium AccessControl (MAC) and Physical Layer (PHY) Specifications”.


1
POTORI: A Passive Optical Top-of-RackInterconnect Architecture for Data Centers
Yuxin Cheng, Matteo Fiorani, Rui Lin, Lena Wosinska, and Jiajia Chen
Abstract—Several optical interconnect architectures insidedata centers (DCs) have been proposed to efficiently handle therapidly growing traffic demand. However, not many works havetackled the interconnects at top-of-rack (ToR), which have alarge impact on the performance of the data center networks(DCNs) and can introduce serious scalability limitations due tothe high cost and power consumption. In this paper, we proposea passive optical ToR interconnect architecture (POTORI) toreplace the conventional electronic packet switch (EPS) in theaccess tier of DCNs. In the data plane, POTORI relies on apassive optical coupler to interconnect the servers within therack and the interfaces toward the aggregation/core tiers. ThePOTORI control plane is based on a centralized rack controllerresponsible for managing the communications among the serversin the rack. We propose a cycle-based medium access control(MAC) protocol to efficiently manage the exchange of controlmessages and the data transmission inside the rack. We alsointroduce and evaluate a dynamic bandwidth allocation (DBA)algorithm for POTORI, namely Largest First (LF). Extensivesimulation results show that, with the use of fast tunable opticaltransceivers, POTORI and the proposed LF strategy are able toachieve an average packet delay below 10 µs under realistic DCtraffic scenarios, which outperforms conventional EPSs. On theother hand, with slower tunable optical transceivers, a carefulconfiguration of the network parameters (e.g., maximum cycle-time of the MAC protocol) is necessary to obtain a good networkperformance in terms of the average packet delay.
Index Terms—Optical interconnect architectures, data centernetworks, medium access control (MAC), dynamic bandwidthallocation (DBA).
I. INTRODUCTION
The growing popularity of modern Internet applicationssuch as cloud computing, social networking and video stream-ing is leading to an enormous increase of data center (DC)traffic, including not only the north-south (client-server) traffic,but also the east-west (server-to-server) traffic exchangedwithin the DCs [1]. According to Cisco, the overall datacenter traffic will keep increasing at a compound annualgrowth rate (CAGR) of 25% up to the year 2019, reaching 10Zettabytes per year [2]. Therefore, it is important to evolve thecurrent data center network (DCN) infrastructure to supportthe continuously growing traffic demand.
Data center operators are addressing this problem by up-grading the transmission data rate and switching capacity oftheir network equipment. For example, Facebook has alreadydeployed 10G Ethernet network interface cards (NICs) for allservers and Top-of-Rack (ToR) switches [3]. Optical fiber canbe deployed in DCN to interconnect servers and switches in
The authors are with KTH Royal Institute of Technology, Department ofCommunication Systems, Electrum 229, SE- 164 40 Kista, Sweden (e-mail:{yuxinc, matteof, ruilin, wosinska, jiajiac}@kth.se).Corresponding author:Jiajia Chen.
order to simplify cabling and avoid electromagnetic interfer-ence (EMI) [4]. Higher data rate and switching capacity (e.g.,40G, 100G) are also taken into consideration by the networkoperators in the future DC design [5]. However, it is hardto develop large electronic packet switches operating at highdata rates, due to the bottleneck of I/O bandwidth and powerbudget of the chip [6]. As a consequence, a large amountof electronic switches need to be deployed to scale out thenumber of servers in the DC, which brings a serious scalabilityproblem to the DCN in terms of cost and power consumption[7].
Optical interconnect architectures that are able to provideultra-high transmission speed and switching capacity in acost- and energy-efficient way, are considered to be a promis-ing solution to address the limitations of electronic packetswitches (EPSs) in DCs. By replacing EPSs with opticalswitches, the reduced power-demanding electrical-to-optical(E/O) and optical-to-electrical (O/E) conversion is expected todramatically decrease the power consumption of data centernetworks [8]. Several optical interconnect architectures forDCs are proposed in literature in recent years, e.g., [13]—[16]. These architectures employ all-optical switches basedon different topologies and technologies at aggregation/corelayer, but rely on conventional EPSs at ToR to interconnectservers in the racks. However, the EPSs at ToR are responsiblefor a large amount of the overall DC traffic. For example, itis reported in [17] that in the DCs running extensive dataexchange applications (e.g., MapReduce) around 80% of thetotal traffic is confined in the access tier. Moreover, the EPSsat ToR contribute to the majority of the overall DCN powerconsumption [21]. Therefore, efficient optical interconnectarchitectures for the access tier in DCs are required.
In our previous work (i.e., [8], [9], [21]), we proposeda concept of passive optical interconnect (POI) which usesmainly passive optical components for interconnection. Thephysical layer experiments [9] have shown that more than 500ports can be supported in the passive optical interconnect at thecapacity up to 5Tb/s. We also shown that the passive opticalinterconnect provides lower cost, lower energy consumptionand higher scalability with respect to the conventional EPSs.Specifically, it has been demonstrated in [8] that the energyconsumption per bit in the DCNs can be reduced by at least afactor of 7 by using passive optical interconnects at ToR com-pared to the ones using EPS. We also proposed a MAC pro-tocol and a dynamic bandwidth allocation (DBA) algorithm,namely Largest First (LF), for achieving efficient bandwidthutilization when applying the passive optical interconnect atToR [18]. This paper extends the work in [18] with a focuson passive optical ToR interconnect (POTORI) and introducesthe following new contributions: (i) We illustrate how POTORIcan be interconnected with other network architectures in the

2
aggregation/core tier to build large DCNs, where both thedata plane and control plane are considered; (ii) We performan extensive performance comparison among different DBAalgorithms for POTORI; (iii) We study the impact of differentnetwork configuration parameters (e.g., tuning time of theoptical transceivers, duration of the cycle time in the MACprotocol, etc.) on the performance of POTORI; and (iv) Wecompare the performance of POTORI with a conventionalEPS in terms of the average packet delays and packet lossprobability. The results show that using our proposed LF DBAalgorithms along with ultra-fast tunable transceivers, POTORIcan outperform the conventional EPS.
The rest of the paper is organized as follows. We presentthe related works on optical interconnect architectures forDC in Section II. In Section III, we illustrate the POTORIarchitecture, including both data plane and control plane.The proposed centralized MAC for POTORI is elaborated inSection IV, and in Section V we introduce and analyze theproposed DBA algorithm. The simulation results of POTORIand a conventional EPS are presented and discussed in SectionVI. We conclude the paper in Section VII.
II. RELATED WORKS
Several optical interconnect architectures for DCN havebeen proposed in the literature. The c-through [10] and HOS[11] are two examples of hybrid electronic/optical intercon-nection solutions. In these hybrid interconnect architectures,optical circuit switches (OCS) are employed to provide highcapacity for transmitting long-lived and bandwidth-consumingtraffic flows (e.g., elephant flows) due to the long reconfigura-tion time of OCS, and EPS is used to transmit short-livedtraffic flows that do not need large bandwidth (e.g., miceflows). These solutions require pre-knowledge or classificationof traffic pattern in order to distinguish large and small flowsand properly configure the OCS, which is challenging for DCoperators.
On the other hand, there are some all-optical architecturesolutions proposed recently. In [12], the authors demonstrateda new optical circuit switching (OCS) based architecture forDCN, which is based on a single comb-driven MEMS mirrorand is able to achieve a switching time of 20 µs. However,such fast switching might still create a substantial delay incase of a small amount of data to be transmitted, makingit not suitable to be employed at ToR where small burstsof intra-rack traffic need to be handled. The authors in [13]proposed a flat data center network architecture with fast flowcontrol. Each ToR switch is connected to one intra-clusteroptical switch as well as one inter-cluster optical switch.All the traffic is switched by optical switches according tothe flow control mechanism, which is based on the packetheader processing on each electronic ToR switch. OPMDC[14] is a three-tier architecture, where each tier is a setof reconfigurable optical add-drop multiplexers (ROADM)connected in ring topology, and the ROADM rings in thelower tier are connected to a ROADM in the upper tier. At theaccess tier each ToR switch is connected to a single ROADM.Space division multiplexing (SDM) is also considered in all-optical DCN solutions, e.g., [15][16] for improving capacity.In [15], four architectures based on SDM are proposed, andit is shown that these architectures are suitable to apply in
different DCs depending on their size and work load. Theauthors in [16] reported an optical data center architecturebased on multidimensional switching nodes connected in ringtopology. These switching nodes are able to switch in space,wavelength and time domains, supporting the connections ofdifferent granularities. The ring topology reduces the numberof physical links, simplifying the cabling management. Never-theless, all these aforementioned architectures rely on opticalswitching only in the aggregation/core tires, while they arebased on conventional electronic ToR switches in the accesstier to interconnect the serves within the same rack. In [20],the authors proposed and demonstrated software-defined ubiq-uitous data center optical interconnection (SUDOI), which alsoconsiders optical switch at ToR. However, the main focus ofSUDOI is on the control plane, where a service-aware schedulescheme is introduced to enable cross-stratum optimizationof application and optical network stratum resources whileenhancing multiple-layer resource integration. The concretedesign of optical interconnects within DCs is not provided.
In [21] and [22] we proposed several passive optical ToRinterconnect architectures for the access tier in DCs. Thesearchitectures use passive optical components (i.e., arrayedwaveguide grating (AWG) and/or optical couplers) to inter-connect the servers in the rack. It has been demonstratedthat the passive optical components offer cost and powersaving as well as high reliability. While in [21] and [22] wefocused on the data plane architecture, in [18] we proposed aMAC protocol and novel DBA algorithms to achieve efficientbandwidth utilization in POTORI. The current paper extendsour previous work by covering both data and control plane,and provides a complete design of POTORI architecture alongwith a detailed analysis of the network performance and anextensive comparison with the conventional EPS solutions.
III. POTORI: PASSIVE OPTICAL TOP-OF-RACKINTERCONNECTS
Fig. 1 illustrates the POTORI architecture, including bothdata plane and control plane. Each server is equipped with anoptical network interface (ONI), which consists of two opticaltransceivers. The first one is a tunable transceiver connected tothe POTORI data plane. The second one is a grey small formfactor pluggable (SFP) transceiver connected to the POTORIcontrol plane. In the following subsections, we elaborate thePOTORI data and control planes, mapping POTORI to the usecase of DCNs.
Data Plane
The POTORI data plane was proposed and introduced in ourprevious work [22]. The key component of POTORI data planeis an (N+1)⇥(N+1) passive coupler that acts as the switchingfabric to interconnect all the servers in the rack. We define Nas the number of servers in the rack. In each ONI, the tunabletransceiver is composed of a wavelength tunable transmitter(WTT) for transmitting data, and a wavelength tunable filter(WTF) as well as a receiver for receiving data. The WTT andWTF are connected to one input port and one output port of thecoupler, respectively. One additional pair of input and outputports of the coupler are connected to a wavelength selectiveswitch (WSS), which forwards and receives the traffic to/fromthe aggregation and core tiers.

3
Fig. 1: (a) POTORI Architecture in Data Center, (b) Rack Controller
It can be seen that the POTORI’s data plane is passive,except the WSS that is needed to dynamically filter outspectrum for the inter-rack communications. Actually, WSScan be replaced by the passive wavelength filter, in whicha fixed configuration of the spectrum for intra- and inter-rack communications may result in low flexibility of resourceusage. Due to the key component — coupler, the data trans-mission in POTORI follows the broadcast-and-select scheme.The traffic transmitted by one server is broadcast and receivedby all the other servers and the WSS. The destination server(or the WSS) then selects the traffic destined to it, whilediscarding the other traffic. In this way, the servers are ableto send/receive traffic to/from each other in the rack (e.g.,Server 2 sends traffic to Server 1 in Fig.1). The WSS receivesand drops the intra-rack traffic while forwarding the inter-racktraffic to/from the upper tier (e.g., Server N sends traffic to theaggregation/core tier in Fig.1).
Control Plane
In order to successfully transmit data, both ONIs at sourceserver and destination server need to be tuned to the samewavelength. To avoid data collision in the coupler, concurrentcommunications inside the rack can be carried on the differentwavelengths. It calls for a proper control plane design to effi-ciently schedule resources in both spectrum and time domainsfor managing the intra-rack and inter-rack communications.
The proposed centralized control entity for POTORI,namely rack controller, is shown in Fig. 1. The rack controllerexchanges control information with the ONIs using dedicatedcontrol links. The servers report the relevant information (e.g.,buffer size) to the rack controller and tune the transceiversaccording to the feedback from the rack controller. ThePOTORI MAC protocol defines the exchanging procedure andthe format of the control messages between the servers and therack controller, which will be elaborated in Section IV. On theother hand, the rack controller collects the necessary trafficinformation from each server and creates the traffic matrix.Then it runs a DBA algorithm, determining the wavelength
and time slots assigned for all the servers in the rack. Finally,it generates the control messages that include the outcome ofthe DBA and sends them to each server.
Application of POTORI in Data Center Networks
The POTORI architecture can be interconnected with anysolution for the aggregation/core tiers to build large DCNs. Inthe data plane proper interfaces are needed to interconnect thePOTORI with the aggregation/core switches. These interfacescan employ O/E conversion for connection to the conventionalEPS in aggregation/core tier or they can be optical (e.g., todirectly connect the POTORI to an optical core switch andrealize an all-optical DCN [8]). In the latter case, a strategyfor the joint allocation of the optical resources in the accessand aggregation/core tires needs to be developed.
In the control plane the rack controller can be connected to ahigher layer DC controller in a hierarchical control architecture(see Fig. 1(b)). In this way the DC operator can employa single control infrastructure to manage all the resourcesin the DC. Depending on how the DC controller interactswith the rack controller, two different modes of operationcan be defined, namely fixed-mode and programmable-mode.In the fixed-mode the DC controller is not able to influencethe resource allocation inside the rack. The rack controllerperforms layer 2 functions, such as switch table lookup, andcomputes the resource allocation according to a deployed DBAalgorithm. On the other hand, in the programmable-mode(see Fig. 1(b)) the DC controller can influence the resourceallocation inside the rack, e.g., by changing the employed DBAalgorithm dynamically. A possible way to realize a controlplane operating in programmable-mode is to equip the rackcontroller with a configurable switch table (e.g., an OpenFlow[24] switch table) and a configurable resource allocationmodule (see Fig. 1(b)). Using a software defined networking(SDN) [23] DC controller is then able to dynamically changethe flow rules and the DBA algorithm employed by the rackcontroller. In this paper, we consider only the control plane infixed-mode, and leave the programmable-mode for the futurework.

4
Fig. 2: The MAC Protocol and the Request-Grant Messages of POTORI
IV. MAC PROTOCOL
Due to the broadcast property of the coupler, POTORIrequires a proper MAC protocol to efficiently coordinate thedata transmissions among the servers in a rack. The existingMAC protocols can be classified as distributed and centralized.In distributed MAC protocols, every server determines itsown resources for data transmission, based on the directexchange of control information with the other servers inthe network and without the involvement of the centralizedcontroller. There are some typical examples of distributedMAC protocols, such as the carrier sense multiple accesswith collision detection (CSMA/CD) [25] which has beenwidely employed in the old version of Ethernet (10 Mb/s and100 Mb/s), and the high-efficient distributed access (HEAD)protocol which was proposed for the optical interconnectarchitecture POXN in [26]. However, the control overhead inthe distributed MAC protocol should be taken into account.Given the large amount of short lived traffic flows within a rackin data centers, the control overhead brought by the distributedMAC protocol might be significant and the performance of thenetwork (packet delay, packet drop ratio, etc.) will decrease.As a consequence, the distributed MAC protocols might notbe good candidates for POTORI.
In contrary, a centralized controller is able to manage theexchange of control information and coordinate the data trans-mission among all the servers in the network. Typical examplesare the IEEE 802.11 protocols [27], which are used in Wi-Finetworks, the multipoint control protocol (MPCP) [28] whichis used in Ethernet passive optical networks (EPONs), and thetime division multiple access (TDMA) Ethernet proposed in[29]. The TDMA Ethernet seems to be a good candidate forPOTORI, as it allows one server at a time to use the entireavailable bandwidth for transmission in order to achieve lowlatency and low packet drop in the network. However, applyingTDMA Ethernet to POTORI would result in a single servertransmitting at a time over one wavelength and suspendingthe communications among the remaining servers. POTORI is
able to support concurrent communications using wavelengthdivision multiplexing (WDM), where multiple wavelengths areutilized to set up connections for different server pairs. TheMPCP is another choice for POTORI, due to the similarity ofthe data plane in PON and POTORI. However, POTORI re-quires multipoint-to-multipoint communications where all theservers should be able to communicate with each other, whileMPCP supports only multipoint-to-point communications, andthus it cannot be directly applied to POTORI. In addition,IEEE 802.11 standards do not support WDM, so that thecontrol schemes utilized in Wi-Fi networks are not applicableto POTORI. In this regard, we propose a new centralized MACprotocol tailored for the POTORI architecture.
The proposed MAC protocol is shown in Fig. 2 and followsa Request-Grant approach. The time is divided in cycles. Atthe beginning of each cycle, each server sends a Requestmessage to the rack controller. The Request message containsthe information about the packets currently buffered at theserver. After receiving the Request messages from all theservers, the rack controller is able to generate a traffic matrixand run the DBA algorithm to calculate the allocation ofwavelengths and transmission time for all the servers. After-wards, the controller informs the servers about the outcome ofthe resource allocation using Grant messages, which containall the necessary information (wavelength, cycle time, etc.)for configuring the ONIs of the servers. At the beginningof the next cycle, each server will tune the WTT and WTFto the assigned wavelengths for transmitting and receivingdata according to the information in the Grant message. Forexample, in Fig. 2, at the time TC�1, all three servers (S1,S2, S3) report their buffer information to the rack controllerthrough Request Messages for Cycle C, and the rack controllerthen responds with the Grant Messages in the same cycle.Meanwhile, all three servers tune their WTTs and WTFs,according to the Grant Message received during the previouscycle (i.e., Cycle C-1) and start transmitting and receivingtraffic. At the time TC (specified in the Grant Messages

5
received during Cycle C), all the servers tune the WTTs andWTFs accordingly. In the example shown in Fig. 2, Server 3tunes the transmitter to �3 and the receiver to �2, and Server1 tunes the transmitter to �1 and the receiver to �3 for CycleC. Consequently, the traffic from Server 3 to Server 1 canbe successfully transmitted in this cycle, which lasts fromTC0, to TC3, according to the Grant message. Similarly, theRequest and Grant Messages for Cycle C+1 are exchangedin parallel with the data transmission of Cycle C. Thanks tothe dedicated connection between each server and the rackcontroller, collisions among the Request and Grant Messagescan be eliminated.
Note that each server only transmits the granted data ac-cording to the Grant message, which might be only a portionof the ones reported in the Request message. It is worth tomention that the granted traffic, which will be transmitted inthe next cycle, is not reported in the next Report Message.For example, in Fig. 2 Server 3 receives the Grant Message ofCycle C, allowing to send 800 bytes to Server 1. At TC , Server3 subtracts the 800-byte traffic and reports the remaining datawith the destination of Server 1 in the Request Message ofCycle C+1.
We further illustrate the structure of the Request and GrantMessages in the following sections.
A. Request Message
Fig. 2 shows an example of the Request message. The firstfield of the Request message contains the current time cycleidentifier (e.g., Cycle C+1 in Fig. 2), which is used by the rackcontroller to identify whether the received control messagesare outdated or not. If a Request Message is not synchronizedwith the cycle identifier at the rack controller, it is discarded bythe rack controller. The second field of the Request Messagecontains MAC address of the source server, i.e., the serverthat generates the Request message (e.g., Server 1 in Fig.2). Besides, the request message should also contain in totalN fields for all the possible destination MAC addresses (N-1 for the other servers in the rack and one for the interfacetoward the aggregation/core tier), along with the correspondingnumber of buffered bytes, i.e., the bytes to be transmitted atthe source server.
The Request Message can be encapsulated in an Ethernetframe. The length in bytes of the Request message (LR) canbe calculated as:
LR = LCH + LSRCMAC + N ⇥ (LDSTMACi + LSi) (1)
where LCH is the length of the first field in the time cycle,LSRCMAC and LDSTMACi are the length of MAC addressof the source and the ith destination (6 bytes) server, and LSi
is the length of buffed packets size for ith destination. If weassume LCH = 8 bytes, LSi = 4 bytes, a Request messageas an Ethernet frame with the maximum size (1518 byte) cansupport up to 150 servers in a rack, which is sufficient for theaccess tier in DCs.
B. Grant Message
An example of the Grant message is shown in Fig. 2. Similarto the Request Message, the first field of Grant Messagecontains the current cycle identifier (e.g., Cycle C in Fig. 2).According to this field, the servers that newly join the networkor lose synchronization to the rack controller can update their
cycle identifier. The second field contains the timestamp thatindicates the end of the cycle (e.g., TC+1 in Fig. 2). Thethird field contains the destination MAC address of the GrantMessage, i.e. the server which the Grant message is destinedto (e.g., Server 3 in Fig. 2.). The following three fields contain:(i) a time slot with the starting timestamp (e.g., TC0 in Fig. 2)and ending timestamp (e.g., TC3 in Fig. 2) for transmission;(ii) the assigned wavelengths for transmitter (e.g., �3 in Fig.2) and receiver (e.g., �2 in Fig. 2) during the timeslot given in(i); (iii) the destination MAC address (e.g., Server 1 in Fig. 2)as well as the granted size (e.g., 800 bytes in Fig. 2) for thetransmission during the time slot given in (i). The time slotcan last either the entire time cycle or a part of the time cycle.Note that we define an extra parameter TM as the maximumtransmission time for each cycle. Each server cannot transmitdata longer than TM in each cycle, i.e., in Fig. 2 TC+1 - TC
should be less or equal to TM . The value of TM definitelyaffects the network performance, which will be discussed inSection VI.
The length of a Grant message LG can be calculated as:
LG = LCH+LSRCMAC+LNCT +2⇥LWI+LDSTMAC+Ls
(2)where LNCT is the length of timestamp, LTS is the lengthof the starting/ending timestamp for data transmission, andLWI is the length of the wavelength identifier. The remainingsymbols are the same as the ones for the Request Message. Ifwe would consider a timestamp of 8 bytes and a wavelengthidentifier of 1 byte, the length of a Grant message would be52 bytes which is small enough to be encapsulated into oneEthernet frame.
V. DYNAMIC BANDWIDTH ALLOCATION ALGORITHMS
A traffic demand matrix can be built by the rack controllerafter receiving the Request Messages from all servers anduplink interfaces. An example is shown in Fig. 3. The rowsand columns of the matrix indicate the input port (source)and output port (destination), respectively, and the matrixelement represents the amount of traffic (in bytes) that needsto be transmitted from the source to the destination. TheDBA algorithm should find a solution for assigning availablewavelengths to the different traffic demands without anycollision in the data transmission. A collision occurs whendifferent traffic demands are assigned to the same wavelengthat the same time. To avoid collisions, at most one trafficdemand can be assigned to an available wavelength, i.e., eachrow and each column in the matrix should be associated toexactly one wavelength. The right side of Fig. 3 gives afeasible solution of the wavelength assignment without anycollision. The wavelengths assigned for serving the differenttraffic demands are distinguished by colors. The rack controllerforms the Grant Messages according to the DBA solution,indicating the wavelengths for transmitting and receiving atevery server.
The problem described above is similar to the classicalswitch scheduling problem. A conventional electronic switchbuffers incoming data traffic at input queues, and then for-wards it to the output ports. The traditional crossbar switchfabric allows multiple input queues to transmit data trafficto different output ports simultaneously. Many schedulingsolutions have been proposed over decades, aiming to find

6
Fig. 3: Traffic Demand Matrix.
matches between input port and output port to achieve highthroughput and low packet delay. Some solutions are based onmatrix decomposition. For example, paper [30] uses Birkhoffvon Neumann (BvN) algorithm to find optimal schedulingsolutions to configure the circuit switches in DC. However,these solutions are not suitable for POTORI, since the hightime complexity of matrix decomposition algorithms makes itonly feasible for the scenario in [30], where the traffic demandfor a long time period is known before running the algorithm.On the other hand, there are some other solutions having lowertime complexity, such as iSLIP [19], which is one of the mostwidely used in electronic switches. However, iSLIP is notdesigned to support WDM. Thus we adapt the iSLIP algorithmto POTORI as a benchmark DBA algorithm to be comparedwith ourproposed novel DBA algorithm, referred to as LargestFirst (LF). We define N and W as the size of the matrix andthe number of available wavelengths, respectively.
A. Benchmark: iSLIP Adapted to POTORIIn this paper we adapt iSLIP to be used in POTORI.
The iSLIP algorithm is an improved Round-Robin Matching(RRM) algorithm. Each input and output port of a crossbarswitch fabric is associated a Round-Robin (RR) scheduler. Thedetailed procedure of iSLIP algorithms can be found in [19].Within N iterations, the iSLIP algorithm is able to find up toN matches between input and output from a traffic demandmatrix. Given a traffic demand matrix, suppose that iSLIPalgorithm finds N* matches, where N*N. In the adaptediSLIP for POTORI, these found matches needs to be assigneddifferent wavelengths. If W�N*, then it is possible to assignevery match with a unique wavelength. When W<N*, werandomly pick W matches from iSLIP’s result and assignthem with different wavelengths. In original iSLIP algorithm,whenever an input-output match is found, the correspondingscheduler of this match is updated. The adapted iSLIP forPOTORI updates the schedulers if and only if a match isassigned a wavelength.
The iSLIP algorithm is easy to implement in the hardware. Itachieves 100% throughput for uniformly distributed Bernoulliarrivals, but may not be efficient for bursty arrival trafficpatterns [19] [31], which is often more suitable to model thereal traffic pattern in DCs [32].
Algorithm 1 Largest First Algorithm
1: Input: M; W; const R2: %Input: TDM M, wavelength list W, transceiver data rate R3: tX [None, None...]; txT ime [0, 0]4: rX [None, None...]; rxT ime [0, 0]5: List T M.sort()6: repeat7: D T[0]8: if D.tX is None and D.rX is None then9: D.assigned True
10: tX[D.src] [W[0] : [0, D.size/R]]11: rX[D.dst] [W[0] : [0, D.size/R]]12: txT ime[D.src] D.size/R13: rxT ime[D.dst] D.size/R14: delete W[0]
15: delete T[0]16: until T or W is Empty17: return tX, rX
Fig. 4: Largest First AlgorithmB. Largest First
The Largest First (LF) is a greedy heuristic algorithm. Itprioritizes the largest element in the traffic demand matrix,i.e., larger amount of traffic demand has higher probabilityto be assigned with a wavelength. First, the matrix elementsare sorted in a descending order into a one-dimensional array(Line 5 in Fig. 4). Then, starting from the first element in thearray, a traffic demand is assigned with a wavelength if andonly if neither the transmitter nor the receiver associated to thisdemand have already been assigned another wavelength in thecurrent cycle (Line 7-9 in Fig. 4). The corresponding informa-tion such as wavelength, source, destination and transmissiontime is used to generate the Grant Message (Line 10-13 inFig. 4). If one of the transmitter or receiver of this demandis assigned another wavelength, the demand is not served andleft for the next cycle (Line 15 in Fig. 4). The LF algorithmstops when all the available wavelengths are assigned, or thelast traffic demand in the array is served (Line 16 in Fig. 4).
VI. PERFORMANCE EVALUATION
In this section, we evaluate the performance of POTORIand compare it with conventional electronic ToR packet switch(EPS) in terms of average packet delay and packet drop ratio.To be more specific, the packet delay consists of queuing timeat the source node (servers and uplink interfaces), transmissiontime and propagation time. In POTORI, the ONI at serversdrops packet when the buffer is full. Moreover, we examinethe impact of different system configurations (e.g., selectedDBA algorithms, tuning time of the transceivers, etc.) on theperformance for POTORI. We build a customized discrete-event-driven simulator implemented in Java for the perfor-mance evaluation.
A. Traffic ModelThe traffic model used in simulations is derived from
[17][32]. Each server generates 106 packets where the packetinter-arrival time follows a lognormal distribution. The size ofpackets follows a bimodal distribution (i.e. most of packetsare with size of either 64-100 bytes or around 1500 bytes),which is shown in Fig. 5(c). The data rate (R) per server isset to 10 Gb/s and we assume that the buffer size on the

7
Fig. 5: (a) average packet delay; (b) packet drop ratio; (c) CDF of packet size for simulations (d) CDF of packet delay underload = 0.1; (e) CDF of packet delay under load = 0.7.
TABLE I: Table of NotationsN Number of Servers in a rackR Data Rate of the Tunable Transceiver
OR Oversubscription Rate↵ The ratio between the number of available wavelengths
and the sum of the number of servers and uplink transceiversTTu Tuning Time of the TransceiverTM Maximum Transmission Time of CycleTP Transmission Time of an Ethernet Frame with size of 1518 bytes
ONI is 10 Mbytes. The propagation delay is set to 50 ns,which corresponds to 10 m fiber for interconnect within therack. The network oversubscription rate OR is set to 1 : 4(i.e., if we consider 64 servers in a rack, there are 16 tunabletransceivers for communication with the aggregation/core tiers,and the coupler with 64+16 = 80 pairs of input and output portsinterconnecting all servers and uplink transceivers). Serversand uplink ports generate packets with random destinations.We assume that 80% of the traffic generated by servers isintra-rack traffic. The destination of the intra-rack traffic isuniformly distributed to all the other servers in the rack. Theremaining 20% of traffic is inter-rack, whose destination isuniformly distributed among the uplink interface transceivers.Meanwhile, each uplink interface transceiver generates packetswith destination uniformly distributed to all servers, represent-ing the traffic from aggregation/core layer to the rack. Wedefine N as the number of servers in a rack, and ↵ as the ratiobetween the number of available wavelengths for a rack andN(1+OR) (i.e., the sum of the number of servers and uplinktransceivers), reflecting the sufficiency of the wavelengths. Inaddition, the tuning time of the tunable transceivers is definedas TTu, and the maximum transmission time of a cycle isdefined as TM . Finally, Table I summarizes all the notations.
B. POTORI v.s. EPSIn this subsection, we compare the performance of POTORI
using different DBA algorithms with the conventional EPS.We set the line rate to10Gb/s for both POTORI and EPS. Thetuning time of the tunable transceiver for POTORI is 50 ns
Fig. 6: Average packet delay with (a) different N; (b) different↵.
(i.e., TTu = 50 ns) [29], and the maximum transmission timeTM for each cycle is set to 1.2 µs, allowing the server totransmit at most one packet with the maximum size of 1518bytes. Fig. 5 (a) and (b) show the average packet delay andpacket drop ratio for a rack with 64 servers (i.e., N = 64)and ↵ = 100%, which means the total number of availablewavelengths is N⇥(1+OR) = 80).
It can be seen in Fig. 5(a) that when load is lower than 0.5,POTORI with the proposed LF DBA algorithm can achieve a

8
Fig. 7: Performance with TTu = 2 µs and different TM : (a) average packet delay; (b) packet drop ratio.
packet delay lower than 10 µs, which performs similar as EPS.When the load is increased to 0.7, POTORI with LF is ableto introduce up to 50% lower delays compared to EPS, thanksto the LF’s feature of prioritizing the large traffic demand.Moreover, it performs slightly better (around 2% difference)than EPS in terms of the packet drop ratio. On the otherhand, POTORI with the iSLIP DBA algorithms, has the worstperformance. When the load is lower than 0.5, the averagepacket delay when employing iSLIP is double as high as thatwith LF. In addition, iSLIP shows highest packet drop ratio,which is greater than 10% when load is larger than 0.75.
In Figs. 5(d) and 5(e), we show the cumulative distributionfunction (CDF) of the packet delay at load = 0.1 and load =0.7, which represent the cases with low load and high load,respectively. Under the load of 0.1, the difference betweenPOTORI and EPS is negligible, and POTORI is able to achievepacket delay less than 10 µs for almost all packets (>99.99%). Under the load of 0.7, there are 40% of the packets that aretransmitted to the destination within 10 µs by POTORI withLF, and 80% of the packets have a delay lower than 100 µs,which outperforms POTORI with iSLIP and EPS.
C. Impact of Network Configuration
In this subsection, we investigate the impact of networkconfiguration on performance and present the average packetdelay as a function of N and ↵. The TTu and TM are set thesame in the previous subsection (i.e., TTu = 50ns and TM
= 1.2 µs). Because the proposed LF obviously outperformsiSLIP, we choose LF as the DBA algorithm for POTORI.
Fig. 6(a) shows the average packet delay of POTORI withdifferent number of servers (i.e., N = 32, 64, and 128) inthe rack with ↵ = 100% (corresponding to 40, 80, and 160available wavelengths, respectively). Under the low load (i.e.,load = 0.2) and the heavy load (i.e., load = 0.8), the differencein the average packet delay is very small. It is because underthe low load, the wavelength resources are sufficient andmost of the traffic demands can be transmitted in one cycleregardless of N, while under high load the system gets statured,always resulting in high delay. For the medium load (i.e., load= 0.4 and 0.6), the packet delay performance degrades withthe increase of the number of servers. This is due to the factthat the number of available wavelengths (which is equivalentto the maximum number of assigned traffic demands in eachcycle) increases linearly with the number of servers, but thetotal number of traffic demands increases quadratically.
Fig. 6(b) shows the average packet delay with different val-ues of ↵. We consider 128 servers per rack (i.e., N = 128), and
Fig. 8: Average packet delay with different TTu.
test ↵ =100% (160 wavelengths), 75% (120 wavelengths), and50% (80 wavelengths). The average packet delays are almostthe same for all the considered values of ↵ under the lowload (i.e., load = 0.2), indicating that in this condition usingless wavelengths in POTORI under the low load still maintainsgood packet delay performance (less than 10 µs). However, thepacket delay with ↵ = 50% increases dramatically under thehigher load, while with ↵ = 75%, the performance decreasessignificantly at load = 0.6.
D. Impact of Transceivers’ Tuning Time TTu
In the previous subsections, we considered a tunabletransceiver with an ultra-fast tuning time TTu = 50 ns anda maximum transmission time of TM = 1.2 µs for eachcycle. Note that with TM = 1.2 µs, packet-level switchinggranularity is achieved by POTORI, since in each cycle thereis at most one packet transmitted by a server. However, withthe larger tuning time it may become challenging to efficientlyrealize the packet-level switching granularity. Thus, we relaxthe constraint of transceivers tuning time to 2 µs, which hasbeen reported by the commercially available products [34].With TTu = 2 µs, the performance of POTORI in terms ofaverage packet delay and packet drop ratio with different DBAalgorithms are shown in Fig 7. If keeping TM = 1.2 µs, thepacket delay of both DBA algorithms increase tremendouslyand the system has a high packet drop ratio, due to theincreased tuning overhead. However, the performance can bemuch improved by increasing TM . With TM = 10 µs, thepacket delay for POTORI with LF DBA algorithm employedcan still be maintained below 100 µs when the load is lowerthan 0.3, and below 400 µs under the load up to 0.7. Whenemploying iSLIP, on the other hand, POTORI performs worse,as the packet delay is around 600 µs under the medium load(load from 0.3 to 0.6). In addition, LF achieves lower packetdrop ratio compared to iSLIP. Nevertheless, for both the LF

9
Fig. 9: Average packet delay with different ratio between TM and TTu: (a) TTu = 2 µs; (b) TTu = 5 µs.
and iSLIP setting TM = 10 µs outperforms the case with TM
= 1.2 µs. The reason for this is that with larger TM , morepackets can be sent by servers within one cycle, which reducesthe tuning overhead.
One important question is “how to set the proper value ofTM for POTORI”. Obviously, the proper value of TM highlydepends on the tuning time TTu of the transceiver. POTORI isable to achieve the packet-level switching granularity with thefast tuning transceivers. Fig. 8 shows that a moderate packetdelay performance (i.e., < 100 µs) when the load is lowerthan 0.6 can be achieved at the tuning times equal to 50 nsand 240 ns (corresponding to 4% and 20% of the maximumtransmission time of one packet). The packet delay increasesas we use transceivers with longer tuning time (i.e., 360ns,480ns, 600ns, 1200ns, corresponding to 30%, 40% 50%,100% of the maximum transmission time of one packet). Weconclude that in order to obtain a good performance of packetdelay (e.g., less than 100 µs under the load of 0.6) with packet-level switching granularity in POTORI, TTu should be lessthan 30% of maximum transmission time of one packet.
With a longer transceiver’s tuning time, TM should beincreased to reduce the tuning overhead. In Fig. 9 we presentthe packet delay as a function of ⌧ , which is defined as theratio of TM over TTu, given TTu = 2 µs and 5 µs, respectively.With a small ⌧ (i.e., ⌧ = 1 and 2), the packet delay is as highas 104µs even under the medium load (i.e., load = 0.4 and0.6) while obviously better packet delay performance can beachieved with a larger ⌧ (i.e., ⌧ = 3, 4, 5) under the sameload. In addition, with ⌧ = 5, the performance will decreasea little at load = 0.6. This is due to the fact that even if withlarger ⌧ , more traffic can be sent in one cycle, yet not allservers cannot fully utilize the cycle and may transmit muchless traffic than is allowed in one cycle. It is caused by thebursty feature of the traffic generated by the servers, whichmay lead to quite different traffic demand per server in eachcycle. The larger the TM is, the larger can be the differencein traffic requested by the servers in one cycle. In order to usethe resources more efficiently and achieve the acceptable delayperformance, we conclude that given a tunable transceiverwith long tuning time (i.e., in the scale of micro-seconds), themaximum transmission time of one cycle should be at leastthree times longer than the transceiver’s tuning time.
VII. CONCLUSION
In this paper, we focus on POTORI, an efficient optical ToRinterconnect architecture for DCs. The POTORI’s data planeis based on a passive optical coupler, which interconnectsthe tunable transceivers of the servers within a rack. In thecontrol plane, POTORI relies on a centralized rack controller,which is responsible for managing the intra-rack and inter-rack
communications. A cycle based centralized MAC protocol anda DBA algorithm (Largest First) are proposed and tailoredfor POTORI, aiming to achieve the collision-free transmissionwith good network performance. POTORI can be applied inoptical DCN with any aggregation/core tier architecture, giventhe proper design of interfaces.
The simulation results have shown that under the realisticdata center traffic scenarios, POTORI with the proposed DBAalgorithm obtains the average packet delay in the order ofmicroseconds, which is superior to the performance of theconventional EPS. Moreover, we quantify the impact of net-work configurations (including the interconnect size and thenumber of available wavelengths) and transceiver tuning timeon the packet delay. For POTORI, the packet-level switchinggranularity is feasible if the tuning time can be kept smallenough (less than 30% of the packet transmission time). Inthe case of the short tuning time (i.e., in the magnitude ofmicroseconds), setting the maximum transmission time of eachcycle greater than three times of transceiver’s tuning time isstill able to achieve the acceptable packet delay performance.
ACKNOWLEDGMENT
This work was supported by the Swedish Foundationfor Strategic Research (SSF), Swedish Research Coun-cil (VR), Goran Gustafssons Stiftelse, Celtic-Plus sub-project SENDATE-EXTEND funded by Vinnova, NaturalScience Foundation of Guangdong Province (Grant No.508206351021) and National Natural Science Foundation ofChina (Grant No. 61550110240, 61671212).
REFERENCES
[1] http://www.datacenterknowledge.com/[2] Cisco Global Cloud Index: Forecast and Methodology, 2014-2019,
October 2015, Cisco white paper.[3] A. Andreyev, “Introducing data center fabric, the next-generation Face-
book data center network.”https://code.facebook.com/posts/360346274145943, 2014.
[4] FINISAR, “Cabling in the Data Center”,https://zh.finisar.com/markets/data-center/cabling-data-center.
[5] Data Center Design Considerations with 40 GbE and 100 GbE, Aug.2013, Dell white paper.
[6] N. Binkert et al., “The role of optics in future high radix switch design,”in Proc. IEEE ISCA, 2011, pp.437-447.
[7] R. Pries et al.,“Power consumption analysis of data center architectures,”in Green Communications and Networking, 2012.
[8] M. Fiorani et al., “Energy-efficient elastic optical interconnect archi-tecture for data centers,” in IEEE Communications Letters, vol.18, pp.1531-1534, Sept. 2014.
[9] R. Lin et al., “Experimental Validation of Scalability Improvement forPassive Optical Interconnect by Implementing Digital Equalization”,European conference and exhibition on optical communication(ECOC),September 2016.
[10] G. Wan et al., “c-through: part-time optics in data centers,” in Proc.ACM SIGCOMM Conf., 2010, pp. 327-338.
[11] M. Fiorani et al., “Hybrid Optical Switching for Data Center Networks,”in Hindawi Journal of Electrical and Computer Engineering, Vol. 2014,Article ID 139213, 13 pages, 2014.

10
[12] W. M. Mellette et al., “A Scalable, Partially Configurable OpticalSwitch for Data Center Networks,” in IEEE/OSA Journal of LightwaveTechnology, vol. 35, no. 2, pp. 136-144, Jan. 2017.
[13] F. Yan et al., “Novel Flat Data Center Network Architecture Based onOptical Switches With Fast Flow Control,” in IEEE Photonics Journal,vol. 8, number 2, April 2016.
[14] M. Yuang et al., “OPMDC: Architecture Design and Implementation ofa New Optical Pyramid Data Center Network,” in IEEE/OSA Journal ofLightwave Technology, vol. 33, issue 10, pages 2019-2031, May 2015.
[15] M. Fiorani et al., “Optical spatial division multiplexing for ultra-high-capacity modular data centers,” in Proc. IEEE/OSA Opt. Fiber Commun.Conf. 2016, Paper Tu2h.2
[16] V. Kamchevska et al., “Experimental Demonstration of Multidimen-sional Switching Nodes for All-Optical Data Center Networks,” inIEEE/OSA Journal of Lightwave Technology, vol. 34, issue 8, April2016.
[17] A. Roy et al., “Inside the Social Network’s (Datacenter) Network,” inProc. ACM SIGCOMM Conf., 2015 pp. 123-237.
[18] Y. Cheng et al., “Centralized Control Plane for Passive Optical Top-of-Rack Interconnects in Data Centers,” in Proc. IEEE GLOBECOM2016.
[19] N. McKeown, “The iSLIP Scheduling Algorithm for Input-QueuedSwitches,” in IEEE/ACM Trans. on Networking, vol. 7, no 2, pp.188-201,1999.
[20] H. Yang et al., “SUDOI: software defined networking for ubiquitousdata center optical interconnection,” IEEE Communications Magazine,vol. 54, no. 2, pp. 86-95, Feb. 2016.
[21] J. Chen et al., “Optical Interconnects at Top of the Rack for Energy-Efficient Datacenters,” in IEEE Communications Magazine, vol. 53, pp.140-148, Aug. 2015.
[22] Y. Cheng et al., “Reliable and Cost Efficient Passive Optical Intercon-nects for Data Centers,” in IEEE Communications Letters, vol. 19, pp.1913-1916, Nov. 2015.
[23] N. McKeown et al., “OpenFlow: Enabling innovation in campus net-works,” in ACM SIGCOMM Computer Communication, Review 38,April 2008.
[24] Software-Defined Networking: The New Norm for Networks, OpenNetworking Foundation (ONF) White Paper, April 2012.
[25] “802.3-2012 - IEEE Standard for Ethernet”.[26] W. Ni et al., “POXN: a new passive optical cross-connection network for
low cost power efficient datacenters,” in IEEE/OSA Journal of LightwaveTechnology, vol. 32, pp. 1482-1500, Apr. 2014.
[27] “IEEE Standard for Information technology–Telecommunications andinformation exchange between systems Local and metropolitan areanetworks–Specific requirements Part 11: Wireless LAN Medium AccessControl (MAC) and Physical Layer (PHY) Specifications”.
[28] L. Khermosh, “Managed Objects of Ethernet Passive Optical Networks(EPON),” RFC 4837, July 2007.
[29] B. Vattikonda et al., “Practical TDMA for Datacenter Ethernet,” in Proc.ACM EuroSys. Conf., pp. 225-238, 2012.
[30] G. Poter et al., “Integrating microsecond circuit switching into the datacenter,” in Proc. ACM SIGCOMM Conf., 2013 pp. 447-458.
[31] T. Javadi et al., “A high-Throughput Algorithm for Buffered CrossbarSwitch Fabric,” in Proceedings IEEE ICC, pp. 1581- 1591, June 2001.
[32] S. Kandula et al., “The Nature of Datacenter Traffic: Measurement&Analysis,” in Proc. ACM SIGCOMM Internet Eas. Conf., 2009, pp.202-208.
[33] S. Matsuo et al., “Microring-resonator-based widely tunable lasers,” inIEEE J. Sel. Topics Quantum Electron, vol. 15, no. 3, pp. 545-554, 2009.
[34] Keysight Technology: 81960A Fast Swept Compact Tunable LaserSource, 1505nm to 1630nmhttp://www.keysight.com/en/pd-2038953-pn-81960A/fast-swept-compact-tunable-laser-source-1505nm-to-1630nm-new?cc=SE&lc=eng
Yuxin Cheng received the B.Eng. degree in electronic engineering fromTsinghua University, Beijing, China, in 2012 and M. Eng. degree in networkservices and systems from KTH Royal Institute of Technology, Sweden, in2015. He is currently a Ph.D. candidate with Optical Networks Lab (ONLab),KTH Royal Institute of Technology, Sweden. His research interests includeoptical data center network and software defined networking.
Matteo Fiorani received the Ph.D. degree (February 2014) in ICT fromUniversity of Modena (Italy). From February 2014 to October 2016, he wasPostdoc Researcher in optical networks at KTH (Sweden). He was visitingresearcher at TU Vienna (Austria), UC Davis (USA) and Columbia University(USA). Since October 2016, he works as Senior Researcher in 5G networks atEricsson (Sweden). He co-authored more than 50 papers published in leadingtechnical journals and conference proceedings. He also submitted severalpatents and standardization contributions on 5G networks. He was co-founderand chair of an IEEE workshop on 5G transport networks.
Rui Lin received the B.Sc. degree in Electrical Information from HuazhongUniversity of Science and Technology (HUST), and the Ph.D. degree inCommunication System from KTH Royal Institute of Technology, Swedenin 2016. Her research interests include short-reach optical interconnect anddatacenter network.
Lena Wosinska received her Ph.D. degree in Photonics and Docent degreein Optical Networking from KTH Royal Institute of Technology, Sweden,where she is currently a Full Professor of Telecommunication in the Schoolof Information and Communication Technology (ICT). She is founder andleader of the Optical Networks Lab (ONLab). She has been working in severalEU projects and coordinating a number of national and international researchprojects.
Her research interests include fiber access and 5G transport networks,energy efficient optical networks, photonics in switching, optical networkcontrol, reliability and survivability, and optical datacenter networks. She hasbeen involved in many professional activities including guest editorship ofIEEE, OSA, Elsevier and Springer journals, serving as General Chair and Co-Chair of several IEEE, OSA and SPIE conferences and workshops, servingin TPC of many conferences, as well as being reviewer for scientific journalsand project proposals. She has been an Associate Editor of OSA Journalof Optical Networking and IEEE/OSA Journal of Optical Communicationsand Networking. Currently she is serving on the Editorial Board of SpringerPhotonic Networks Communication Journal and of Wiley Transactions onEmerging Telecommunications Technologies.
Jiajia Chen received the Ph.D. degree (May 2009) in Microelectronicsand Applied Physics, and the docent degree (February 2015) in OpticalNetworking from KTH Royal Institute of Technology, Sweden. Her mainresearch interests are optical interconnect and transport networks supportingfuture mobile system and cloud environment. She has more than 100 paperspublished in the leading international journals and conferences. She isPrinciple Investigator of several national research projects funded by SwedishFoundation of Strategic Research (SSF), Gran Gustafssons Foundation andSwedish Research Council (VR). Meanwhile, she has been involved and takenthe leadership in various European research projects, including the EuropeanFP7 projects IP-OASE (Integrated Project-Optical Access Seamless Evolu-tion) and IP-DISCUS (Integrated Project-the DIStributed Core for unlimitedbandwidth supply for all Users and Services), and several EIT-ICT projects(e.g., Mobile backhaul, M2M and Xhaul).