partitioning in ree-saturating minerals: theory,...
TRANSCRIPT

Geochimica d Cosmochimica Acta Vol. 51: pp. 4069-4094 Copyright 0 1993 Rrgamon Press Ltd. Pnnted in U.S.A.
OOl6-7037/93/56.00 + .OO
Partitioning in REE-saturating minerals: Theory, experiment, and modellmg of whitlockite, apatite, and evolution of lunar residual magmas
BRADLEY L. JOLLIFF, LARRY A. HASKIN, RUSSELL 0. COLSON, and MEENAK~HI WADHWA
Department of Earth and Planetary Sciences and the McDonnell Center for the Space Sciences, Washington University, St. Louis, MO 63 130, USA
(Received August 20, 1992; accepted in revised form March 20, 1993)
Abstract-We present compositions, including REEs determined by ion microprobe, of apatite and whitlockite in lunar rock assemblages rich in incompatible trace elements. Total concentrations of REE oxides in whitlockites range from 9-13 wt%, and those in apatites range from 0.15 to 1 wt%. Ratios of REE concentrations in whitlockite to those in coexisting apatite range from - 10 to 60. The distribution of Mg and Fe between apatite and whit&kite is correlated to that of coexisting mafic silicates: Magnesium is strongly preferred by whitlockite, and Fe is preferred by apatite. Incorporation of REEs in whitlockite is dominated by the coupled substitution of 2REE3+ in Ca(B) sites + vacancy in Ca(IIA) for 2Ca2+ in Ca(B) sites and (Ca’+,Na+) in Ca(IIA). Other substitutions account for only a small portion of the REEs in whitlockite over the observed concentration range; thus, REE concentrations become partially saturated as the primary substitution approaches its stoichiometric limit of two REEs per fifty-six oxygens, leading to reduced whit&kite/melt distribution coefficients, e.g., decreasing from twenty-five to ten for Nd. The REE concentrations of lunar residual melts are not depleted by whitlockite crystallization in assemblages consisting mainly of other minerals in typical proportions. Distribution coefficients for the REEs in lunar apatite appear to be low and variable, e.g., -0.2-0.8 for Nd.
Variations in the modal ratio of whitlockite to apatite, specifically the abundance of whitlockite, lead to a range of REE concentrations in the phosphates and variations in the magnitude of REE concentration ratios between whit&kite and apatite. If apatite crystallizes before whitlockite or in the absence of whit- &kite, as textures in several samples indicate, then apatite zoned in REEs and apatite crystals of different REE concentrations may occur in a given sample, provided there is some amount of fractional crystal- lization and apatite does not later equilibrate. This may occur because, in the absence of whitlockite in the crystallizing assemblage, the REEs are highly incompatible relative to the crystalline assemblage, so REE concentrations in lunar residual melts increase strongly during small increments of late-stage crys- tallization. Once whit&kite begins to crystallize, bulk distribution coefficients for the REEs, although still < 1, are only mildly incompatible, so the change in REE concentrations of residual melts with further crystallization is small, consistent with the lack of REE zoning in whitlockite.
The REE concentrations in lunar whitlockitcs are modelled as resulting mainly from equilibrium crystallization of the assemblages in which they occur; metasomatism or other secondary metamorphic processes are not indicated. Local melt-pocket equilibrium at advanced stages of crystallization may lead to variable REE concentrations and variable whitlockite/apatite concentration ratios within the same sample. Parent melts with extremely?high REE concentrations are not required in order to crystallize REE-rich lunar whitlockite if modal proportions of whitlockite are low.
INTRODUCTION AND PREVIOUS WORK
THE PHOSPHATES APATITE and whitlockite ( merrillite ) , are common accessory minerals in many lunar rocks ( FRONOEL, 1975; PAPIKE et al., 199! ). Whitlockite has very high REE concentrations and accounts for much of the REE content of rocks in which it is found. Concentrations of REEs (lan- thanides plus yttrium; e.g., HASKIN and GEHL, 1962) in whit&kite exceed those of coexisting apatite by one to two orders of magnitude. This observation, based mainly on high- quality ion microprobe analyses (LINDSTROM et al., 1985, 1991; GWDRICH et al., 1985a,b), led to the suggestion that such apatite and whitlockite in lunar rocks might not be at equilibrium with each other and that some process such as metasomatism, metamorphic alteration, or sequential crys- tallization is required to explain the REE distributions.
Early experimental studies of phosphateliquid partitioning involving apatite and whitlockite indicated that REEs might not favor whit&kite relative to apatite as strongly as the
natural assemblages seem to indicate. For example, whit- lockite/melt distribution coefficients for the LREEs of - 10 (DICKINSON and HESS, 1983) do not seem high enough rel- ative to typical apatite/melt D values in terrestrial systems. Experimentally determined whitlockite/apatite REE con- centration ratios < 5, reported by MURRELL et al. ( 1984), are much lower than measured concentration ratios between the lunar phosphates. That the apparent distribution of REEs between apatite and whitlockite in lunar rocks differs from that indicated by early experimental work led to the specu- lation that one or the other phosphate mineral was produced by infiltration metasomatism or metamorphic alteration ( LINDSTROM et al., 1985; NEAL and TAYLOR, 199 1; SNYDER et al., 1992 ) . Apatite and whitlockite occur in vugs in Apollo 14 breccias, presumably deposited by hot vapors within basin- formed ejecta deposits (MCKAY et al., 1972), so it is rea- sonable that these minerals might have formed by metaso- matism in igneous rocks or that one replaced the other in thermally metamorphosed rocks.
4069

4070 B. L. Jolliff et al.
It has been postulated that the parent melts that crystallized REE-rich lunar whit&kite had extremely high REE con- centrations, e.g., 6-20 times KREEP concentrations (WAR- REN et al., 1983; SHERVAIS et al., 1984; LIND~TROM et al.,
1984; NEAL et al., 1990). Thus, the presence of REE-rich whitlockite in highlands igneous rocks, which have relatively primitive mineral compositions, such as magnesian anor- thosites, has been considered an enigma. It has been suggest& that these occurrences of whitlockite require a process such as assimilation of KREEP by a magnesian suite magma (WARREN et al., 1983; SHERVAIS et al., 1984; LINDSTROM et al., 1984) or metasomatic addition of whit&kite by an extremely REE-enriched fluid (NEAL et al., 1990; NEAL and TAYLOR, 199 1) . It is doubtful in most cases that whitlockite is an early liquidus phase, so there is no reason why its REE concentrations should reflect those of the parent liquid of the whole rock. Rather, its REE concentrations reflect those of the evolved or residual melt at the time of whit&kite crystallization. It has been proposed that REE-rich whitlockite in alkali anorthosites resulted from crystallization of highly evolved trapped liquids ( SHERVAIS et al., 1984; LINDSTROM et al., 1984), but WARREN et al. (1983) also considered the possibility of urKREEP metasomatism of ferroan anorthosite to produce phosphate-rich alkali anorthosite.
MC KAY et al. ( 1987 ) showed experimentally that the dis- tribution coefficient for neodymium (whit&kite/melt) at low REE concentration is -26, and that at the higher REE concentrations typical of lunar whitlockites, the D value is much lower due to a saturating substitution, decreasing to about 8- 10 at 12 wt% total REE concentration in whitlockite. This effect was subsequently recognized by LINDSTROM et al. ( I99 1) in their discussion of the distribution of REEs between melt and coexisting minerals in Apollo 15 quartz monzodiorite, and by NEAL and TAYLOR ( 1991) in their review of whitlockite / melt REE distribution coefficients. Ef- fects of saturation would produce variable whitlockite/apatite REE ratios if apatite D values were constant over the range of conditions considered. This effect need not account for all differences in REE distribution between whit&kite and apa- tite. Some differences may be related to sequential crystalli- zation of the two minerals such as was determined for the Shergotty meteorite by LUNDBERG et al. ( 1988). In some samples, whitlockite crystallization may have preceded that of apatite (e.g., JOLLIFF, 199 1) ; in principle, this might deplete the melt of REEs, yielding later-crystallizing apatite with low REE concentrations, as suggested by HESS et al. ( 1990). Such sequential crystalhzation might be considered to be consistent with the observation that whitlockite is more magnesian than coexisting apatite. Higher Mg/Fe in whit&kite than in apa- tite, however, is expected even at equilibrium (HESS et al., 1990) and is a consequence of the different crystal structures of whitlockite and apatite, as we discuss in this paper.
Whit&kites with high REE concentrations occur in some lunar basaltic mesostases where they are undoubtedly pro- duced by residual liquid crystallization. In plutonic rocks, the Fe/ Mg ratios in whit&kite and apatite indicate that they may be at equilibrium with, or derived from, the same parent magma as coexisting mafic silicates (HESS et al., 1990; this work). Why, then, is REE-rich whitlockite, which seems to require an REE-rich liquid, found in mineralogicahy prim-
itive assemblages? Detailed petrogenetic modelling requires that we know the distribution of REEs among coexisting minerals and better understand the partitioning of REEs be- tween silicate melt and whitlockite. For example, what are the whitlockite/apatite concentration ratios of the REEs in different highlands lithologies? Are apatite and whitlockite in these samples at equilibrium, or is there some indication of sequential crystallization? Is metasomatism required to explain the presence of phosphates in highlands lithologies, or can the phosphates be interpreted as products of residual trapped liquids? What concentrations of REEs are required in such liquids? In this paper, we present high-quality analyses of coexisting apatite and whitlockite in samples of diverse geochemical, mineralogical, and lithological character from Apollo 14. We discuss how compositions and petrographic features bear on questions of origin, and we develop a geo- chemical model based on data from the Apollo 14 samples, experimental data of MCKAY et al. ( 1987) and COL~ON and JOLLIFF ( 1993b), and new theoretical considerations to ex- plain REE partitioning in the lunar phosphates. We model the dependence of REE distribution coefficients on their concentration in whitlockite and demonstrate how variations in REE concentrations and in whitlockite/apatite REE ratios could result from equilibrium crystalhzation of phosphate- bearing residual magmas.
ANALYTICAL METHODS
Each of the seven rock samples that contain phosphates studied in this work was first analyzed in bulk by instrumental neutron ac- tivation ( INAA ) as part of a geochemical survey of 2-4 mm fragments in lunar soil sample 14161 (JOLLIFF et al., 1991). Subsequently, a subset of those samples was studied petrographically and with the electron microprobe (EMP) . Those that have high REE concentra- tions and relatively high abundances of apatite and whitlockite are the subject of this paper.
Analyses of REEs in lunar whit&kite by EMP are common, but analyses of REEs in lunar apatite are far fewer because the low con- centration levels generally require use of the ion microprobe (IMP) for determination. Concentration levels of REEs in whit&kite range up to a sum of about I3 wt% oxides, an order of magnitude greater than concentrations in coexisting apatite in most lunar rocks that contain both minerals. In lunar whit&kite, the concentrations of Y, La, Ce, and Nd can be fairly well determined by EMP (many references, e.g., dating back to ALBEE and CHOW& 1970; KEIL et al., I97 I; GANCARZ et al., 197 1; GRIFFIN et al., 1972; BROWN et al., 197 I, i972). However, EMP analyses of the HREEs in whitlockite and all REEs in apatite are shown to be inaccurate when IMP analyses of the same samples are available (e.g., LINDSROM et al., 1985, 1991; SHERVAIS et al., 1984; JAMES et al., 1987). Here, we employ both techniques on the same phosphate crystals to obtain highquality analyses.
Instrumental Neutron Activation Analysis
Samples of bulk 2-4 mm fragments containing the phosphate minerals were irradiated for 24 h at a thermal neutron flux of 4.9 X 10 I3 cm-’ set-’ . Samples and synthetic glass standards were ra- dioassayed one week following the irradiation and again two weeks later. INAA methods are described in detail by KOROTEV ( 1991). Data reduction was done using the TEABAGS program ( LINLXI-ROM and KOROTEV. 1982 ) . Bulk comnositions determined bv INAA are given in Table’ I
Eleebon Microprobe
Mineral compositions were determined with a JEOL 733 electron microprobe using a combination of mineral, oxide, and glass stan-

REE-partitioning in lunar whitlockite and apatite 407 1
Table 1. Bulk compositions of particles from 14161. sample ,7844 ,7869 J233 ,7264 ,735o ,7373 notes (1) (2) (3) (4) (5) (6) desaiut. GN OMD ITE-IMR MG Ma-An W-GMG mass (mg) 17.9 -22.9 42.5 -1s -11.8 l-8.4
SiOz Ti%
A1203 03 Fe0 MtlO
MsO CaO BfIO Na20
z p205 Sum
SC Cr co Ni CS Ba La Sm EU Th Yb Lu Bf Ta Au @pb) Ir @pb) Th U
Plagioclase K&t-Feldspar I.ow-Ca Px Au&e Olivine Ihnenite Zircon Whitlockite Apatite silica metal+sulflde
Oxides
46.4 53.6 49.8 46.3 44.4 2.35 2.4 4.52 2.49 0.02 17.8 12.6 11.3 12.5 30.3 0.17 0.05 0.15 0.37 0.01 8.99 13.99 9.34 12.98 0.99 0.12 0.2 0.11 0.21 0.01 8.77 2.68 5.34 8.64 3.83
12.02 9 10.91 10.16 18.55 0.07 0.23 0.36 0.49 0.05 0.77 1.41 0.80 1.13 0.58 0.42 1.59 3.4 1.08 0.14 0.08 0.57 0.55 0.28 <O.Ol 0.98 1.72 4.14 2.16 0.79 99.0 100.0 100.7 98.9 99.7
Trace Elements
18.2 30.2 41.4 1.28 1176 361 1144 2531 77.6 13.7 7.15 41.9 5.1 <PO Cl10 360 20 0.6 1.6 3.0 0.1
670 2050 3250 4389 440 119 228 325 314 95 56 97 150 131 44
2.61 3.35 4.34 2 3.22 10.2 18.7 27.9 23 7.1 31.2 74 101 96 15.3
4.1 10.2 13.8 8.8 1.8 15.4 100 112 53 1.19 2.35 9.2 12 0.03
nd nd <I7 c4.2 nd nd Cl3 6
14.7 44 51 4.14 3 12.2 14.4 CO.25
Modal Mineralogy (weight percent)
48.6 31.0 20.9 33.4 88.4 3.2 13.0 23.9 8.0 1.0
32.2 21.5 14.5 42.3 9.8 10.0 12.0 5.9 1.5
2.0 7.2 3.8 4.0 8.0 4.5 0.1 0.9 0.9 0.4 1.5 2.2 3.3 3.3 0.9 0.8 2.0 6.7 1.8 1.0
13.4 9.9 0.4
44.9 1.8 8.5
0.14 16.05 0.23 6.25
12.94 0.08 0.72 0.64 0.97 4.98 98.2
42.2 982
15 Cl00
1.6 740 696 326 5.68 62.2 145
18.7 163
4.26 nd nd 37 5.4
23.2 4.1
34.5 15.6
3.0 1.5 8.8 2.8 5.5 1.0
FeG, Cr701, NaTO, Zt@. BaO by INAA. C&r o&l& by &I r&unbm~ion. Oxides reported as wt.?& Trace elements by INAA, reported as ppm unless otherwise noted. (1) GN - magnesian gabhronorite. (2) QMD - quartz monxodiorite. (3) ITE-IMR - incompatible-trace-clement-rich impact melt rock. (4) MG - monzogabbm (clast in breccia).
All cow&mtion values for ,7264 monzogabbro clast by modal recombinatiion; trace element concentrations only given for those elements for which modal recombination could be done.
(5) Mg-An - magnesian anorthosite. (6)‘W-QMG - whitlockite-cumulate quartz monzogabbro. nd = not detected
dards; an accelerating voltage of I5 KeV, and 20-40 nA beam cur- rents, depending on the mineralogy of the target. For the analysis of phosphates, the following standards were used. Phosphorus, calcium, and fluorine: Durango apatite (YOUNG et al., 1969, HUGHFS et al.,
1989). Yttrium, cerium, and-lanthanum: synthetic REE-doped glass (DRAKE and WEILL, 1972). Magnesium and silicon: enstatite. Iron: fayalite. Sodium: albite. Manganese: rhodonite. Chlorine: sodalite. A sample of Wilberforce apatite (C. M. Taylor Corp., Stanford, Cal- ifornia) and the large composite whitlockim-apatite crystal in 14 16 I,7350 (see the text to follow) were used as working standards. Data were reduced according to the method of BENCE and ALBEE ( 1968) and ALBEE and RAY ( 1970) using alpha factors calculated for a 40.0“ takeoff angle.
Data reductions for analyses of lunar whitlockite by the Bence- Albee method require an estimate of the concentrations of REEs not analyzed because the REEs have a significant effect on j3 factors, particularly for phosphorus, calcium, and magnesium. For example, corrections to K-ratios involving the REEs other than Y, 4 and Ce yield increases of 2% of P and 3% of Mg concentrations and a decrease of 0.5% of Ca concentrations at REE concentration levels typical of lunar whitlockite. This is especially important in the absence of a combined REE phosphate standard suitable for making empirical corrections. We used REE interelement ratios determined by IMP to estimate the REE concentrations other than Y, 4 and Ce. We then calculated beta factors according to the following relation:
where CA is the concentration of the oxide of element A in a mineral composed of elements A, B, . . . n, and ah, (Y$, . . . CT% are the alpha factors for A, B, . . . n determined for element A in binaries AA, AB,. . . An relative to pure A ( BENCE and ALBEE, 1968 ). For these calculations, we used a factors tabulated by CHAMBERS ( 199 1) .
Even after accounting for all the REEs, whitlockite oxide totals are consistently less than 100% (Table 2). The reason for this is not clear. Other oxides that have been reported in lunar whit&kite in- clude A&O3 at concentrations ranging up to 0.42 wt% ( ALBEE and CHODOS, 1970; BROWN et al., 1972; WARREN et al., 1983 ) and SrO ( 1% in 15475 whitlockite, BROWN et al., 1972). We have not observed these elements in energy-dispersive scans, and, in the case of Al, we found its concentration to be below our detection limit by wavelength dispersive analysis (x0.058 A1203) in samples 14161,735O and ,7264; thus, we have not routinely included it in all our analyses. As con- firmation, we obtained very low signals for Al and Sr in IMP analyses.
Ion Microprobe
Phosphates in carbon-coated thin sections of each sample were analyzed for REEs with a modified CAMECA IMS3f ion microprobe. Details of the experimental procedures are given by ZINNER and CROZAZ ( 1986). Initially, calcium concentrations of each analyzed crystal as determined by EMP were used to normalize the ion signals for the REEs. Sensitivity factors used for the REEs are those given by ZINNER and CROZAZ ( 1986). By this method, concentrations of Y, Ce, and La in whitlockite crystals were found to be within 3-4% of those determined by EMP. Differences appear to be systematic: La and cerium concentrations determined by EMP exceed those de- termined by IMP, and Y concentrations by EMP are lower than those by IMP. We consider agreement to within 4% acceptable for the present because of uncertainties related to our use of an IMP standard of low REE concentrations relative to lunar whit&kite and EMP REE standards of substantially different matrix composition from that of whitlockite. We are currently investigating the use of a set of synthetic REE orthophosphate standards ( JAROSEWICH and BOATNER, 199 1) to resolve systematic discrepancies between EMP and IMP analyses.
In order to match REE concentrations determined by IMP to major and minor elements analyzed by EMP, a second normalization was done to obtain the data reported in Table 2. Concentrations deter- mined by IMP were normalized to Ce concentrations determined by EMP for an average of several spots corresponding to each IMP anal- ysis. Concentrations of Ce and Y in apatite, determined by EMP, are relatively precise for purposes of spot-to-spot comparison, but we do not consider them sufficiently accurate to renormalize the IMP Ce concentrations (Table 3 ) , as was done for whit&kite.

Tab
le 2
. Whi
tlock
ite c
ompo
sitio
ns f
rom
Apo
llo 1
4, sa
mpl
e 14
161
2-4
mm
soi
l fra
gmen
ts.
,704
4 ,7
044
,706
9 ,7
233
,723
3 ,7
264
,726
4 ,7
35o
,735
o ,7
373
,737
3 ,7
373
,737
3 (a
) (b
) A
vEM
F
(a)
@)
(a)
(b)
(a)
(b)
(a)
@)
(c)
(d)
P,O
, Iw
t%~
43
.17
43.4
9 41
.66
43.7
6 43
.48
43.5
1 42
.99
43.0
8 43
.25
43.3
2 43
.61
43.2
7 42
.94
p205
__
I.
I
SiO
, F
e0
g Cd0
Na@
y2
°3
sum
LJ
l203
Tot
al
0.45
0.
23
0.86
0.
34
0.88
0.
77
3.55
0.
44
0.03
co
.01
0.09
0.
03
3.11
3.
24
1.58
3.
47
40.3
6 40
.63
38.7
40
.36
0.49
0.
61
0.31
0.
45
3.00
2.
89
3.63
3.
32
7.29
6.
81
7.54
7.
58
98.7
8 98
.67
97.9
2 99
.75
0.21
0.
42
0.45
0.
24
0.52
0.
93
1.27
0.
17
0.03
0.
03
0.04
0.
02
3.26
3.
22
3.00
3.
60
40.4
9 39
.74
40.4
0 39
.31
0.48
0.
30
0.47
0.
19
2.74
3.
06
2.70
3.
19
6.84
8.
38
7.52
9.
10
98.0
5 99
.59
Pg.
84
98.9
0
Cat
ion
For
mu
la
Baa
ed o
n 5
6 O
syge
ns
13.9
82
13.9
10
13.8
32
13.9
05
0.08
0 0.
159
0.17
1 0.
092
14.0
62
14.0
69
14.0
03
13.9
97
0.16
5 0.
294
0.40
4 0.
054
0.01
0 0.
010
0.01
3 0.
006
1.84
6 1.
813
1.70
0 2.
046
16.4
79
16.0
80
16.4
5 1
16.0
58
0.35
4 0.
220
0.34
6 0.
140
1.47
2 1.
734
1.55
8 1.
879
20.3
26
20.1
51
20.4
72
20.1
83
Rar
e E
arth
Ek
nu
nta
@
pm)
2160
0 24
100
2125
0 25
050
7950
97
80
1019
0 20
050
2510
0 2g
28
300
2600
31
70
2g60
36
70
1139
0 14
570
1290
0 17
340
3180
40
40
3470
44
20
50
31
28
27
3640
39
50
3780
43
20
590
650
630
680
4030
45
80
4130
42
60
850
920
880
840
2260
24
50
2230
20
90
0.24
0.
13
0.12
0.
13
0.14
0.
17
1.97
1.
89
2.03
1.
90
0.02
0.
01
0.06
0.
07
0.09
3.
59
2.60
2.
54
2.45
2.
54
39.7
2 41
.27
41.3
3 41
.52
41.5
4 0.
26
0.61
0.
52
0.49
0.
49
2.99
2.
42
2.55
2.
49
2.57
8.
36
6.33
6.
62
6.41
6.
78
98.6
0 98
.66
99.2
4 98
.86
98.9
9
sio,
F
e0
Mn
o
Mgo
C
aO
Na@
y2
°3
-w3
Tot
al
P
Si
Su
m (
W
Fez
+
Mn
Mg
Ca
Na
y+L
n3+
S
ow=
)
E
Ce
R
Nd
Sm
E
u
kt!
Dy
Ho
Er
Tm
:
13.9
31
13.9
16
13.9
42
13.8
98
0.09
1 0.
049
0.04
5 0.
049
14.0
22
13.%
5 13
.987
13
.947
0.05
4 0.
625
0.59
7 0.
644
0.00
6 0.
003
0.01
9 0.
022
2.03
6 1.
471
1.43
0 1.
386
16.1
93
16.7
78
16.7
21
16x7
8 0.
192
0.44
9 0.
381
0.36
0 1.
735
1.33
9 1.
398
1.36
4 20
.216
20
.665
20
.546
20
.654
13.8
25
P
Si
Su
m (W
Fez
+
Mn
Mg
Ca
13.8
62
0.17
1 13
.929
0.
087
14.0
16
13.7
33
0.33
5 14
.068
1.15
6 0.
028
0.91
9 16
.145
0.
231
2O!;
f?
13.9
04
0.12
8 14
.032
0.
053
13.8
78
14.0
33
0.60
4 0.
029
1.44
0 16
.926
0.
361
1.43
4 20
.794
0.27
9 0.
010
1.75
8 16
.401
0.
360
1.58
3 20
.391
0.24
4 <
O.O
Ol
0.13
8 0.
010
1.82
7 16
.470
0.
447
1.49
2 20
.480
1.94
1 16
.229
0.
327
1.66
9 20
.314
m
r N
a y+
Lal
3+
0’
E
9 CD
Y k Pr
Nd
Sm
&
!!
Er
Tm
Y
b h
2360
0 78
70
2140
0 27
30
1329
0 36
50
30
2280
0 71
30
1985
0 25
00
1201
0 35
50
42
3670
63
0 39
10
870
2180
Ll;;
l
2615
0 87
70
2255
0 26
50
1354
0 31
70
54
3390
64
0 45
90
950
2530
31
0
2355
0 92
40
2560
0 33
10
1619
0 42
20
34
3930
64
0 39
30
780
2070
25
0
1905
0 73
30
1930
0
2005
0 75
90
1995
0
1965
0 71
50
1880
0 25
00
1167
0 31
10
43
3360
56
0 35
10
720
1840
2020
0 77
70
2070
0 25
80
1219
0
e,
.-
8600
22
800
2410
25
20
1136
0 12
040
2980
3lZ
J2
0
3230
54
37
60
630
4130
84
0 22
30
290
3360
58
0 34
80
710
1940
24
0
3290
69
0
4.9
0::
5.0
4.8
0:;
M.&
Fe+
Mg)
0.
86
0.44
0.
93
0.92
N
otw
R
EE
s~by
ioam
iaop
robe
.Ilo
nn
rliz
edto
Ce~
byel
ectr
onm
iu~
~.
oth
er o
tide
s (i
ndu
cin
g C
&O
S Y
2O3)
by
EM
P;
Yb
esti
mat
ed (s
ee t
ext)
. ,7
044a
&bd
iffe
ruxt
aysi
als.
,7
069
aw?s
age o
fEM
P
anal
yses
; su
m h
z03
extr
apol
ated
kom
Ce.
,7
233a
&bd
Bxe
ntc
ytal
s.
.726
4a&
bdif
k&
wpt
als.
,7
35O
aBtb
sam
eczy
stal
. .7
373a
&bd
iin
vsta
ls:c
&ds
amec
xyst
al.
6.6
6.1
5.2
6.1
0.97
0.
71
0.68
0.
70
M&
Fe+
Mp;
L
An
alyt
ical
err
or (c
oun
tin
g ah
tist
ics)
:
EM
P:
P, C
a: <
0.5
%,
Mg:
< l
ok,
Fe,
Y,
Ce:
3-5
%
Na,
Sk
5.6%
L
a: 8
-90/
b; M
n:
25-5
0%
IMP
: Y
,La,
Ce,
Nd,
k<
l%
Sm
, Gd,
Dy,
Ho,
Er
l-3%
T
b. T
m:
3-55
6; L
u:
S-9
$6: E
u:
15%

Tab
le 3
. Apa
tite
com
posi
tions
fro
m A
pollo
14,
sam
ple
1416
1 2-
4 m
m s
oil f
ragm
ents
. ,7
044
,704
4 70
69
,723
3 ,7
233
,726
4 ,7
264
,726
4 ,7
269
,726
9 (a
) (b
) A
vg E
MF
(a
) @
) (a
) @
) (c
) (a
) (b
) P
TO
l ~w
t.%
ol
41.2
2 41
.37
40.3
0 39
.96
40.7
8 40
.90
40.8
1 41
.55
41.0
9 40
.38
,‘135
0 (a
) 41
.47
,735
o ,7
35o
,737
3 97
373
@)
(c)
(a)
41.8
7 41
.59
41.6
1 41
.18
P205
CaO
N
a20
y2°3
p2%
Cl
SU
m
-O=
F
-0sC
l N
ew S
um
P
Si
Su
m (t
et)
Fe2
+
hfn
tti8
N
a Y
+w
am
(o
ther
f F
C
l su
m F
,Cl
G-b
0.42
0.
43
0.03
0.
14
55.5
6 0.
03
t:
3:01
1.
18
102.
16
1.27
0.
27
100.
62
0.45
1.
48
0.22
0.
96
0.02
0.
08
0.12
0.
04
54.0
8 54
.25
0.05
0.
06
0.07
0.
08
0.17
x.
12
2.96
2.
46
1.69
1.
47
101.
20
101.
18
1.25
1.
04
0.38
0.
33
99.5
7 99
.81
0.76
1.
06
0.29
0.
30
0.04
0.
05
0.18
0.
19
54.2
0 54
.12
0.03
0.
06
0.24
0.
24
0.56
0.
60
3.15
3.
44
1.00
0.
81
100.
41
101.
65
1.33
1.
45
0.23
0.
18
98.8
5 10
0.02
2.94
1 2.
979
2.89
2 2.
912
2.92
5 0.
036
0.03
9 0.
126
0.06
5 0.
090
2.97
7 3.
018
3.01
8 2.
977
3.01
5
0.03
0 0.
016
0.06
8 0.
021
0.02
1 0.
002
0.00
2 0.
006
0.00
3 0.
003
0.01
7 0.
015
0.00
5 0.
023
0.02
3 5.
016
4.92
8 4.
926
4.99
8 4.
913
0.00
5 0.
008
0.01
0 0.
004
0.01
0 0.
005
0.00
8 X
.006
0.
028
0.02
9 5.
075
4.97
7 5.
021
5.07
7 4.
999
0.80
4 0.
797
0.66
0 0.
859
0.92
2 0.
168
0.24
3 0.
211
0.14
7 0.
116
0,97
2 1.
040
0.87
1 1.
006
1.03
8
300
105
300
1:
:: 9”:
j5
12
211
!2?
3;q
1860
58
0 15
30
8:
320
6.6
320
3:; 71
20
1
11;1
0:;;
1910
1:: 22
0 97
0 28
0 6.
2 34
0
346
2;:
Ili1
OE
0:
: 3.
4 4.
9 4.
4 0.
38
0.35
0.
35
1610
65
0 17
30
214
x:
2;
3::
1::
12
0::
1110
31
0 90
0 13
8 63
0 20
0
2?!z
2g ;: $1
Mi?
‘W+
W)
0.36
0.
79
0.20
Not
es:
RE
Es
dhw
mh
ed
by I
MP
, oth
er e
lem
ents
by
EM
P;
Yb
esti
mat
ed (s
ee t
ext)
. ,7
044
- a
& b
di&
ren
t cr
ysta
ls.
,726
9 -
a &
b s
ame
qsta
l. A
nal
ytic
al ~
(~~
~~
~
EM
P:
P. C
a: <
0.50
/o; S
i, N
a: 5
O&
Fe,
Mg:
10-
25°h
,7
069
- av
erag
e of
EM
P a
nal
yses
on
ly.
,735
0-a&
bsam
ecry
stal
. M
n:
25-S
OO
h, F
: 34%
; c1
: 3-
S%
,7
233
- a
& b
di&
ren
t cr
ysta
ls.
,737
3-a&
bsam
ecty
stal
. IM
P:
Y,
ce:
1-2.
5O&
4 N
d, D
y: 2
.5-5
%;
Pr,
Sm
, E
r: S
-6%
;
0.57
0.
67
0.80
0.
63
0.42
0.
57
0.58
0.
60
0.03
0.
06
0.04
0.
02
0.19
0.
20
0.18
0.
18
54.3
3 54
.57
53.5
4 53
.68
0.07
:::
0.
05
0.09
0.
23
0.30
0.
18
0.58
0.
67
0.70
0.
49
3.70
3.
29
3.14
2.
84
0.53
0.
59
0.79
1.
48
101.
55
101.
75
101.
67
101.
28
1.56
1.
39
1.32
1.
20
0.12
0.
13
0.18
0.
33
99.8
7 10
0.23
10
0.17
99
.75
Cat
ion
F
orm
ula
base
d on
12.
5 O
xyge
ns
2.94
2 2.
926
2.95
8 0.
048
0.05
7 zz
3:
032
0.05
4 2.
990
2.98
3 3.
012
0.03
0 0.
040
0.04
1 0.
042
0.00
3 0.
004
0.00
3 0.
001
0.02
4 0.
025
0.02
2 0.
023
4.94
5 4.
951
4.83
3 4.
890
0.01
1 0.
028
z-g
0.00
8 0.
015
0.03
4 0.
023
5.04
1 5:
059
4.94
1 4.
994
0.99
4 0.
882
0.83
6 0.
764
0.07
6 0.
085
0.11
3 0.
214
1.07
0 0.
%7
0.94
9 0.
978
RIU
W lhtb
E
lem
ents
@pm
) 17
80
2190
23
50
1420
1::
660
750
580
1820
19
50
1490
22
5 24
3 25
1 17
1 11
60
1160
12
20
740
310
370
370
216
4.2
-6.6
-6
.7
9.2
350
430
410
270
67
74
68
48
340
460
470
269
1;:
2::
91
66
256
168
25
33
27
23
0.90
0.
69
tz
54:1
9 0.
06
0.20
0.
56
2.68
2.
02
101.
89
1.13
0.
45
100.
31
2.91
3 0.
077
2.99
0
0.04
9
Kz
4:94
7
8.Z
5:
054
0.72
3 0.
291
1.01
4
2.97
2 0.
028
3.00
0
0.00
2 ~
0.00
1 0.
012
4.97
4 0.
002
0.01
7 5.
007
0.92
3 0.
101
1.02
4
2.98
0 0.
025
3.00
5
0.00
4 <
O.o
al
0.01
2 49
60
<O
.OO
l 0.
016
4.99
2
0.89
0 0.
0%
0.98
6
1120
z 127
690
192
2”j:
2;:
1:
0.34
0.
30
0.03
0.
06
co.0
1 <
o.O
l 0.
09
0.09
54
.85
55.0
8 0.
01
co.0
1 0.
14
0.14
0.
35
0.34
3.
45
3.35
0.
71
0.67
10
1.44
10
1.90
1.
45
1.41
0.
16
0.15
99
.83
loo.
34
0.26
tz
0:09
54
.85
==
O.O
l 0.
15
0.38
3.
34
0.76
10
1.47
O!f
p7
99:9
0
0.30
0.
32
SiC
h
0.50
0.07
5:: 0:
03
0.14
0.
35
t:
101:
37
1.26
0.
16
99.9
5
2.97
7 2.
974
0.02
2 0.
025
2.99
9 2.
999
0.00
3 0.
035
0.00
1 0.
005
0.01
1 0.
009
4.96
9 4.
937
<O
.OO
l 0.
005
0.01
8 0.
017
5.00
2 5.
008
o.g9
2 0.
801
0.10
8 0.
103
1.00
0 0.
904
1189
32
0 10
20
149
770
243
24j:
2:: 44
11
5
0.55
0.06
0.09
54.5
3 0.
03
0.11
0.
28
2.91
0.
94
101.
00
1.23
0.
21
99.5
6
2.96
2 0.
027
2.98
9
0.03
9
tz!
4:96
4 0.
005
0.01
3 5.
036
0.78
2 0.
135
0,91
7
850
;z
103
490
131
1s; 29
17
3 %2
*
E
Ml@
C
kO
N;s
lO
y2°3
70
3
Cl
SU
m
-O=
F
-0E
Cl
New
Su
m
P
km
(t
et)
F$+
I&
MS
ca
N
a y+
LA
?+
m(o
tl=
r)
cl
sum
F,C
l
.726
4 -
a, b
. c d
iffe
ren
t cry
stal
s.
Gd.
Ho,
Tm
: 6-
100/
o; L
x 20
%:
Eu
: 25%

4074 B. L. Jolliff et al.
Several corrections were made to the raw IMP data. Neutron ir- radiation for INAA affects the isotopic ratios mainly of samarium, gadolinium, and ytterbium. The isotopes ‘49Sm, *$‘Gd, and 15’Gd have large nuclear cross sections (4 1,000,6 1,000, and 255,000 barns, respectively). The main effects seen in uncorrected data are high samarium (-1.5%), low gadolinium (-50%), and high ytterbium ( -25%). Our data have been corrected for these effects; however, apparent ytterbium anomalies remain, both positive and negative, in relation to Er, Tm, and Lu, even after the corrections. The cor- rections for ytterbium include both changes in isotopic abundances due to neutron irradiation and deconvolution of complex molecular oxide-ion interferences (such as ‘5r’Gd’60 interference on “‘Yb). We do not believe the ytterbium anomalies are real; therefore, ytter- bium concentrations have been estimated by averaging “corrected” ytterbium concentrations with values interpolated between Tm and Lu and extrapolated from Er and Tm, giving one-third weighting to each value. This yields an average correction of about 15%. Concen- trations of terbium in fluorapatite were corrected ( -5% decrease) for a molecular interference on ls9Tb as a result of 140Ce 19F. Con- centrations of REE are plotted normalized to chondrites in Fig. I.
SAMPLE DESCRImONS
14161.7044: CatacIastic Gebbronorite
This fragment is composed mainly of plagioclase ( Anss_s9) and pyroxene (mostly EG~Fs~WO~), including - 10% of finely exsolved augite (~L,~&,WO~~ in bulk). Accessory minerals include ilmenite, phosphates, zircon, K-feldspar, and traces of a silica polymorph. Modal abundances are given in Table I. The sample is moderately shocked (displaying pervasive fracturing, mosaicism, undulose ex- tinction) and partially recrystallized, showing minor granulitic de-
105
10’
103
102
10'
105
10’
103
102
10’
(a) 14161,7044 Mg
(d) 14161,7269 Felsite
velopment of matrix plagioclase. Relict grains occur (pyroxene up to 600 pm and plagioclase up to 500 Km), but cataclastic deformation obscures the original texture. Ilmenite and the phosphates occur mostly intergrown with pyroxene, not plagioclase, suggesting an in- tercumulus relationship between the accessory miner& and pyroxene. Whitlockite grain sizes range up to 200 pm, and apatite grain sizes range up to 120 Mm (Fig. 2a). If the proportions of minerals in this assemblage are representative, then roughly 75% pyroxene-feldspar cotectic crystallization ofthe magma that gave rise to this assemblage would have led to about 4 wt% P205 in the melt, enough to saturate and thus crystallize one of the phosphates (WATSON, 1979; HENS et al., 1990). Zircon is minor (0.1 wt% modal abundance) and probably saturated later than the phosphates, having only minor effects on their HREE concentrations.
14161,7069: Quartz MonzodIorIte (QMD)
This sample has very similar mineralogy and composition to QMD of sample 15405 (RYDER, 1976; TAYLOR et al., 1980). Its major element bulk composition is very close to that of the pseudoeutectic composition in the olivine-silica-plagioclase system ( JOLLIFF, 199 1) Although we have not analyzed the phosphates from ,7069 by IMP, they have been analyzed by EMP and are therefore included here. Whitlockite and apatite constitute about 4 wt% of the sample but are generally very fine-grained (discrete crystals and intergrowths up to about 50 pm). This sample has a composition that is interpreted to have been at the point of incipient immiscible separation of mahc and felsic liquid phases as it crystallized because it now preserves “domains” several hundred pm in dimension of silica-feldspar gran- ophyre in a more mafic matrix assemblage. However, based on KREEP-like interelement ratios of incompatible trace elements (ITE)
(b) 14161,7233 VH-lTE Melt Rock
(e) 14161.7350 Mg-Anorthoslte
LaCePrNd SmEwSdTbDyHoErlmYblu
Rare Earth Elements
(c) 14161,7264 Mm-
LaCe F+rNd t3nEuGdTbLJyHoGTmYblu
FIG. 1. Chondrite-normalized REE plots of whit&kite and apatite analyzed by IMP. The range of REE concentrations in whitlockite in each sample inferred from Ce concentrations determined by EMP is shown by a bar. Sample numbers correspond to those in Tables 2 and 3.

REE-partitioning in lunar whitlockite and apatite 4075
FIG. 2. Backscattered electron images of phosphate-bearing assemblages. (a) Gabbronorite 14 I6 1,7044. Phases arc, in increasing order of brightness, plagioclase (PI), pyroxene (Px), apatite (A), whitlockite ( W), zircon (Z), and ilmenite (I). Small composite phosphate grains occur in the lower left area. Field of view is 2 mm. (b) Fine-grained ITE-rich melt rock 14161,7233. Brightness of phases is same as ,7264. Composite phosphate grain is located in the upper right area. Field of view is 330 pm. (c) Monzogabbro clast in 14161,7264. In order of brightness, phases are plagioclase, pyroxene and barian K-feldspar (Kf), apatite, whitlockite, zircon, and ilmenite. Field of view is 1.7 mm. (d) Relict coarse-grained clast in felsite 14161,7269. Elongate crystal is a chlorofluorapatite crystal, surrounded by plagioclase and barian K-feldspar. The bright phase included in apatite is zirconolite, containing -8.8 w-t% YzOa and 1.2% CerO,. Field of view is 460 pm. (e) Composite apatite-whitlockite grain in 14 16 1,735O magnesian anorthosite. Dark gray is anorthite, light gray is apatite (A), and the brightest phase is whitlockite (W). Scale bar is 100 pm. (f) Quartz monzogabbro 14 16 1,7373. Pyroxene is coarsely exsolved; silica and K-feldspar form granophyric segregations (Gr), and most of the bright crystals are whitlockite. Field of view is 1.1 mm.

A076 B. L. Jolliff et al.
for the bulk sample, there appears to have been little or no physical separation of the mafic and felsic phases on a scale larger than that of the sample, in contrast to sample 14161,7373 and ,7269, where there was a physical separation ( JOLLIFF, I99 1).
14161,7233: Impact Melt Rock
This sample, first discussed by JOLLIFF ( 1990), is a very fine-grained impact melt rock with generally subophitic texture. The mode of this sample is uncommonly rich in barian K-feldspar, augite, ilmenite, silica, phosphates, and zircon, in addition to plagioclase (AQ,~~) and low-calcium pyroxene (Mg’0.62-0.66). It has the highest reported ITE concentrations of those lunar rocks that have KREEP-like in- terelement ratios (three times the average high-K KREEP; see Table 1) . Elevated siderophile element concentrations ( 360 ppm Ni; 4 1.9 ppm Co) indicate that this rock was formed by crystallization of an impact melt. Apatite and whitlockite occur both as discrete grains and as composite crystals. In one 50 pm composite crystal, apatite and whit&kite are in roughly equal proportions, but whitlockite clearly forms a capping overgrowth on one end (Fig. 2b). The large number of mineral phases in the assemblage, coupled with the abun- dance of accessory minerals and the bulk composition of the sample, indicate that this was a multiply saturated liquid composition throughout much of its crystallization. Textures and bulk composition indicate that cotectic plagioclase and pyroxene were followed closely by saturation of ilmenite and apatite, then silica, K-feldspar, and whitlockite. Zircon is only one-tenth as abundant as phosphates and probably formed late in the sequence but is typically spatially asso- ciated with the phosphates, particularly whitlockite. The fine-grained basaltic texture of this sample suggests rapid crystallization; thus, its bulk composition is taken to be representative of its parent liquid.
14361,7264: Monzngabbro
This sample comprises a - 1.6 mm central clast of monzogabbro with hypidiomorphic-granular texture surrounded by partially recrystallized matrix material. The monzogabbro clast consists of plagioclase (average An7 , ) , low-calcium pyroxene (average En,,FsaWor,), augite (average En(sFsaW~n, Mg’ -0.60-0.75), barian K-feldspar, phosphates, ilmenite, and zircon. Pyroxenes range up to 600 pm, and feldspar crystals to 300 pm. Separate whitlockite and apatite crystals range in size from 100-200 pm and have elongate to subequant forms (Fig. 2~). Pyroxene and feldspars are mostly ordinarily zoned; thin, reversely zoned rims presumably reflect ex- change between the more magnesian and anorthitic breccia sur- rounding the monzogabbro clast. Based on bulk composition and textures, the sequence of crystallization of minerals in this sample appears to have begun with pyroxene and plagioclase in roughly co- tectic proportions, although there appears to be an excess of low- calcium pyroxene. Concentrations of TiOz and P205 became high enough to saturate ilmenite and phosphates after about 50% crys- tallization (-4 wt% each; see LONGHI, 1977; WATSON, 1979; HESS et al., 1990). followed by K-feldspar at a later stage. Zircon crystal- lization was late and subordinate in amount to the phosphates.
14161,7269: Felsite (Lunar Granite)
This polymict sample, described in detail by JOLLIFF ( 199 1 ), is dominated by glass and lithic fragments of felsic (granitic) compo- sition. One ofthe lithic clasts contains an elongate chlorofluorapatite crystal 25 x 300 gm in dimension (Fig. 2d) in association with coarse barian K-feldspar and plagloclase (A%,). This apatite crystal is zoned in a manner we interpret as consistent with hollow crystal growth. If that interpretation is correct, then the crystal grew from a liquid progressively enriched in REEs and Cl, with REE concentrations increasing seven-fold during growth of the crystal (based on Ce by EMP). Zirconolite [ (Fe,Ca)( Ti,Zr,Y)@,] rich in Y and HREEs OC- curs as < 10 pm crystals in the granitic assemblage and in association with the REE-rich portion of the apatite crystal (Fig. 2d). The change in REE concentration during growth of the apatite and the occurrence of zirconolite may mean that there was only a very small volume of melt remaining when these minerals crystallized. There are no whit-
lockite or zircon crystals in the felsic lithic clasts in the thin section of this sample.
14161,735o: MaguesIan Anorthosite
This sample consists of plagioclase ( Angs), olivine (FOG), minor diopside (Er@~,rWo~.~), barian K-feldspar, and phosphates. The thin section contains an apetite-wbitlockite composim crystal, roughly 300 X 300 rem across (Fe, 2e). The texture of the sample is cata&stic, but plagio~Iase-crystal clasts range up to -1 mm in size. Otivine occurs as fine-grained, granular crystals located within several olivine- rich stringers (hacture/crushed zones) and scattered throughout the fine-grained, fragmental, plagioclase-rich matrix. Although the sample has been mechanically deformed, uniform mineral compositions coupled with coarse plagioclaae grain size indicate a cumulate origin. Accessory barian K-feldspar and diopside presumably represent a trapped liquid component. Accessory mineral proportions determined for this sample are not n eomsarily representative of the modal pro- portions of a larger sample of this rock type.
14161,7373: WbitktekIte-rich Quartz MonzodIorIte (Mnmto@bzn)
This sample contains coarse-grained, mutually exsolved pyroxenes (Ens,F&W@ and En&ssrWon), plagioclase (An-), barian K- feldspar, a silica polymorph, ilmenite, zircon, troilite, and 1 I W phos- phates, mostly whitlockite. The sample also contains silica-K-feldspar granophyre, presumably formed by immiscible separation of Si,K- rich melt from mafrc melt ( JOLLIFF, 199 1 ), based on the blebshaped texture (Fig. 2f). Pyroxene crystals am welI equilibrated, but plagio- clase crystals retain normal compositional zonation. Whitlockite in this sample ranges up to 700 pm grain size (Fig. 2f). We refer to this lithology as quartz monzodiorite in keeping with previous usage re- garding lunar samples that have a similar assemblage. However, ac- cording to the classification of STRECKEISEN ( 1976), “quartz mon- zogabbro” is more appropriate because it has plagioclase An content > 50. We consider this sample to be a pyroxen@phosphate cumulate on the basis of texture and bulk chemistry. It has a pseudoeutectic mineral assemblage, yet it is far richer in pyroxene components than a pseudoeutectic liquid (JOLLIFF, 1991). Rased on the coarse grain size of pyroxene, plagioclase, and whitlockite, we do not believe the mineral mode of this sample is necessarily representative of a larger rock or of the parent liquid.
CRYSTAL CHEMISTRY
A brief review of the crystal chemistry of lunar apatite and
especiahy whitlockite is provided in support of our procedure for handling phosphate compositions and to provide a framework for understanding the substitution of REEs in the phosphates. An early summary of occurrences, forms, and chemical compositions of lunar phosphates was given by FRONDEL ( 1975). Lunar apatite is compositionally similar to terrestrial fluorapatite. Chlorine concentrations are sub- ordinate to fluorine, but are significant, and there is no evi- dence of a hydroxyl component in lunar apatites. Lunar whitlockite, on the other hand, has very low fluorine and Cl concentrations at or below the detection limit in this study.
Lunar whitkv&ite is generally too fine grained for structural determinations by routine single-crystal X-ray diLlYaction, and there are no detailed structural refinements to date. Limited X-ray data on lunar whitlockites are consistent with the me- teoritic whitlockite structure (GAY et al., 1970; FUCHS, I97 I ; FRONDEL, 1975), so we rely on structural refinements of whitlockite in meteorites. PREWITT and ROTHBARD ( 1975) determined the structure of whitlockite from the Estacado

REE-partitioning in lunar whitlockite and apatite 4017
Table 4. FJndmemhers and substitutions for REE3+ in lunar whitlockite. Sk cl(B) *Mg-sitC P-Sit6 -on S-amrd odahedd irregcct. tekkdml
multiplicity 18 2 2 14
w~w.3=)
ca-wlliuockitc c-m (M&WW %Ol PI4
REE-WhiUOCkit~ ~E2~16 (M&FW)z 02 PI4
Na-WhiUOd& Qll (M&FOJ@z N+J PI4
si-mexchangc REExcal8.X C&R&W2 %Ql Sixh4.x
meteorite, and DOWTV ( 1977) refined whitlockite from Angra DOS Reis; the following discussion of whit&kite crystal structure is based on their work.
The main Ca sites in whit&kite are eight-coordinated, similar to those in apatite. There are eighteen such sites per fifty-six oxygens, and we refer to these as Ca( B) sites (Table 4). Sites designated “Mg” and Ca( HA) are six-coordinated, and there are two of each per fifty-six oxygens. The “Mg” site.is smaller than Ca( B) sites; thus, the presence of Mg, Fe, or Mn in this site stabilizes the structure relative to CaZl (PO&,. Substitution of these smaller cations into Ca( B) sites may occur, but less favorably by analogy with apatite, which has similar general Ca sites but no specialized, small octahedral sites. In the whitlockite structure, stoichiometry restricts the Ca(IIA) site to 50% occupancy if filled by Ca, but greater if there is Na20_,Ca_, substitution. The Ca( IIA) site is irregular and energetically less favorable than Ca( B) sites for Ca and other cations with charge > 1 for the following reasons: ( 1) repulsion of P and Ca across a shared face be- tween the PO4 tetrahedron and the Ca( IIA) octahedron; (2) the Ca( IIA) octahedron is distorted toward a trigonal prism, which is less stable than a regular octahedron: and (3) 50% occupancy of the Ca( IIA) sites causes local charge imbalance.
Several substitutions in natural whitlockites should increase the stability of the structure relative to calcium-whitlockite. One is 2Na+ for Ca*++Cl( NazO_,Ca_,) on the Ca( IIA) sites (CALVO and &PAL, 1975; DOWTY, 1977). This reduces the charge repulsion across the shared polyhedral face and in- creases the percentage of Ca( IIA) sites that are filled. Another is REE3+ substituting for Ca*+ in the eight-coordinated Ca( B) sites coupled with a vacancy in Ca(IIA) (ClREE2Ca-3; see DOWTY, 1977). Two trivalent cation substitutions are re- quired for charge-balance of one vacated Ca(IIA). Charge- balance by creation of a vacancy in Ca( IIA) competes with the substitution of Na+ in Ca( IIA) sites. In this paper, we treat the Ca( IIA) site as being occupied mainly by Ca or Na; however, recent experimental results indicate significant oc- cupancy of Ca( IIA) sites by iron as well ( COBON and JOL-
LIFF, 1993a,b). When calculated to cations per fifty-six oxygens (Table 2))
tetrahedral cations P + Si sum to within 1% of the ideal fourteen per formula unit, which is within the analytical un- certainty of phosphorus measurements. For the purpose of modelling the substitution reactions of REEs in whitlockite, we assume that there are no tetrahedral site vacancies and that stoichiometric error in the analyses results mainly from errors associated with determinations of PZOs concentrations. An average adjustment of 0.3% P205 (0.7% relative) brings the average tetrahedral cation sum to 14.00 (also see caption
to Fig. ~),..M$KAY et al, ( 1987) made a similar correction, normalizing the sum of P + Si to 14.
Charge-balancing Substitutions in Natural Whitlockite
Using constraints on stoichiometry suggested by PREWITT
and ROTHBARD ( 1975) and DowTY ( 1977), we interpret the major charge-balancing mechanism for REE3+ substi- tution to be vacancy in Ca(IIA) sites (Fig. 3), consistent with findings of MCKAY et al. ( 1987). Whitlockites in this study have REE concentrations ranging from about 1.2 to slightly over 2 REE atoms per fifty-six oxygen atoms (Fig. 3). At the level of 2.0 REEs per fifty-six oxygens, at least 1.7 REEs (i.e., -85%) are apparently balanced by vacancy in Ca( IIA) sites (by inspection of Fig. 3). This involves mainly calcium and sodium, such that there is a decrease in Ca + Na in Ca(IIA) with increasing REEs if we assume that Ca( B) sites remain filled at eighteen Ca + REEs per fifty-six oxygens. Lunar whitlockites that have the lowest REE con- centrations have up to 0.5 atoms of Na per fifty-six oxygens. The fact that Na concentrations approach zero near 2.0 REEs per fifty-six oxygens suggests that Na is strongly ordered in Ca( IIA) sites. Substitution of up to -0.2 Si atoms (per fifiy- six oxygens) for P provides additional charge balance.
Another potential charge-balancing substitution is related to Mg, Fe’+, and Mn. Although COLSON and JOLLIFF ( 1993a) report no significant contribution from magnesium-site va- cancy, we consider the possibility that some small amount of vacancy might occur on the “Mg” site as an additional, although minor, charge-balancing mechanism for REE sub- stitution.
SATURATION OF REE SUBSTITUTION IN WHITLOCKITE
In this section, we consider the thermodynamics of REE substitution in lunar whitlockite, and we develop a model for the equilibrium distribution of REEs between whitlockite and a system of coexisting melt and crystals. The distribution coefficients for the REEs in whitlockite are dependent on both saturating and nonsaturating substitutions.
Substitution Theory
In lunar whitlockite, the REEs cannot be considered as trace elements. Thus, even if components mix ideally, the REE partition coefficients will not be constant, and variations must be related to true equilibrium constants for melt-whit- lockite reactions involving the REE. We define three general types of substitution reactions that may occur when a REE r ’ replaces Ca*+ or some other cation in whitlockite: ( 1) coupled substitutions involving vacancy on a cation site; (2) coupled substitutions involving charge-balancing cations; and ( 3 ) coupled substitutions involving charge-balancing anions. One example of the first case, and overwhelmingly the most favor- able of all REE substitutions in lunar whitlockite (Down, 1977; MCKAY et al., 1987), is substitution of REEs coupled to vacancy in Ca( IIA) sites, represented by Eqn. la. Vacancies in Ca( IIA) sites are shown explicitly, and the form ofthe whit- lockite component shows site assignments as in Table 4. No-

4078 B. L. Jolliff et al.
2.4
2.2
v) 2.0
5
g
1.6
1.6
% 1.4
z 1.2
a 1.0
-+ E 0.6
9 0.6
0 0.4
0.2
0
l Mg+Fe+Mn atoms
v REEbalawadby Ca(llA) vacancy
+ Naatorns 0 siatoms
I Shersottv Meteorite
0 0.4 0.6 1.2 1.6 2.0
REE (Ln + Y) per 56 Oxygens
FIG. 3. Plot of variation of parameters related to substitution of REEs in whit&kite with the number of atoms per fifty-six oxygens. Points are based on EMP data, but full REE concentrations were calculated using interelement REE ratios for each sample as determined by IMP. In order to calculate cation proportions for this diagram, individual analyses were “adjusted” for tetrahedral cation excess or deficiency by changing the P205 concentrations to give exactly 14.000 Ps+ + Si’+ cations per fifty-six oxygens. This is based on the assumption that deviations from stoichiometric tetrahedral-cation occupancy result primarily fkom analytical error and are not involved in RAZE charges-balance. Triangles represent the number of REE-atom substitutions that can be balanced by charge deficiency due to vacancies on Ca( IIA ) sites, which result from decreasing concentrations of Ca and other cations on those sites. Given the assumptions that tetrahedral-site occupancy is stoichiometric and that there are no significant REE charge-balancing substitutions other than the ones mentioned in the text, the triangles represent maximum values. Site assignments used to calculate vacancies on Ca( IIA) are as follows: REE are assigned to Ca( B) sites; Mg + Fe + Mn are assigned to “Mg” sites; Mg + Fe + Mn in excess of two per fifty-six oxygens are assigned to Ca( B) sites; Ca is assigned to Ca(B) sites to bring the number of cations in Ca( B) sites to eighteen per fiffy-six oxygens; Na and remaining Ca are assigned to Ca( IIA). Note that the increase in REE balanced by Ca(IIA) vacancies matches the increase in REZs per fifty-six oxygens nearly one for one. Lines are fit by linear regression of the data; extrapolations of the regression lines suggest a potential relationship to the site occupancies of REE-poor whit&kite from the Shergotty meteorite (LUNDBERG et al., 1988).
tations used throughout the remaining text are summarized in Table 5. We use Nd 3’ to represent any individual REE 3+.
2Nd&,,, + (Ca,*)(Mgz)(Ca,O,)(P14)056
= 33 kltj + (Nd2Cal6)(Mg2)(02)(P,4)056. (Ia)
By this reaction, there can be only two REE’+ per unit cell because there can be only one additional Ca(IIA) va- cancy. A similar reaction could be written considering two Na+ in the Ca( IIA) sites. Below, we treat the Ca-Cl and Na- Na components as being thermodynamically equivalent with respect to substitution by REEs plus vacancy.
First, we consider only the Ca( IIA) vacancy substitution (in its simplified, Eqn. 1 b version); later, we expand the model to account for substitutions in addition to those involving the Ca( IIA) site. For convenience in deriving the equation for the distribution coefficient for this substitution, DNda+,
we use the following condensed form of Eqn. la, where Whit ( Ca2+ ) and Whit ( Nd 3+) represent the whitlockite end- members indicated in more detail in the original form of the equation, and for convenience, we consider quantities cor- responding to one half of a formula unit:
Nd:Lelt, + Whit(Ca’+) e 1.5Ca:Z,,,, + Whit(Nd3+). ( lb)
From the expression for the equilibrium constant,
& = (aWhit(Nd’+) ’ a~~2’,,,,,)/(aWhit(CaZ+) . aNd3+.me& (2a)
we obtain the activity ratio for Nd3+ in the solid to that in the melt. We further assume that the u,-~z+,~~~~ is roughly con- stant and set 1 /c, = ~~~~~~~~~~~~~~~ as follows:
We approximate activities by mole fractions (see the def- inition to follow), then multiply by l/c2 to convert from mole fractions to mass fractions, e.g., pg/g, as customarily used in distribution coefficients. The quantity q will vary as the molecular weight of whitlockite changes with substitution of REE 3+ for Ca2+, but the change between lunar endmember Ca-whitlockite [ Whit( Ca”)] and typical REE3+-substituted lunar whitlockite [Whit(REE3+)] is only 6%, and that in expected coexisting melt is less, so we ignore them for the present.
QWhit(Nd’+)/uNd’+.melt = XWhit(Nd3+)/XNd3+,mell
= ( 1 /c2 ) CNd'+,whit / CNd’+,melf , and ( 3 )
D S,Nd3+ = CNd3+,whit/ CNd’+.melt zs CIC&e&Whit(Ca~+), (4)

REE-partitioning in lunar whitlockite and apatite 4079
Table 5. Notation used in text.
whit(ca2+) Whit(Nd3+)
0
%
c2
c3
%G+#Kn
“Nd’+,,nclt
“Whi,(&+)
aWhi,(Nd3+)
%.REE3+
fNd3+
iv T.REE3+
xNd3+,,
xmEw)
xwh,(?id3+,
G,d,@+)
cNd3+,whil
CNd%&
‘Nd3+,T
D S.Nd’+
D O.S.Nd’+
D~,~d-‘+
r,
a
b
convzrsion factor, mole to mass units
wavelsionfbctor,activitytomassanits
a&ity ofCa2+ in melt
a&ityofN&+ in melt
activity ofca,~(cao)rJ,40,
aaivity of~~~&$&P~~o~
mm&rofREEatomsperMozqgeasin whitkckite, inaqoratedby ca@A)- vacancy-,ekted substitution
fmztion of Ns,REEw that is Nd3+
total number of REE atoms per 56 oxygens in whitlockite
mole fraction ofNd3’ in melt
mokt?actionofREE-substituted whitlockitc related to Ca@IA) vacancy, = ~s.w~
mole fraction of Nd-s&stitated whitkckitc related to Ca(IIA) vacancy, = Ns,REE&2 . (moles Nd3+iDnoks REE3+)
mok fixtion Ca,sMg2(CaO)P,40,6 = 1 - Ns,REe,+n
weight conccntrstion N#+ in whitkckite
weight concentration Nd3+ in melt
weight amoxmation Nd3+ in system
weight distribution coe&knt for Nd3+ specificauy for satluating ca(m) vacancy- related substitution in whitkclcite
D s Nd~ at low REE concentration
portion of bd3+ from nonsahuating substitutions in whithxkite
total 4ud3t at low REE concentration
= Do.s,Nd3+ + DN.Nd3+
Ds,t.‘d3+ + DN.?fd” DNd3+, apatite/melt
Z[&d~Mto. wt. fraction mineral(i)] in whole-rock
Caction of solid in a system
D,,s,N,,l+ b+'hhbi%te) I&$+,,
DNzr& (WhitiOCbte) 1 DNdsm
where the subscript ‘3” refers to this particular (saturating) substitution and distinguishes expressions of N (number of REEs per fifty-six oxygens) and D for this substitution from those of nonsaturating substitutions, discussed later.
We will consider REE’+ substitutions involving vacancies on the Ca( IIA) site in terms of two components in order to define mole fractions, which we will assume to model activ- ities, as follows: (1) (Ca,s)(Mg2)(Ca,0,)(P,4)056, and (2) (REEKa,,)(M&)(Oz)(P,4)O~~. Component (2) is defined as the combination of individual REE components [e.g., ( Nd2Ca16)( M&)(q)( P,4)Os6] in Whatever proportions they occur. This enables us to obtain the mole fmction of com- ponent ( 1) in terms of the number of REE3+ incorporated by this substitution. Thus, by inspection, the mole fraction ofcomponent (2) is Ns,REE3+/2 (note that N~~~~3+/2 isequal to vacancy in Ca(IIA) in excess of 1); and that of ( 1) is 1 - Ns,REE1+/2, where Ns,REE~+ is all REE3+ per fifty-six ox-
ygens incorporated by this substitution, not just Nd 3+. Thus, Xwhil(az+) s 1 - Ns,m~3+/2 and Xmi,(Nda+) = Ns,w3+/2* moles Nd3’/C moles REE3+ = fNd3+(NsREs3+/2). We define Do,s,Nda+ as the value of DS,Nd3+ in whitlockite at very low REE concentrations (as Xmi,(mE3+) + 0). Thus, substituting
( 1 - Ns,REE3+/2) for ami,(az+) in Eqn. 4 and remembering
that as Ns,REE~+/~ + 0, &,N,P+ + Do,s,N~~+,
&.Nd'+ = Do,s,W+( 1 - Ns,REE”+/~)- (5)
Note that for this substitution, as the number of vacant Ca( IIA) sites increases and the value of NS,REE~+ increases, the VEhle Of &.&+ decreases. As WhitlOCkite becOIIlt?S Sat-
urated in the ( REE2Ca,,)( M&)( Cl&P,4)056 component, the V&Ii? of Ds,N&+ + 0. It is because of this saturation effect that at high REE3+ concentrations, a significant fraction of REE 3+ in whitlockite comes from other substitutions.
Vacancy-coupled substitutions might occur in whitlockite involving vacancy in cation sites other than Ca( IIA). Aqua- tion 6 is an example of such a substitution, in which the vacancy is in an “Mg” site. In Eqn. 6, Mg2+ or other cations in “Mg” sites are replaced by vacancies and coupled with REE3+ substitution for Ca2+ in Ca(B) sites, as follows:
4Nd&, + (Ca,s)(Mg2)(Ca,U,)(P,4)0% = 4Ca$&
+ 2Mg:L) + (%Ca,4)(@z)(Ca,n,)(P,4)056. (6)
Substitution of four REEs in Ca( B) sites per fifty-six oxygens could be balanced by vacancies in both “Mg” sites. Thus, saturation of this substitution would occur only at substan- tially higher REE’+ concentrations than those encountered in lunar whitlockites, so we ignore the effects of saturation of this substitution when we consider its contribution to REE3+ D values.
Other classes of charge-balancing substitutions do not re- quire formation of vacancies in the whitlockite structure. For example, the REE3+ can pair with a cation, such as Na+ (Eqn. 7), or with a (Si04)4- that replaces a (P04)3- (Eqn. 8 ) , as follows:
Nd:&, + Na fmc,,) + (Ca,8)(Mgz)(%O,)(P,4)Osa
= 2Ca$& + (NdNaCa,,)(Mg2)(Ca,n,)(P,4)056, (7)
or
Nd $L,) + SiOL,,, + (Ca,,)(Mg,)(Ca,&)(P,,)Os6
= Ca?L) + PO:&,,)
+ (NdC+)(M&)(Ca,O,)(SiP,3)056. (8)
Neither of these substitutions approaches saturation at REE concentrations typical of lunar whitlockite.
In considering how each of these substitutions contributes to the incorporation of REE in whitlockite, we assume that interactions among the different whitlockite components are ideal. Thus, because none of the substitutions in Eqns. 6-8 saturate in the REE concentration range of interest, we treat

4080 B. L. JoJlifF et al.
them with a single, independent, and constant D value, which we refer to as &,Nd3+ (“N’ = nonsaturating).
We consider now the incorporation of REE 3+ in whitlockite by the following two groups of substitutions: ( 1) those related to Ca( IIA) vacancy, strongly affected by saturation; and (2) those not affected by saturation over the observed REE con- centration range. In the following model, we derive an equa- tion expressing DSsNda+ (for any individual REE3+, Nd3+ being the example) in terms of the total REE3+ concentrations in whit&kite and the relative values of Ds,~~J+ and D N,Nda+. Our best estimate at present is that the saturating reaction, ClREE2C& (Eqn. 1 ), in which a vacancy is pro- duced in a Ca( IIA) site, is responsible for about 93% of REE substitution in whitlockite at low concentration, and the nonsaturating reactions together account for the remainder. These proportions are estimated by ~rn~ng &,Nd’+.wUt
values caiculated as a function of the concentration of REEs in whit&kite to those observed experimentally (MCKAY et al., 1987; COLSON and JOLLIFF, 1993a,b). The expression for the effective &,Nd’*,whi$ value at given concentrations of REE3+ in whi~~kite is derived from Eqn. 5 and additions equations given below, in which the activity of REE3+ in whitlockite associated with the saturating substitution is Ns,aEE3+/2, the mole fraction of the REE-whitlockite com- ponent related to vacancy in Cat IIA ) (as defined previously in Eqn. 5: Ds.Nd 3+ = Do.s.Ndf+( 1 - fiS.REE3+/2)):
D T.Nd’+,whit = &,Nd’” f DN.Nd”+. (9)
We can also write Ds,Nd a+ as the concentration of Nd3+ as- sociated with Ca( IIA) vacancies, Cs&#+, divided by the con- centration of Nd’+ in the melt. The concentration Cs,$.&‘+ is proportional to f&+( Ns,~~~3+/2), where fNd’+ is the fraction of Ns,aEE3+ that is Nd3+, as in the following.
D S.Nd3+ = fNd3+(%.REE3*/2 )/&?d3+,mei, + c3 3 and (10)
DN,N~‘+ = fNd3’tNT,REE3’/ 2 - Ns,REE~*/~)/~N~~+,~~I~ . c3.
(11)
Here, NT,REE~+ is the sum of REE atoms per fifty-six oxygen in whitlockite resulting from all substitutions, and q is a constant that converts from mole fractions (used to approx- imate activity) to mass fractions.
By solving Eqns. 5, 10, and 11 in terms of NT,REE3+ and chosen relative values of DN,Nd3+ and &.s,Nd’+, we can cal- culate the value of DT,NdS+,whit for Nd3’ and each individual REE3+ at given total REE3+ concentrations in whitlockite.
This is done by first solving Eqn. 11 for aNd’+,m&, giving
aNd’+,melt = fNd3+tNT,RW+/2 - NS,REE’+/~)/L)N,N~~+ . c3.
(12)
Substituting for aNd’+,m& in Eqn. 10 yields
&,Nd3+ = (&,REE’+/~ ’ DN.Nd3+)/
(NT.REE~+/Z - &,REE~+/~). (13)
We can solve directly for NsREE3+f 2 by combining Eqns. 5 and 13 and rearranging to give quadratic Eqn. 14:
Ns.REE~+/~ = ((Do.,,, 3+ + Do,s,Nd’+NT,REE3+/2 + DN)
- [L%S,Nd”‘( 1 - NT,REE3’ + N+,R&+f4)
+ ~,Nd3+(~N.Nd3+ + &,s,W+ NT,REES+
+ ~~0,S,Nd~+~~“2}/~~0,s,Nd’+. (14)
In the derivation of these equations, we assume that different REE components, e.g., Nd(whit) and Sm(whit), mix ideally relative to these component definitions. Thus, Eqn. 13 de- scribes how D s,Nd’+ values vary as a function of total REE concentration given that each REE has a unique D value.
Figure 4 shows values of &,Nd-‘+,whit cakulated for different pro~~ons of saturating to non~t~ting REE su~~tions. The distribution of experimental data is consistent with 90- 95% saturating [ Ca( IIA) vacancy-related] and 5- 10% non- saturating substitutions at low REE concentrations. Our re- cent experimental data (COL.SON and JOLLIFF, 1993; B. L. Jolliff et al., unpubl. data), combined with those of MCKAY et al. ( 1987), indicate DO.S,Nd 3+:&,N@+ Of 93:7. These pro- portions differ slightly with trends inferred from measured compositional variations in the lunar samples. For example, at two REEs per fifty-six oxygens, the lunar samples indicate that about 85% or more of the REEs are associated with vacancy-related substitution (&$Nd’+); however, the exper- imental data indicate about 77% at two REEs per fifty-six oxygens (corresponding to 93% as REEs per fifty-six oxygens approach zero ) .
In order to model c~stal-liquid equilibria involving whit- lockite, we combine the expression for &,Nd3+,whit (i.e., DS,Ndj* + DN,Nda+) with the equation for mass balance during equilibrium crystallization (e.g., Eqn. 4.23 ofHASKIN, 1984) to obtain Eqn. 15, using the form of Ds,Nd3+ from Eqn. 13. (A similar derivation can be made for su~ace~quilib~um fractional crystallization; see, e.g., Eqn. 4.22 of HASKIN,
_, 0 0:4 0:8 1:2 116 ’ ; ’ 2:4 ’ 218 ’
Z REE per 56 Oxygens, Whitlockite
FIG. 4. Variation of D( Nd) total, whitlockite/melt, as a function of REE concentration in whitlockite. Proportions reflect the initial (iow~n~n~tion) ratio of REES contributed by the saturating (L&) and no~tumting (&) su~titution mecbanist&. Experimental data are from MCKAY et al. ( 1987 1. Due to the contribution of B., . REEs . I ..,
can enter whit&kite at levels above two atoms per fifty-six oxygen* (see text).

REE-partitioning in lunar whitlockite and apatite 4081
Table 6. Coexisting wbitlockite and apatite in 14 16 1. 14161,7xxx ,7044 ,7233 ,7264 ,735o ,7373
Gabhr+ ITE-rich Monzo- Mg- Wbit- Norite MltRk Gabbm Anoltb QMG
WhitlockitefApatiteconcentrationratioa
P 1.05 1.08 1.06 1.04 1.05 Si 0.77 0.30 0.57 0.80 0.42 Fe 2.5 1.6 2.6 4.0 3.7
MS 25 18 16 39 32 ca 0.74 0.75 0.74 0.72 0.76
Na 14 11 7 34 17 Y 54 13 12 21 20 La 60 14 14 31 22 Ge 58 13 13 29 22 R 51 12 13 25 21 Nd 51 13 12 24 21 Sm 48 11 11 20 20 ELI 13 8 5 9 8 Gd 43 11 10 17 19 Th 42 10 9 17 18
Dy 48 12 10 18 18 Ho 46 11 11 19 19 Er 47 11 11 20 18 Tm 43 10 11 18 17 Yb 39 10 11 18 17 Lo 33 11 13 19 18
4.6 4.9 5.0 3.0 3.4 4.0
6.6 3.9 1.7
5.9 4.5
LaNhwh/Ap 1.6 1.4 1.3 1.3
1984). In Eqn. 15, DNds+,WR is the weighted D value for the entire mineral assemblage, as follows:
C Nd’+,whit = (&,Nd 3+ + DN,Nd)+) CNd3+.T/
(1 - fs + DNd’+,w&. (15)
k%illSe the Value Of &,Nd 3+ (a factor in &P+,WR) Varies as a function of CNd’+,whit, we solve Rqn. 15 iteratively. An initial
estimate of Ds,,M3+ is made from which CNd”+,wir is calculated from Eqn. 15 by constraining the total system concentration Of REE (CN@+,r) t0 a set VahIe. Then a new estimate Of &,Ndf+ based On this CN&+,,,,,,it is CakXllated from EqnS. 13 and 14. This procedure is iterated until the difference between new and previous Ds,N&+ is negligible.
Given the expressions for calculating an effective distri- bution coefficient for Nd3+ in whit&kite, we now extend them to distribution coefficients for the other REE3+ and those for the REE3+ in apatite as inferred from measured natural whitfockite/apatite REE’+ concentration ratios (Ta- ble 6 ) . Specific &,r,N,j X+ values and those of other REE 3+ for whitlockite are determined from experimental data for whit- lockite and are listed in Table 7. The D~,T values for whit- lockite are based on combined experimental data of MCKAY et al. ( 1987) and COLSGN and JOLLIFF (1993a). Specific D
values were determined for La, Nd, Sm, and Yb, and those for the other REEs were determined by interpolation. The Sm/Yb ratio from these combined experimental data is -3, in agreement with that found by MURRELL et al. ( 1984).
We estimate values for &‘+,amt from the values of Dr,Nd”+,whit and observed concentration ratios (whit&kite/ apatite) in the lunar samples (Table 6). The values of con- centration ratios vary depending principally on the extent to which whitlockite approaches saturation of vacancies in the Ca( IIA) site in response to REE3+ substitution, as described in the preceding text. If we divide the distribution coefficient of whitlockite (see Eqns. 5 and 9) by that of apatite, we obtain Eqn. 16a:
c Nd)+.whit / CNd3+,apaf = Do,s,W+( 1 - %,~~~~+/2)/DNd~+,apm
+ DN,Nd)+ / DN@,apat . (16a)
Equation 16a is linear with two constants, a ( = Do,s,Nd3+/ DW+,apad and b ( =&,Nd’+/l)Nd3+.apat).
C Ndj+,whit / CNd)+,apat = a( 1 - NsREE3+/2) + b. (16b)
Table 7. Lunar phosphate distribution coeflicients (weight). rareealihek!memt Y La Ce Pr Nd Sm Eu Gd Tb Dy Ho Er Tm Yb Lu DWhitlockite(1) 3.2 4.8 4.85 4.9 4.95 5 2 4.5 4 3.6 3.2 2.7 2.2 1.6 1 D Whitlockite (2j D(0) whit, low concen. (3) Dc,T Whit **+* DN whit (see text) Wb&p Avg(l4161,7xxx) WhlAp Avg. an&d, norm Sm Wh&, wt!d Avg. amoothed
D(O,whitwap~), Avg (4) D Apatite, Av8 (5) D Apatite, high (6) D Apatite, low (7) D Apatite (8)
8.6
14.4 21.5 22.7 23.7 0.98 1.46 1.54 1.61 23.8 28.2. 27.0 24.4 0.96 1.29 1.23 1.14 22.3 30.0 28.4 26.5
57 77 73 68 0.25 0.28 0.31 0.35 0.50 0.59 0.65 0.72 0.13 0.15 0.16 0.17 3.20 2.50 3.10 3.75
9.5 9.5 9.5 9.5 9.5 2.6 11.4 10.5 9.5 8.6 7.7 6.7 5.8 5.0 26.0 26.5 22.3 20.0 17.6 15.2 12.8 10.4 8.0 6.0 24.5 24.9 3.2 22.1 19.8 17.4 15.0 12.6 10.2 7.8 6.0 1.67 1.69 1.50 1.35 1.18 1.02 0.86 0.69 0.53 0.41 24.2 22.0 8.6 20.0 19.2 21.2 21.2 21.4 19.8 21.0 18.8 1.08 1.00 0.45 0.95 0.96 0.96 0.96 0.96 0.93 0.90 0.88 25.0 23.2 10.5 22.1 22.2 22.3 22.3 22.2 21.5 21.0 20.3
64 60 27 57 57 57 57 57 55 54 52 0.38 0.42 0.12 0.39 0.35 0.30 0.26 0.22 0.19 0.15 0.12 0.78 0.86 0.20 0.81 0.71 0.62 0.53 0.44 0.37 0.29 0.22 0.19 0.21 0.10 0.20 0.18 0.15 0.13 0.11 0.10 0.08 0.07 4.50 5.40 1.10 4.00 3.75 3.50 3.20 2.90 2.60 2.30 2.00
D Apatite (1) 1.00 1.10 1.13 1.15 1.18 1.20 1.19 1.16 1.13 1.00 0.88 0.75 0.60 0.45 **** Low-comzmmtion D values naed in this paper: from McKay ef al. (1987) and Jolliiet aL (in prep.). (1) Murrell et al. (1984), 4 Sm, Y, Yb detemined, others interpolated. (2) Dickinson and Hem (1983), Ce, Sm, Sr (proxy for Eu), Gd, Yb de&mined, others interpolated. (3) McKay et al. (1987). low conomtmtion; Nd, Sm, M dekmined, HREEa interpolated, LREE slope baaed on (1). (4) Average whitlcckite/apatite D(REE) ratios, adjusted for aatnraticn effecta in wbitlockite. (5) Apatite D values: D(apat) = D(S+N,whit,Avg) I average whiffapat comentmtion ratio. (6) Apatite D values: D(apat) = D(S+N,whit) I whitkpat comentmtion ratio, averagxi for ,7233 & ,7264. (7) Apatite D values: D(apat) = D(S+N,whit,7044) I whitkpat concentration ratio in ,7044. (8) Watson and Green (198 l), tholeiitic a&&e, 112O”c, dry.

4082 B. L. Jolliff et al.
We now consider the ratio of the ratios for Nd3+ to those for Yb3+ (as another example REE 3+), as follows:
CNd)+.whit / CNdl+.apat = a( 1 - &.REE’+/2) + b
c Yb”+,whit / cYb3+,spat a’( 1 - Ns,R@+/2) + b’ ’ (17)
There are two conditions under which the left-hand ratio in Eqn. 17 might be constant with changing Ns,Rzrs+. The first is that b and b’ are negligible relative to a( 1 - NS,REE3+/2) and a’( 1 - N~,~~~a+/2), which is roughly true as long as the extent of the approach to saturation is not great. The other is that a /a’ = b/b’, which will be the case if the shapes of the curves for &Nd’+ and for &%@+ vs. REE atomic number are the same. We expect them to be the same because, re- gardless of how REEs are charge-balanced, all REE3+ sub- stitutions are believed to be on Ca(B) sites. Thus, whatever changes may arise in concentration levels in whitlockite or in concentration ratios between whitlockite and apatite, the changes in concentration ratio for one REE3+ are propor- tionally the same as for any other REE3+; i.e., the shape of the REE pattern of whitlockite/apatite concentration ratios should remain constant. This occurs because the factor ( 1 - NS,REE3+/2) affects all REE3+ equally. In fact, the shapes of the curves (concentration ratios) for the phosphates are closely similar (Fig. 5).
To estimate Values Of DNd)+,amt, we made use Of this Sim- ilarity. We weighted the shapes equally for all five samples by normalizing each set of ratios to its Csm’+,whit/Csm’+,apa ratio, then took the average. We then used these average val- ues in Eqn. 18 to obtain the set of &@+,apal (and other REE’+ ); Eqn. 18 is equivalent to Eqn. 16, rearranged as fol- lows:
D Nd’+,apat = [Do,s,Nd’+( 1 - Ns.REE~+/~) + DN,Nd’+ 1
* CNd3+.apat/CNdf+,whit- ( 18)
La Ce Pr Nd SmEuGdTb DyHo Y ErTmYb Lu
Rare Earth Elements
FIG. 5. Plot of concentration ratios of the REEs in whit&kite relative to coexisting apatite. Note that patterns are not perfectly flat, reflecting differences in the REE distributions in apatite and whit- lock&e, especially Eu. Although Eu concentrations are higher in whitlockite than in apatite, Eu is not as strongly favored as the trivalent REEs in whit&kite relative to apatite.
Calculated in this way, REE D values for lunar apatites are low, indicating that REEs are mildly incompatible with respect to lunar apatite. The calculated D values range from 0.3 (La) to 0.4 (samarium) to 0.1 (Lu) (Table 7), lower by a factor of 10 or more than the lowest reported D values for terrestrial apatite (tholeiitic andesite; experiments of WATsoN
and GREEN, 198 1) . Our calculated average values are about one-third to one-fourth lower than those reported by MUR- RELL et al. ( 1984) for meteoritic phosphates (Table 7).
Both the low apparent REE3+ D values and the variation in apparent REE 3+ D values of apatite in these natural sam- ples can be explained in terms of known apatite partitioning relationships. The lower-than-experimental values are con- sistent with the relatively high temperatures of magmas ex- pected because of the absence of water in the lunar environ- ment. WATSON and GREEN ( 198 1) found that mean REE 3+ D values for apatite in terrestrial rocks were higher at lower temperatures and in more silica-rich compositions, ranging from 3-30. An increase in D with decreasing temperature is typical of elements compatible in a phase because compati- bility typically reflects a negative enthalpy of reaction. Pre- suming that silicon provides charge-balance for most of the REE3+ in apatite (analogous to substitution in whitlockite; see Eqn. 8), we also expect a positive dependence of REE3+ D values in apatite on SiOZ concentration. In addition, REE3+ partitioning values reported by MURRELL et al. ( 1984) cor- relate positively with Cl concentrations in apatite, suggesting that other compositional parameters may also affect REE3+ partition coefficients between apatite and melts and that an- ions may be important in the charge-balance of REE’+ in apatite. Both the dependence of apatite REE’+ D values on phosphorus and silicon activities (analogous to Eqn. 8) and potential dependence on halide activities make apatite REE 3f D values more sensitive to melt composition than whitlockite REE3+ D values, as MURRELL et al. ( 1984) concluded.
Unlike whitlockite, however, the partitioning of REEs be- tween apatite and coexisting melt does not appear to be de- pendent on REE concentration (WATSON and GREEN, 198 1) . Thus, as the concentration of REEs in whitlockite approaches saturation of the principal substitution at high REE concen- trations, the ratio of distribution coefficients of REEs between coexisting whitloclcite and apatite (whitlockitelapatite) be- comes lower even if both phosphates crystallize at the same time (Fig. 6 ) .
Values of L)N,Nd 3+ ( for the nonsaturating REE substitution component) in whit&kite appear to be low and of the same order of magnitude (within a factor of 2-4) as &d3+ Ofapatite (Table 7). This is expected if the nonsaturating substitutions in whitlockite are similar to those in apatite, i.e., if substitution is on similar crystallographic sites and charge-balance is achieved the same way in both minerals. The similarity of D values suggests that the coupled substitution of REE’+ + Si4+ for Ca’+ + P5+ operates in both minerals at a similar magnitude.
In this paper, we have modelled the variation in DT.Nds+,whit (and other REEs) as a function of REE concen- tration; in the following section, we apply the model to explain observed REE concentrations in whitlockite and distributions between natural lunar phosphates. Part of that exercise re-

REE-partitioning in lunar whitlockite and apatite 4083
Lunar Phosphate D Ratios
0 0.4 0.8 1.2 1.6 2 2.4 2.0
Z REE per 56 oxygens in whitlockite
FIG. 6. Model variation of average REE concentration ratios (whitlockite/apatite) as a function of the total REE concentration in whitlockite, using Nd and Yb as examples. This shows that despite large differences in whitlockite/apaGte concentration ratios, the rel- ative shapes of the whitlockite and apatite REE distributions remain similar.
quires us to estimate REE3+ D values for lunar apatite. We recognize that both whitlockite and apatite D values are probably dependent on temperature and compositional pa- rameters other than REEs, but these are not modelled. How- ever, we believe the first-order variations in the distribution of REE between lunar phosphates can be understood in terms of the saturation effect in whitlockite, the equilibrium dis- tribution of REEs between whit&kite and apatite, and the relative proportions of phosphates in crystallizing assem- blages. We now describe the REE distributions between phosphates in the Apollo 14 samples and then apply our model for whitlockite REE partitioning to explain the REE distributions in the rocks.
APATITE AND WHITLOCKITE CHEMISTRY
Concentrations and Relative Distributions of REE in Whitloclcite and Apatite
The concentrations of REEs in all whitlockites analyzed in this study are high, ranging from -9 to over 12 wt% REE oxides, i.e., 75,000-105,000 ppm REEs, a factor of I .4 (Table 2). Coexisting apatites have far lower REE concentrations, but the concentrations cover a relatively broader range, from -0.15 to 1 w-t% REE oxides or 1200-8400 ppm, a factor of 7 (Table 3). Chondrite-normalized REE distributions of whitlockite are similar to those previously reported for lunar samples: the pattern shape for the LREEs is nearly flat (La/ Srnca, = 1.3- 1.7); concentrations of HREEs are low relative to LREEs ( La/Ybcnrj = 3.0-5.0); and all samples have deep, negative Eu anomalies (Fig. 1). Distributions of REEs in apatite tend to be even flatter than those of whitlockite (La/
Sm(CN) = -0.8-1.7; La/Yb(m, = 1.8-3.1) and curved downward only slightly. Ratios of the average concentrations of REEs in whitlockite to those in apatite of the same samples
are given in Table 6 (also see Fig. 5). Patterns of REEs in the apatites are generally similar to that of apatite in 67975 (LINDSTROM et al., 1985), but unlike apatite in 15403, which has a much steeper La/Yb,c-, value of -5 (LINDSTROM et al., 1991).TheLa/YbC~N,ofaveragehigh-KKREEPis-2.1 (WARREN, 1989)) so whit&kite in all cases has significantly steeper La/Yb, and apatite has similar to variably steeper La/Yb relative to that of materials having KREEP-like ITE ratios.
The range of REE concentrations of whitlockite between different samples is greater than that of whitlockite in a given sample. Whitlockite in magnesian anorthosite ,735O has the highest concentrations, 1.9 REE atoms per fifty-six oxygens on average, but ranging from 1.7-2.05. Quartz monzogabbro ,7373 has the lowest average concentration, 1.4 REEs per fifty-six oxygens, and a range from 1.3-1.5. The range of REE variation in a given sample is best measured by EMP results for Ce and Yb. These elements are present at the level of several weight percent each, they can be measured for a spot size of 1 vs. -20 pm for our IMP spots, and we have many more analyses by EMP per sample than by IMP. For example, in Fig. 1, the full range of concentrations as deter- mined by EMP in each sample is indicated for Ce. In most cases, the range of Ce concentrations measured by EMP is similar to that covered by the plotting symbols. Measured concentrations typically span a range about twice that asso- ciated with EMP counting statistics (e.g., counting statistics are +4% for Ce). This, coupled with the correlated variations in La, Ce, and Yb, suggests that the intrasample variations are real, although small.
Such variations are important when we attempt to deter- mine the whitlockite/apatite concentration ratios of coex- isting or equilibrium whitlockite-apatite pairs. For example, in a sample with a range of REE concentrations in apatite and whitlockite, did certain ones crystallize at the same time and thus represent equilibrium pairs, whereas others resulted from crystallization during nonoverlapping intervals? Perhaps whitlockite and apatite pairs having different REE concen- tration ratios formed at the same time but are different as a consequence of local melt fractionation when small, residual melt pockets in which they formed became effectively isolated. The answers to these questions are not obvious from petro- graphic relationships and are given further consideration in a later section.
Concentrations of REEs in apatite within a given sample cover a much smaller range than the range between different samples (Table 3 ) . One exception is 14 16 1,7044, which con- tains apatites that have low REE concentrations and two dis- tinct compositions differing in REE concentrations by a factor of about 1.5. These two apatites also differ in Mg’ and F/Cl ratio; that with higher REE concentrations has higher Mg’ and lower F/Cl (Fig. 1 b). The REE concentrations of apatite in 1416 1,7264 are the highest of our samples and have in- trasample variations of a factor of - 1.25.
Zoning of REE concentrations in individual phosphate crystals as determined by EMP analyses is minor and irregular or patchy in most of the samples. For example, all of the compositional variation of sample ,735O is in the single com- posite crystal shown in Fig. 2a; however, on the basis of nearly

4084 B. L. Jolliff et al.
thirty spot analyses of that sample, there is no correlation between REE concentrations and proximity to an apatite/ whitlockite contact in our two-dimensional thin-section slice. Apatite in ,7269 is exceptional in that it is strongly zoned in REEs and halogen concentrations (see below).
Fe/ Mg Partitioning
Values of Mg’ in whitlockite are very high relative to those of apatite (Tables 2 and 3). This results from the geometry of available sites in the apatite and whitlockite structures. In whitlockite, the smaller Mg’+ ion is preferred due to the pres- ence of the small octahedral site ( FREWITT and ROTHBARD, 1975; DOWTY, 1977). In apatite, all substitution of Mg and Fe” iron must occur on the larger seven- to nine-coordinated Ca sites, so the Fe2+ ion is preferred relative to the smaller Mg2+. Thus, the consistently higher Mg’ of whitlockite relative to apatite is caused principally by these differences in site geometry and is only secondarily related to whether whit- lockite crystallkd before apatite when the Mg’ of their parent melt was higher. Petrographic relationships also do not in- dicate such a sequence of crystallization (see below ) .
Our samples show a systematic correlation in the variation of Mg’ among apatite, whitlockite, and coexisting silicates (Fig. 7). Whitlockite in all cases has the highest Mg’ and apatite has the lowest. HESS et al. ( 1990) demonstrated ex- perimentally that whitlockite has substantially higher Mg/ Fe than its equilibrium melt. They argued that apatite has about the same Mg/Fe as equilibrium melt; thus, whitlockite should also have higher Mg/Fe than equilibrium apatite, in agreement with crystal-structural constraints. In our samples, ratios of FeO/MgO(apat) to FeO/MgO(whit) range from
1.0
0.9
0.6
3 0.7
$
.c z 0.6
E 0.5
+
g 0.4
r" 0.3
0.2
0.1
0
v Whitlockite
0 0.2 0.4 0.6 0.6 1.0
Mg/(Mg+Fe) Augite
FIG. 7. Distribution of Fe and Mg between phosphates and co- existing m&c silicates. Atomic Mg/(Mg + Fe) [ Mg’] of augitc, which is present in all of the samples, is plotted along the abscissa, and Mg’ values of each of the other minerals in each assemblage are plotted along the ordinate.
1.0
0.9
0.6
0.7
+ 6, 0.5
$ 0.4
0.3
0.2
0.1
0, *,I (I,, I I I I
0.04 0.06 0.12 0.16 0.2 0.24 0.26 0.32
CI/(F+CI)
FIG, 8. Plot of atomic Cl /( F + Cl) vs. Mg’ of apatite, determined by EMP.
-7 to 10, compared to a value of 5 predicted by HESS et al. ( 1990), and a range of -2 to 20 for other reported lunar whitlockite-apatite pairs.
F/Cl of Apatites
Concentrations of F and Cl in our apatite samples are nearly stoichiometric, ranging from 0.9- 1 atom per formula unit, and there appear to be weak intrasample correlations between Cl’ (Cl /( F + Cl)) and Mg’ in several of the apatites we have studied (Fig. 8). The most magnesian sample, 14161,7350, haslowaverageCl’(O.l),andthesamplesthat have the highest Cl’ (0.3) have relatively low Mg’ values. However, in apatites of a given sample, the variation in these parameters is mainly in Cl’, not Mg’ (Fig. 8). In several sam- ples, there is a slight trend of decrease in Mg’ with increasing Cl’, (,7264; ,7373; ,7269). However, in two of the samples (,7044 and ,7069), there appear to be two populations of apatite based on Cl’, and in these, the groups that have high Cl’ have the higher Mg’ values.
In most samples, there is no correlation between Cl’ and REE concentrations. From the data in Table 3, it appears that the apatite in 1416 1,7044 that has the higher Cl’ also has the higher REE concentrations, but this correlation does not hold when we consider EMP data for additional points. There is a positive correlation between Cl’ and REE concen- trations along the length of a single apatite crystal in 1416 1,7269, which is the sample of felsite, apparently con- taining no whitlockite. In this sample, it appears that as apatite crystallized, Cl’ and REE concentrations increased. This trend was also observed in apatite in separate experiments by MURRELL et al. ( 1984), although, in that case, the variation may have reflected higher DiiEE values for Cl-rich apatites.
If sequential crystallization of the phosphates occurred, we might expect to find correlations between Fe/ Mg, F/Cl, and REE concentrations. The F/Cl ratio should decrease with progressive crystallization because the preference of apatite is for fluorine over Cl ( STORMER and CARMICHAEL, 197 1). As suggested here previously, evidence for this in our sample

REE-partitioning in lunar whitloclcite and apatite 4085
set is ambiguous. One sample that may show such a rela- tionship is the monzogabbro clast, 14 16 1,7264, wherein the most magnesian of three apatite crystals has the lowest REE concentrations and highest F/Cl ratio, as expected if se- quential crystalliition led to increasing REEs in the melt while apatite crystallized.
DISCUSSION
Whitloclcite / Apatite Partitioning of REEs
It is important to determine whether or not the phosphates were primary and crystallized in equilibrium with the assem- blage in which we find them. Are the melts that crystallized the phosphates the same ones that crystallized the remainder of the assemblage? The partitioning of minor elements (e.g., Mg/Fe, REEs, F/Cl) between apatite and whitlockite and their equilibrium melts is potentially very sensitive to the conditions of crystallization. We observe Lhat the Mg/Fe of apatite and whitlockite vary systematically with those of co- existing mafic silicates. The REE concentrations of whit- lock&e greatly exceed those of apatite, and the ratio of REEs (whitlockite/apatite) spans a broad range. In lunar apatite, the F/Cl ratio covers a substantial range. Are these different parameters consistently related and what do they mean?
The first question we address is the equilibrium distribution of REEs between the phosphates. Ratios of the average La concentration of whitlockite to that of apatite range from 14 in ,I264 and ,7233 to 60 in ,7044 (Table 6). We note that ,7233 and the ,7264 clast are among the most “evolved” samples in terms of their overall mineral assemblages; and from petrographic relations, it is likely that in these two sam- ples, apatite and whitlockite crystallized at the same time or in overlapping intervals. In sample ,7044, the apatite that has the lower REE concentrations (,7044a in Table 3) is part of a composite crystal containing whitlockite that has the lowest REE concentrations of those analyzed by EMP in the sample. The whitlockite/apatite ratios of La and Ce concen- trations for this intergrown composite crystal are 63 and 62, about the same as the ratios of the average concentrations for the sample (Table 6 ) . We consider whether variable par- titioning behavior of REEs between lunar apatite and whit- lock&e might result mainly from the strong compositional dependence of the REE distribution coefficients in whitlockite over the observed range of REE concentrations.
Before considering sequential or complex fractional crys- tallization models to account for the REE distribution in phosphate-bearing assemblages, we consider the simplest case, that of local systems at equilibrium, achieved either during crystallization or during subsolidus equilibration. For some samples, simple equilibrium crystallization is not appropriate; thus, we also consider stepwise equilibrium crystallization, sequential crysta&ation, and local equilibration during melt- pocket crystallization. We point out that the results of our modelling demonstrate the feasibility of producing the ob- SeNed whitlockite and apatite REE concentrations by simple crystallization from silicate melts without recourse to unusual REE concentrations in the system and metasomatic or meta- morphic processes. With such small samples, however, we cannot obtain the ancillary information to demonstrate con-
elusively that the individual samples formed just as we have modelled them.
Equilibrium Crystallization
We begin with sample 1416 1,7233, which has an assem- blage rich in phosphates and which has high bulk REE con- centrations, about three times those of average high-K KREEP (WARREN, 1989). This sample also has some of the lowest whitlockite/apatite REE ratios, for example, Nd(whit)/Nd(apat) = 14 (Fig. 5, Table 6). We interpret ,7233 to be an impact melt, crystallized rapidly at low pres- sure. Its bulk concentrations of TiOZ, SiOz, and PZ05 are sufficiently high that onset of crystallization of ilmenite, a silica polymorph, and a phosphate probably occurred within the first 25% of crystallization, along with the major minerals pigeonite, augite, and plagioclase. This sample has apatite in excess of whitlockite, and intergrowth relationships suggest that the interval of whit&kite crystallization may have ex- tended beyond that of apatite. For the most part, however, they crystallized in overlapping intervals. We model this sample as having formed by simple equilibrium crystalliza- tion, using Eqn. 15, coupled with Eqns. 13 and 14 to deter- mine REE3+ D values in whitlockite. The system composition is that of the bulk sample (Table 8) and the crystalline as- semblage is as given in Table 1. The equilibrium whitlockite REE concentrations so calculated are compared to the mea- sured concentrations in Fig. 9. A better fit for the HREEs might be obtained by a more complex model or by better knowledge of the appropriate zircon and pyroxene D values (see Fig. 10) ; however, to first order, the measured whitlockite REE composition can be modelled by simple equilibrium crystallization, using the observed mode and bulk sample REE concentrations, and our model for the distribution of REEs in whitlockite.
In order to match the apatite REE concentrations in this sample, we use the high set of apatite REE D values given in Table 7, which are based on the measured whitlockite/apatite concentration ratios in ,7233 and ,7264. Because in ,7233, whitlockite and apatite appear to have crystallized in over- lapping intervals, we conclude that, on average, they represent an equilibrium pair. Thus, allowing for the suppression of whitlockite REE3+ D values, we estimate apatite REE3+ D values specifically for this sample that are nearly two times those calculated using the average REE concentration ratios (see Table 7). We consider this to be within the allowable range of actual REE 3+ D values for apatite, given their likely dependence on temperature and composition. While we can- not independently model the apatite concentrations (we multiply the average D value by the factor that leads to the best fit), the use of the average apatite D values (in the relative sense) in the equilibrium crystallization model contributes to the good fit of modelled whitlockite REE concentrations to the measured concentrations.
Distribution coefficients used in the crystallization model for ,7233 are shown in Fig. 10a. Even under conditions of partial saturation of the REE substitution, whitlockite has the highest D values for most of the REEs (see also Table 8). A mass balance for the REEs calculated from D values and observed mineral modes shows that whit&kite contains
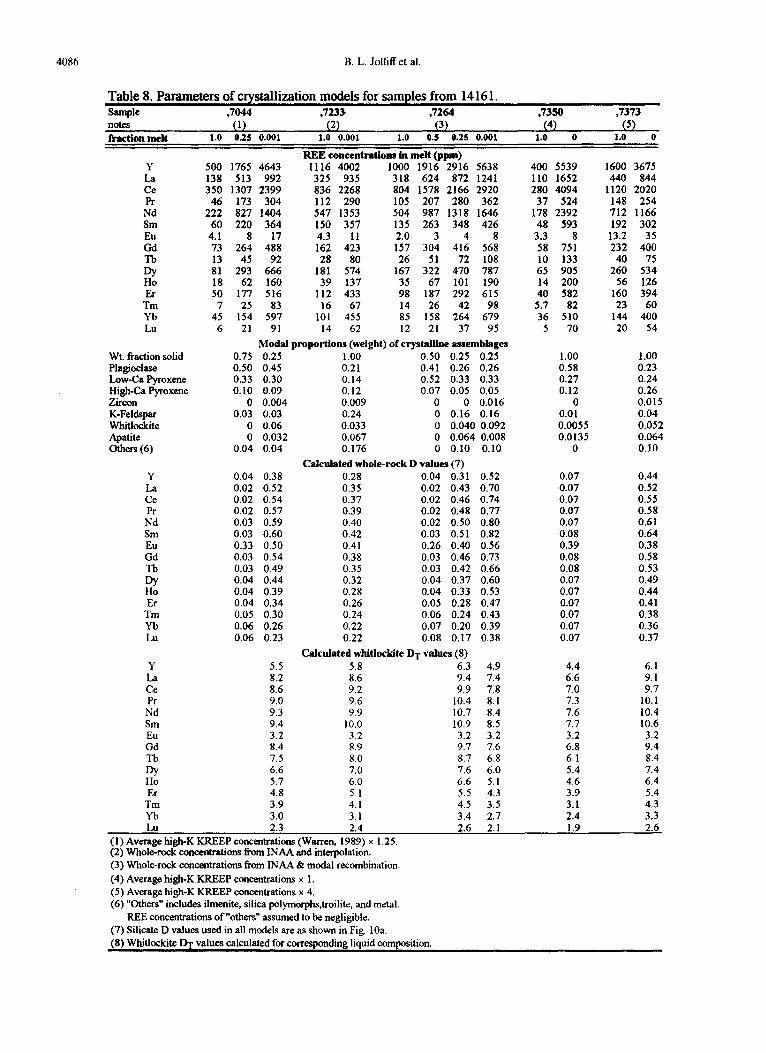
4086 B. L. Jolliff et al.
Table 8. Parameters of crystallization models for samples from 14 16 1. Sample ,7044 ,7233 ,7264 notes (1) (2) (3) ihction melt 1.0 0.25 0.001 1.0 0.001 1.0 0.5 0.25 0.001
REE concentrations in melt (ppm) Y La Ce
500 1765 4643 1116 4002 1000 1916 -2916 5638 138 513 992 325 935 318 624 872 1241 350 1307 2399 836 2268 804 1578 2166 2920
46 173 304 112 290 105 207 280 362 222 827 1404 547 1353 504 987 1318 1646
60 220 364 150 357 135 263 348 426 4.1 8 17 4.3 11 2.0 3 4 8 73 264 488 162 423 157 304 416 568 13 45 92 28 80 26 51 72 108 81 293 666 181 574 167 322 470 787 18 62 160 39 137 35 67 101 190 50 177 516 112 433 98 187 292 615
7 25 83 16 67 14 26 42 98 45 154 597 101 455 85 158 264 679
6 21 91 14 62 12 21 37 95
Modal proportions (weight) of crystaMne assemblages 0.75 0.25 1 .oo 0.50 0.25 0.25 0.50 0.45 0.21 0.41 0.26 0.26 0.33 0.30 0.14 0.52 0.33 0.33 0.10 0.09 0.12 0.07 0.05 0.05
0 0.004 0.009 0 0 0.016 0.03 0.03 0.24 0 0.16 0.16
,735o ,7373 (4) (5)
1.0 0 1.0 0
R Nd Sm EU Gd
4 Er
Tm Yb LU
Wt. fraction solid Planioclaso LoG-Ca Pyroxene High-Ca Pvroxene Z&on _ K-Feldspar Whitlockite Apatite Gthers(6)
Y La Ce Pr Nd Sm Eli Gd
: Er
Tm Yb LU
Y La Ce Pr Nd Sm Eu Gd
$ Er
Tm Yb
0 0.06 0.033 0 0.040 0.092 0 0.032 0.067 0 0.064 0.008
0.04 0.04 0.176 0 0.10
Calculated whole-rock D values (7) 0.04 0.38 0.28 0.04 0.31 0.02 0.52 0.35 0.02 0.43 0.02 0.54 0.37 0.02 0.46 0.02 0.57 0.39 0.02 0.48 0.03 0.59 0.40 0.02 0.50 0.03 0.60 0.42 0.03 0.51 0.33 0.50 0.41 0.26 0.40 0.03 0.54 0.38 0.03 0.46
0.10
0.52 0.70 0.74 0.77 0.80 0.82 0.56 0.73
0.03 0.49 0.35 0.03 0.42 0.66 0.04 0.44 0.32 0.04 0.37 0.60 0.04 0.39 0.28 0.04 0.33 0.53 0.04 0.34 0.26 0.05 0.28 0.47 0.05 0.30 0.24 0.06 0.24 0.43 0.06 0.26 0.22 0.07 0.20 0.39 0.06 0.23
5.5 8.2 8.6 9.0 9.3 9.4 3.2 8.4 7.5 6.6 5.7 4.8 3.9 3.0 _ _
0.22 0.08 0.17 0.38
Calculated whitlockite DT values (8) 5.8 6.3 4.9 8.6 9.4 7.4 9.2 9.9 7.8 9.6 10.4 8.1 9.9 10.7 8.4
10.0 10.9 8.5 3.2 3.2 3.2 8.9 9.7 7.6 8.0 8.7 6.8 7.0 7.6 6.0 6.0 6.6 5.1 5.1 5.5 4.3 4.1 4.5 3.5 3.1 3.4 2.7
Lu 2.3 2.4 (1) Average high-K KREEP concentrations (Warren, 1989) x 1.25. (2) Whole-rock cotxzentrations from INAA and interpolation. (3) Whole-rock concentrations from INAA & modal recombination.
(4) Average high-K KREEP concentrations x 1. (5) Average high-K KREEP concentrations x 4. (6) “Gthers” includes ilmenite, silica polymorphs,troilite, and metal.
0.07 0.44 0.07 0.52 0.07 0.55 0.07 0.58 0.07 0.61 0.08 0.64 0.39 0.38 0.08 0.58 0.08 0.53 0.07 0.49 0.07 0.44 0.07 0.41 0.07 0.38 0.07 0.36 0.07 0.37
4.4 6.1 6.6 9.1 7.0 9.7 7.3 10.1 7.6 10.4 7.7 10.6 3.2 3.2 6.8 9.4 6.1 8.4 5.4 7.4 4.6 6.4 3.9 5.4 3.1 4.3 2.4 3.3
2.6 2.1 1.9 2.6
400 5539 1600 3675 110 1652 440 844 280 4094 1120 2020 37 524 148 254
178 2392 712 1166 48 593 192 302 3.3 8 13.2 35 58 751 232 400 10 133 40 75 65 905 260 534 14 200 56 126 40 582 160 394 5.7 82 23 60 36 510 144 400
5 70 20 54
1.00 1.00 0.58 0.23 0.27 0.24 0.12 0.26
0 0.015 0.01 0.04 0.0055 0.052 0.0135 0.064
0 0.10
BEE concentrations of “others” assumed to be negligible. (7) Silicate D values used in all models are as shown in Fig. 10a. (8) Whitlockite DT values calculated for corresponding liquid composition.
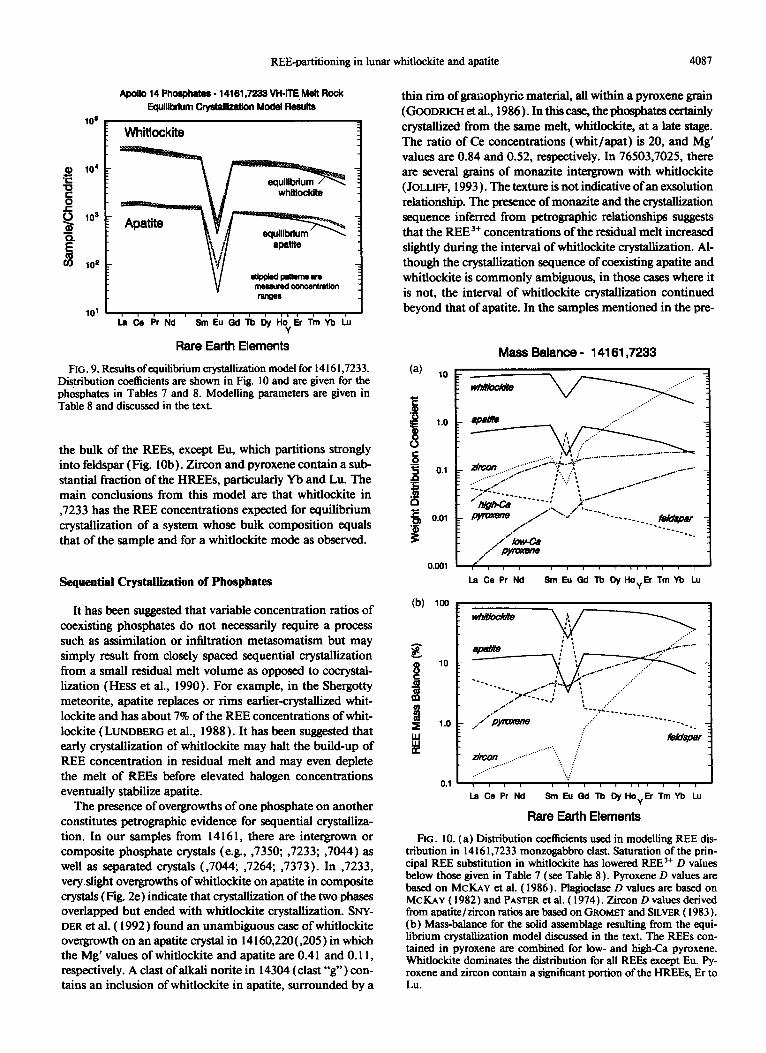
REE-partitioning in lunar whitlockite and apatite 4087
Apollo 14 Phoaphatas- 14161,72SSVH-KE,Melt Rock
EquiUbfium Cfystalllzatlon Moded Re8ults
Whitlockite
10" I I I I , I I I I I ,,I I I I ’ La Co Pr Nd SmEuGdTbDyHoybTmYbLu
Rare Earth Elements
FIG. 9. Results of equilibrium crystahiition model for 14 16 1,7233. Distribution coefhcients are shown in Fig. 10 and are given for the phosphates in Tables 7 and 8. Modelling parameters are given in Table 8 and discussed in the text.
the bulk of the REEs, except Eu, which partitions strongly into feldspar (Fig. 1 Ob) . Zircon and pyroxene contain a sub- stantial fraction of the HREEs, particularly Yb and Lu. The main conclusions from this model are that whitlockite in ,7233 has the REE concentrations expected for equilibrium crystallization of a system whose bulk composition equals that of the sample and for a whitlockite mode as observed.
Sequential Crystallization of Phosphates
It has been suggested that variable concentration ratios of coexisting phosphates do not necessarily require a process such as assimilation or infiltration metasomatism but may simply result from closely spaced sequential crystallization from a small residual melt volume as opposed to cocrystal- lization (HESS et al., 1990). For example, in the Shergotty meteorite, apatite replaces or rims earlier-crystalhzed whit- lockite and has about 7% of the REE concentrations of whit- lockite (LUNDBERG et al., 1988). It has been suggested that early crystallization of whitlockite may halt the build-up of REE concentration in residual melt and may even deplete the melt of REEs before elevated halogen concentrations eventually stabilize apatite.
The presence of overgrowths of one phosphate on another constitutes petrographic evidence for sequential crystalliza- tion. In our samples from 1416 1, there are intergrown or composite phosphate crystals (e.g., ,735O; ,7233; ,7044) as well as separated crystals (,7044; ,7264; ,7373). In ,7233, very slight overgrowths of whitlockite on apatite in composite crystals (Fig. 2e) indicate that crystallization of the two phases overlapped but ended with whitlockite crystallization. SNY- DER et al. ( 1992 ) found an unambiguous case of whitlockite overgrowth on an apatite crystal in 14160,220( ,205) in which the Mg’ values of whitlockite and apatite are 0.4 1 and 0.11, respectively. A clast of alkali norite in 14304 ( clast “g”) con- tains an inclusion of whitlockite in apatite, surrounded by a
thin rim of granophytic material, all within a pyroxene grain (GOODFUCH~~S~., 1986).Inthiscase,thephosphatescertainly crystallized from the same melt, whitlockite, at a late stage. The ratio of Ce concentrations (whit/spat) is 20, and Mg’ values are 0.84 and 0.52, respectively. In 76503,7025, there are several grains of monazite intergrown with whitlockite ( JOLLIFF, 1993 ) . The texture is not indicative of an exsolution relationship. The presence of monazite and the crystallization sequence inferred from petrographic relationships suggests that the REE 3+ concentrations of the residual melt increased slightly during the interval of whitlockite crystallization. Al- though the crystallization sequence of coexisting apatite and whitlockite is commonly ambiguous, in those cases where it is not, the interval of whitlockite crystallization continued beyond that of apatite. In the samples mentioned in the pre-
Mass Balance - 14161,7233 (a) 10
_/
In Ce PI Nd Sm Eu Qd Tb Dy Hop Tm Yb Lu
(W 1~ k
0.1’ I I I I la Co Pr Nd Sm Eu Qd Tb Dy Ho y Er Tm Yb Lu
Rare Earth Elements
FIG. 10. (a) Distribution coefficients used in modelling REE dis- tribution in 14161,7233 monxogabbro clast. Saturation of the prin- cipal REE substitution in whitlockite has lowered REE3+ D values below those given in Table 7 (me Table 8 ). Pyroxene D values are based on MCKAY et al. ( 1986). Plagicclase D values are based on MCKAY ( 1982) and PASTER et al. ( 1974). Zircon D values derived from apatik/zircon ratios are based on GROMET and SILVER (1983). (b) Mass-balance for the solid assemblage resulting from the equi- librium crystallization model discussed in the text. The REEs con- tained in pyroxene are. combined for low- and hi-Ca pyroxene. Whitlockite dominates the distribution for all REEs except Eu. Py- roxene and zircon contain a significant portion of the HREEs, Er to Lu.

4088 B. L. Jolliff et al.
ceding text, the REE concentrations of the melts from which apatite and whitlockite crystallized apparently were not de- pleted during the course of phosphate crystallization. Sample
14 16 1,7264 apparently involved sequential crystallization of the phosphates, and in the following model of its crystalli- zation, we show that whole-rock REE D values do not exceed 1, so we would not expect REE depletion.
Sample ,7264 has about the same proportion of whitlockite and similarly high concentrations of REEs as ,7233, but it has only -25% as much apatite. It is also coarser grained than ,7233 and probably crystallized at depth. Zoning rela- tionships in the silicates indicate that as this assemblage crys- tallized, the melt from which it formed evolved composi- tionally, so we model the formation of this sample as stepwise equilibrium crystallization, which approximates a degree of fractional crystallization. Bulk concentrations of TiOz and PZOs are such that ilmenite and phosphate crystallization probably began only after -50% crystallization of low-Ca pyroxene, plagioclase, and augite.
Apatite crystals in ,7264 have a range of compositions; those that are less magnesian have higher REE concentra- tions and lower F/Cl, which we interpret as consistent with expected fractionation trends. These observations are consistent with crystallization of apatite before whitlockite, during an interval when whole-rock DR~E3+ values were very low (e.g., <O.l).
We model the crystallization of this sample in three equi- librium crystallization steps, O-50,50-75, and 75-100%. Be- ginning with the bulk composition from Table 1, each sub- sequent step takes the equilibrium melt from the end of the preceding step as the new system composition. System and residual melt compositions are given in Table 8, along with weight modal proportions of minerals, constituting equilib- rium crystallization assemblages, which correspond to each residual melt and which were used to calculate whole-rock D values. We assume that phosphates begin to crystallize during the second step and that apatite is initially more abundant than whit&kite. During the last interval, most of the phosphate is whitlockite (Table 8 ) .
During the initial 5m of crystallization, when whitlockite is absent from the crystalline assemblage, whole-rock REE3+ D values are low (CO. I ), and 50% equilibrium crystallization yields about a two-fold increase in REE 3+ concentrations in the melt (Table 8), i.e., to nearly six times average high-K KREEP concentrations. Calculated REE concentrations of apatite and whitlockite that crystallize during the second and third steps are compared to measured values for this sample in Fig. 11. As with sample ,7233, the match is best for the LREEs and MREEs. The calculated increase in apatite REE concentrations brackets the measured values, consistent with our interpretation of progressive crystallization of apatite through an extended interval. Whitlockite that crystallized during the last interval has model REE concentrations that closely match those measured (Fig. 11). Once whitlockite begins to crystallize, whole-rock REE 3+ D values range from -0.5 for the middle REEs to -0.2 for HREEs (Table 8). As a result of the saturation effect of REE substitution in whit&kite, the effective REE3+ D values for whitlockite are only about 40% of the low concentration D values. The onset of whitlockite crystallization does not decrease REE concen-
Apollo 14 Phosphates - 14161,7264 Monzogabbro clast Stepwiae EquHibrbm CrystallizaUon Model Results
10s c 4 [ Whitlockite J
10'1 I I I / I I I I I I III I I I -J LaCePrNd Sm Eu Gd Tb Dy H; Er Tm Yb Lu
Rare Earth Elements
FIG. 11. Results of stepwise equilibrium crystallization model for 14161,7264. Distribution coefficients used for the silicates are as shown in Fig. 1Oa and are given for apatite in Table 7 (high values). Whit&kite D values calculated for specific melt compositions are given in Table 8. See text for discussion.
trations in the remaining melt, nor do the REE concentrations of the melt change drastically. The increased proportion of whitlockite and the addition of zircon to the crystalline as- semblage during the last step further increase whole-rock REE’+ D values, but with reasonable proportions of whit- &kite, they do not exceed 1.0 (Table 8).
If strong changes in REE concentrations had occurred in a given melt during whitlockite crystallization, we should expect to find REE zoning in a core to rim profile across whitlockite crystals unless there was subsequent subsolidus reequilibration. We observe only weak, patchy zoning in whitlockite, although zoning of REEs is well preserved in apatite in ,7269. The lack of systematic REE zoning in whit- lockite is consistent with the model result that whole-rock D values are roughly close to 1 ( +0.5 ) when whitlockite is part of the crystallizing assemblage.
We consider the possibility that the lack of REE compo- sitional zoning in whitlockite results from subsolidus diffusive equilibration. Hess et al. ( 1990) suggested that Fe and Mg may equilibrate more readily than REEs in the phosphates. In the large compositecrystal in 14161,7350, we findevidence of thin zones between apatite and whitlockite that appear to have exchanged Mg and Fe, but not REEs. However, these zones appear to be restricted to regions within several microns of the apatite-whitlockite interface. There is no indication of a compositional gradient in the REE concentrations of either phosphate in the regions adjacent to the interface between them. It may be argued that both minerals have equilibrated with respect to their REE concentrations, but we note that REE * Ca interdiffision as determined experimentally for apatite by WATSON and GREEN ( 198 1) appears to be quite slow. Based on suggested slow diffusion rates and on the ob- servation that primary zoning is preserved in at least one sample, we believe that, in general, significant subsolidus re- distribution of REEs and Fe-Mg has not occurred between the phosphates.

REE-partitioning in lunar whitlockite and apatite 4089
Local Melt-pocket Equilibrium
In some samples, we observe ranges of compositions for both whitlockite and apatite. On the scale of an entire sample, this represents a condition of disequilibrium which may arise through mechanical mixing of d&rent materials, as in a
(a’ loo 1 Met-pocket Equilibrium Model 1
,. 1 ‘“a . . . . , t t . . J
REE in Whitlockii
IO’ 02 0 . . . .
modal proportIon whlt/(whit+apat)
FIG. 12. Effe.cts of late-stage, local melt-pocket equilibrium on the distribution of REEs between whitlockite and apatite in sample 14161,7044, showing Ce, Y, and Yb as examples. (a) Model variation of whitlockite/apatite concentration ratios as a function of the modal proportion of whitlockite, given a constant proportion of total phos- phate (2.3 wt%) in the sample. Variations in the actual samples lie within the indicated range. Modelling conditions are the same as given in Table 8 and shown in Fig. 13. (b) Model concentrations of Ce, Y, and Yb in whitlockite. Three curves are shown for yb: the solid line is for the assemblage given in Table 1; a second line shows the increase in Yb concentration in whitlockite if there is no zircon in the local assemblage; the third line shows the increase of Yb con- centration in whitlockite resulting from decreasing the proportion of pyroxene in the local assemblage. Variations are similar for Y, but not as pronounced as for Yb. Variation of the proportion of whit- lockite in the bulk sample is the dominant factor; variations in pro- portions of zircon and pyroxene a&ct the HREEs but only slightly, as illustrated for Yb. The condition for plagioclase * pyroxene is for one-four&h the modal abundance of pyroxene relative to the assem- blage represented by the solid line. Note that Ce/Yb of whitlockite varies strongly as a function of the modal proportion of whitlockite. (c) Model variations of REE concentrations in apatite, with the same conditions as in (b).
breccia, or by some nonuniform, post-crystaUization process. Such a condition, however, could also result from isolation of small pockets of residual melt during late-stage crystalli- zation wherein each small volume of melt crystallizes in equilibrium with local solid assemblages that have different proportions of minerals. We refer to this process as local melt-pocket equilibrium.
Variations in REE concentrations in whitlockite and apa- tite of sample 14 16 1,7044 may result from local melt-pocket equilibrium. In this sample, whitlockite Ce concentrations range from 17,750-23,000 ppm, and apatite Ce concentra- tions from 290-430 ppm. .Where the two minerals are in contact, the Ce concentration ratio (whitlockite/apatite) is about 60. We consider this sample as a set of domains, each of which derived from melt pockets of initially uniform REE concentrations at the time they became isolated, but which equilibrated with locally different proportions of minerals, including phosphates. There are many conceivable variants of melt-pocket equilibrium. It is not necessary that individual melt pockets become isolated simultaneously, but we chose this as the simplest case for illustration.
Figure 12 shows some of the effects of varying the modal proportions of just whit&kite and apatite at a constant pro- portion of total phosphate. The principal effects are those caused by varying the proportion of whitlockite, but variations in the proportions of zircon and pyroxene would also affect the HREEs. It is evident from the plots that variations in mineral proportions of the equilibrating assemblage affect not just the magnitude of the whitloclcite/apatite concentra- tion ratios, but also the slopes of the REE patterns in whit- lockite and apatite (Fig. 13 ) . For example, at low proportions of whitloclcite, Ce concentrations exceed those of Y, but at high proportions of whit&kite, Y exceeds Ce, and the Ce/ Yb ratio changes substantially (Fig. 12). The actual observed variations in whitlockite and apatite in ,7044 are in the same sense as those predicted. The absolute concentrations shown in Fig. 12 vary as a function of how large a volume of silicate assemblage actually equilibrated with the phosphates, i.e., the abundance of whitlockite, in particular, in a given assem- blage, and with our choice of distribution coefficients. How- ever, the shapes of the curves in Fig. 12 do not change sub- stantially.
Can the effects of local melt-pocket equilibrium be distin- guished from those of sequential crystallization? We do not expect local melt-pocket equilibrium necessarily to produce correlations of parameters such as REE concentration, Mg’, and Cl’, e.g., as in sample ,7264. However, this process may contribute to compositional variations such as those observed in ,7264. In fact, the REE compositional variations are well within the range attainable by this process. Cumulate samples, discussed in the following text, may represent local melt pockets, but on a larger scale.
Cumulates
Samples 14161,735O and ,7373 are cumulates, i.e., their assemblages are not necessarily modally representative of larger, bulk systems. Sample ,735O has excess plagioclase and its large, composite phosphate crystal almost certainly makes

4090 B. L. Jolliff et al.
Apollo 14 Phosphates - 14161,7044 magna&n Wbtxonorite StepwIse EqulHbflum I MtkPocket Oystakatlon Model
105 1 Whitiockite 1
La Ce Pr Nd Sm Eu Gd Tb Dy Hay Er Tm Yb Lu
Rare Earth Elements
FIG. 13. Model results of stepwise equilibrium crystallization cou- pled with local melt-pocket equilibrium crystaHization for 14 16 1,7044. Modelling parameters are given in Table 8. Distribution coefficients used for the silicates are as shown in Fig. 10a and are given for apatite in Table 7 (low values). Whitlockite D values cal- culated for specific melt compositions are given in Table 8. The three different sets of phosphate REE compositions are modelled by as- suming that residual melt is isolated after 75% crystallization in “pockets” that equilibrate locally with assemblages having different modal proportions of whitlockite and apatite. A necessary condition is that some amount of one or the other phosphate has begun to crystallize and is present at the time of melt pocket isolation. The modal whitlockite/apatite ratio of 1.9 is that observed in the sample. Ratios of 1.0 and 4.5 are given as examples to illustrate potential effects of local melt-pocket equilibrium crystallization.
it modally nonrepresentative. Sample ,7373 has excess whit- &kite and pyroxene. Because these samples are modally nonrepresentative, we have little indication about the REE concentrations of the systems in which they formed. Using our model for the distribution of REEs in whitlockite, it is possible to invert the distribution coefficients and estimate the REE concentrations of melts that would be in equilibrium with given whitlockite compositions; however, it is not par- ticularly relevant to do so. More relevant are the compositions of melt and crystals that make up the system when wbitlcckite begins to crystallize, and the distribution of REEs among an equilibrium assemblage of crystals when no melt remains. The high concentrations of REEs in lunar whitlockite are a natural consequence of a relatively uniform P-to-REE ratio in evolved lunar melts, resulting from similar compositional evolution of lunar residual magmas and a general lack of REE-rich, rock-forming silicates (e.g., garnet, amphiboles), such that whenever phosphorus concentrations became high enough to crystallize phosphates, the REEs were also highly concentrated. For example, whitlockite rich in REEs can crystallize in a system that has bulk REE concentrations equal to those of KREEP if the proportion of whitlockite is low, as in 14 16 1,7044. In the model for that sample, we allow the entire assemblage to equilibrate; and with only 1.0-l .6% whitlockite, concentrations in the observed range are ob- tained.
The REE concentrations of residual melts continuously change as crystallization proceeds, and they may become quite high when there is very little melt remaining. However, when phosphate crystallization began in melts having P and REEs in KREEP-like proportions, concentrations in the re- sidual melts appear to have been three to four times those of KREEP (Table 8). If extraordinarily REE-rich initial melts are not required to produce REE-rich whitlockites, then it is unnecessary to call upon metasomatism by an Fe-rich melt derived from urKREEP to produce them. The very high val- ues of Mg’ in both phosphates in magnesian anorthosite sam- ple ,735O suggest that Mg and Fe concentrations in the re- sidual melt were effectively buffered by a mafic silicate as- semblage (e.g., Table 8). We suggest that such whit&kites derived from small volumes of residual melt or from auto- metasomatism by an Mg/Fe-buffered residual melt from a remote portion of the cumulate aggregation. In order to model the high phosphate REE concentrations in ,7350, it is not necessary to invoke a melt having extremely high REE con- centrations; the high REE concentrations in whitlockite can be obtained if the system with which the phosphates equili- brate has a small proportion of whitlockite, e.g., 0.5% (Table 8). Sample ,735O has the lowest modal abundance of whit- lockite of all the 14 16 1 samples discussed (Table 1). The model accounts well for the observed whitlockite and apatite REE concentrations ( Fig. 14).
In the case of 14 16 I ,7373, whitlockite with the observed REE concentrations can be modelled as crystallizing in a
Apollo 14 Phosphates - 14161,735O magnaaian AnOtthOSitS Equilbtlum GystaUkatlon Model Resuits
8quilHxium apaute
10' LaCePrNd Sm Eu Qd lb Dy Hay Er Tm Yb Lu
Rare Earth Elements
FIG. 14. Comparison of measured and model concentrations of REEs in phosphates, sample 14 16 1,735O. Phosphates are modelled as having crystallii from a residual melt of about one times average high-K KREEP. In this model, the crystalline assemblage with which the phosphates equilibrate is more ma& than the observed assemblage (but still plagioclase-rich) in order to match the slope of the REE patterns (see Table 8). This model is not a unique solution; if the proportion of whitlockite in the equilibrated assembhige is lower, the “system” REE concentrations need not be as high as those of average high-K KREEP. Distribution coefficients used to model the apatite composition in this sample are shown on the figure, and calculated whitlockite D values are given in Table 8.

REE-partitioning in lunar whitlockite and apatite 409 I
system having REE concentrations of nearly four times
those of average high-K KREEP but producing only about half the observed modal abundance of whitlockite. The high observed modal abundance would then be the result of a physical separation process, although the small sample size allows that the separation may be very local. Again, the model accounts well for the observed phosphate REE concentrations ( Fig. 15 ) .
In the models we describe above, we are unable to match whitlockite/apatite REE3+ concentmtion ratios in all samples using fixed REE D values in apatite, yet we believe that in those samples with extreme concentration ratios, apatite and whitlockite coexist at or near equilibrium. Thus, we have used apatite REE ‘+ D values that span a range of a factor of 3 (Table 7). We note that whitlockite/apatite REE3+ con- centration ratios are lowest, and apatite REE 3+ D values ap parently highest, in those samples that we suspect crystallized at relatively low temperatures and from melts with relatively high SiOZ concentrations. These correlations are the same as those found experimentally for apatite by WATSON and GREEN (1981).
Relationship of Lunar Phosphates to Rocks with KREIEP- iike Haiti Siitute
The REE distribution in lunar rocks from Apollo 14 that have KREEP-like ITE concentration ratios is remarkably uniform; that is, interelement ratios among the REE’* are nearly constant over a substantial concentration range ( JOL-
Apollo 14 Phosphates - 14161,7S7S Quark Monzogabbro Equulbriulll crystalllzatlon Model Results
lo5 t 3
eaulllbrfum
measured concentmtkxt
_ LaC!eRNd?JmEu wm0ftioY EtTmybLu_
IO' 44 .A7 .E.l .lia ad .te 30 As .98 as 24 30 26 10 .I6 II I I I 811 I * 118 11 I La Ce Pr Nd SmEuGdTbDyHoyErTmYbLu
Rare Earth Elements
FIG. 15.Modelresultsforquartzmonzogabbro 14161,7373,mod- died as a system with REE concentrations four times those of average. high-# KREEP, which equilibrates with an assemblage similar to that given in Table I for this sample. The proportion of whit&kite in the equilibrated assemblage is modelled as 4.5% instead of the 8.8% whitlockite in the bulk sample. As with the other cumulate samples, given that the “system” REE com~ition and the modal proportions ofthe actual equilibrated assemblage are not known, this particular model is not a unique solution. Distribution coefficients used to model the apatite composition in this sample are shown on the figure, and calculated whitlockite I> values are given in Table 8.
LIFF et al., 199 1, and many previous references therein). For example, the La/Yb ratio in Apollo 14 materials is 3.0-3.1. This has been taken as evidence of material of constant com- position from a single, major source, perhaps Moon-wide (WARREN and WASSO~~~, 1979). The REE distribution in KREEP-rich materials is similar to the REE distribution in whitlockite and apatite (slight LREE to HREE fmctionation and substantial negative Eu anomaly); the phosphates are the dominant carriers of the REEs in materials with KREEP- like ITE. We note that whitlockite and apatite occur together in nearly all Apollo 14 samples containing phosphate, es- pecially those with a KREEP-like REE pattern. It may be that the proportion of whitlockite and apatite in materials having KREEP-like ITE compositions is relatively constant. Correlated variations between F, Cl, and P205 in lunar sam- ples, despite the presence of F- and Cl-free whit&kite, led REED and JOVANOVIC ( 1973) to this conclusion.
That the relative REE distributions in the two minerals are not identical and are not the same as that of KREEP suggests that it is not because a lunar sample contains phos- phates that it has KREEP-like REE ratios; rather, it is the KREEP-like REE abundances of parent melt that produces the REE patterns of the phosphates. All lunar whit&kites that have been analyzed by IMP have La/Yb concentration ratios significantly higher (3.6-7.2) than that of KREEP (3.06; WARREN, 1989). Those from Apollo 14 analyzed in this study have La/Yb ranging from 4.4-7.0. Several of the lunar apatites that were porously analyzed by IMP have lower La/Yb than that of KREEP (e.g., 1.75, 1.88: LIND- STROM et al., 1985), while one has La/Yb of about 8 ( LIND- STROM et al., 199 I ) . Apatite in our study has La/Yb ranging from 2.5-4.9. Low La/Yb of apatite relative to coexisting whit&kite is consistent with our findings as well as those of MURRELL~~ al. ( 1984) that the difference between mineral/ melt ~s~bution coefficients of whi~~kite and apatite is greater for La than for Yb. This was also observed in the Shergotty phosphates by LUNDBERG et al. ( 1988) with IMP data (La/Yb of whitlockite and apatite of 2.0 and 1.5, re- spectively). In KREEP-like materials, the combined enrich- ment of HREE in clinopyroxene and zircon must account for the higher La/ Yb slope of the phosphates relative to parent melts. In samples enriched in P and REEs but not commen- surately in other ITEs, the La/Yb slope is higher than that of KREEP and is dominated by whitlockite.
Two ITE-rich lunar rocks whose bulk La/Yb ratios deviate substantially from that of KREEP are lunar granite and quartz monzodiorite-monzogabbro. If the La/Yb ratio in apatite is similar to or only slightly greater than that of KREEP, then the bulk-rock REE fractionation observed in lunar granite (i.e., La/Yb as low as 1.7 in 14161,7269), can be explained by separation (removal) of whitlockite (see Fig. 11 of JoLLrff, 199 1) . It may be that halogen fugacity was the main factor governing which phosphate formed first and how much of each formed from lunar melts. Thus, any process that en- riched or depleted halogens relative to phosphorus would affmt the a~tite/whitl~~te ratio and perhaps the sequence of crystallization. From our modeiling, it appears that the effects of variations in the relative proportions and sequence of crystallization of the phosphates (and zircon) are of suf-

409’ B. L. Jolliff et al.
ficient magnitude to explain differences between La/M, ratios of phosphates in different samples as opposed to requiring differences in La/Yb of parent melts.
CONCLUSIONS
Concentrations of REEs in lunar whitlockites are high, ranging from - 1.2 to 2.1 REEs (lanthanides f Y) per f&y- six oxygens. This slightly exceeds the level of two REE atoms per fifty-six oxygens at which the dominant substitution theoretically becomes saturated, i.e., 2REE3+ on Ca( B) sites + vacancy on Ca( IIA) substitute for 2Ca on Ca( B) sites + (Ca,Na) on Ca( IIA). This saturation effect leads to whit- lockite REE3+ D values at typical lunar whitlockite REE concentrations which are 30-40% lower than the D values
at low concentration. Once whitlockite begins to crystallize, whole-rock REE3+ D values approach but do not exceed 1; thus, whitlockite crystallization does not deplete residual melts of REEs.
Whitlockite/apatite REE concentration ratios in different samples span a broad range, from - 10 to 60. This presum- ably results in part from strong dependence of apatite REE’+ D values on temperature and composition. However, the rel- ative proportions of whitlockite and apatite greatly influence the magnitude of their REE concentration ratios, although not the shape of the pattern of the ratios plotted against REE atomic number. Thus, the halogen-to-phosphorus ratio in lunar melts is a key factor determining the REE distribution within crystalline assemblages. If apatite crystallizes in the absence of whitlockite, whole-rock REE3* D values remain very low, and REE concentrations of residual melts increase significantly during crystallization. Sequential crystallization of apatite before whitlockite may lead to variations in REE concentration ratios if the two phosphates in a given sample do not eventually equilibrate. Variability within a given sam- ple may result from a process such as local melt-pocket equi- librium crystallization wherein locally variable proportions of whitlockite in equilibrating assemblages lead to different REE concentrations in the phosphates and different concen- tration ratios.
As long as P and REE concentrations of melts are in KREEP-like proportions, one or both of the phosphates will saturate in melts at similar REE concentrations. This con- centration level appears to be about three to four times that of average high-K KREEP. Such melts yield whit&kite REE concentrations in the observed range as part of equilibrium assemblages. Likewise, melts of lower REE concentrations crystallize whitlockite having sufficiently high REE concen- trations to match the natural samples if there are small enough proportions of whitlockite. Thus, discrete parent melts of ex- tremely high REE concentrations are not required to crys- tallize REE-rich whitlockite. In the samples we have studied, processes such as metasomatism or metamorphic alteration
are not required to produce compositions of coexisting phos-
phates, nor are they indicated by petrographic textures.
Values of Mg’ are higher in whit&kite and lower in apatite than in coexisting mafic silicates. This is controlled by crystal
structures and reflects the equilibrium distribution of these elements in the phosphates. The observation that REE-rich
whit&kite, present in mineralogically primitive assemblages such as magnesian anorthosite, has conelated Mg’ (indicating that it may be in equilibrium with that assemblage) suggests that such whitlockite derived from residual melts buffered by the major assemblages and was not introduced through metasomatism by an Fe-rich melt.
Relative concentrations of F and Cl in lunar apatites are variable but do not correlate in any simple way with REE variations. Differentiation of F and Cl and perhaps differ- entiation of the halogens relative to phosphorus may occur during late-stage crystallization of lunar quartz monzodiorite- monzogabbro. Such differentiation may affect the sequence of phosphate crystallization, their relative proportions, and the subsequent distribution of REEs between them.
Acknowledgments-We are grateful to Randy Korotev for assistance with INAA and to Dan Kremser for assistance in the EMP lab. We thank reviewers John Ayers and Dave Lindstrom for their very helpfid comments and sumns. Funding for thii work was through NASA grants NAG 9-56 to L. A. Haskin and NAG 9-55 to G. Crozaz.
Editorial handling: P. C. Hess
REFERENCES
ALBEE A. L. and CHODOS A. A. ( 1970) Microprobe investigations on Apollo I 1 samples. Proc. Apollo I I Lunar Sci. Conf, pp. 135- 157.
ALBEE A. L. and RAY L. ( 1970) Correction factors for electron probe microanalysis of silicates, oxides, carbonates, phosphates, and sul- fates. Anal. Chem. 42, 1408-1414.
ALBEE A. L., GANCARZ A. J., and CHODOS A. A. ( 1973) Sanidinite facies metamorphism of Apollo 16 sample 65015. Lunar Sci. IK pp. 24-26 (abstr.)
BENCE A. E. and ALBEE A. L. ( 1968) Empirical correction factors for the electron microanalysis of silicates and oxides. J. Geology 76,382-403.
BROWN G. M., EMELIUS C. H., HOLLAND J. G., PECKETT A., and PHILLIPS R. ( I97 1) Picrite basal& ferrobasalts, feklspathic norites, and rhyolites in a strongly fractionated lunar crust. Proc. 2nd Lunar Sci. Co&, pp. 583-600.
BROWN G. M., EMELIUS C. H., HOLLAND J. G., PECKETT A., and PHILLIPS R. ( 1972) Mineral-chemical variations in Apollo 14 and Apollo 15 basalts and gmnitic fractions. Proc. 3rd. Lunar Sci. Conf.‘, pp. 141-157.
CALVO C. and GOPAL R. ( 1975) The crystal structure of whitlockite from the Palermo quarry. Amer. Mineral. 60, 120-l 33.
CHAMBERS W. F. ( 199 1) BA85: A Bence-Albee oxide analysis routine with mineral code capabilities. Sandia Rept. SAND90-1702, pp. 161-178.
COLSON R. 0. and JOLLIFF B. L. (1993a) Crystal-chemistry and partitioning of REE in whitlockite. Lunar Planet. Sci. XXIV, 323- 324 (abstr.).
COUON R. 0. and JOLLIES B. L. ( 1993b) Effect of Fe concentration on REE partitioning in whitlockite. Eos 74, 343 ( abstr. ) .
COLSON R. O., JOLLIFF B. L., and HASKIN L. A. ( 1992) Inferring REE substitution reactions in lunar whit&kite. Lunar Planet. Sci. XXIII, pp. 235-236 (abstr.).
DICKINSON J. E. and HESS P. C. (1983) Role of whitlockite and apatite in lunar felsite. Lunar Planet. Sci. XlV, pp. 158- 159 (ati.).
Dowry E. ( 1977) Phosphate in Angra Dos Reis: Structure and com- position of the Caj(POe)2 minerals. Earth Planet. Sci. Lett. 35, 347-35 I.
DRAKE M. J. and WEILL D. F. ( 1972) New rare earth element stan- dards for electron microprobe analysis. Chem. Geol. 10, 179- 18 I.
FRONDEL J. W. ( 1975) Lunar Mineralogy, pp. 145-162. Wiley-In- terscience.

REE-partitioning in lunar whitlockite and apatite 4093
FUCHS L. H. ( 197 1) Grthopyroxene and orthopyroxene-bearing rock fragments rich in K, REE, and P in Apollo 14 soIl sample 14 163. Earth Planet. Sci. Lett. 12, 170-174.
GANCARZ A. J., ALBEE A. L., and 010~0s A. A. ( 197 1) Petrologic and mineralogic investigation of some crystalline rocks returned by the Apollo 14 mission. Earth Planet. Sci. Lett. 12, l-18.
GAY P., BOWN M. G., and RICK~~N K. 0. (1970) Mineralogical studies of lunar rock 12013,lO. Earth Planet. Sci. Lett. 9, 124- 126.
GOODRICH C. A., TAYLOR G. J., and KEIL K. (1985a) An apatite- rich, ferroan, mafic lithology from lunar meteorite ALHA 1005. Proc. 15th Lunar Planet Sci. Con_; J. Geophys. Res. 90, C405- c414.
GOODRICH C. A., TAYLOR G. J., KEIL K., REED S. J. B., B~YNTON W. V., and HILL D. H. ( 1985b) Ion microprobe analysis of REE in phosphates in the apatite-rich clast from ALHA 1005. Lunar Planet. Sci. XVI pp. 282-283 (abstr.).
G~~DRICH C. A., TAYLOR G. J., KEIL K., KALLEMEYN G. W., and WARREN P. H. ( 1986) Alkali norite, trtiolites, and VHK mare basalts from breccia 14304. Proc. 16th Lunar Planet Sci. Conf; J. Geophys. Res. 91, D305-D3 18.
GRIFFIN W. L., AMLI R., and HEIER K. S. ( 1972) Whitlockite and apatite from lunar rock 143 10 and from C&garden, Norway. Earth Planet. Sci. Lett. 15, 53-58.
G~OMET L. P. and SILVER L. T. ( 1983) Rare earth element distri- butions among minerals in a granodiorite and their petrogenetic implications. Geochim. Cosmochim. Acta 47,925-939.
HASKIN L. A. ( 1984) Petrogenetic modelling-use of rare earth ele- ments. In Rare Earth Element Geochemistry (ed. P. HENDERSON); Developments in Geochemistry, Vol. 2, pp. 115- 152. Elsevier.
HASKIN L. A. and GEHL M. A. ( 1962) The rare-earth distribution in sediments. J. Geophys. Res. 67,2537-2541.
HASKIN L. A., JOLLIFF B. L., and COLSON R. 0. ( 1992a) Effects of REE’+ saturation on the substitution in whitlockite of 2 REE’+ + vacancy in Ca(IIA) for 3 Ca*+. Lunar Planet. Sci. XXIII, pp. 50 I-502 (abstr.) .
HASKIN L. A., JOLLIFF B. L., and COLSON R. 0. ( 1992b) On par- titioning of REE between whitlockite and apatite in high-ITE lunar rocks: Petrologic consequences Lunar Planet. Sci. XXIII, pp. 503- 504 (abstr.) .
HESS P. C., HORZEMPA P., RUTHERFORD M. J., and DEVINE J. ( 1990) Phosphate equilibria in lunar basalts. Lunar Planet. Sci. XXI. pp. 505-506 (abstr.).
HUGH= J. M., CAMERON M., and CROWLEY K. D. ( 1989) Structural variations in natural F, OH, and Cl apatites. Amer. Mineral. 74, 870-876.
JAMES 0. B., LINDST~OM M. M., and FLOHR M. K. ( 1987) Petrology and geochemistry of alkali gabbronorites from lunar breccia 67975. Proc. 17th Lunar and Planet. Sci. ConjI; J Geophys. Res. 92, E3 14- E330 (suppl.) .
JAROSEWICH E. and BOATNER L. A. ( 199 1) Rare-earth element ref- erence samples for electron microprobe analysis. Geostand. News- lett. 15, 397-399.
JOLLI: B. L. ( 1990) The search for igneous precursors of Apollo 14 impact melt breccias: Clues in soil particles. Lunar Planet. Sci. XXI, pp. 575-576 (abstr.).
JOLLIFF B. L. ( 199 1) Fragments of quartz monzodiorite and felsite in Apollo 14 soil particles. Proc. Lunar Planet. Sci. 21, 101-l 18.
JOLLIFF B. L. ( 1993) A monazite-bearing clast in Apollo 17 melt breccia. Lunar Planet. Sci. XXIV, 725-726 (abstr.).
JOLLIFF B. L., KOROTEV R. L., and HASK~N L. A. ( 199 1) Geochem- istry of 2-4 mm particles from Apollo 14 soil ( 14 16 1) and impli- cations regarding igneous components and soil-forming processes. Proc. Lunar Planet. Sci. 21, 193-219.
KEIL K., PRINZ M., and BUNCH T. E. ( 197 1) Mineralogy, petrology, and chemistry of some Apollo 12 samples. Proc. 2nd Lunar Sci. ConjY, pp. 3 19-34 1.
KOROTEV R. L. ( 199 1) Geochemical stratigraphy of two regolith cores from the central highlands of the Moon. Proc. Lunar Planet. Sci. 21,229-289.
LINDSTROM D. J. and KOROTEV R. L. ( 1982) TEABAGS: Computer
programs for instrumental neutron activation analysis. J. Ra- dioannf, h&Z. Chem. 70,439-458.
LINDSTROM M. M., KNAPP S. A., SHERVAIS J. W., and TAYLOR L. A. ( 1984) Magnesian anorthosites and associated troctolites and dunite in Apollo 14 breccias. Proc. 15th Lunar Planet. Sci. Cor$; J. Geophys. Res., 89, C4 l-C49 (suppl.); Correction to Pm. 15th Lunar Planet Sci. ConfY, Part 2. J. Geophys. Res. 90, C845 (SUPPI.).
LINDSTROM M. M., CROZAZ G., and ZINNER E. (1985) REE in phosphates from lunar highlands cumulates: An ion probe study. Lunar Planet. Sci. XVI pp. 493-494 (abstr.) .
LINDSTROM M. M., MARVIN U. B., and CROZAZ G. ( 1991) Ion microprobe analyses of REE in minerals from Apollo 15 quartz monxodiorites. Lunar Planet. Sci. XXII, pp. 8 19-820 (abstr.) .
L~NGHI J. ( 1977) Magma oceanography 2: Chemical evolution and crustal formation. Proc. 8th Lunar Sci. Con!. pp. 60 l-62 I.
LUNDBERG L. L., C~OZAZ G., MCKAY G., and ZINNER E. ( 1988 ) Rare earth element carriers in the Shergotty meteorite and impli- cations for its chronology. Geochim. Cosmochim. Acta 52,2147- 2163.
LUNDBERG L. L., C~OZAZ G., and MCSWEEN H. Y., JR. ( 1990) Rare earth elements in minerals of the ALHA shergottite and implications for its parent magma and crystallization history. Geochim. Cosmochim. Acta 54,2535-2547.
MCKAY D. S., CLANTON U. S., MORRISON D. A., and LADLE G. H. ( 1972) Vapor phase crystallization in Apollo 14 breccia. Proc. 3rd Lunar Sci. Co@, pp. 739-752.
MCKAY G. A. ( 1982) Partitioning of REE between olivine, plagio- clase, and synthetic melts: Implications for the origin of lunar an- orthosite. Lunar Planet. Sci. XZZZ, pp. 493-494.
MCKAY G. A., WAGSTAFF J., and YANG S.-R. ( 1986) Clinopyroxene REE distribution coefficients for Shergottites: The REE content of the Shergotty melt. Geochim. Cosmochim. Acta F&,927-937.
MCKAY G. A., WAGSTAFF J., LE L., LINDSTROM D., and COLNN R. ( 1987) Whitlockite/melt partitioning and Henry’s Law: Sher- gotty late-stage minerals. Lunar Planet. Sci. XVZZZ, pp. 625-626 (abstr.).
MURRELL M. T., BRANDRISS M., W~~LUM D. S., and BURNETT D. S. ( 1984) Pu-REE-Y partitioning between apatite and whit- lockite. Lunar Planet. Sci. XV, pp. 579-580 (abstr.) .
NEAL C. R. and TAYLOR L. A. ( 199 1) Evidence for metasomatism of the lunar highlands and the origin of whit&kite. Geochim. Cosmochim. Acta 55,2965-2980.
NEAL C. R., TAYLOR L. A., and PATCHEN A. D. ( 1990) The di- chotomy between primitive highland cumulates and evolved in- terstitial whitlockites: The process of “REEP-fraction” metaso- matism. Lunar Planet. Sci. XXZ, pp. 863-864 (abstr.) .
PAPIKE J. J., TAYLOR L. A., and SIMON S. B. ( 199 1) Lunar minerals. In Lunar Sourcebook: A User’s Guide to the Moon. Chap. 5, pp. 12 I - I8 I. Cambridge Univ. Press.
PASTER T. P., SCHAUWECKER D. S., and HASKIN L. A. ( 1974) The behavior of some trace elements during solidification of the Skaer- gaard layered series. Geochim. Cosmochim. Acta 38, 1549-1577.
P2~wl1-r C. T. and ROTHBARD D. R. ( 1975) Crystal StNCtWS of meteoritic and lunar whit&kites. Lunar Planet. Sci. VZ, pp. 646- 648 (abstr.) .
REED G. W., JR., and JOVANOVIC S. ( 1973) Fluorine in lunar samples: Implications concerning fluorapatite. Geochim. Cosmochim. Acta 37,1457-1471.
RUTHERFORD M. J., Hess P. C., and DANIEL G. H. ( 1974) Exper- imental liquid line of descent and liquid immiscibility for basalt 70017.5th Proc. Lunar Sci. Conf, pp. 569-583.
RYDER G. ( 1976) Lunar sample 15405: Remnant of a KREEP basalt- granite differentiated pluton. Earth Planet. Sci. Lett. 29,255-268.
SHERVAIS J. W., TAYLOR L. A., LAUL J. C., and SMITH M. R. ( 1984) Pristine highland clasts in consortium breccia 14305: Petrology and geochemistry. Proc. 15th Lunar Planet. Sci. ConjI;J. Geophys. Res. 89, C25-C40 (suppl.). Correction to Proc. 15th Lunar Planet. Sci. Co& Part 2. J. Geophys. Res. 90, C844 (suppl.).
SNYDER G. A., TAYLOR L. A., LIU Y.-G., and SCHMITT R. A. ( 1992) Petrogenesis of the western highlands of the Moon: Evidence from

4094 B. L. Jolliff et al.
a diverse group of whitlockite-rich rocks from the Fra Mauro For- WARREN P. H., TAYLOR G. J., KEIL K., KALLEMEYN G., SHIRLEY mation. Proc. Lunar Planet. Sci. 22, 399-416. D. N., and WAS~ON J. T. ( 1983) Seventh foray: Whitlockite-rich
STORMER J. C. and CARMICHAEL 1. S. E. ( 197 1) Fluorine-hydroxyl lithologies, a diopside bearing troctolitic anorthosite, felroan an- exchange in apatite and biotite: A potential igneous geothermom- orthosites, and KREEP. Proc. 14th Lunar Planet Sci. Co& J. eter. Co&b. Mineral. Petrol. 31, 12 I - I3 I. Geophys. Rex Ss, B I5 1 -B 164.
STRECKEISEN A. ( 1976) To each plutonic rock, its proper name. WATSON E. B. ( 1979) Apatite saturation in basic to intermediate Earth Sci. Rev. 12, I-33. magmas. Geophys. Res. Lett. 6,937-940.
TAYLOR G. J., WARNER R. D., KEIL K., MA M.-S., and SCHMITT WATSON E. B. and GREEN T. H. ( 1981) Apatite/liquid partition R. A. ( 1980) Silicate liquid immiscibility, evolved lunar rocks, coefficients for the rare earth elements and strontium. Eurth Planet. and the formation of KREEP. In Proc. Conf Lunar Highlands Sci. Lett. 56, 405-42 1. Crust (ed. J. J. PAPIKE and R. B. MERRILL), pp. 339-352. YOUNG E. F., MYERS A. T., MUNSON E. L., and CONKLIN N. M.
WARREN P. H. ( 1989) KREEP: Major-element diversity, tmce-ele- ( 1969) Mineralogy and geochemistry of fluorapatite from Cerro ment uniformity (almost). In Workshop on Moon in Transition: De Mercado, Dumngo, Mexico. USGS Prof: Paper 650-D. pp. Apollo 14, KREEP. and Evolved Lunar Rocks; LPI Tech. Rept. D84-D93. 89-03, pp. 149-153. LPI. ZINNER E. and CROZAZ G. ( 1986) A method for the quantitative
WARREN P. H. and WASSON J. T. ( 1979) The origin of KREEP. measurement of rare earth elements in the ion microprobe. Intl. Rev. Geophys. Space Phys. 17, 73-88. J. Mass Spectr. Ion Proc. 69, 17-38.