particulate matter source emission testing · particulate matter source emission testing craig...
TRANSCRIPT
Particulate Matter Source Emission Testing
Craig Thiry and Kevin Crosby The Avogadro Group, LLC
Oregon – California - Arizona
Source Emissions Testing and Emissions Specialists
Cemtek Users Group Conference 2012

The Need for Testing PM2.5, PM10 Total PM or Filterable PM
Compliance with various regulations • Permit Limits – driven by NSR, PSD • MACT or NSPS emission limits • Emission Factors for Quarterly Reporting
(factors input to DAHS to calculate emissions) • Correlation Tests for PMCEMS or PMCPMS
(filterable PM only – what’s particles in the stack)
Data for Future Needs • Baseline data for future permitting • Emission inventories and inputs to AQ models
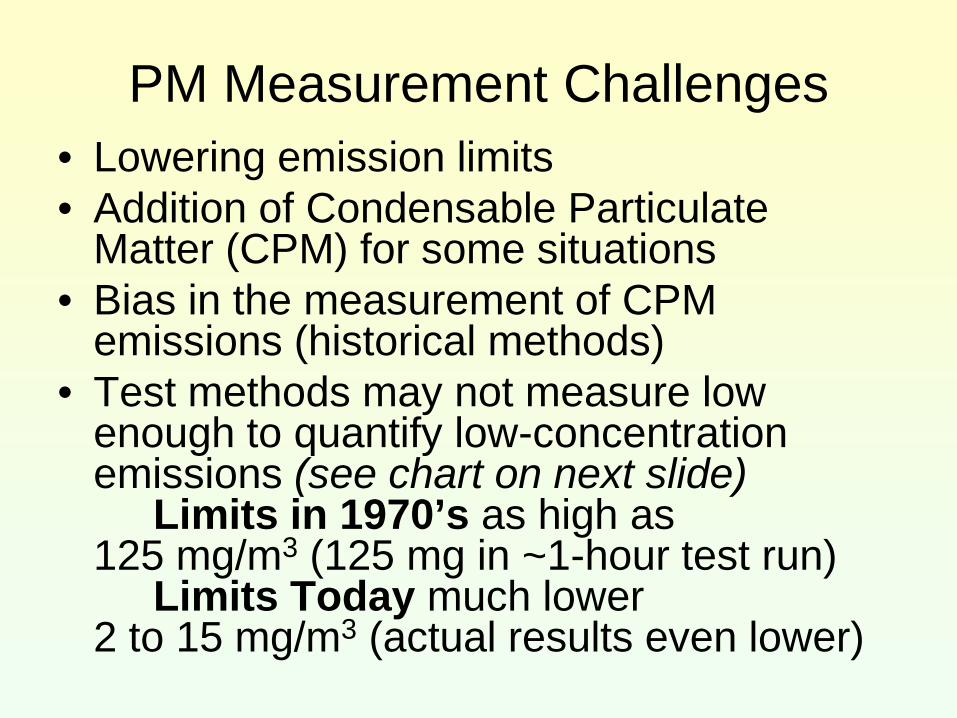
PM Measurement Challenges • Lowering emission limits • Addition of Condensable Particulate
Matter (CPM) for some situations • Bias in the measurement of CPM
emissions (historical methods) • Test methods may not measure low
enough to quantify low-concentration emissions (see chart on next slide) Limits in 1970’s as high as 125 mg/m3 (125 mg in ~1-hour test run) Limits Today much lower 2 to 15 mg/m3 (actual results even lower)

Changing Emission Limits
0 0.01 0.02 0.03 0.04 0.05 0.06 0.07 0.08 0.09
0.1
lb/MMBtu
NSPS (FPM only) 1970’s – first 2 bars here
and NSR in Calif (FPM + CPM) since 1980’s
What are we trying to Measure?
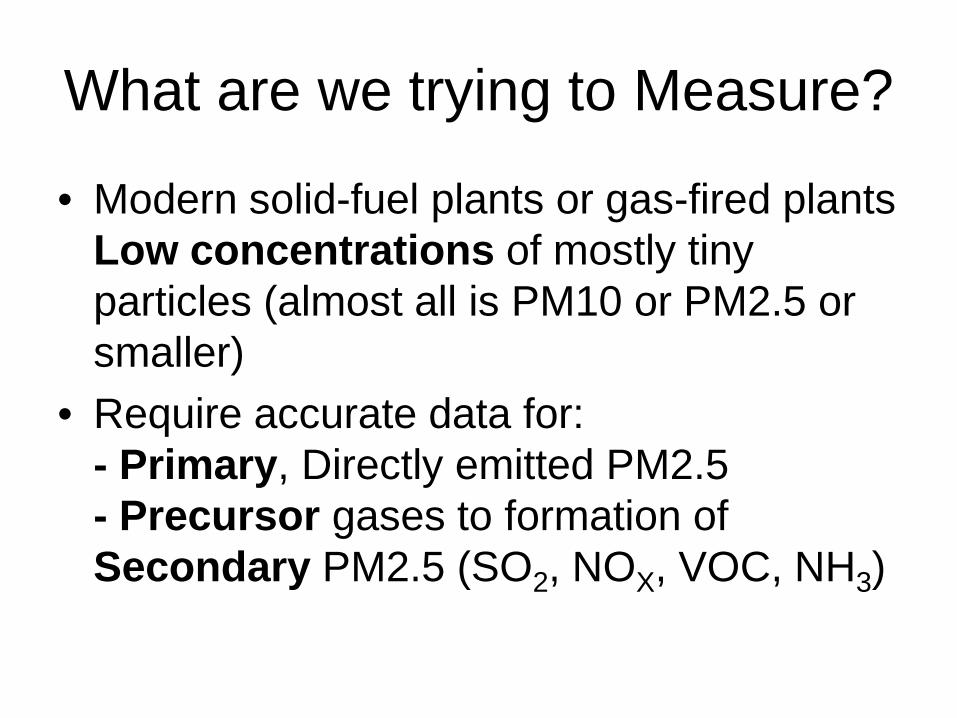
• Modern solid-fuel plants or gas-fired plants Low concentrations of mostly tiny particles (almost all is PM10 or PM2.5 or smaller)
• Require accurate data for: - Primary, Directly emitted PM2.5 - Precursor gases to formation of Secondary PM2.5 (SO2, NOX, VOC, NH3)

What are we trying to measure? Primary Particulate Matter
P G
P G
G→C P
P G
G→S P
P C
C P
P
Gaseous smog (O3) ↑
Ambient Monitor – collects all P C &S
Primary PM2.5 Emissions - Particles - Condensable PM from some Gases just after release to atmosphere
Standard stack tests – Easily measure Particles and Gases at stack conditions
Photochemistry – other Gases (precursors) to Secondary PM2.5 and to gaseous smog (ozone, etc.)
But we must measure Primary Emissions - Particles and Condensable Particles - Gases kept separate as Precursors (use models to predict Secondary PM2.5 & smog)
G G
G G
G→smog
S S G G→S
G
Ambient PM2.5 commonly mostly secondary, and this determines NAAQS attainment
G→S
S

Typical sampling arrangement

PM Sampling Apparatus Diagram In-Stack Filter and Impingers
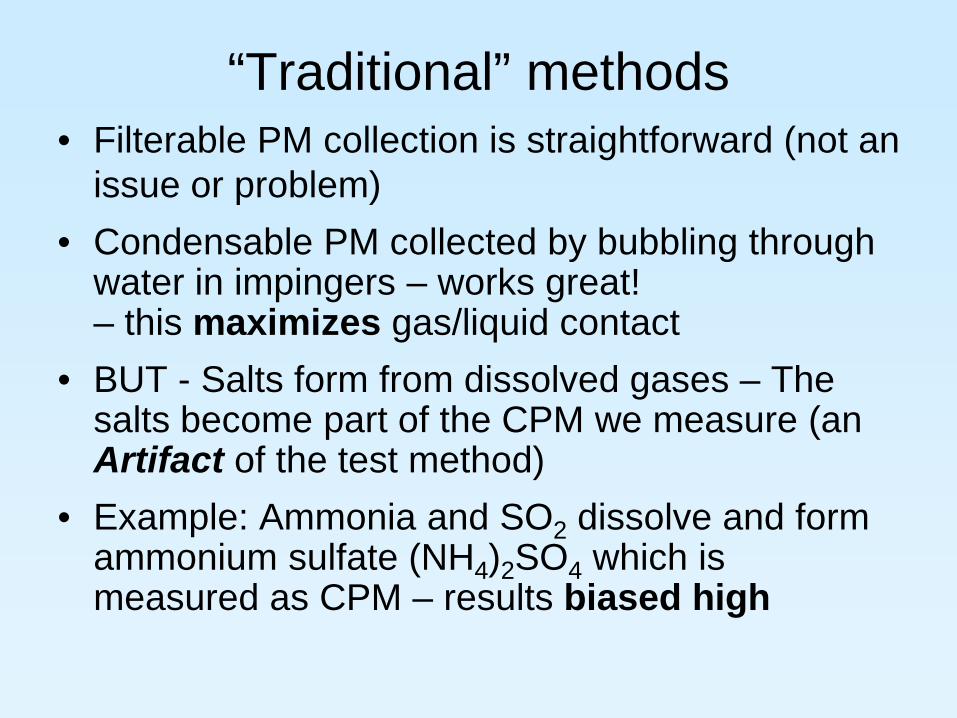
“Traditional” methods • Filterable PM collection is straightforward (not an
issue or problem) • Condensable PM collected by bubbling through
water in impingers – works great! – this maximizes gas/liquid contact
• BUT - Salts form from dissolved gases – The salts become part of the CPM we measure (an Artifact of the test method)
• Example: Ammonia and SO2 dissolve and form ammonium sulfate (NH4)2SO4 which is measured as CPM – results biased high
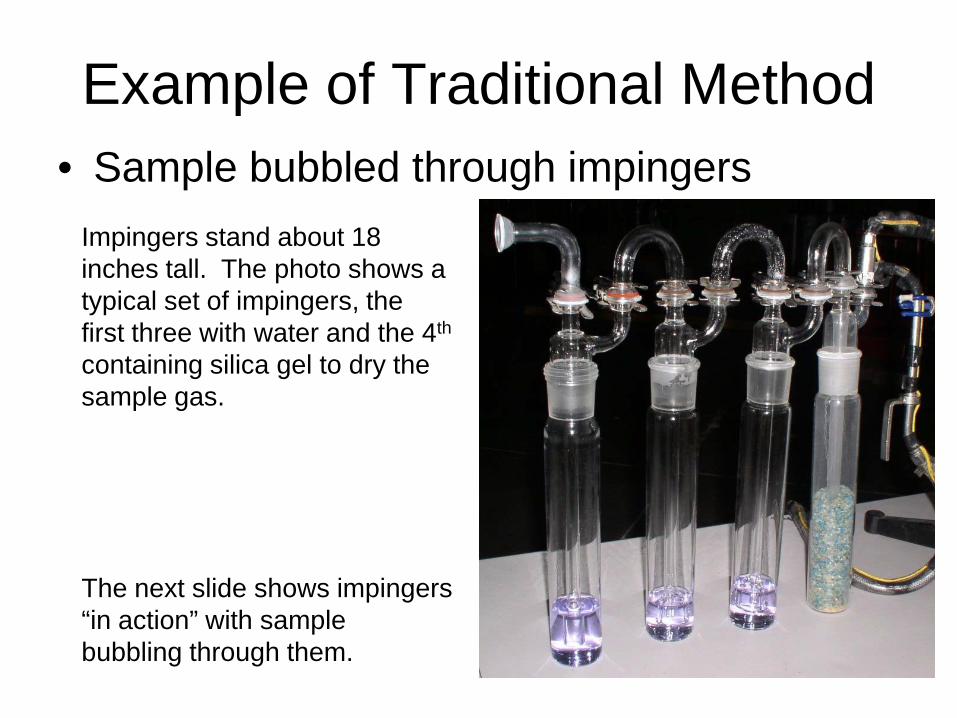
Example of Traditional Method • Sample bubbled through impingers
Impingers stand about 18 inches tall. The photo shows a typical set of impingers, the first three with water and the 4th containing silica gel to dry the sample gas. The next slide shows impingers “in action” with sample bubbling through them.

MAXIMIZED GAS-LIQUID CONTACT
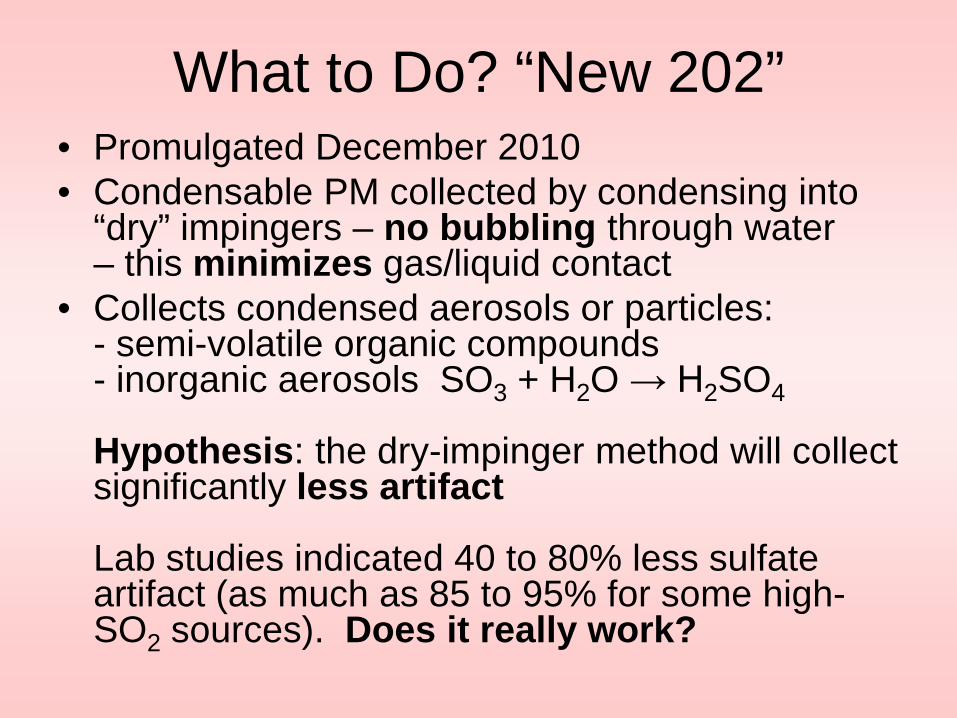
What to Do? “New 202” • Promulgated December 2010 • Condensable PM collected by condensing into
“dry” impingers – no bubbling through water – this minimizes gas/liquid contact
• Collects condensed aerosols or particles: - semi-volatile organic compounds - inorganic aerosols SO3 + H2O → H2SO4 Hypothesis: the dry-impinger method will collect significantly less artifact Lab studies indicated 40 to 80% less sulfate artifact (as much as 85 to 95% for some high-SO2 sources). Does it really work?
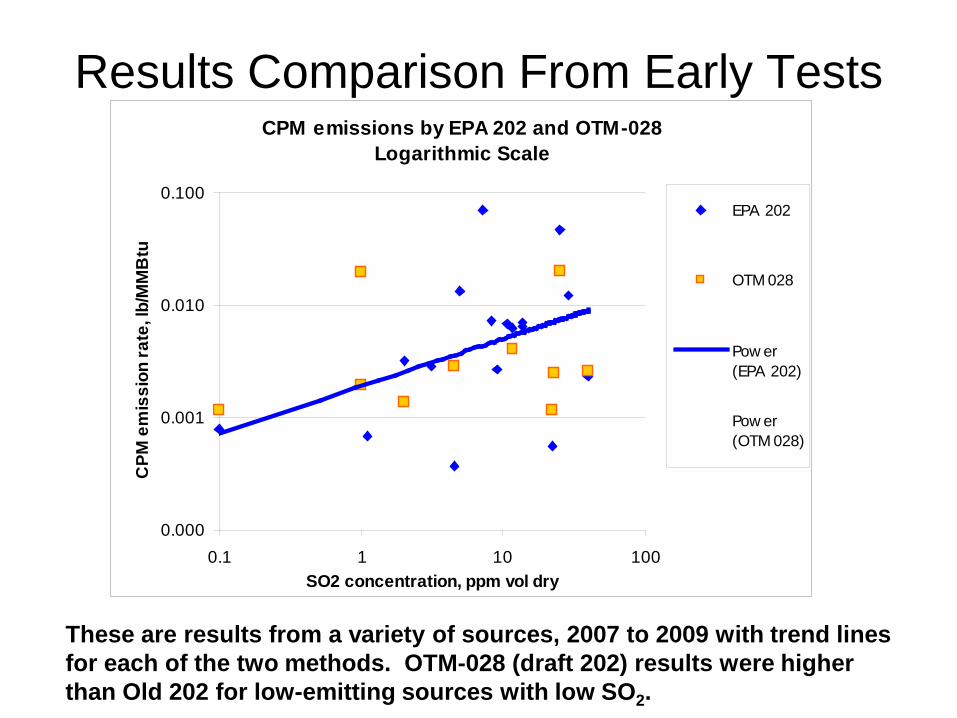
Results Comparison From Early Tests
These are results from a variety of sources, 2007 to 2009 with trend lines for each of the two methods. OTM-028 (draft 202) results were higher than Old 202 for low-emitting sources with low SO2.
CPM emissions by EPA 202 and OTM-028Logarithmic Scale
0.000
0.001
0.010
0.100
0.1 1 10 100SO2 concentration, ppm vol dry
CPM
em
issi
on ra
te, l
b/M
MB
tu
EPA 202
OTM 028
Pow er(EPA 202)
Pow er(OTM 028)
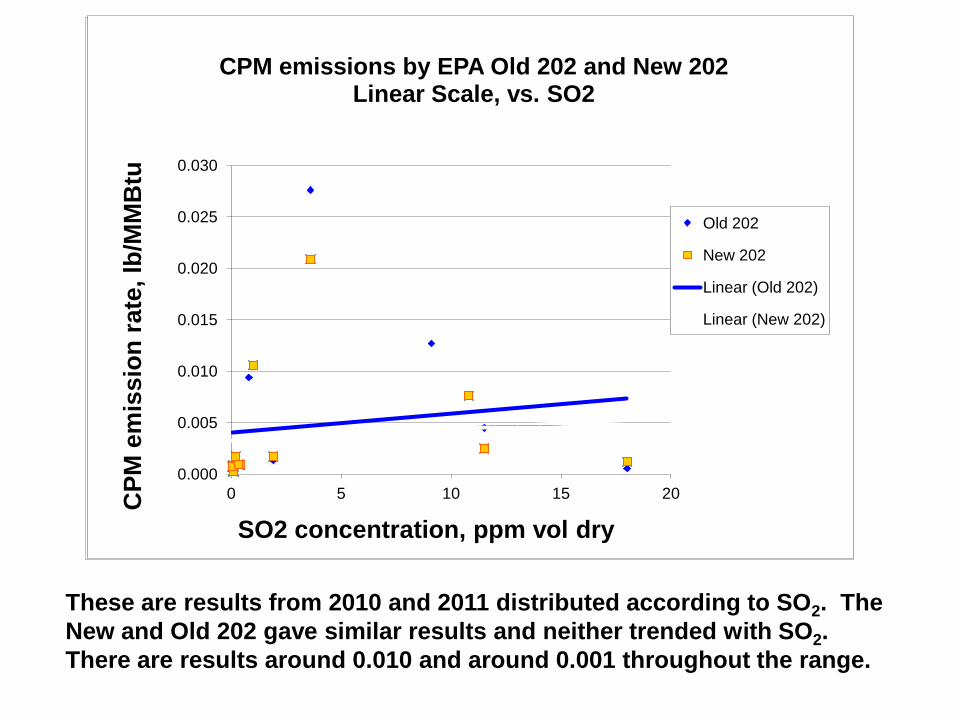
These are results from 2010 and 2011 distributed according to SO2. The New and Old 202 gave similar results and neither trended with SO2. There are results around 0.010 and around 0.001 throughout the range.
CPM emissions by EPA Old 202 and New 202Logarithmic Scale
0.000
0.001
0.010
0.100
0.1 1 10 100
SO2 concentration, ppm vol dry
CPM
em
issi
on ra
te, l
b/M
MB
tu
Old 202
New 202
Pow er (Old202)Pow er (New202)
0.000
0.005
0.010
0.015
0.020
0.025
0.030
0 5 10 15 20 CPM
em
issi
on ra
te, l
b/M
MB
tu
SO2 concentration, ppm vol dry
CPM emissions by EPA Old 202 and New 202 Linear Scale, vs. SO2
Old 202
New 202
Linear (Old 202)
Linear (New 202)
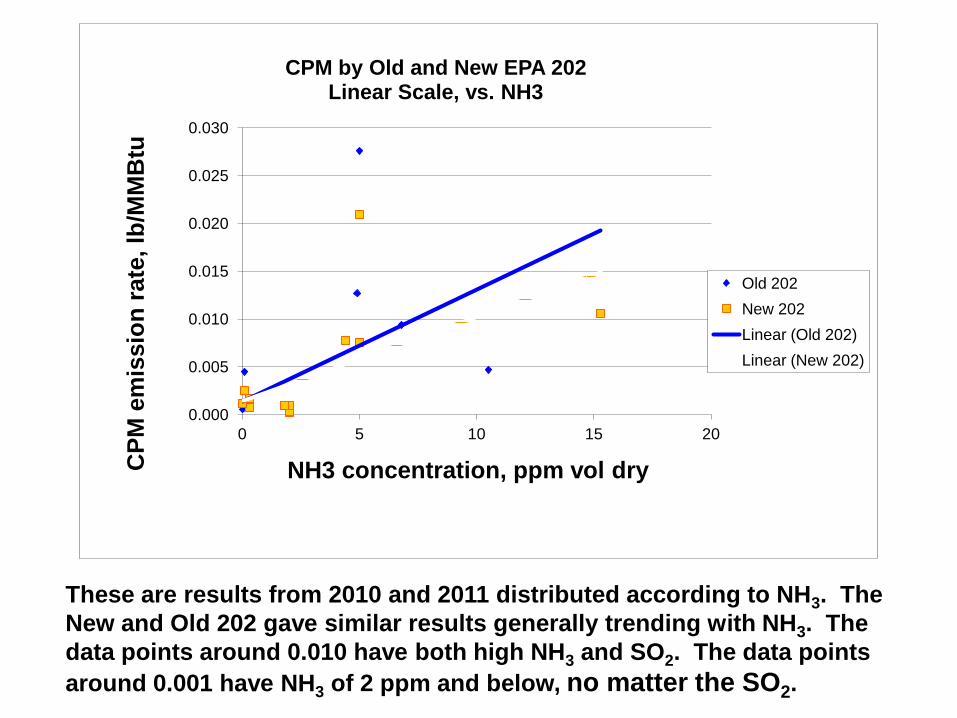
These are results from 2010 and 2011 distributed according to NH3. The New and Old 202 gave similar results generally trending with NH3. The data points around 0.010 have both high NH3 and SO2. The data points around 0.001 have NH3 of 2 ppm and below, no matter the SO2.
0.000
0.005
0.010
0.015
0.020
0.025
0.030
0 5 10 15 20
CPM
em
issi
on ra
te, l
b/M
MB
tu
NH3 concentration, ppm vol dry
CPM by Old and New EPA 202 Linear Scale, vs. NH3
Old 202 New 202 Linear (Old 202) Linear (New 202)
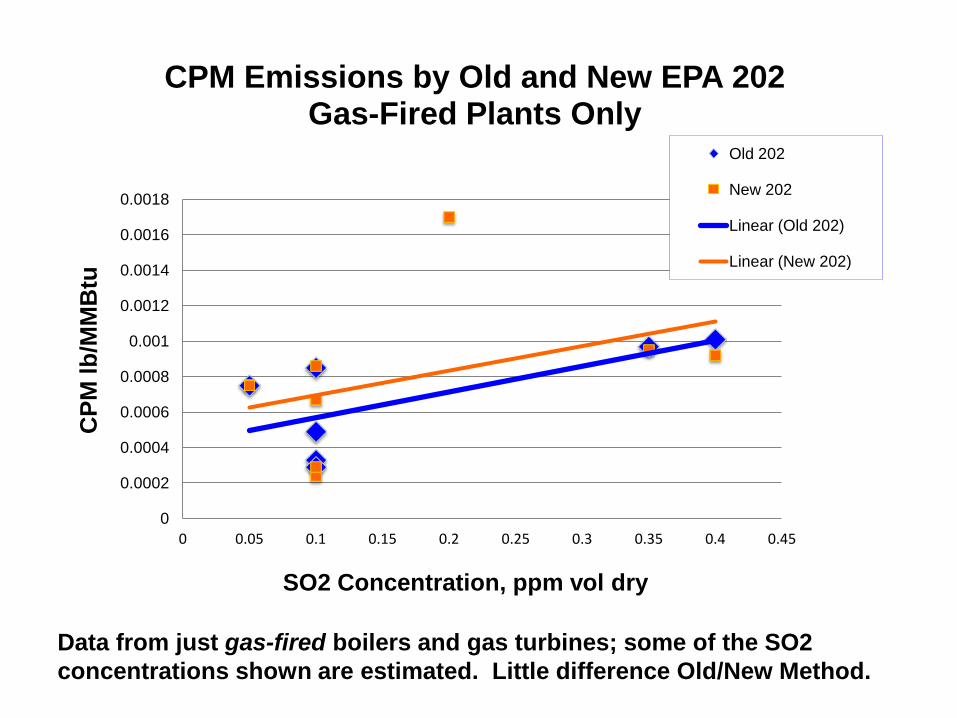
Data from just gas-fired boilers and gas turbines; some of the SO2 concentrations shown are estimated. Little difference Old/New Method.
0
0.0002
0.0004
0.0006
0.0008
0.001
0.0012
0.0014
0.0016
0.0018
0 0.05 0.1 0.15 0.2 0.25 0.3 0.35 0.4 0.45
CPM
lb/M
MB
tu
SO2 Concentration, ppm vol dry
CPM Emissions by Old and New EPA 202 Gas-Fired Plants Only
Old 202
New 202
Linear (Old 202)
Linear (New 202)
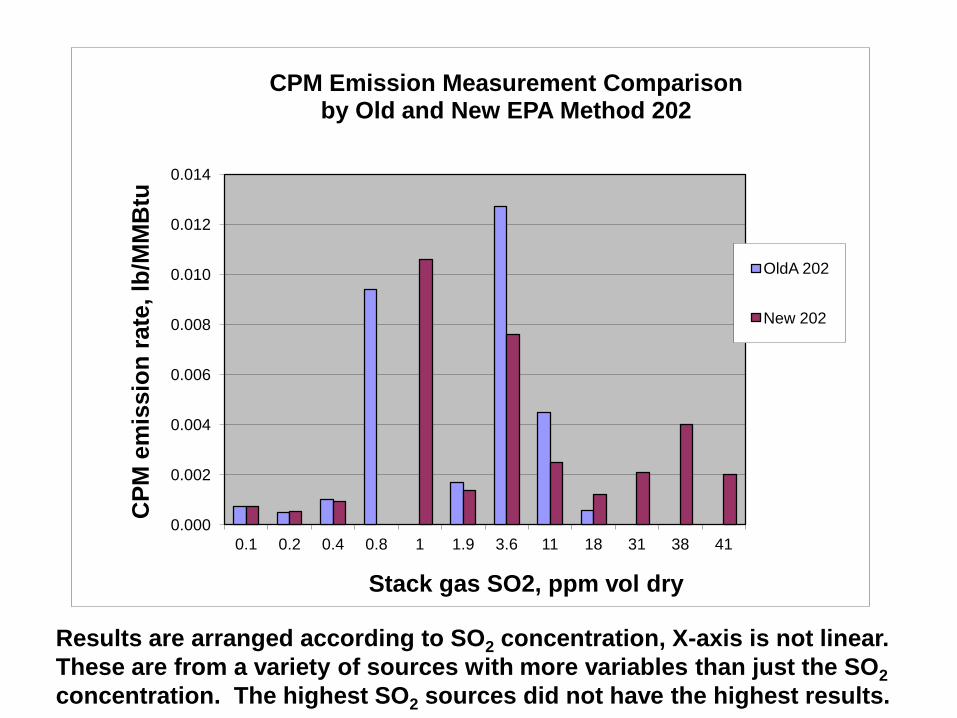
Results are arranged according to SO2 concentration, X-axis is not linear. These are from a variety of sources with more variables than just the SO2 concentration. The highest SO2 sources did not have the highest results.
0.000
0.002
0.004
0.006
0.008
0.010
0.012
0.014
0.1 0.2 0.4 0.8 1 1.9 3.6 11 18 31 38 41
CPM
em
issi
on ra
te, l
b/M
MB
tu
Stack gas SO2, ppm vol dry
CPM Emission Measurement Comparison by Old and New EPA Method 202
OldA 202
New 202
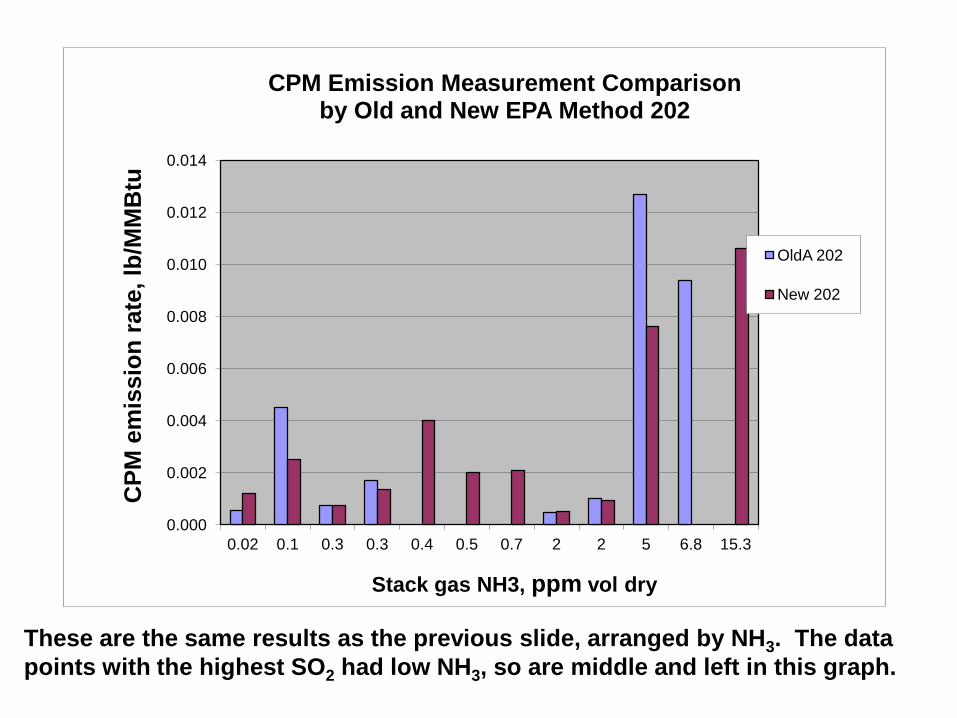
These are the same results as the previous slide, arranged by NH3. The data points with the highest SO2 had low NH3, so are middle and left in this graph.
0.000
0.002
0.004
0.006
0.008
0.010
0.012
0.014
0.02 0.1 0.3 0.3 0.4 0.5 0.7 2 2 5 6.8 15.3
CPM
em
issi
on ra
te, l
b/M
MB
tu
Stack gas NH3, ppm vol dry
CPM Emission Measurement Comparison by Old and New EPA Method 202
OldA 202
New 202

Progress so far
• Method can easily cost a 20% premium over the old method
• Equipment improvements may eventually save labor
• Lab technique will always take more labor
The Hypothesis is NOT PROVEN by our data – there is only slightly less artifact for low emitters
• Initial tests often had results higher than the old method
• Improved technique and reagents have solved this problem

Can we Improve the Situation?
• Reduce Ammonia Slip (below about 2 ppm) • Correct the results for ammonium salts
- some have suggested using controlled condensation test results for the inorganic fraction
• Use a Dilution method (measure filterable and condensable together) - EPA “conditional test method” CTM-039

Controlled Condensation • ASTM is working on a standard method • EPA has accepted NCASI Method 8A for some uses
(CTM-013) • CC accurately measures SO3 and SO2 from almost
any type of source (even when NH3 is high) • SO3 would count as CPM; SO2 would not! • Example – Gas Turbine SO3 ~ 15 to 50% of Total
SOX – so using this might reduce the inorganic CPM significantly from what we measure with Old or New 202. Would be even more beneficial for Coal-fired power plants with SCR.
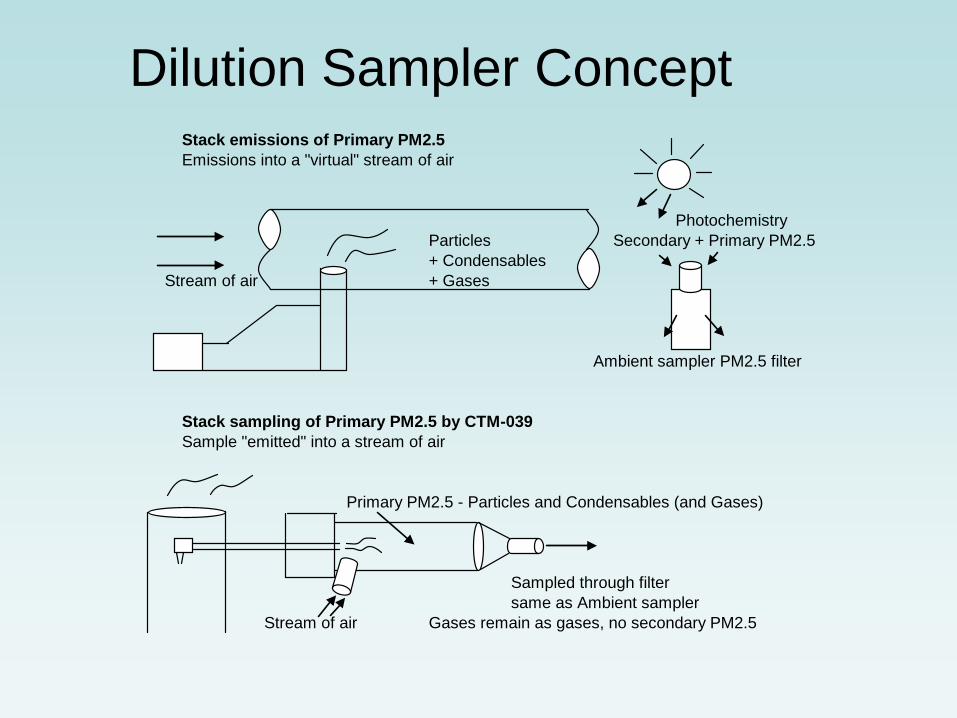
Dilution Sampler Concept Stack emissions of Primary PM2.5Emissions into a "virtual" stream of air
PhotochemistryParticles Secondary + Primary PM2.5+ Condensables
Stream of air + Gases
Ambient sampler PM2.5 filter
Stack sampling of Primary PM2.5 by CTM-039Sample "emitted" into a stream of air
Primary PM2.5 - Particles and Condensables (and Gases)
Sampled through filtersame as Ambient sampler
Stream of air Gases remain as gases, no secondary PM2.5
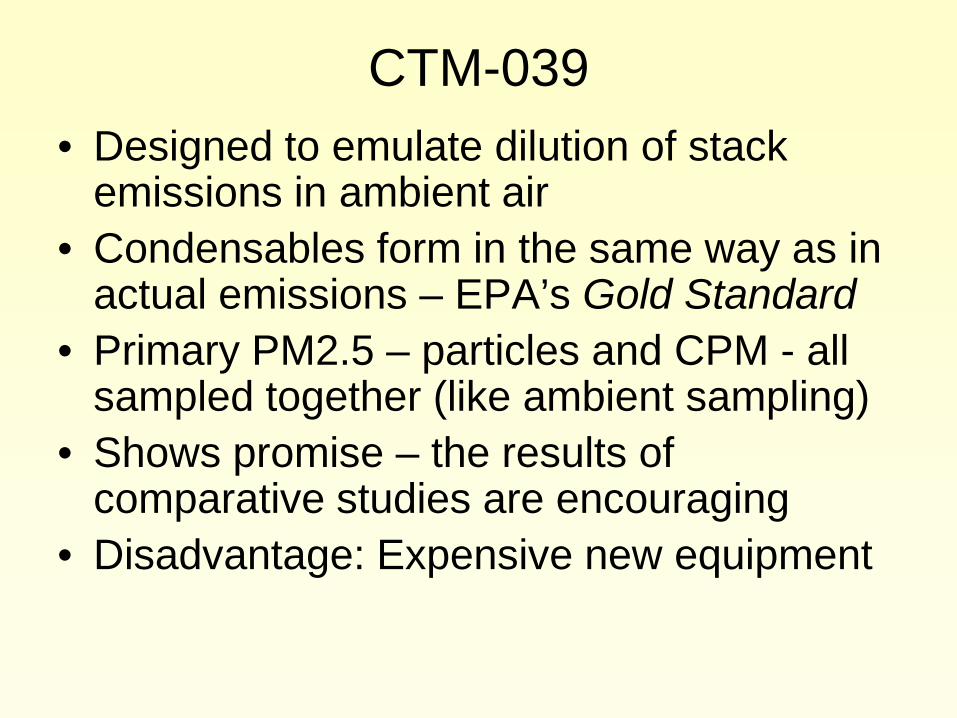
CTM-039 • Designed to emulate dilution of stack
emissions in ambient air • Condensables form in the same way as in
actual emissions – EPA’s Gold Standard • Primary PM2.5 – particles and CPM - all
sampled together (like ambient sampling) • Shows promise – the results of
comparative studies are encouraging • Disadvantage: Expensive new equipment
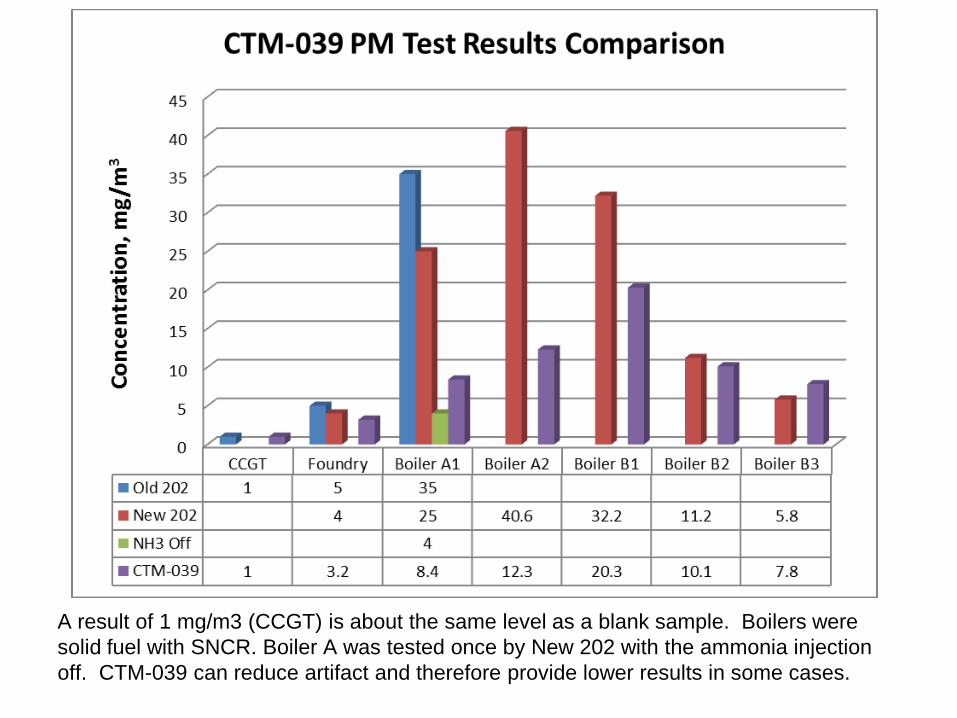
A result of 1 mg/m3 (CCGT) is about the same level as a blank sample. Boilers were solid fuel with SNCR. Boiler A was tested once by New 202 with the ammonia injection off. CTM-039 can reduce artifact and therefore provide lower results in some cases.

Conclusions • The Hypothesis is true only in certain cases, usually at
higher concentrations • New 202 is sometimes a slight improvement from the
Old 202 for low-concentration sources • New 202 might not be worth its extra cost
- except in some cases (sometimes every little bit helps) • Other alternatives (such as CTM-039) will cost even
more - but may provide more representative results for some cases
• Results will depend on which gases are present (NH3, SO2, SO3, HCl) and in what relative concentrations
• The Method used will define the Results • Quality Testing is critical!

Questions ???
Craig Thiry Business Development Director
Source Emissions Testing and Emissions Specialists