particle size reduction - sa trade · pdf fileparticle size reduction leland mckinney...
TRANSCRIPT

Particle Size Reduction
Leland McKinney
Department of Grain Science & Industry
Kansas State University

How Do We Define Particle Size?

How Do We Define Particle Size?
The Use of Different Procedures…

How Do We Define Particle Size?
The Effects of Flow Agents…

Costs Associated with Particle Size
Reduction
0
2
4
6
8
10
0
1
2
3
4
1000 800 600 400Particle Size, microns
En
erg
y C
on
su
mp
tio
n,
kW
h/t
Pro
du
ctio
n R
ate
, t/h
aWondra, et al., 1992
Production Rate
Energy Consumption

How do we recover our costs
to grind?

Particle Size Effects on Diet ME in
Primiparous Sows
3,399
3,5723,601
3,745
3,300
3,600
3,900
1,200 900 600 400
ME
, kc
al/
kg
Particle Size, microns
Wondra et al., 1995

40
42
44
46
48
50
52
54
56
58
60
300 500 700 900 1100 1300
Particle Size (microns)
An
gle
of R
ep
ose
Particle Size x Mill Type x Added Fat (P<0.05)
Flowability
Goodband et al., 2006
Particle Size Uniformity Effects on
Diet Flowability
0% added fat, hammer-milled
3% added fat, hammer-milled
6% added fat, hammer-milled
0% added fat, roller-milled
3% added fat, roller-milled
6% added fat, roller-milled

Goodband et al., 2006
Flowability
Particle Size Effects on Diet
Flowability
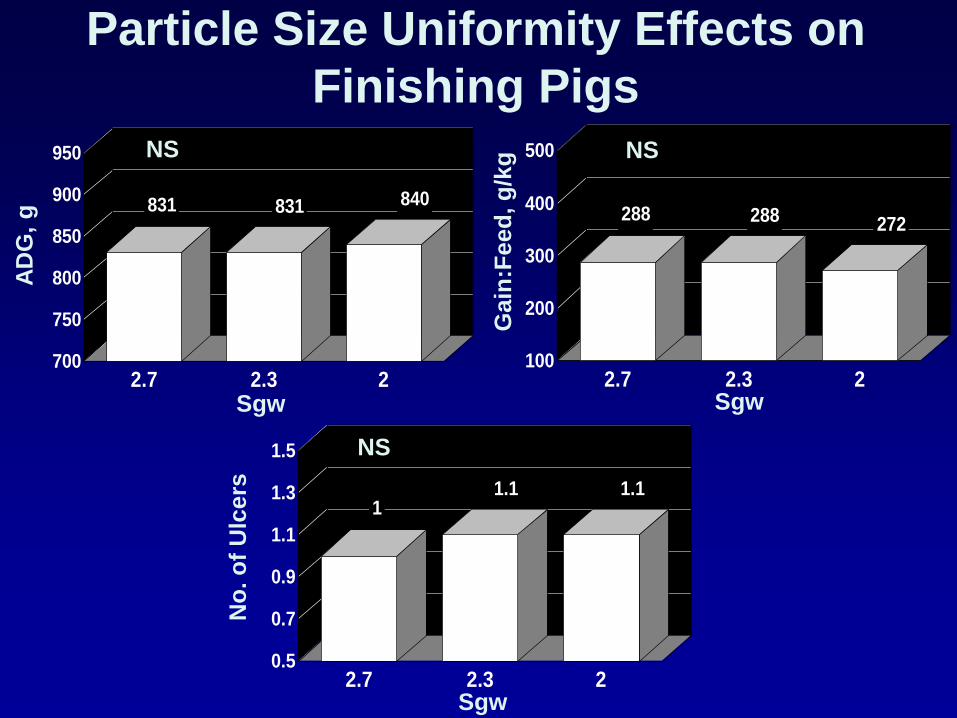
Particle Size Uniformity Effects on
Finishing Pigs
831 831 840
700
750
800
850
900
950
2.7 2.3 2
288 288 272
100
200
300
400
500
2.7 2.3 2Sgw
AD
G,
g
Sgw
Gain
:Feed
, g
/kg
1
1.1 1.1
0.5
0.7
0.9
1.1
1.3
1.5
2.7 2.3 2Sgw
No
. o
f U
lcers
NS NS
NS

What About the Optimum Particle
Size for Poultry?

Particle Size Effects on Broilers
30.0
33.5
37.0
900 700 500 300
Particle size (microns)
AD
G (
g)
Sorghum
Corn
620
655
690
900 700 500 300
Corn
Sorghum
Ga
in:F
eed
(g
/kg
)

Sifter
A Different Approach…

61.9 61.0
56.1
51.6
47.1
30
50
70
0 25 50 75 100
107.8105.4
104.1
96.8
90.5
80
95
110
0 25 50 75 100
1.761.73
1.85
1.91.93
1.6
1.8
2
0 25 50 75 100
Clark, 2006
% Cracked corn added post-pelleting
AD
G,
g
Linear P<.001
% Cracked corn added post-pelleting
% Cracked corn added post-pelleting
AD
FI, g
FC
R
The Effects of Adding Cracked Corn to
Broiler Diets Post-Pelleting

2.68 2.68 2.69 2.66
0
1
2
3
4
0 15 25 35
4.46 4.42 4.43 4.44
2
3
4
5
6
0 15 25 35
1.665
1.65 1.648
1.669
1.62
1.64
1.66
1.68
0 15 25 35Dozier et al., 2006
NS NS
NS
% Cracked corn added post-pelleting
% Cracked corn added post-pelleting
% Cracked corn added post-pelleting
The Effects of Adding Cracked Corn to Broiler Diets Post-Pelleting
AD
G,
kg
AD
FI, k
g
FC
R

7.7 7.6 7.7 7.8
5
6
7
8
9
10
0 25,25,25 10,20,30 20,30,40
1.883 1.895 1.896 1.888
1.6
1.7
1.8
1.9
2
0 25,25,25 10,20,40 20,30,40Dozier and Behnke, 2007
% Cracked corn added post-pelleting
BW
G,
lbs
% Cracked corn added post-pelleting
FC
R
NS
NS
The Effects of Adding Cracked Corn to Broiler Diets Post-Pelleting

94.0395.41
94.1 94.92
80
85
90
95
100
0 25,25,25 10,20,30 20,30,40
5.762 5.615 5.65 5.812
2
4
6
8
0 25,25,25 10,20,30 20,30,40Dozier and Behnke, 2007
% Cracked corn added post-pelleting
Liv
ab
ilit
y,
%
Carc
as
s W
t, l
bs
% Cracked corn added post-pelleting
NS
NS
The Effects of Adding Cracked Corn to Broiler Diets Post-Pelleting

0.176 0.176 0.183 0.181
0
0.05
0.1
0.15
0.2
0.25
0 25,25,25 10,20,30 20,30,40
1.768 1.717 1.703 1.776
0
0.5
1
1.5
2
2.5
3
0 25,25,25 10,20,30 20,30,40Dozier and Behnke, 2007
Ab
. F
at
Wt,
lb
s
The Effects of Adding Cracked Corn to Broiler Diets Post-Pelleting
Bre
ast
Meat
Wt,
lb
s
NS
NS

Implications
• 4000 T/Wk total pelleting capacity
• Corn makes up 70% of the diet (2,800 T/Wk)
• Modify system to add 35% of the corn post-
pelleting (980 T/Wk)
• 4000 T/Wk – 980 T/Wk = 3,020 T/Wk reduction
Reduce operating hours by 24.5%
Increase total weekly feed production by 32%

METHODS OF GRINDING
Hammermill
• Impact
• Attrition
Roller Mill
• Shear
• Compression

Hammermill Grinding
Screen
Disk Plate Hammers
Inlet

PrimaryDestructionZone
Acceleration Zone
FullHammerTip Speed Zone
Contact Point
"Regrind Chamber"
"Flow Director"
Hammermill Grinding
Impact
Attrition
Utilizing different sized screen?

• Feeder
• Tip Speed
• Screen Area
• Hammer Pattern
• Hammer Position
• Air Assist System
Factors Affecting Hammermill
Performance

Feeders

Feeders
Rotary Pocket Feeder Screw Feeder
Uniform feed rate across the entire grinding surface

Results of over or uneven feeding a
hammermill
Groves from swinging hammer
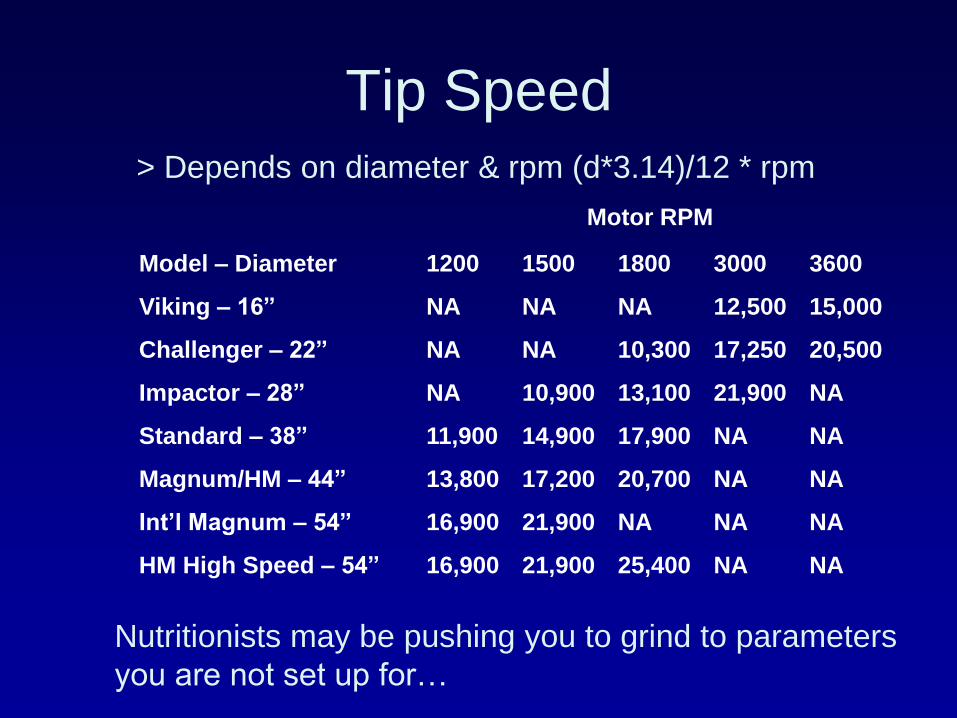
Tip Speed > Depends on diameter & rpm (d*3.14)/12 * rpm
Nutritionists may be pushing you to grind to parameters
you are not set up for…
Model – Diameter 1200 1500 1800 3000 3600
Viking – 16” NA NA NA 12,500 15,000
Challenger – 22” NA NA 10,300 17,250 20,500
Impactor – 28” NA 10,900 13,100 21,900 NA
Standard – 38” 11,900 14,900 17,900 NA NA
Magnum/HM – 44” 13,800 17,200 20,700 NA NA
Int’l Magnum – 54” 16,900 21,900 NA NA NA
HM High Speed – 54” 16,900 21,900 25,400 NA NA
Motor RPM

Hammers

Hammers

The hammer pattern needs to
provide equal loading on the pins
Hammer Pattern
2 – 3 HP/Hammer for coarse grind
< 1 HP/Hammer for very fine

Screen Area
Broken at 28/06/02: 11.00 Incorrect screen hole stagger can lead to
wear between the holes and premature
screen failure
Ticker screens = increase life =
reduced throughput
More holes = reduced life =
greater throughput

Hammermill Maintenance
Screens
•One set of hammers should wear out 2- 4 sets of screens
•Replacement screens should be equal thickness and open area as the originals
•Screen hole stagger should be correct

Hammermill Maintenance
Screens
• Creased or corrugated screen indicates
wrong stagger or incorrect hammer pattern
• Screens may be turned and rerolled to use
all edges
• Screens should be replaced when edges
dull, do not wait for screens to “blow out”

Air Assist System
• Air required is 1 ½ - 2
cfm of air per square
inch of hammermill
screen area.
• Air assist forms
negative pressure
inside hammermill.

Vertical shaft hammermill
Hammermill Grinding

Roller Mill Grinding Inlet
Rolls
2-high
3-high

Roller Mill Grinding
Corrugations Patterns Top Middle Bottom
Cracking Corn
Small grains
( > 700 µ)
Corn ( > 700 µ)
Corn ( < 600 µ)
Set-up depends on material,
which varies
5-5
6-6
5-5 10-12
4-5 8-10 12-14
12-14

Conditions to Avoid
Material accumulating in the nip of the top rolls
Bottom rolls too far open
Top rolls too close
Work not evenly divided between top and bottom
Roller Mill Grinding

Normal Operation
Material passing directly through the nip of the top pair
Work evenly divided between and bottom rolls
Top pair open slightly, feeding evenly from end to end
Bottom pair "completing" the grind
Roller Mill Grinding

Rolls in Parallel
Rolls out of Parallel
Rolls in Tram
Rolls out of
Tram
Roll Tram and Parallel
Roller Mill Grinding
Uneven roll wear
Inconsistent grinding

Advantages
• Ability to grind a wide variety of materials
• Ease of maintenance, less maintenance cost (quick
change hammers)
• Versatility
• Less complicated to operate (automation)
• Less initial cost
Hammermill Summary
Disadvantages
• Energy consumption (Attrition)
• Noise and dust pollution
• Heat generation and moisture loss (shrink)

• Electrical efficiency (shear)
• Less maintenance (↑ difficulty, ↑ cost)
• Less dust pollution
Roller Mill Summary Advantages
Disadvantages
• Higher initial cost
• When maintenance is needed it is expensive
• Can not effectively grind fibrous materials
• Reduced throughput at small particle sizes
• Produces lower BD material
