partial oxidation of ethanol on vanadia catalysts on ...w0.rz-berlin.mpg.de/hjfdb/pdf/628e.pdf ·...
TRANSCRIPT

Journal of Catalysis 296 (2012) 120–131
Contents lists available at SciVerse ScienceDirect
Journal of Catalysis
journal homepage: www.elsevier .com/locate / jcat
Partial oxidation of ethanol on vanadia catalysts on supporting oxideswith different redox properties compared to propane
Benjamin Beck a, Manuel Harth b, Neil G. Hamilton c, Carlos Carrero a, John J. Uhlrich d,Annette Trunschke c, Shamil Shaikhutdinov d, Helmut Schubert b, Hans-Joachim Freund d,Robert Schlögl c, Joachim Sauer e, Reinhard Schomäcker a,⇑a Technical University Berlin, Department of Chemistry, Straße des 17. Juni 124, 10623 Berlin, Germanyb Technical University Berlin, Department of Material Science, Hardenbergstraße 40, 10623 Berlin, Germanyc Fritz-Haber-Institute of the Max-Planck Society, Department of Inorganic Chemistry, Faradayweg 4-6, 14195 Berlin, Germanyd Fritz-Haber-Institute of the Max-Planck Society, Department of Chemical Physics, Faradayweg 4-6, 14195 Berlin, Germanye Institute of Chemistry, Humboldt University, Unter den Linden 6, 10099 Berlin, Germany
a r t i c l e i n f o
Article history:Received 10 July 2012Revised 8 September 2012Accepted 13 September 2012Available online 13 October 2012
Keywords:Oxidative dehydrogenationSupported vanadia catalystsEthanolPropaneBell–Evans–Polanyi
0021-9517/$ - see front matter � 2012 Elsevier Inc. Ahttp://dx.doi.org/10.1016/j.jcat.2012.09.008
⇑ Corresponding author.E-mail address: [email protected] (R. Sch
a b s t r a c t
The influence of the support material of vanadia catalysts on the reaction rate, activation energies, anddefect formation enthalpies was investigated for the oxidative dehydrogenation of ethanol and propane.Characterization by infrared absorption–reflection spectroscopy (IRAS), Raman and UV–vis spectroscopyverifies a high dispersion of vanadia for powder and thin-film model catalysts. The support effect of ceria,alumina, titania, and zirconia is reflected in activation energy, oxidative dehydrogenation (ODH) rate, andtemperature-programmed reductions (TPR) for both catalyst systems, ethanol and propane. Impendencespectroscopy and density functional theory (DFT) calculations were used to determine the defectformation enthalpy of the vanadyl oxygen double bond, providing the scaling parameter for a Bell–Evans–Polanyi relationship. On the basis of a Mars–van-Krevelen mechanism, an energy profile for theoxidative dehydrogenation is proposed.
� 2012 Elsevier Inc. All rights reserved.
1. Introduction
In the last two decades, vanadia-based catalysts have beenintensively studied for partial oxidation [1,2] or oxidative dehydro-genation (ODH) reactions [3,4]. They represent a worthwhile alter-native for the production of short alkenes like ethene and propene,because these reactions are exothermic and not thermodynami-cally limited. Olefins are fundamental raw materials for a lot ofindustrial processes such as the production of polypropylene, acry-lonitrile, and propylene oxide [5], whose demand underlies a stea-dy increase. Today, the major part of the ethene and propeneproduction is actually done by energy consuming steam crackingand thermal dehydrogenation processes, and it is reasonable tosuspect that these processes cannot cover the demand. At present,for the ODH of short alkanes, selectivity to the desired alkenes isnot satisfactory, because the products are prone to total oxidationby the catalysts.
In many studies, a strong impact of the support material on theactivity of the surface vanadyl species in various ODH reactions ofhydrocarbons and alcohols [1,3,6–9] has been reported. Attempts
ll rights reserved.
omäcker).
have been made to correlate the activity with a single globalparameter, the Sanderson electro negativity [1]. Some authors[3,6,8] assume that the influence of the support onto the reducibil-ity of the surface vanadia species controls the activity. However,the attempt to correlate the propane oxidation activity with thepeak maxima of H2-TPR experiments as a function of the supportmaterial [3,8,10] often leads to unsatisfactory results. Densityfunctional theory (DFT) calculations [11,12] suggest to use oxygendefect formation energies of supported vanadia as reactivitydescriptors [13,14]. For vanadia supported on ceria, DFT calcula-tions of oxygen defect formation energies have been used to ratio-nalize the observed increased formation rate of formaldehydecompared to vanadia on inert supports [15]. This is in the spiritof linear free energy relationship (Bell–Evans–Polanyi principle)[6,16], which have been successfully used to rationalize trends inthe catalytic activity of transition metals [1].
The aim of this work is to provide deeper insight into the natureof the support effect by comparison of defect formation energiesobtained through impedance spectroscopy with reaction data onpowder catalysts as well as by comparison with model systems.The oxidative dehydrogenation of propane, which we investigated[3] earlier, is not well suited as test reaction for catalyst propertiesbecause of the influence of consecutive reactions to the primary
B. Beck et al. / Journal of Catalysis 296 (2012) 120–131 121
ODH reaction, which have to be considered in the kinetic analysis.The latter cannot be neglected in detailed kinetic descriptions ofthe primary ODH reaction even at low reactant conversions. There-fore, we choose the partial oxidation of ethanol as probe reaction.This reaction runs with very high selectivity to the desired alde-hyde and is also very sensitive to the support material [2,17,18].
C2H5OHþ 0:5O2 ! C2H4OþH2O DRH ¼ �179 kJ=mol ð2Þ
C3H8 þ 0:5O2 ! C3H6 þH2O DRH ¼ �118 kJ=mol ð3Þ
In order to deduce the role of the support material on thereactivity of vanadia, vanadia was deposited in sub-monolayerquantities on alumina, zirconia, titania, and ceria as support mate-rials. The supported vanadia catalysts were characterized by UV–vis and Raman spectroscopy, temperature-programmed reduction(TPR), nitrogen adsorption, inductively coupled plasma opticalemission spectroscopy (ICP-OES), impedance spectroscopy andtested for their catalytic capabilities in ethanol dehydrogenationto acetaldehyde. For the investigation of the oxygen defect forma-tion as reactivity descriptor of the catalysts, the defect formationenergies were determined by impedance spectroscopy and com-pared to theoretical predictions.
Additionally, vanadia was deposited in sub-monolayerquantities on the surfaces of ceria and alumina thin films as modelsupports. The respective experimental model systems werestudied by temperature-programmed desorption (TPD) and infra-red absorption–reflection spectroscopy (IRAS) in order to elucidatestructure–reactivity relationships for ethanol oxidations at sys-tems where structure and morphology had been investigated pre-viously with the scanning tunneling microscope (STM) and provento be analogous. DFT has been applied to calculate oxygen defectformation energies for models of the different supported catalystsin order to demonstrate the significant differences between thetwo systems.
2. Experimental
2.1. Thin-film model catalysts
The experiments were performed in an ultrahigh vacuum (UHV)chamber with a base pressure of �5 � 10�10 mbar. The chamber isequipped with an IR spectrometer (Bruker IFS 66/vs), a differen-tially pumped quadrupole mass spectrometer (Hiden HAL 201),and a low energy electron diffraction/Auger electron spectroscopy(LEED/AES, from Specs). The single crystal substrates (Ru(0001)for the ceria films and NiAl(110) for the alumina films, both fromMateck) were spot-welded to two parallel Ta wires, which are inturn welded to two Ta rods used for resistive heating up to1300 K and also for cooling down to 100 K by filling a manipulatorrod with liquid nitrogen. The temperature is measured by a chro-mel–alumel thermocouple spot-welded to the underside of thecrystal.
The ca. 5 nm thick, well-ordered CeO2(111) films were grownas described elsewhere [19,20]. Briefly, the Ru(0001) substratewas cleaned with repeated cycles of ion sputtering and annealingin UHV at 1300 K. Then, the Ru substrate was precovered with oxy-gen at 700 K in 1 � 10�6 mbar O2 for 5 min. Ceria was evaporatedonto this surface in 1 � 10�6 mbar O2 from a tungsten crucible con-tained in an e-beam-assisted evaporator (EFM3 from Omicron).The film was oxidized at 980 K in 1 � 10�6 mbar O2 for 15 min,resulting in a film which showed a sharp (1.4 � 1.4)-Ru(0001)LEED pattern (not shown) with low background intensity charac-teristic for the crystalline CeO2(111) thin films [19].
The alumina films were grown using a well-established proce-dure on NiAl(110) [21,22]. The NiAl substrate was cleaned with
repeated cycles of sputtering and annealing in UHV at 1300 K for5 min. Then, �1200 L O2 (1 L = 1 � 10�6 Torr s) was dosed ontothe surface (1 � 10�6 mbar O2 for 20 min) at a temperature of550 K, followed by annealing in UHV at 1075 K for 5 min. This dos-ing and annealing cycle was then repeated in order to assure aclosed film. The sample exhibited the LEED pattern (not shown)and characteristic phonon (�865 cm�1) of the crystalline Al2O3/NiAl(110) film [21].
For both films, vanadia particles were deposited onto the surfaceat two different sub-monolayer coverages. The sample was biasedat the same potential as the source rod during evaporation in orderto prevent the acceleration of ions toward the sample. The evapora-tions were conducted at 300 K in 1 � 10�6 mbar O2. After the evap-oration was complete, the sample was kept in 1 � 10�6 mbar O2 at300 K for 10 additional minutes, in order to ensure completeoxidation of the particles. The surface was then exposed to ca.25 L ethanol (>99.8% purity, further purified with repeated freeze–pump-thaw cycles) using a directional pinhole doser at 300 K. Thesample was cooled to ca. 100 K prior to temperature-programmeddesorption (TPD) measurements. The TPD spectrum was acquiredat a heating rate of 3 K/s up to 700 K, and the relevant masses of des-orbed species were monitored using a mass spectrometer. The TPDsignal for m/z = 29 is a characteristic component for acetaldehydecracking pattern and was used to determine the degree of acetalde-hyde formation. In order to correct this signal for the desorptionof ethanol (which also has a component at 29 amu), thefollowing equation was used IFA = I(m/z = 29)–1.6 � I(m/z = 31), wherethe correction factor of 1.6 was empirically determined for ourmeasurement system using the desorption of a multilayer of phys-isorbed ethanol.
2.2. DFT calculations
DFT plane wave calculations have been performed on slab mod-els of vanadia species supported on the CeO2(111) surface [23] andon the thin alumina film grown on a NiAl substrate [24] as de-scribed before. The same methods are applied to vanadia speciessupported on the c-Al2O3(001) surface. A slab model with a1 � 2 surface cell was adopted for a vanadia loading of H = 0.25.The Perdew–Wang 91 (PW91) functional is applied, except for cer-ia for which the PBE + D approximation is employed, see Ref. [23]for details.
2.3. Powder catalysts
The powder catalysts were prepared by the thermal spreadingof a vanadyl acetylacetonate (Fluka) precursor over each supportmaterial. Titania (anatase), zirconia, and alumina, which were ob-tained from Saint-Gobain Norpro, and ceria, which was preparedin our laboratory by thermal decomposition of cerium nitrate(ABCR), were selected as support materials. Each support was pre-calcined at 750 �C for 4 h before being well mixed with the appro-priate amount of vanadyl acetylacetonate in an agate mortar andsubsequently calcined at 500 �C for 4 h. Each calcination step wasperformed in a quartz rotary furnace under 50 mL/min flow ofsynthetic air (20% O2/Ar).
Raman measurements were performed using a Horiba–Jobin–Yvon confocal LABRAM Raman microscope utilizing a 633 nm exci-tation source (HeNe laser). All samples were compressed into7 mm diameter pellets using a hand press (PIKE Technologies) be-fore being dehydrated in a purpose-built quartz cell. The cell waslocated in a tubular furnace (HTM Reetz, LOBA vertikal) wherethe sample was exposed to 20 vol.% O2 in N2 (total flow 50 mL/min) at 723 K for 1 h. The cell was then isolated and mounted onthe microscope stage where spectra were collected with a laserpower of 1.5 mW. UV–visible diffuse reflectance spectra (UV–vis

Table 1Physical properties of the catalysts.
Support Surface area (m2/g) Surface density (V atoms/nm2) wt.% V
TiO2 17.1 3.5 0.6Al2O3 200.9 3.1 4.9ZrO2 52.1 3.1 1.4CeO2 19.8 3.9 0.7
122 B. Beck et al. / Journal of Catalysis 296 (2012) 120–131
DRS) were recorded using a PerkinElmer Lambda 650 spectrometerequipped with a Harrick Praying Mantis™ diffuse reflectanceattachment (DRP-P72) and reaction chamber (HVC-VUV), operat-ing under flow conditions. UV–visible spectra were measured inthe 200–800 nm range. 20–30 mg of the powdered material wasnecessary to fill the sample cup of the in situ cell. Reflectance mea-surements were converted to absorption spectra using the Kub-elka–Munk function (F(R1)) [25]. All spectra are referencedagainst SBA-15, which was used as white standard. All sampleswere diluted (5-fold) in SBA-15 and dehydrated at 723 K in flowingsynthetic air for 60 min prior to collecting spectra at room temper-ature. All spectra are normalized between zero and unity. The spec-trum of Al2O3 support has, in addition, been linearly scaled, so thatthe intensity at 600 nm is near zero. Alumina is an effective ‘‘whitestandard’’ and without this additional procedure, the intensity ofminority species (and noise) would otherwise be artificiallyenhanced as a consequence of the normalization procedure. Forpurposes of qualitative comparison between catalyst and support,this procedure seems suitable since neither dispersed vanadia,V2O5 agglomerates, nor Al2O3 are reported to have a strong absor-bance in this region of the spectrum.
Nitrogen adsorption isotherms were measured by a Micromer-itics Gemini 2375 surface analyzer. The surface area is calculatedby the method of Brunauer, Emmitt, and Teller (BET) and the poresize distribution by the method of Barrett, Joyner, and Halenda(BJH). For elementary analysis, a Varian ICP-OES 715-ES is used.The samples were solubilized in a CEM microwave AD 1058 in amixture of one part hydrochloric acid, three parts nitric acid andtwo parts sulfuric acid at 200 �C for a period of 25 min. Tempera-ture-programmed reduction (TPR) measurements were performedin a quartz reactor. Catalyst samples were fully oxidized with syn-thetic air at 500 �C for one hour and subsequently cooled to roomtemperature. The sample was then quenched in helium before thegas stream was switched to 3% ethanol in helium at 30 N mL/min,and the catalyst was heated to 250 �C at heating rate of 2 K/min.Evolved acetaldehyde was measured by a quadrupole massspectrometer (InProcess Instruments) as a function of time.
The defect formation enthalpies of oxygen vacancies weredetermined using temperature-dependent conductivity experi-ments. The method is described in detail in [26]. On heating anenthalpy DH� that comprises a term for defect formation DHf andcharge carrier migration DHm is measured:
DH� ¼ DHm þ 1=3DHf ð4Þ
Then, on cooling only the migration enthalpy is determined. For purevanadia, this is already achieved in an oxygen environment due toslow re-equilibration kinetics. However, the supported catalystsreestablish the equilibrium state on cooling in oxygen, and therefore,the experiments are done in nitrogen. Thus, by knowing the migra-tion enthalpy, DHm, and apparent enthalpy,DH�, the defect formationenthalpy, DHf, for oxygen vacancies can be calculated.
For the impedance spectroscopic experiments, compressed pow-der disks with a diameter of 6 mm and a thickness of 2 mm wereprepared. Platinum electrodes with a diameter of 5 mm were sput-ter coated on both sides with an Ar-plasma for proper electroniccontact. The samples were oxidized in a tubular furnace under flow-ing oxygen at 500 �C for 4 h. The disks were then cooled to >100 �Cand placed in a desiccator to minimize water adsorption. Theimpedance spectroscopic experiments (impedance analyser:Zahner, IM6ex) were performed in a nitrogen atmosphere in thetemperature range 400–500 �C with a heating and cooling rate of0.1 K/min. A bandwidth of 7 mHz–1 kHz with an amplitude of50 mV was applied. For the calculation of the conductivity, the resis-tance attributed to the bulk relaxation was used. The impedancespectra were analyzed using the software Thales v1.X(Zahner).
The catalytic tests for ethanol oxidation were performed in astainless steel fixed-bed reactor system with an inner diameterof 8 mm. The reactor tubes are coated with a SilcoTek™ siliconcoating to prevent catalytic activity and coke formation on thereactor walls. Kinetic measurements were performed under differ-ential conditions with a standard stoichiometric feed compositionof 6 kPa oxygen and 12 kPa ethanol at an overall flow rate of220 N mL/min. The investigated temperature interval was between140 �C and 200 �C. The product stream was analyzed by a Shima-dzu GC-2014 equipped with a methanizer, thermal conductivitydetector, flame ionization detector, and packed HayeSep Q andMolsieve 13X columns. Experimental setup for propane oxidationis described elsewhere [3].
3. Results
3.1. Powder catalysts
3.1.1. ICP-OES and BETTable 1 shows the surface areas, the loading of vanadia and the
resulting surface density of vanadium on the supports. Vanadiumsurface densities were calculated from the concentration ofvanadium in the sample by assuming a uniform dispersion overthe entire surface of the support. One can see that the surface den-sities of vanadium on all supports are around 3.5 atoms per squarenanometer, which is approximately half of a monolayer coverageof polymeric vanadyl species and 1.5 times higher than thetheoretical monolayer of monomeric vanadyl species [27,28]. Onlymarginal reductions in both surface area and pore volume over theentire pore size distribution were observed after the thermalspreading and calcination treatment.
3.1.2. Raman and UV–visThe positions of charge transfer bands in UV/vis spectra of vana-
dium oxide species have been correlated with specific electronictransitions. For example, bands with absorption edges in the range310–620 nm have been attributed to O2�? V5+, while bands withabsorption edges in the range ca. 250–275 have been assigned toO2�? V4+ transitions [29–31]. For semiconductors, the positionsof absorption maxima have been attributed to an increase in do-main size [32–35]. This methodology has been applied to the studyof vanadia supported on several metal oxide materials, includingalumina [36]; silica [37]; zirconia [7]; and titania [38].
With reference to model catalysts, isolated tetrahedrally coordi-nated monovanadate ions are reported to absorb at ca. 240 and290 nm [39], while polyvanadate ions with octahedral/pentahedralcoordination present absorption features located at 270, 340, and412 nm [40]. Examination of Fig. 1a reveals that crystalline V2O5
presents a very broad absorption feature with maxima located at440 and 490 nm.
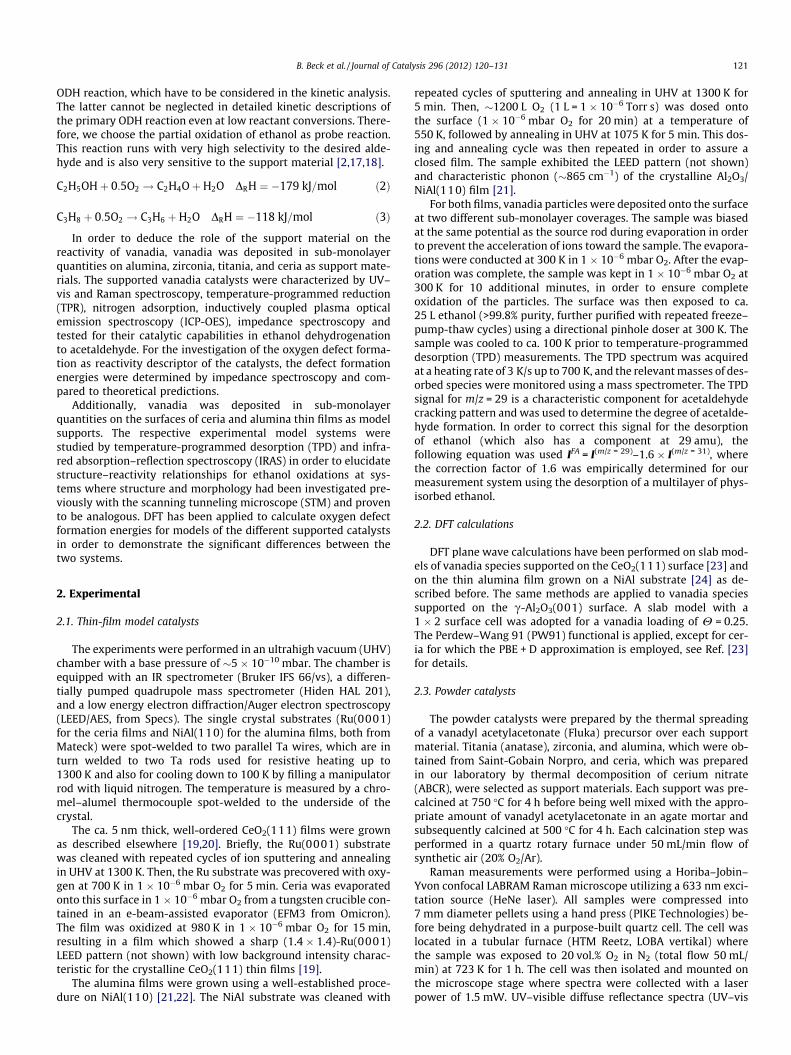
Fig. 1 presents diffuse reflectance UV/vis spectra of supportedvanadium oxide catalysts and associated with support materials.Examination of the spectra clearly shows that CeO2, TiO2, and ZrO2
supports absorb strongly in the range 200–400 nm. It is not possibleto identify very highly dispersed vanadium oxide species onthese samples since absorptions due to such species are dwarfed
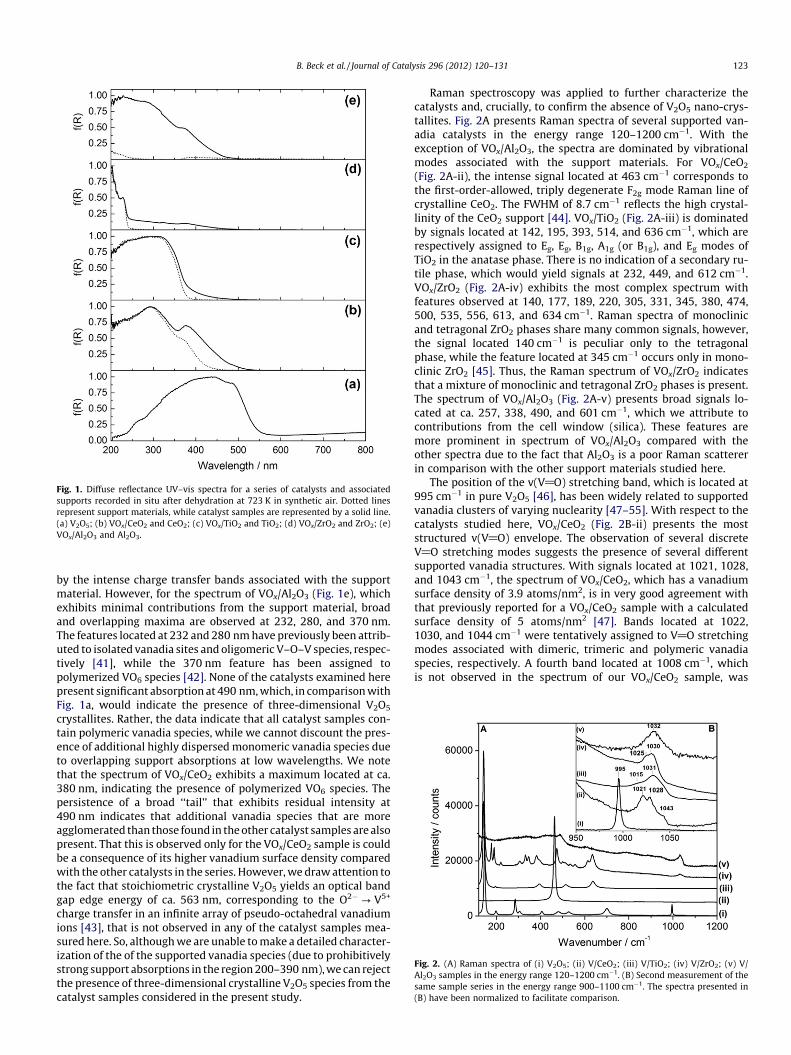
Fig. 1. Diffuse reflectance UV–vis spectra for a series of catalysts and associatedsupports recorded in situ after dehydration at 723 K in synthetic air. Dotted linesrepresent support materials, while catalyst samples are represented by a solid line.(a) V2O5; (b) VOx/CeO2 and CeO2; (c) VOx/TiO2 and TiO2; (d) VOx/ZrO2 and ZrO2; (e)VOx/Al2O3 and Al2O3.
Fig. 2. (A) Raman spectra of (i) V2O5; (ii) V/CeO2; (iii) V/TiO2; (iv) V/ZrO2; (v) V/Al2O3 samples in the energy range 120–1200 cm�1. (B) Second measurement of thesame sample series in the energy range 900–1100 cm�1. The spectra presented in(B) have been normalized to facilitate comparison.
B. Beck et al. / Journal of Catalysis 296 (2012) 120–131 123
by the intense charge transfer bands associated with the supportmaterial. However, for the spectrum of VOx/Al2O3 (Fig. 1e), whichexhibits minimal contributions from the support material, broadand overlapping maxima are observed at 232, 280, and 370 nm.The features located at 232 and 280 nm have previously been attrib-uted to isolated vanadia sites and oligomeric V–O–V species, respec-tively [41], while the 370 nm feature has been assigned topolymerized VO6 species [42]. None of the catalysts examined herepresent significant absorption at 490 nm, which, in comparison withFig. 1a, would indicate the presence of three-dimensional V2O5
crystallites. Rather, the data indicate that all catalyst samples con-tain polymeric vanadia species, while we cannot discount the pres-ence of additional highly dispersed monomeric vanadia species dueto overlapping support absorptions at low wavelengths. We notethat the spectrum of VOx/CeO2 exhibits a maximum located at ca.380 nm, indicating the presence of polymerized VO6 species. Thepersistence of a broad ‘‘tail’’ that exhibits residual intensity at490 nm indicates that additional vanadia species that are moreagglomerated than those found in the other catalyst samples are alsopresent. That this is observed only for the VOx/CeO2 sample is couldbe a consequence of its higher vanadium surface density comparedwith the other catalysts in the series. However, we draw attention tothe fact that stoichiometric crystalline V2O5 yields an optical bandgap edge energy of ca. 563 nm, corresponding to the O2�? V5+
charge transfer in an infinite array of pseudo-octahedral vanadiumions [43], that is not observed in any of the catalyst samples mea-sured here. So, although we are unable to make a detailed character-ization of the of the supported vanadia species (due to prohibitivelystrong support absorptions in the region 200–390 nm), we can rejectthe presence of three-dimensional crystalline V2O5 species from thecatalyst samples considered in the present study.
Raman spectroscopy was applied to further characterize thecatalysts and, crucially, to confirm the absence of V2O5 nano-crys-tallites. Fig. 2A presents Raman spectra of several supported van-adia catalysts in the energy range 120–1200 cm�1. With theexception of VOx/Al2O3, the spectra are dominated by vibrationalmodes associated with the support materials. For VOx/CeO2
(Fig. 2A-ii), the intense signal located at 463 cm�1 corresponds tothe first-order-allowed, triply degenerate F2g mode Raman line ofcrystalline CeO2. The FWHM of 8.7 cm�1 reflects the high crystal-linity of the CeO2 support [44]. VOx/TiO2 (Fig. 2A-iii) is dominatedby signals located at 142, 195, 393, 514, and 636 cm�1, which arerespectively assigned to Eg, Eg, B1g, A1g (or B1g), and Eg modes ofTiO2 in the anatase phase. There is no indication of a secondary ru-tile phase, which would yield signals at 232, 449, and 612 cm�1.VOx/ZrO2 (Fig. 2A-iv) exhibits the most complex spectrum withfeatures observed at 140, 177, 189, 220, 305, 331, 345, 380, 474,500, 535, 556, 613, and 634 cm�1. Raman spectra of monoclinicand tetragonal ZrO2 phases share many common signals, however,the signal located 140 cm�1 is peculiar only to the tetragonalphase, while the feature located at 345 cm�1 occurs only in mono-clinic ZrO2 [45]. Thus, the Raman spectrum of VOx/ZrO2 indicatesthat a mixture of monoclinic and tetragonal ZrO2 phases is present.The spectrum of VOx/Al2O3 (Fig. 2A-v) presents broad signals lo-cated at ca. 257, 338, 490, and 601 cm�1, which we attribute tocontributions from the cell window (silica). These features aremore prominent in spectrum of VOx/Al2O3 compared with theother spectra due to the fact that Al2O3 is a poor Raman scattererin comparison with the other support materials studied here.
The position of the v(V@O) stretching band, which is located at995 cm�1 in pure V2O5 [46], has been widely related to supportedvanadia clusters of varying nuclearity [47–55]. With respect to thecatalysts studied here, VOx/CeO2 (Fig. 2B-ii) presents the moststructured v(V@O) envelope. The observation of several discreteV@O stretching modes suggests the presence of several differentsupported vanadia structures. With signals located at 1021, 1028,and 1043 cm�1, the spectrum of VOx/CeO2, which has a vanadiumsurface density of 3.9 atoms/nm2, is in very good agreement withthat previously reported for a VOx/CeO2 sample with a calculatedsurface density of 5 atoms/nm2 [47]. Bands located at 1022,1030, and 1044 cm�1 were tentatively assigned to V@O stretchingmodes associated with dimeric, trimeric and polymeric vanadiaspecies, respectively. A fourth band located at 1008 cm�1, whichis not observed in the spectrum of our VOx/CeO2 sample, was

Fig. 3. EtOH-TPR with a heating rate of 2 K/min and 3 mol% EtOH.
124 B. Beck et al. / Journal of Catalysis 296 (2012) 120–131
assigned to monomeric vanadia species. These assignments werebased on the results of Baron et al. [48] who used a combinationof STM imaging and surface infrared spectroscopy to examineVOx clusters on a CeO2(111) surface. The band observed at930 cm�1 has been assigned to V–O–V stretching in polyvanadate[49,56,57], while the broad background in the range 850–970 cm�1 has been assigned to various V–O–Ce modes[23,49,56]. The absence of obvious features located at 770 and841 cm�1 indicates that CeVO4 is absent from the VOx/CeO2 sample[58]. The spectrum of VOx/TiO2 (Fig. 2B-iii) exhibits a feature lo-cated at 1030 cm�1 with a shoulder at 1025 cm�1. The appearanceof two features indicates the presence of at least two discrete sup-ported vanadia structures. The Raman spectrum of the VOx/ZrO2
sample (Fig. 2B-iv) exhibits a feature located at 1030 cm�1, whichhas previously been assigned as zirconia-supported polyvanadatespecies [50]. The broadness of this band may indicate that a num-ber of different supported vanadia species coexist. The absence ofsignals located at 775 and 982 cm�1 indicates an absence of a ZrV2-
O7 phase. The spectrum of VOx/Al2O3 (Fig. 2-v) presents a broadfeature located at 1031 cm�1 with a low frequency shoulder at1015 cm�1, suggesting the presence of more than one vanadiaspecies. The presence of an additional weak shoulder located atca. 995 cm�1 indicates that V2O5 crystallites could also be present.However, since V2O5 is reported to have a Raman scattering crosssection that is one order of magnitude greater than dispersed vana-dium oxide species [59], we deduce that it is exceedingly lowconcentration.
Based on previous work [60–62], Busca [63] affirms that thesurface metal vanadyl species formed at low loading on differentmetal oxide supports (alumina, titania, zirconia, and ceria) are sim-ilar, and that the position of the V@O stretching wave number isonly weakly dependent on the support, and that the surface cover-age is more critical, being slightly shifted upwards on increasingthe vanadium loading [64,65]. The position of the V@O has beenvariously related to the nuclearity of supported vanadia clusters.The frequency of the V@O oscillator has been shown to followthe ranking polymerized vanadia > isolated vanadia > V2O5 [50–53]. The increase in V@O stretching frequency has been interpretedas being due to increased dipole–dipole coupling between V@Ooscillators in vanadia species with higher degrees of polymeriza-tion [47]. However, it has also been reported that the V@O stretch-ing frequency follows the ranking isolated vanadia > polymerizedvanadia > V2O5 [51]. This lack of consistency in the assignment ofbands to particular cluster formations is particularly evident whencomparing vanadia deposited on different support materials. Forexample, a Raman signal located at 1042 cm�1 is assigned tomonomeric vanadia species in VOx/SiO2, while on VOx/CeO2, afeatures at similar energies (1044 cm�1 [47] and 1040 cm�1 [48])have previously been assigned to polymeric VOx species. In con-trast, signals observed at 1043 cm�1 in the Raman spectra of aVOx/CeO2(111) model system have been assigned to monomericspecies based on comparison with scanning tunneling microscopeimages [48]. In addition, bands located at 1042 cm�1 for VOx/SiO2
samples [54,55] have been assigned to monomeric VOx speciesbased on a comparison with trihalovanadyl complexes [66,67].
A combined DFT and multi-wavelength Raman spectroscopicinvestigation revealed that the fundamental V@O stretching modeof VOx clusters supported on silica is strongly coupled to vanadia–silica interface modes and that shifts in the position of this bandcannot simply be interpreted as being due to a change in the bondstrength and bond length of the vanadium oxygen double bond[68]. Treatment of the vanadyl stretching band as an isolatedspecies that is independent of support vibrations, as is the casein the vast majority of the literature, is an oversimplification thatmay lead to erroneous results. It has been clearly shown that inter-face modes between vanadia and the support must be considered
in order to assign spectral features to isolated and polymeric spe-cies [68]. In the absence of a universally accepted assignment ofsupported vanadia species based purely on the vanadyl stretchingfrequency, we refrain from making a precise statement regardingthe structures of the supported vanadia species on the catalystsexamined here. However, we can say with certainty that the sur-face of these samples is dominated by dispersed vanadia specieswith various degrees of nuclearity and/or local environment as re-flected by the broad (and sometimes multistructured) V@Ostretching bands observed by Raman spectroscopy. This assertionis supported by diffuse reflectance UV/vis measurements thatshow broad features exhibiting intensity over a wide energy rangethat incorporates vanadia species of varyingly nuclearity. Crucially,the presence of V2O5 can be excluded from all but the VOx/Al2O3
sample, which contains trace amounts at most. As a conclusionof the catalyst characterization, we assume to have a set of cata-lysts with similar vanadia surface species that allow an identifica-tion and discussion of the support effects on the catalytic activity.
3.1.3. Temperature-programmed reductionFig. 3 shows the temperature dependency of acetaldehyde
evolution for the different supported catalysts when ethanol is em-ployed as the reductant. For vanadia supported on titania, zirconia,and ceria, one product desorption peak can be observed. Vanadiasupported on alumina gives two acetaldehyde evolution peaks.However, dehydration of ethanol commences at temperatureshigher than 200 �C, producing ethylene, which also has a primarymass peak at 28 m/z and therefore compromises the MS measure-ment due to overlap with the acetaldehyde mass spectra. In thecase of vanadia/alumina, this phenomenon strongly overlaps withthe product desorption peaks. Integration of the acetaldehyde sig-nal indicates an approximate reduction in vanadium from oxida-tion state V to IV for the different catalysts, which supports theaforementioned model. Comparison of the peak maxima givesthe ranking for the reactivity of VOx/TiO2 > VOx/ZrO2 > VOx/CeO2 >VOx/Al2O3. When using H2 as reductant, a different ranking of reac-tivity is observed, which is VOx/ZrO2 > VOx/TiO2 > VOx/Al2O3 > VOx/CeO2. Integration of consumed hydrogen indicates a reductionfrom oxidation state V to III. The TPR results are very similar toother reported studies [3,8]. Table 2 summarizes the TPR peakmaxima for both reductants ethanol and hydrogen.
3.1.4. Impedance spectroscopyTable 3 depicts the defect formation enthalpies determined
according to the method described in [26,69] for the supportedvanadia catalysts. Following ranking of defect formation is found:VOx/TiO2 < VOx/ZrO2 < VOx/CeO2 < VOx/Al2O3. Reference values are
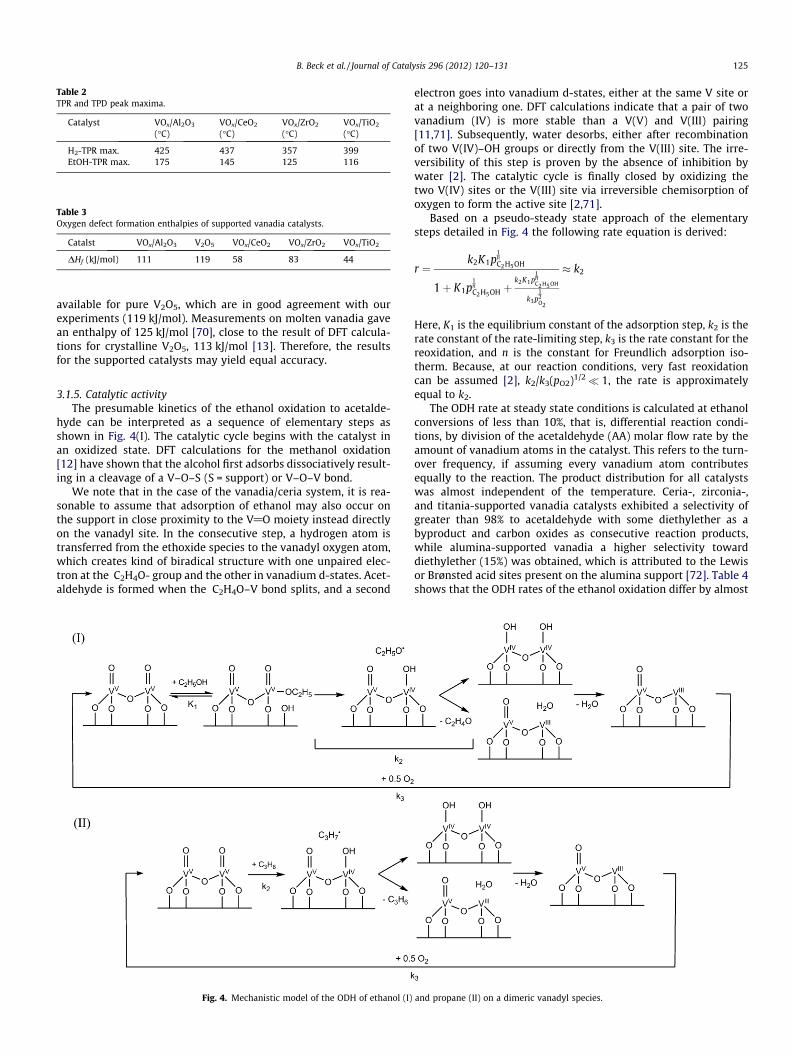
Table 2TPR and TPD peak maxima.
Catalyst VOx/Al2O3
(�C)VOx/CeO2
(�C)VOx/ZrO2
(�C)VOx/TiO2
(�C)
H2-TPR max. 425 437 357 399EtOH-TPR max. 175 145 125 116
Table 3Oxygen defect formation enthalpies of supported vanadia catalysts.
Catalst VOx/Al2O3 V2O5 VOx/CeO2 VOx/ZrO2 VOx/TiO2
DHf (kJ/mol) 111 119 58 83 44
B. Beck et al. / Journal of Catalysis 296 (2012) 120–131 125
available for pure V2O5, which are in good agreement with ourexperiments (119 kJ/mol). Measurements on molten vanadia gavean enthalpy of 125 kJ/mol [70], close to the result of DFT calcula-tions for crystalline V2O5, 113 kJ/mol [13]. Therefore, the resultsfor the supported catalysts may yield equal accuracy.
3.1.5. Catalytic activityThe presumable kinetics of the ethanol oxidation to acetalde-
hyde can be interpreted as a sequence of elementary steps asshown in Fig. 4(I). The catalytic cycle begins with the catalyst inan oxidized state. DFT calculations for the methanol oxidation[12] have shown that the alcohol first adsorbs dissociatively result-ing in a cleavage of a V–O–S (S = support) or V–O–V bond.
We note that in the case of the vanadia/ceria system, it is rea-sonable to assume that adsorption of ethanol may also occur onthe support in close proximity to the V@O moiety instead directlyon the vanadyl site. In the consecutive step, a hydrogen atom istransferred from the ethoxide species to the vanadyl oxygen atom,which creates kind of biradical structure with one unpaired elec-tron at the �C2H4O- group and the other in vanadium d-states. Acet-aldehyde is formed when the �C2H4O–V bond splits, and a second
Fig. 4. Mechanistic model of the ODH of ethanol (I)
electron goes into vanadium d-states, either at the same V site orat a neighboring one. DFT calculations indicate that a pair of twovanadium (IV) is more stable than a V(V) and V(III) pairing[11,71]. Subsequently, water desorbs, either after recombinationof two V(IV)–OH groups or directly from the V(III) site. The irre-versibility of this step is proven by the absence of inhibition bywater [2]. The catalytic cycle is finally closed by oxidizing thetwo V(IV) sites or the V(III) site via irreversible chemisorption ofoxygen to form the active site [2,71].
Based on a pseudo-steady state approach of the elementarysteps detailed in Fig. 4 the following rate equation is derived:
r ¼k2K1p
1nC2H5OH
1þ K1p1nC2H5OH þ
k2K1p1nC2H5OH
k3p12O2
� k2
Here, K1 is the equilibrium constant of the adsorption step, k2 is therate constant of the rate-limiting step, k3 is the rate constant for thereoxidation, and n is the constant for Freundlich adsorption iso-therm. Because, at our reaction conditions, very fast reoxidationcan be assumed [2], k2/k3(pO2)1/2� 1, the rate is approximatelyequal to k2.
The ODH rate at steady state conditions is calculated at ethanolconversions of less than 10%, that is, differential reaction condi-tions, by division of the acetaldehyde (AA) molar flow rate by theamount of vanadium atoms in the catalyst. This refers to the turn-over frequency, if assuming every vanadium atom contributesequally to the reaction. The product distribution for all catalystswas almost independent of the temperature. Ceria-, zirconia-,and titania-supported vanadia catalysts exhibited a selectivity ofgreater than 98% to acetaldehyde with some diethylether as abyproduct and carbon oxides as consecutive reaction products,while alumina-supported vanadia a higher selectivity towarddiethylether (15%) was obtained, which is attributed to the Lewisor Brønsted acid sites present on the alumina support [72]. Table 4shows that the ODH rates of the ethanol oxidation differ by almost
and propane (II) on a dimeric vanadyl species.
126 B. Beck et al. / Journal of Catalysis 296 (2012) 120–131
three orders of magnitude over all support materials with the rank-ing VOx/Al2O3� V2O5 < VOx/CeO2 < VOx/ZrO2� VOx/TiO2. Here,titania shows an outstanding performance. It must be noted thatthe apparent rate observed for V2O5 is erroneous due to theassumption of a surface density of 5 atoms/nm2 and formation ofvolatile vanadyl ethoxides. The transformation of the surface andloss of catalyst leads to an underestimation of the observed ODHrate. The ethanol conversion over the pure support materials inthis temperature range is negligible. Only bare ceria reveals highactivity to total oxidation products at temperatures higher than200 �C, which is suppressed by loading with vanadia as has beenpreviously observed for different ODH reactions [3,73] and addi-tionally in model studies [70]. Dehydrogenation rates were mea-sured as a function of temperature at all catalysts describedabove, and the apparent activation energies were derived fromthe resulting Arrhenius plots. The apparent activation energiesand preexponential factors are presented in Table 4.
In order to find a relationship between the ODH of ethanol andpropane as can be expected by the similar reaction mechanism(Fig. 4II), we investigated the same series of catalysts in the ODHof propane in the temperature range 400–500 �C. Calculation ofthe ODH rate is done under the assumption that no parallelreaction to carbon oxides takes place. This is justified by thehigh observed selectivity. The rate is obtained by division of theconverted propane molar flow rate by the amount of vanadiumatoms in the catalyst. The explicit values for the ODH rate, theapparent activation energies, and preexponential factors are givenin Table 5.
Both reactions show the same reactivity ranking over the stud-ied family of catalysts, although there is a significant change in thereaction temperature and the molecular structure of the two reac-tants. Pure vanadia has to be excluded. Due to formation of volatilevanadyl ethoxides, the ODH rate is erroneous as mentioned before.
In order to exclude influences of the catalyst morphology fortwo selected materials, thin-film model systems were studied atidentical structure and conditions and modeled by DFT in orderto quantify the obtained observations.
3.2. Thin-film model catalysts
The key experimental findings are presented in Fig. 5, fromwhich a direct comparison of the vanadia/alumina and vanadia/ceria systems may be made. For zirconia and titania thin-filmmodel systems are not available, but fortunately, the two givensystems represent boundary cases for our investigations into cata-lyst with strong support effects. We first address the results forvanadia/alumina. Deposition of vanadia onto an alumina filmattenuates the alumina phonon band (located at 865 cm�1) andleads to the formation of V@O terminated particles as evidencedby the appearance of the V@O band at ca 1040 cm�1. Concomi-
Table 4ODH rates (200 �C), apparent activation energies and preexponential factors for the ODH
Catalyst VOx/Al2O3 V2O5
ODH rates (molAA/molVs) 0.006 0.055Ea,app (kJ/mol) 91 77k1 (molAA/molVs) 7.15E+07 1.52E+07
Table 5ODH rates (400 �C), apparent activation energies and preexponential factors for the ODH
Catalyst VOx/Al2O3 V2O5
ODH rates ðmolC3H6 =molVsÞ 0.003 0.058Ea,app (kJ/mol) 117 96k1 ðmolC3 H6 =molVsÞ 3.74E+06 1.67E+06
tantly, the presence of an interfacial V–O–Al mode, reported tobe located at ca. 920 cm�1 [68], that overlaps with an alumina pho-non results in a broadband centered at 900 cm�1. Based on therelationship between the morphology of vanadia species, observedby STM, and IRA spectra of the vanadia/alumina surfaces previ-ously reported [22], we could estimate the vanadia coverage inthese experiments, which is approximately 3 atoms/nm2, respec-tively. The TPD spectra of ethanol adsorbed at 300 K on the respec-tive vanadia/alumina surfaces did not show any detectablereactivity toward acetylaldehyde (AA) (see bottom left of Fig. 5).
In contrast, the vanadia/ceria system containing the sameamount of vanadia showed substantial reactivity expressed as AAformation (right bottom in Fig. 5). The TPD spectra revealed twodesorption features, that is, at 500 K and �600 K. The high-temper-ature reactivity can straightforwardly be assigned to the reactivityof the bare ceria surface showing a similar TPD feature in theexperiments performed with pristine ceria films (the dashed line).Obviously, the reactivity at 500 K must be associated with vanadiaspecies. As we have recently shown [48], vanadia wets the ceriasurface at sub-monolayer coverages and may form monomeric,oligomeric, or two-dimensional islands. These species can, in prin-ciple, be differentiated by IRAS based on the structure–frequencyrelationship observed for this system using scanning tunnelingmicroscopy [48]: the higher the nuclearity of the vanadyl species,the higher the stretching frequency. The IRAS spectra of the van-adia/ceria samples (see top right panel in Fig. 5) suggest that diand trimeric as well as larger oligomeric species, showing the1033 cm�1 band, dominate the surface. Therefore, the TPD andIRAS results on vanadia thin-film model catalysts clearly showthe support effect such that vanadia supported on ceria is more ac-tive toward ethanol than vanadia supported on alumina.
3.3. DFT results
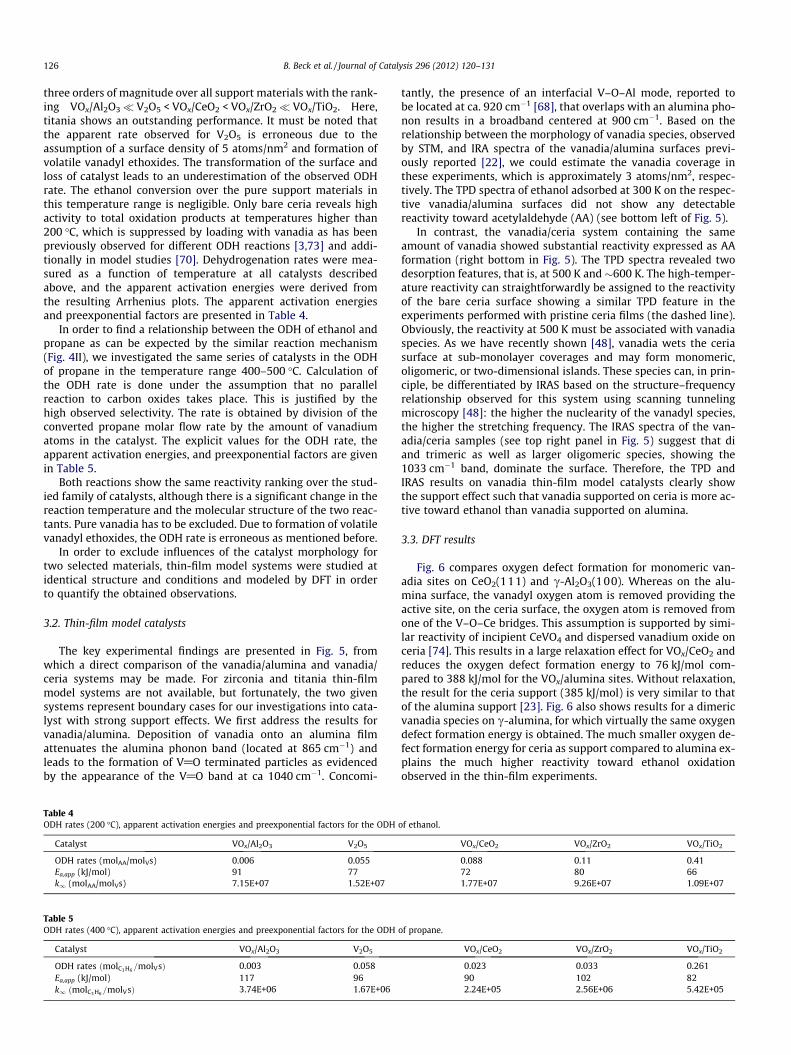
Fig. 6 compares oxygen defect formation for monomeric van-adia sites on CeO2(111) and c-Al2O3(100). Whereas on the alu-mina surface, the vanadyl oxygen atom is removed providing theactive site, on the ceria surface, the oxygen atom is removed fromone of the V–O–Ce bridges. This assumption is supported by simi-lar reactivity of incipient CeVO4 and dispersed vanadium oxide onceria [74]. This results in a large relaxation effect for VOx/CeO2 andreduces the oxygen defect formation energy to 76 kJ/mol com-pared to 388 kJ/mol for the VOx/alumina sites. Without relaxation,the result for the ceria support (385 kJ/mol) is very similar to thatof the alumina support [23]. Fig. 6 also shows results for a dimericvanadia species on c-alumina, for which virtually the same oxygendefect formation energy is obtained. The much smaller oxygen de-fect formation energy for ceria as support compared to alumina ex-plains the much higher reactivity toward ethanol oxidationobserved in the thin-film experiments.
of ethanol.
VOx/CeO2 VOx/ZrO2 VOx/TiO2
0.088 0.11 0.4172 80 661.77E+07 9.26E+07 1.09E+07
of propane.
VOx/CeO2 VOx/ZrO2 VOx/TiO2
0.023 0.033 0.26190 102 822.24E+05 2.56E+06 5.42E+05

Fig. 5. IRAS (top panel) and TPD (bottom panel) spectra of vanadia particles deposited onto alumina (on left) and ceria (on right) films at sub-monolayer coverages (see text).
Fig. 6. Oxygen defect formation energies (kJ/mol) for supported vanadia calculated by DFT. The PW91 functional is used. Left: PBE + U results for monomeric vanadia on ceria,middle and right: PW91 results for monomeric and dimeric vanadia, respectively, on c-alumina.
B. Beck et al. / Journal of Catalysis 296 (2012) 120–131 127

Fig. 7. Oxygen defect formation energies (kJ/mol) for monomeric, dimeric, and tetrameric vanadia species on the ultrathin alumina/NiAl film.
128 B. Beck et al. / Journal of Catalysis 296 (2012) 120–131
Fig. 7 shows that the oxygen defect formation energies formonomeric, dimeric, and tetrameric vanadia species on the thin-film alumina/NiAl support are in the same range (338–401 kJ/mol) as the results for the monomeric and dimeric species on thec-alumina surface. Hence, the reactivity of vanadia species on thealumina model catalyst as used for the experiments in Fig. 5 shouldbe comparable to that of small vanadia particles present on thesurface of powder catalysts (Tables 4 and 5).
Fig. 8. Correlation of propane and ethanol ODH rates (top) and apparent activationenergies (bottom).
4. Discussion
The oxygen defect formation energies obtained by DFT (Figs. 6and 7) indicate that the thin alumina film on NiAl is a good modelfor the c-alumina support among the powder catalysts. Both theobserved (impedance spectroscopy, Table 3) and DFT-calculated(Fig. 6) differences of oxygen defect formation energies betweenceria and alumina supports explain the observed reactivity differ-ences at these samples.
DFT calculations have also been performed for vanadia sup-ported on zirconia [75]. Whereas for isolated dimeric vanadia spe-cies, the calculated values for zirconia (389 kJ/mol) are hardlydifferent from the ones for alumina (386–401 kJ/mol, Figs. 6 and7), significantly lower values (150–190 kJ/mol) have been obtainedby DFT only for polymeric vanadia species on zirconia supports [75].
Previous studies have shown a strong influence of the supportmaterial on the ODH rate of various reactants like methanol, eth-ane, and propane. Even though different conditions, that is temper-ature and feed composition, were used, they found the sameranking of activity, which is TiO2 > ZrO2 > CeO2 > Al2O3 > SiO2
[3,6,8,9]. An exception is methanol ODH, for which the observedreactivity sequence was CeO2 > ZrO2 > TiO2 > Al2O3 > SiO2 [1]. Thissupport effect was also found for the oxidation of propene to acro-lein [76]. However, one must interpret this observation with greatcare since the oxidation to acrolein is a 4e� reaction requiring twosurface vanadyl sites and is showing a strong influence by thevanadium surface density [76]. Whereas we found the same activ-ity ranking when pure vanadia is excluded (Fig. 8, top). A plot ofthe apparent activation energies even exhibits a strong correlation(Fig. 8, bottom).
Clearly, the close relationship between the apparent activationenergies of ethanol and propane ODH as a function of the supportmaterial is manifested here as a straight line through the point oforigin with 23 ± 5 kJ/mol lower barriers for ethanol oxidation. Thisindicates that the rate-limiting steps of both reactions are influ-enced by the same phenomena. This is reasonable, since hydrogenabstraction has been shown to be the rate-determining step forboth methanol and propane oxidation reactions [11,12]. For VOx/SiO2 catalysts, the predicted apparent Arrhenius barrier (DFT) formethanol of 104 ± 5 kJ/mol = (DH#
503 þ R � 503þ DCCSDðTÞ) [12] isalso about 20 kJ/mol lower than that predicted for propane,123 ± 5 kJ/mol = (DH#
750 þ R � 750) [11].
Therefore, the TPD and IRAS results on vanadia thin-film modelcatalysts clearly show the support effect such that vanadia sup-ported on ceria is more active toward ethanol than vanadia sup-ported on alumina.
Every support material exhibits unique features, which mayinfluence the catalytic performance. Electron paramagnetic reso-nance (EPR) measurements indicate the presence of small amountsof vanadium (IV) deposited on alumina, even under an oxidizingatmosphere [77]. This could be inactive for the ODH reaction. Atelevated temperatures ceria can form a CeVO4-phase, which isinactive for the ODH of ethanol. CeVO4 formation is favored withincreasing surface coverage of vanadium and under typical ODHreaction conditions [58]. Ceria and titania are partially reduced tooxidation state three under reaction conditions via reoxidation of
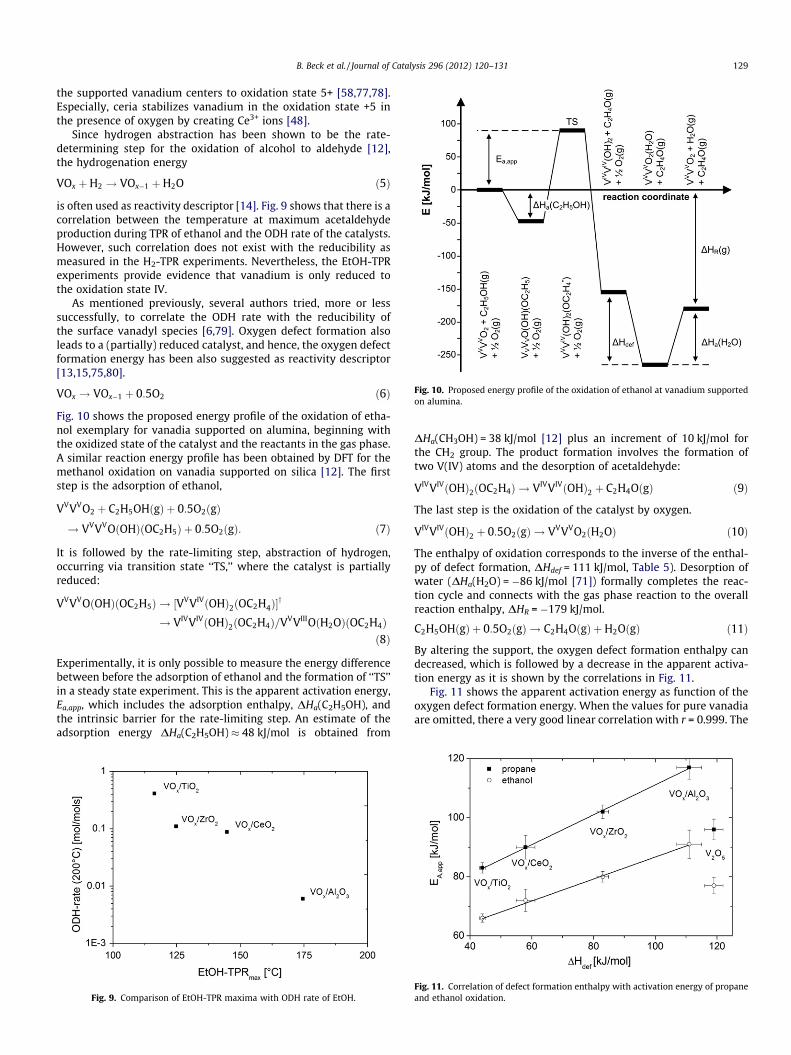
Fig. 10. Proposed energy profile of the oxidation of ethanol at vanadium supportedon alumina.
B. Beck et al. / Journal of Catalysis 296 (2012) 120–131 129
the supported vanadium centers to oxidation state 5+ [58,77,78].Especially, ceria stabilizes vanadium in the oxidation state +5 inthe presence of oxygen by creating Ce3+ ions [48].
Since hydrogen abstraction has been shown to be the rate-determining step for the oxidation of alcohol to aldehyde [12],the hydrogenation energy
VOx þH2 ! VOx�1 þH2O ð5Þ
is often used as reactivity descriptor [14]. Fig. 9 shows that there is acorrelation between the temperature at maximum acetaldehydeproduction during TPR of ethanol and the ODH rate of the catalysts.However, such correlation does not exist with the reducibility asmeasured in the H2-TPR experiments. Nevertheless, the EtOH-TPRexperiments provide evidence that vanadium is only reduced tothe oxidation state IV.
As mentioned previously, several authors tried, more or lesssuccessfully, to correlate the ODH rate with the reducibility ofthe surface vanadyl species [6,79]. Oxygen defect formation alsoleads to a (partially) reduced catalyst, and hence, the oxygen defectformation energy has been also suggested as reactivity descriptor[13,15,75,80].
VOx ! VOx�1 þ 0:5O2 ð6Þ
Fig. 10 shows the proposed energy profile of the oxidation of etha-nol exemplary for vanadia supported on alumina, beginning withthe oxidized state of the catalyst and the reactants in the gas phase.A similar reaction energy profile has been obtained by DFT for themethanol oxidation on vanadia supported on silica [12]. The firststep is the adsorption of ethanol,
VVVVO2 þ C2H5OHðgÞ þ 0:5O2ðgÞ
! VVVVOðOHÞðOC2H5Þ þ 0:5O2ðgÞ: ð7Þ
It is followed by the rate-limiting step, abstraction of hydrogen,occurring via transition state ‘‘TS,’’ where the catalyst is partiallyreduced:
VVVVOðOHÞðOC2H5Þ ! ½VVVIVðOHÞ2ðOC2H�4Þy
! VIVVIVðOHÞ2ðOC2H4Þ=VVVIIIOðH2OÞðOC2H4Þð8Þ
Experimentally, it is only possible to measure the energy differencebetween before the adsorption of ethanol and the formation of ‘‘TS’’in a steady state experiment. This is the apparent activation energy,Ea,app, which includes the adsorption enthalpy, DHa(C2H5OH), andthe intrinsic barrier for the rate-limiting step. An estimate of theadsorption energy DHa(C2H5OH) � 48 kJ/mol is obtained from
Fig. 9. Comparison of EtOH-TPR maxima with ODH rate of EtOH.
DHa(CH3OH) = 38 kJ/mol [12] plus an increment of 10 kJ/mol forthe CH2 group. The product formation involves the formation oftwo V(IV) atoms and the desorption of acetaldehyde:
VIVVIVðOHÞ2ðOC2H4Þ ! VIVVIVðOHÞ2 þ C2H4OðgÞ ð9Þ
The last step is the oxidation of the catalyst by oxygen.
VIVVIVðOHÞ2 þ 0:5O2ðgÞ ! VVVVO2ðH2OÞ ð10Þ
The enthalpy of oxidation corresponds to the inverse of the enthal-py of defect formation, DHdef = 111 kJ/mol, Table 5). Desorption ofwater (DHa(H2O) = �86 kJ/mol [71]) formally completes the reac-tion cycle and connects with the gas phase reaction to the overallreaction enthalpy, DHR = �179 kJ/mol.
C2H5OHðgÞ þ 0:5O2ðgÞ ! C2H4OðgÞ þH2OðgÞ ð11Þ
By altering the support, the oxygen defect formation enthalpy candecreased, which is followed by a decrease in the apparent activa-tion energy as it is shown by the correlations in Fig. 11.
Fig. 11 shows the apparent activation energy as function of theoxygen defect formation energy. When the values for pure vanadiaare omitted, there a very good linear correlation with r = 0.999. The
Fig. 11. Correlation of defect formation enthalpy with activation energy of propaneand ethanol oxidation.

130 B. Beck et al. / Journal of Catalysis 296 (2012) 120–131
straight line has a positive y-axis intercept at DHdef = 0, which is lo-cated at 60 kJ/mol for propane and at 50 kJ/mol for ethanol. This isattributed to the different strengths of the C–H bonds involved inthe dehydration. The inconsistency of the V2O5 defect formationenthalpy is probably related to defect formation in the bulk insteadof only on the surface.
5. Conclusion
We found the same support effect for thin-film model catalystsas for powder catalysts and have demonstrated that this is not sim-ply a phenomenon of the bulk phase. Moreover, the vanadia pow-der catalysts show the same reactivity across different supports forethanol oxidation and for propane oxidation. Despite the fact thatthe oxidic catalyst system and the reaction are clearly different,similar correlations were found by varying the support material.The observed correlation between the apparent activation energiesof the ODH of ethanol and propane with the measured oxygen de-fect formation enthalpies shows that the reducibility of supportedvanadia can be used as reactivity descriptor as suggested before[13–15,80].
The derived data demonstrate that the reaction follows verysimilar energy profiles with changes that are governed by defectformation energies according to the Bell–Evans–Polanyi principleas expressed in the following formula.
EA ¼ aDEþ b;
with EA as activation energy of the rate-determining step, DE asreaction energy of the key reaction step, a and b as scaling param-eters. Since this depends strongly on the support material, an opti-mization of the catalyst should consider measures for tuning thereducibility of the vanadia supported thereon. With doped or mixedoxides, this is possible in a wide range.
In oxidation reactions, the difference between the rates of de-sired product formation and undesired over oxidation and also ofthe activation energies of these reactions is mainly governed bythe difference in the C–H bond strength involved in the corre-sponding rate-determining steps. Since these parameters cannotbe changed for a given reaction, it is necessary to select a reactiontemperature where the ratio between the rates of desired andundesired reaction is sufficiently high for achieving a reasonableselectivity. In order to obtain also a suitable space–time yield atthis temperature, it is important to have a tuning parameter avail-able that adjusts the reaction rate at the selected temperature in aneconomically viable range.
Acknowledgments
We thank the Deutsche Forschungsgemeinschaft for the finan-cial support of our work in the Sonderforschungsbereich 546 andespecially the recently late Prof. Helmut Schubert for his valuablecontribution to this work.
References
[1] I.E. Wachs, Catal. Today 100 (2005) 79–94.[2] B. Kilos, A.T. Bell, E. Iglesia, J. Phys. Chem. C 113 (2009) 2830–2836.[3] A. Dinse, B. Frank, C. Hess, D. Habel, R. Schomäcker, J. Mol. Catal. A: Chem. 289
(2008) 28–37.[4] T. Blasco, J.M.L. Nieto, Appl. Catal., A 157 (1997) 117–142.[5] P. Eisele, R. Killpack, Ullmann’s Encyclopedia of Industrial Chemistry (2000).[6] M. Banares, M. Martinez-Huerta, X. Gao, Catal. Today 61 (2000) 295–301.[7] A. Khodakov, B. Olthof, A.T. Bell, E. Iglesia, J. Catal. 181 (1999) 205–216.[8] A.A. Lemonidou, L. Nalbandian, I.A. Vasalos, Catal. Today 61 (2000) 333–341.[9] H. Tian, E.I. Ross, I.E. Wachs, J. Phys. Chem. B 110 (2006) 9593–9600.
[10] G. Deo, I.E. Wachs, J. Catal. 146 (1994) 323–334.[11] X. Rozanska, R. Fortrie, J. Sauer, J. Phys. Chem. C 111 (2007) 6041–6050.[12] J. Döbler, M. Pritzsche, J. Sauer, J. Am. Chem. Soc. 127 (2005) 10861–10868.
[13] J. Sauer, J. Dobler, Dalton Trans. (2004) 3116–3121.[14] J. Sauer, in: K. Morokuma, D.G. Musaev (Eds.), Computational Modelling for
Homogeneous and Enzymatic Catalysis, Wiley-VCH, Weinheim, 2008, pp.231–244.
[15] M.V. Ganduglia-Pirovano, C. Popa, J. Sauer, H. Abbott, A. Uhl, M. Baron, D.Stacchiola, O. Bondarchuk, S. Shaikhutdinov, H.-J. Freund, J. Am. Chem. Soc.132 (2010) 2345–2349.
[16] R.P. Bell, Proc. R. Soc. A 154 (1936) 414–429.[17] N.E. Quaranta, J. Soria, V. Cortés Corberán, J.L.G. Fierro, J. Catal. 13 (1997) 1–13.[18] Y.-C. Lin, C.-H. Chang, C.-C. Chen, J.-M. Jehng, S.-G. Shyu, Catal. Commun. 9
(2008) 675–679.[19] M. Baron, O. Bondarchuk, D. Stacchiola, S. Shaikhutdinov, H.J. Freund, J. Phys.
Chem. C 113 (2009) 6042–6049.[20] D.R. Mullins, L. Kundakovic, S.H. Overbury, J. Catal. 195 (2000) 169–179.[21] R. Jaeger, H. Kuhlenbeck, H.J. Freund, M. Wuttig, W. Hoffmann, R. Franchy, H.
Ibach, Surf. Sci. 259 (1991) 235–252.[22] N. Magg, J.B. Giorgi, T. Schroeder, M. Bäumer, H.J. Freund, J. Phys. Chem. B 106
(2002) 8756–8761.[23] C. Popa, M.V. Ganduglia-Pirovano, J. Sauer, J. Phys. Chem. C 115 (2011) 7399–
7410.[24] V. Brazdova, M.V. Ganduglia-Pirovano, J. Sauer, J. Phys. Chem. C 114 (2010)
4983–4994.[25] W.N. Delgass, Spectroscopy in Heterogeneous Catalysis, Academic Press, New
York, 1979.[26] M. Harth, R. Mitdank, D. Habel, O. Görke, M. Tovar, H. Winter, H. Schubert, Int.
J. Mater. Res. (2012), in press.[27] A. Khodakov, J. Yang, S. Su, E. Iglesia, A.T. Bell, J. Catal. 177 (1998) 343–351.[28] G. Centi, Appl. Catal., A 147 (1996) 267–298.[29] M. Iwamoto, H. Furukawa, K. Matsukami, T. Takenaka, S. Kagawa, J. Am. Chem.
Soc. 105 (1983) 3719–3720.[30] H. So, M.T. Pope, Inorg. Chem. 11 (1972) 1441–1443.[31] E.F. King, M.L. Good, Spectrochim. Acta, Part A 29 (1973) 707–713.[32] A.P. Alivisatos, Science 271 (1996) 933–937.[33] N. Chestnoy, R. Hull, L.E. Brus, J. Chem. Phys. 85 (1986) 2237.[34] C.F. Hoener, K.A. Allan, A.J. Bard, A. Campion, M.A. Fox, T.E. Mallouk, S.E.
Webber, J.M. White, J. Phys. Chem. 96 (1992) 3812–3817.[35] Z. Liu, R.J. Davis, J. Phys. Chem. 98 (1994) 1253–1261.[36] Z. Wu, H.-S. Kim, P.C. Stair, S. Rugmini, S.D. Jackson, J. Phys. Chem. B 109 (2005)
2793–2800.[37] P. Gruene, T. Wolfram, K. Pelzer, R. Schlögl, A. Trunschke, Catal. Today 157
(2010) 137–142.[38] D.I. Enache, E. Bordes-Richard, A. Ensuque, F. Bozon-Verduraz, Appl. Catal., A
278 (2004) 93–102.[39] M. Schraml-Marth, A. Wokaun, M. Pohl, H.-L. Krauss, J. Chem. Soc., Faraday
Trans. 87 (1991) 2635.[40] F. Arena, F. Frusteri, G. Martra, S. Coluccia, A. Parmaliana, J. Chem. Soc. Faraday
Trans. 93 (1997) 3849–3854.[41] Y.-M. Liu, Y. Cao, N. Yi, W.-L. Feng, W.-L. Dai, S.-R. Yan, H.-Y. He, K.-N. Fan, J.
Catal. 224 (2004) 417–428.[42] X. Gao, S.R. Bare, B.M. Weckhuysen, I.E. Wachs, J. Phys. Chem. B 102 (1998)
10842–10852.[43] J. Bullot, P. Cordier, O. Gallais, M. Gauthier, F. Babonneau, J. Non-Cryst. Solids
68 (1984) 135–146.[44] W. Weber, K. Hass, J. McBride, Phys. Rev. B: Condens. Matter Mater. Phys. 48
(1993) 178–185.[45] C.M. Phillippi, K.S. Mazdiyasni, J. Am. Ceram. Soc. 54 (1971) 254–258.[46] L. Abello, E. Husson, Y. Repelin, G. Lucazeau, Spectrochim. Acta, Part A 39
(1983) 641–651.[47] Z. Wu, A.J. Rondinone, I.N. Ivanov, S.H. Overbury, J. Phys. Chem. C 115 (2011)
25368–25378.[48] M. Baron, H. Abbott, O. Bondarchuk, D. Stacchiola, A. Uhl, S. Shaikhutdinov, H.-
J. Freund, C. Popa, M.V. Ganduglia-Pirovano, J. Sauer, Angew. Chem. Int. Ed. 48(2009) 8006–8009.
[49] M.V. Martinez-Huerta, G. Deo, J.L.G. Fierro, M.A. Banares, J. Phys. Chem. C 111(2007) 18708–18714.
[50] A. Christodoulakis, M. Machli, A.A. Lemonidou, S. Boghosian, J. Catal. 222(2004) 293–306.
[51] G. Cortez, M.A. Bañares, J. Catal. 209 (2002) 197–201.[52] I.E. Wachs, Catal. Today 27 (1996) 437–455.[53] M.A. Bañares, I.E. Wachs, J. Raman Spectrosc. 33 (2002) 359–380.[54] S.T. Oyama, G.T. Went, K.B. Lewis, A.T. Bell, G.A. Somorjai, J. Phys. Chem. 93
(1989) 6786–6790.[55] G.T. Went, S.T. Oyama, A.T. Bell, J. Phys. Chem. 94 (1990) 4240–4246.[56] J.-M. Jehng, G. Deo, B.M. Weckhuysen, I.E. Wachs, J. Mol. Catal. A: Chem. 110
(1996) 41–54.[57] L.J. Burcham, I.E. Wachs, Catal. Today 49 (1999) 467–484.[58] M.V. Martínez-Huerta, J.M. Coronado, M. Fernández-García, A. Iglesias-Juez, G.
Deo, J.L.G. Fierro, M.A. Banares, J. Catal. 225 (2004) 240–248.[59] H. Dai, A.T. Bell, E. Iglesia, J. Catal. 221 (2004) 491–499.[60] G. Busca, Mater. Chem. Phys. 19 (1988) 157–165.[61] G. Busca, J.C. Lavalley, Spectrochim. Acta, Part A 42 (1986) 443–445.[62] J.P. Dunn, H.G. Stenger, I.E. Wachs, Catal. Today 53 (1999) 543–556.[63] G. Busca, J. Raman Spectrosc. 33 (2002) 348–358.[64] L. Lietti, P. Forzatti, G. Ramis, G. Busca, F. Bregani, Appl. Catal., B 3 (1993) 13–35.[65] M.M. Ostromecki, L.J. Burcham, I.E. Wachs, J. Mol. Catal. A: Chem. 132 (1998)
59–71.

B. Beck et al. / Journal of Catalysis 296 (2012) 120–131 131
[66] H. Selig, H.H. Claassen, J. Chem. Phys. 44 (1966) 1404.[67] F.A. Miller, L.R. Cousins, J. Chem. Phys. 26 (1957) 329.[68] N. Magg, B. Immaraporn, J.B. Giorgi, T. Schroeder, M. Bäumer, J. Döbler, Z. Wu,
E.V. Kondratenko, M. Cherian, M. Baerns, P.C. Stair, J. Sauer, H.-J. Freund, J.Catal. 226 (2004) 88–100.
[69] M. Harth, Characterization of the Catalytic Properties of Supported VOx-catalysts Using Electrochemical Methods, 2011.
[70] T. Allersma, R. Hakim, T.N. Kennedy, J.D. Mackenzie, J. Chem. Phys. 46 (1967)154.
[71] X. Rozanska, E.V. Kondratenko, J. Sauer, J. Catal. 256 (2008) 84–94.[72] G. Avgouropoulos, E. Oikonomopoulos, D. Kanistras, T. Ioannides, Appl. Catal.,
B 65 (2006) 62–69.
[73] H.L. Abbott, A. Uhl, M. Baron, Y. Lei, R.J. Meyer, D.J. Stacchiola, O. Bondarchuk,S. Shaikhutdinov, H.J. Freund, J. Catal. 272 (2010) 82–91.
[74] M. Martinez-Huerta, G. Deo, J. Phys. Chem. C (2008) 11441–11447.[75] A. Hofmann, M.V. Ganduglia-Pirovano, J. Sauer, J. Phys. Chem. C 113 (2009)
18191–18203.[76] C. Zhao, I. Wachs, J. Catal. 257 (2008) 181–189.[77] A. Dinse, A. Ozarowski, C. Hess, R. Schomäcker, K.P. Dinse, J. Phys. Chem. C 112
(2008) 17664–17671.[78] G. Wong, J. Vohs, Surf. Sci. 498 (2002) 266–274.[79] H. Feng, J.W. Elam, J.A. Libera, M.J. Pellin, P.C. Stair, J. Catal. 269 (2010) 421–431.[80] H.Y. Kim, H.M. Lee, R.G.S. Pala, V. Shapovalov, H. Metiu, J. Phys. Chem. C 112
(2008) 12398–12408.