iridium-based bimetallic alloy catalysts for the ethanol
TRANSCRIPT

1
Iridium-based bimetallic alloy
catalysts for the ethanol oxidation
reaction for fuel cells modeled by
density functional theory
By
Julien Courtois
A thesis submitted to the faculty of
WORCESTER POLYTECHNIC INSTITUTE
In partial fulfillment for the requirement for the Degree of
Master of Science
in
Chemical Engineering
May 2013
_________________________
Julien Courtois
______________________________ ___________________________________
Dr N. Aaron Deskins, Advisor Dr David DiBiaso, Head of the Department
Department of Chemical Engineering, Worcester Polytechnic Institute
100 Institute Road, Worcester, MA 01609

2
Acknowledgments
I would like to thank my advisor Professor Deskins for his time, help and precious advice
throughout my master program as well as my lab mates, Thomas Gabry, Elli Kamaloo, Juan
Garcia and Brandon Bukowski for making those long hours in front of the computer much more
enjoyable.
I would also like to thank the friends I met in WPI, especially Todd Alexander, Kellie
Waterman, Luca Issi, Kathleen Wang, and Jeff Swana for making my stay in Worcester a great
experience.
I would also like to thank the faculty, staff and students of the Chemical Engineering department.
Finally, I would like to thank my family and Sarah Shank for their constant support during the
past two years.

3
Contents
List of figures .................................................................................................................................. 6
List of Tables .................................................................................................................................. 7
Abstract ........................................................................................................................................... 8
Introduction ................................................................................................................................... 10
Chapter 1: Background Information ............................................................................................. 12
I. Fuels cells.............................................................................................................................. 12
A. General structure ............................................................................................................ 12
B. Potential Fuels ................................................................................................................ 14
C. Fuel cell types................................................................................................................. 14
1. Proton exchange membrane fuel cells ........................................................................ 14
2. Other fuel cell types .................................................................................................... 16
II. Current limitations of PEM fuel fells .................................................................................... 17
A. Gas diffusion layer and crossover .................................................................................. 17
B. Catalyst ........................................................................................................................... 18
1. On the anode side ....................................................................................................... 18
2. On the cathode side..................................................................................................... 19
C. Economic goal ................................................................................................................ 20
III. Direct ethanol fuel cell ....................................................................................................... 20
A. General reaction mechanism .......................................................................................... 21
B. Current catalysts employed ............................................................................................ 23
1. Platinum based anode catalyst .................................................................................... 23
2. Other alloys................................................................................................................. 27

4
C. Conclusions on potential future catalyst ........................................................................ 28
1. Structure...................................................................................................................... 28
2. Reactivity .................................................................................................................... 28
D. Iridium based catalysts: a promising pathway ............................................................... 30
Chapter 2: Methodology ............................................................................................................... 31
I. Density functional theory ...................................................................................................... 31
A. Schrödinger equation...................................................................................................... 31
B. Born-Oppenheimer approximation ................................................................................ 32
C. The Kohn-Sham equation ............................................................................................... 33
1. First Hohenberg and Kohn theorem ........................................................................... 33
2. Second Hohenberg and Kohn theorem ....................................................................... 34
D. Approximate functionals ................................................................................................ 34
1. Local density approximation (LDA) .......................................................................... 35
2. Generalized gradient approximation (GGA) .............................................................. 36
3. Perdew, Burke and Ernzerhof (PBE) functional ........................................................ 36
E. The Kohn-Sham equation ............................................................................................... 37
F. Pseudopotential .................................................................................................................. 37
G. Wave function modeling ................................................................................................ 38
1. Basis set ...................................................................................................................... 38
H. Solving algorithm ........................................................................................................... 40
I. Periodic boundary conditions ............................................................................................ 43
II. Simulation details.................................................................................................................. 44
A. Simulation Parameters .................................................................................................... 44

5
B. Surface Model ................................................................................................................ 44
C. Model Verification ......................................................................................................... 47
D. D. Linear Scaling Correlations ....................................................................................... 48
Chapter 3: Results and discussion................................................................................................. 51
I. Introduction ........................................................................................................................... 53
II. Results and discussion .......................................................................................................... 56
A. Segregation of the alloy .................................................................................................. 56
B. Adsorption energies ........................................................................................................ 57
1. CO ............................................................................................................................... 57
2. CH ............................................................................................................................... 60
3. CHCO ......................................................................................................................... 61
C. Effects of Adsorbates on Segregation ............................................................................ 64
D. Alloying Effects ............................................................................................................. 67
E. Activation energy of the ethanol oxidation reaction: C-C Bond Breaking .................... 70
F. Towards an economically viable catalyst .......................................................................... 72
Conclusion .................................................................................................................................... 75
References ..................................................................................................................................... 77
Appendices .................................................................................................................................... 83
Appendix 1: Sample Input file for Pt overlayer ............................................................................ 83
Appendix 2: Sample output file (Pt overlayer, bare surface) ........................................................ 87

6
List of figures
Figure 1. Direct ethanol fuel cell .................................................................................................. 13
Figure 2. Illustration of a near-surface alloy (on the left) and platinum doping on an iridium
catalyst (on the right).. .................................................................................................................. 25
Figure 3-Diagram of the DFT solving process ............................................................................. 42
Figure 4. Illustration of periodic boundary condition. .................................................................. 43
Figure 11. Ir (111) alloyed surface showing a Pt/Ir overlayer structure (top) and Pt/Ir Underlayer
structure (bottom). ......................................................................................................................... 45
Figure 12. Top and side views of CH and CO adsorption. ........................................................... 47
Figure 13. Comparison of adsorption energies (in eV) for H, CH, CH3, CO and O over Ir (111)
surface slabs. ................................................................................................................................. 48
Figure 14. (a) CHCO geometry on a Ru/Ir overlayer structure. (b) CHCO geometry on a Ti/Ir
overlayer structure.. ...................................................................................................................... 62
Figure 9. Illustration of adsorbate-induced segregation for the case of an Ir/V alloy. ................. 65
Figure 10. Stability of bimetallic structures with respect to CO-induced segregation.. ............... 66
Figure 11. CO adsorption energies over the underlayer (Ir/M/Ir) alloys. ..................................... 68
Figure 12. CH Adsorption energies over the Ir/M/Ir catalyst structures ...................................... 69
Figure 13. CO adsorption energies over the overlayer (M/Ir/Ir) alloys ........................................ 70
Figure 14. CH adsorption energies over the overlayer (M/Ir/Ir) alloys. ....................................... 70
Figure 15. Activation energies versus CO adsorption energy for the various alloys in their
preferred configuration ................................................................................................................. 73

7
List of Tables
Table 1. Summary of performance of single direct ethanol fuel cell tests adopting different anode
catalysts (90 ◦C) [30] .................................................................................................................... 26
Table 2. Calculated segregation energies according to Equation 5.. ............................................ 57
Table 3. CO adsorption energies on both under- and overlayer alloy surfaces.. .......................... 58
Table 4. CH adsorption energies on both under- and overlayer structures.. ................................. 61
Table 5. CHCO adsorption energies on both the under- and overlayer alloy structures.. ............ 62
Table 6. Activation energies for the reaction step CH+COCHCO over different Ir/M bimetallic
structures using the BEP correlation from Wang et al.[7]. ........................................................... 71
8
Abstract
Recent experimental as well as theory work reveals that iridium core-rich catalysts might
be a potential substitute to the classic platinum catalyst used for enhancing the ethanol oxidation
reaction in direct ethanol fuel cells. Platinum catalysts are susceptible to CO poisoning and have
a hard time breaking C-C bonds, which is necessary for CO oxidation. Thus, we explored the
catalysis of this reaction using iridium based bimetallic alloy structures as catalysts. Iridium was
alloyed with another transition metals M in an overlayer (one layer of metal M on top of bulk
iridium) or subsurface configuration (M is inserted under the first layer of iridium) to define the
composition of the catalyst.
The catalyst properties were determined using Density Functional Theory calculations with the
CP2K program. More precisely, we aimed at determining the activation energy of the proposed
rate determining step of the breakdown of ethanol: . The adsorption energy
of each component involved in this step was calculated.
Segregation energies were calculated and the subsurface configuration was the most stable
configuration in the vast majority of alloy cases. CO adsorption was also studied and a lower CO
adsorption energy was reduced in nearly all alloy cases compared to pure Pt (having a CO
adsorption energy of -2.17 eV), providing encouraging results about the possibility of reducing
CO poisoning. Activation energies were lowered in almost every case for an underlayer
structure, reinforcing our interest in the underlayer structures or ―subsurfaces‖. Finally, we
found, based on the CO adsorption energies, activation energies of the C-C breakage reaction,
and metal cost, a number of promising catalysts for the ethanol oxidation reaction. The most
interesting ones all adopted the underlayer structure Ir/M/Ir. With M = Ta, Hf Nb, V, Zr, they

9
demonstrated enhanced catalyst properties with high reactivity and high CO tolerance, with the
advantage of reducing the cost of the catalyst, substituting expensive platinum group metals by
more affordable components.

10
Introduction
Increasing demand for alternatives energies brings up the question of finding new and greener
ways of producing and supplying energy to the world population. A promising path is the one
offered by fuel cells. Fuel cells can produce electricity as long as fuel is supplied to the cell, and
generally release non toxic products.
Among this broad domain arises a specific type of fuel cell called direct ethanol fuel cells
(DEFC) based on a proton exchange membrane and related to the direct Methanol Fuel Cell
(DMFC). This ―green‖ technology produces energy from ethanol and oxygen, converting them
into water and CO2.
The associated carbon footprint of a DEFC is smaller than current gasoline-based combustion
engines due to the fuel cells‘ efficiency. Moreover, ethanol is easy to produce in large quantities
(by fermentation of biomass for instance) and could come from agriculture so that any CO2
released in the atmosphere could be consumed during biomass production, potentially giving a
carbon-neutral process.
However this technology is not viable yet due to various difficulties. On the anode side, the
complete oxidation of the ethanol is difficult to reach while on the cathode side oxygen reduction
can also be an issue and impair the overall efficiency of the device. Thus different research
groups are currently working on finding new catalysts, both for the anode and the cathode
reaction which would meet the conversion and economic requirements. The general guideline
followed by researchers aims at experimenting with new alloys based on previously established
catalyst such as platinum (the alloy can be binary but also ternary) but also using completely
different elements.

11
Looking at previous results [1][2][3][4]extracted from the literature, iridium based catalysts seem
to be a viable option and it is fundamental to be able to model this type of catalyst, thus using
DFT calculations, in order to determine the surface reaction energies reactions or the geometry
of the catalyst for optimized performance. A presentation of this technique will be given along
with describing the various dilemmas involved in the development of new iridium based catalyst.
As mentioned earlier, our attention was especially directed towards the anode oxidation reaction
of the ethanol and more precisely a potential rate determining step of this equation: the C-C bond
breaking. Ferrin et al.[5] studied ethanol decomposition over various metals (including iridium)
and found the experimental rate-determining step to involve C-C bond breaking in ketenyl, in
agreement with another DFT study led by Alcalá et al. [6] which investigated C-O and C-C
cleavage pathways over Pt(111).
Based on these previous findings, the reactivity of Ir-based catalysts for the Ethanol Oxidation
Reaction has been investigated by considering the model reaction of ethanol decomposition,
using bimetallic structures made of Ir and another transition metal. Emphasis was placed on the
rate determining step that is CHCO CH + CO; determining activation energy using previously
established BEP correlation [7], estimating CO-poisoning as well as economic sustainably of the
catalyst looking at the prices of the catalyst employed. D-band center theory [8] was also
employed to generalize results about the alloying effects and the classical correlation between d-
band center of an atom and its adsorption properties was demonstrated.

12
Chapter 1: Background Information
I. Fuels cells
Fuel cells were first invented in 1839 by William Grove and have been subject to numerous
improvements since. Nowadays, the application of fuel cells are countless and range from
primary power source for some vehicles, or even submarines, to backup power for commercial
buildings.
A. General structure
Various types of fuel cells exist depending on the type of fuel, membrane or catalyst used (anode
or cathode) but they all consists of two electrodes, an anode and a cathode of appropriate
material, separated by an electrolytic membrane (solid oxide membranes, polymeric proton
conducting films, etc [9]). Fuel cells differ from batteries having a different fuel management
system. In a fuel cell, the fuel is injected at the anode while oxygen is supplied to the cathode
and electricity results from the two reactions going on simultaneously at the anode and the
cathode introducing an electron transfer. Energy will be produced by the system until the fuel is
supplied contrary to a battery where the amount of fuel is initially fixed. The efficiency of the
device is dependent on the ability to transfer the electrons produced at the anode through the
circuit to the cathode while ions are transferred through the electrolytic membrane. The ability to
decompose the fuel at the surface of the anode plays also an important role in the process of
producing energy and can seriously impair the overall efficiency of the fuel cell. Depending on
the fuel it can be more or less easier to break up the molecule and obtain the desired reaction.
While it can be relatively easy with H2 (very small molecule), decomposing methanol or even

13
ethanol (CH3CH2OH, breaking up the C-C bond is very difficult) can be a much more
complicated challenge.
Figure 1. Direct ethanol fuel cell, the ethanol undergoes an oxidation reaction at the surface of
the anode catalyst resulting in the production of CO2 while the proton created by this oxidation
reaction migrate through the membrane before reacting with the oxygen from the air on the
cathode catalyst and forming water.
The general difference between different fuel cells is the membrane used between the anode and
cathode. Below is a description of the different fuel cell types.

14
B. Potential Fuels
Hydrogen has been the fuel of choice for over a decade but the difficulty to find a clean
production process and other problems such as storage (which may require a high pressure tank
operating at 200-700 bar, or a cryogenic tank working at -223 °C [9] [10]) has lead the scientific
community to gain interest in other fuels. Other types of fuels have been investigated and
alcohols as hydrogen carriers (methanol, ethanol) are a potential substitute to hydrogen. The
ethanol powered device presents a better efficiency than the one of a Carnot cycle with a high
thermodynamic efficiency around 70%[11] [2] . The liquid form of ethanol in standard
conditions provide the advantage of being easy to store and they could potentially be distributed
through the same system that the one currently used for gasoline [11] [12]. Besides, these fuels
also present a good energy density, close to the one of gasoline [13] and can be produced in
important quantities from agricultural products [14]. It is also a renewable biofuel from the
fermentation of biomass. Ethanol and methanol fuels are by far the most studied alternative fuels
to hydrogen and between these two; ethanol has the highest energy density and a lower toxicity
compared to methanol[2] [14] [15].
C. Fuel cell types
1. Proton exchange membrane fuel cells
A classic proton exchange membrane fuel cell (PEMFC also called polymer electrolyte
membrane) is made of a proton conducting membrane (the electrolyte) between two electrodes
generally made of porous carbon containing a platinum catalyst. As usual, PEM are mainly used
with hydrogen but not only, other fuels such as diesel, methanol or ethanol have been employed
with a reforming process involved in some cases. Those will be detailed later on. For example,
the mechanism of this fuel cell in the case of hydrogen is the following but other fuels would

15
also lead to similar reactions. First, the hydrogen diffuses to the anode catalyst where it
undergoes an oxidation, dissociating into protons and electrons. Protons are conducted through
the membrane (thus the name of the membrane) to the cathode while the electrons follow the
classical path encountered with fuel cells, going in an external circuit (supplying power) because
the membrane is electrically insulating. At the other electrode, oxygen molecules react with the
electrons (which have traveled through the external circuit) and protons to form water which in
this case is the only waste product (CO2 would be the other waste product in the case of
hydrocarbon fuels).
In the literature, polymer electrolyte membrane (PEM) fuel cells have been reported having a
great efficiency when hydrogen, or a hydrogen rich gas, is supplied to the device [11] and do not
need high temperatures to operate.
PEM fuel cells were initially used for space program since they were extremely expensive but
their cost tend to be reduced by scientific progress such as low platinum loading on the catalyst
or the use of thin film electrodes. Its coast now reached a level where the possible applicable of
PEM fuel cells to vehicle is discussed. PEM fuel cells are a good candidate for portable
application due to their compact form and low running temperatures.
Hydrogen was for a long time the only fuel employed with such a device but PEM systems that
used methanol were developed. The most interesting part of these devices called Direct Methanol
Fuel Cell is that they were able to internally reforming the methanol to obtain hydrogen without
any prior treatment. This success lead the scientist community to experiment other types of fuel
with a PEM fuel cell and that is how direct ethanol fuel cells were invented. Nevertheless, these
16
devices represent a more challenging problem when it comes to pick the right catalyst since
numerous steps are involved due to the internal reforming reaction.
The efficiency of these devices is much more than the one of a Carnot cycle with the theoretical
value of the maximal efficiency of 83% with hydrogen and with practical value ranging from 40
to 70% depending on the fuel and the internal composition of the fuel cell. Theses energy losses
are mainly due to three major factors that are the ohmic losses, activation and mass transports
losses. For more information on efficiency considerations for the PEM fuel cells, please see the
section ―Current limitations of PEM fuel fells‖.
2. Other fuel cell types
PEM fuel cells are only one of the numerous types of fuel cell one can encounter and we will
give here a few example of what can also be found aside from PEM.
Solid oxide fuel cells differ from other fuel cells by using a solid electrolyte made of ceramic
(called yttria stabilized zirconia (YSZ)). Contrary to the PEM fuel cells, high temperatures are
required in order to work. The way the fuel cell is operating is unique since it involves negatively
charged ions traveling from the cathode to the anode (whereas usually positively charged ions
travel toward the cathode). Oxygen reacts at the cathode with electrons producing oxygen anions
(Cathode Reaction: O2 + 4e– → 2O
2−) that go through the membrane to react at the surface of the
anode with the hydrogen gas realizing electrons Anode Reaction: 2H2 + 2O2−
→ 2H2O + 4e−).
These electrons are then going to the cathode using an external circuit (responsible of the energy
production) before starting a new cycle. As with the previous type of fuel cell, water and, in
some cases, depending on the fuel, CO2 are the only by-products of this device. Light
17
hydrocarbons can also be employed as fuel since SOFC‘s are capable of internally reforming
these components but heavier hydrocarbons requires an external reformer.
This third type of fuel cells relies on the transfer of negative carbonate ions across the
membrane. Molten carbonate fuel cells use an electrolyte made of a lithium potassium carbonate
salt that liquefies at high temperatures. This liquefying step is determining for this device so it
can only work under high temperatures (around 650°C). Similarly to SOFC/S, MCFC‘s can only
reform light hydrocarbons. The hydrogen in the gas reacts with carbonate ions from the
electrolyte to produce water, carbon dioxide, electrons and small amounts of other chemicals
Anode Reaction: CO32−
+ H2 → H2O + CO2 + 2e−). The electrons travel through an external
circuit creating electricity and return to the cathode. There, oxygen from the air and carbon
dioxide recycled from the anode react with the electrons to form carbonate ions that replenish the
electrolyte, completing the circuit (Cathode Reaction: CO2 + ½O2 + 2e− → CO3
2−).
II. Current limitations of PEM fuel fells
A. Gas diffusion layer and crossover
As you can see on Figure 1, PEM fuel cells have a two gas diffusion layers on each side of the
fuel cell, each one being associated either with the anode or the cathode catalyst. The role of the
gas diffusion layer is to guarantee an easy access for the fuel and the oxidant to the anode
catalyst and the cathode catalyst surfaces respectively. Thus, the gas diffusion layer must have
excellent diffusion properties for the reactants to diffuse to the catalyst but also high in-plane and
through-plane electronic conductivity since it is also use as a conductive media for the electron
to reach the external circuit. Understanding the mechanisms occurring in the gas diffusion layer
is of critical importance to optimize the performance of PEM fuel cells; numerous studies are

18
currently done in order to comprehend this complex system and improve it in order to reduce the
energy loss due to mass transport consideration.
Another cause of a decreasing efficiency in a fuel cell over the time is known as gas crossover. It
corresponds to the ability for the reactants to go through the membrane before reacting, it can be
caused for instance by the development of pinholes[16] inside the membrane preventing it from
fulfilling its purpose of allowing only protons to diffuse and no gas permeation. Therefore, some
reactant is able to go through the membrane shortening the fuel cell. This phenomenon results in
an efficiency decrease since some mixed potential are established on each side of the fuel cell but
also, as one can anticipate, due to the creation of hot spots, faster degradation of the membrane
and fuel shortage. A balance has to be reach between the durability of the membrane and its
resistance to proton flow which is minimized by making it as thin as possible (typically 50μm).
B. Catalyst
1. On the anode side
Current catalysis studies tend to improve two major factors that influence the performance of the
fuel cell: the catalyst activity and the catalyst poisoning. The most common catalyst for PEM
fuel cell is made of porous carbon with platinum on its surface. It is used for both fuel oxidation
and oxygen reduction but its activity needs to be greatly enhanced in order to become a viable
alternative. Different methods are employed to increase the activity of the catalyst such as
increasing its surface area using nanoparticles. The shape of the catalyst is also a matter of
concern since different facets have exhibited different activities, due to the density of reactive
site varying depending on the atomic surface organization. Last but not least, another way of
improving the catalyst activity is by looking at different alloys, generally made of platinum and
19
another transition metal. By doing so, one would change the electronic structure at the surface of
the catalyst and be able to improve its overall performance.
As mentioned above, reducing the poisoning of the catalyst by impurities, especially carbon
monoxide (CO) is the other challenge that catalysts have to solve. CO binds very strongly at the
surface of the current platinum catalyst and its activity decreases as the surface gets more and
more poisoned by CO. Even if pure hydrogen should not contain any carbon monoxide, its
production process from the reforming of lights hydrocarbons results in a small content of CO in
the mixture , yet enough to poison the catalyst. Production of pure hydrogen by electrolysis
being currently not economically interesting, researchers focused their efforts on reducing the
CO content by trying to reduce its adsorption energy on the catalyst or by enhancing its oxidation
process into CO2. To do so they are using the same approach as the one for improving the
catalyst activity: varying the surface geometry and electronic structure of the catalyst by
changing the exposed facet or changing the catalyst composition (alloys, surface doping)
Therefore, the search for a better catalyst implies to consider both the catalyst activity and its
poisoning ability mutually.
2. On the cathode side
Cathode catalysts also need improvement. Indeed, the oxygen reduction occurring at its surface
is not perfectly understood yet and problems like gas crossover affect its efficiency. The purpose
of this work is to focus on the anode catalyst and its reactivity but one should remember that
similar problems can be encountered on the cathode side and that it should be taken into
consideration when improving current fuel cells.

20
C. Economic goal
In order to improve the electron transfer, much amelioration can be made on the fuel cell by
changing its anode or cathode composition, the type of the membrane or even the fuel employed.
The U.S. Department of Energy's has fixed some objectives for the future of fuel cells [17]. The
price of the kW produced with an hydrogen fuel cell went down from $275/kW in 2002 to
$49/kW in 2011 mainly due to the development of durable membranes and electrodes, and the
reducing of the amount of platinum group metals (Ru, Rh, Pd, Os, Ir,Pt) used as anode and
cathode catalyst This encouraging progress has led to the objective for 2017 of reaching an
energy price of $37/kW. Numerous solutions are already under investigations to meet this goal
such as reducing the cost of producing hydrogen using natural gas and biofuel, increasing the
storage capacity of the hydrogen and its transportation cost, while also decreasing the material
costs of the fuel cell.
III. Direct ethanol fuel cell
Direct ethanol fuel cells are based on the same principle as hydrogen fuel cells except that they
use ethanol as a fuel with no need for a prior refining process (converting ethanol into H2 before
pumping the fuel into the fuel cell). This concept has been strongly inspired by direct methanol
fuel cells. The present advantages of ethanol over methanol are having a better energy density
and lower toxicity. Ethanol is also a liquid under atmospheric pressure and ambient temperature
similar to current petroleum based fuels which would simplify the distribution process if such a
fuel were going to be adopted as a significant source of energy.

21
A. General reaction mechanism
Like any other fuel cell, the direct ethanol fuel cell has an oxidation reaction going on at the
anode (the ethanol oxidation reaction) and a reduction at the cathode (oxygen reduction
reaction). The complete oxidation mechanism involves several intermediates and is presented
below. It involves 12 electrons and releases only water and CO2 as a byproduct (extracted from
[2]):
Complete oxidation path:
{1}
It is the result of an oxidation reaction at the anode:
{2}
and a reduction reaction at the cathode:
{3}
giving an overall reaction
{4}
A comprehensive description of the mechanism of ethanol oxidation reaction (EOR) is still under
investigation by the scientific community but some general steps are largely accepted. An initial
step may involve dehydrogenation, while subsequent steps may lead to intermediates such as
acetaldehyde and acetyl [1][18]. A large number of other intermediates are formed due to the
numerous C-H, C-O and C-C bond scissions that occur during ethanol oxidation. The scientific
22
community has not been able to determine the precise mechanism but only that two general class
of adsorbed intermediates C1ad and C2ad, which represent fragments with one and two carbon
atoms respectively, are formed.
CH3CH2OH → [CH3CH2OH]ad→ C1ad, C2ad → CO2 (total oxidation) {5}
CH3CH2OH → [CH3CH2OH]ad→ CH3CHO → CH3COOH (partial oxidation) {6}
A simple bond analysis between the intermediate and the final product, CO2, shows that breaking
a C-C bond is inevitable. This is actually one of the most important steps in ethanol electro-
catalysis. The difficulty to break the C-C bond results in high concentration of partial oxidation
products, CH3CHO and CH3COOH, at the surface of platinum catalysts which causes a
significant drop in the efficiency of the direct ethanol fuel cell. It also substantially alters the
environmental aspects of such a device by producing undesirable byproducts.
The difficulties to precisely establish the mechanism of the ethanol oxidation reaction lead the
scientist community to try different ways to understand this reaction. One common approach is
to try to improve the reaction associated with the rate determining step (RDS). For the ethanol
decomposition reaction, and more precisely for the C-C bond breaking reaction, the RDS over
transition metal has been suggested by different DFT studies [5] [6] to be the following step:
{7}
It has to be noted that these results were obtained considering the ethanol decomposition and not
the ethanol oxidation (the reaction occurring in a fuel cell) but this approach was recently
showed to give results in agreement with the experiment comparing pure platinum to pure

23
Iridium and Ir/Ru alloy [3]. Experimental studies also proposed the same intermediates for the C-
C bond breaking reaction at the surface of a platinum[6] or Iridium catalyst[1].
B. Current catalysts employed
1. Platinum based anode catalyst
Catalysis is a surface effect so the size of the surface has a crucial importance on the
performance of the catalyst since the wider the surface, the more adsorption sites available for
the reactants. Consequently, since only the surface (and the few layers underneath are of
importance) a typical type of catalyst is made by dispersing the active phase on a conductive
support like carbon to avoid the use of catalysts material as a support and saving money doing
so. Although carbon supported platinum is one of most used anode catalyst in low temperature
fuel cells, it is far from being the most efficient one for the Direct Ethanol Fuel Cell.
With the objective of improving the catalyst efficiency for the Ethanol Oxidation Reaction
(EOR) (but also the Oxygen Reduction Reaction) it is necessary to find new electro catalysts
that would increase the overall kinetics of the reactions but also shift the EOR towards a
complete oxidation. This would release more electrons, thus more energy at the outlet of the fuel
cell. In other words it increases the selectivity of the reaction towards CO2 formation [10].
Indeed, on the current Pt based anode catalyst incomplete oxidation of the ethanol produces
acetaldehyde and acetic acid that delivers only 2 and 4 electrons [2][11]. This incomplete
oxidation process needs to be compared to complete oxidation that forms CO2 and releases a set
of 12 electrons [2] [11].
Partial oxidation: {8}
24
DEFC anode catalysts have been extensively studied but most of the work has been performed
using platinum. Nevertheless, it has been shown that the loading of platinum needs to be reduced
by a factor 3 to achieve a economically viable device [19]. Different methods have been
employed to do so such as reducing the Pt loading by using alloys instead or a pure Pt catalyst,
by using carbon supports or even using other materials like carbides and oxides as an anode
catalyst [20].
One major trouble encountered by the current ethanol fuel cell catalyst based on Pt is their strong
tendency to be poisoned by CO [21] [22] which is an intermediate in the oxidation reaction or
can be present in fuel streams. Pt binds too strongly with the molecule leading to a catalyst
surface almost saturated with carbon monoxide[23]. This results in not having enough free
surface area for the oxygen to adsorb and, consequently, to oxidize CO into CO2 [23] [24]. This
poisoning effect needs to be overcome by modifying the surface so the oxygen coverage can be
increased via the adsorption of OH coming from the dissociation of water. The modification of
the surface is often done by adding another element[10] [14][24] [25] [26] that changes the
properties or by even adding a third one in some cases [14]. A common approach has DFT and
experimental studies being conducted at the same time on the subject. While experimentalists try
to improve the catalyst through a trial and error approach, DFT calculations let us extract some
trends that can be used to find the optimal catalyst. Nevertheless, numerous problems are
encountered in simulation with the first one being finding a good trade-off between a reasonable
computer running time and a good accuracy. Different alloys structures have been studied from
doping to near surface alloys (NSA)[27] or even core/shell structures [22] [28]. NSA‘s regroup
the catalysts that are made of an atomic layer of a transition metal inserted in the top or second
layer of a catalyst while a core/shell structure is a stFcture where a strong segregation between

25
the metals constituting the alloy exists and where one of them tends to segregate towards the
surface (the shell) and the other preferentially stays inside (the core). Finally, doping is a
technique that consists in introducing a few atoms in the structure of a catalyst in order to
slightly modify its electronic properties, for instance Figure 2 illustrates an Iridium catalyst
doped with some platinum atoms.
Figure 2. Illustration of a near-surface alloy (on the left) and platinum doping on an iridium
catalyst (on the right). Platinum atoms are represented in white while Iridium atoms are blue.
An illustration of what is currently being done with platinum based catalysts will be discussed
below with two of the most efficient catalysts involving platinum.
a) Pt-Ru/C
Concerning the oxidation mechanism of ethanol, Schmidt et al.[29] observed that the presence of
ruthenium partially inhibits the formation of chemisorbed species coming from dissolved
ethanol. Hence, oxidation happening mostly with weakly adsorbed species, the selectivity
between partial and complete oxidation of ethanol was found to be higher compared to pure
platinum. Indeed, the authors claim that ruthenium addition enhanced ethanol oxidation
performance; probably due to the strong adsorption of OH on the Ru sites. Tests in direct ethanol

26
fuel cells showed that the cells with Pt–Ru/C as anode material perform better than those with
Pt/C [29][30]. Pt-Ru/C always demonstrated a maximum power density (MPD) for a single
DEFC in the range 70-100◦C superior to the one with Pt/C as anode catalyst.
b) Pt-Sn/C
This type of binary catalyst is typically composed of an fcc Pt-Sn alloy and Sn and Pt oxides.
The relative amount of Pt–Sn alloy versus SnO2 affects strongly the electrochemical activity of
these catalysts. DEFCs with Pt–Sn/C as anode material performed better than those with Pt–
Ru/C [29][30] as shown in Table 1.
Catalyst
Open
Circuit
Voltage
(mV)
Voltage at 30
mA cm−2
(mV)
Voltage at 60
mA cm−2
(mV)
Maximum
Power
density
Pt 547 275 177 10.85
Pt-Ru(1:1) 677 461 368 28.54
Pt-Sn(1:1) 811 662 576 52.22
Table 1. Summary of performance of single direct ethanol fuel cell tests adopting different anode
catalysts (90 ◦C) [30]
The performance of various Pt–Sn/C (2:1) and Pt–Ru/C (1:1) catalysts as anode materials were
compared by Song et al. [31]and they showed that the preparation method has a significant
effect. They prepared by two different ways a binary catalyst Pt-Sn/C and obtained different
results depending on the current density. Pt–Sn/C with different preparation methods shows

27
almost similar behavior for low current density, however, increasing the current density results in
a variation of the performance of the cell. This difference is attributed according to the authors to
a higher content of Sn oxide one of the two preparations leading to a higher internal cell
resistance and consequently affecting the cell performance
2. Other alloys
Other studies not based on platinum catalysts have been conducted on the anode reaction but the
literature in this area is still in infancy. Souza and al[21] reported the activity of a pure rhodium
anode catalyst to show a significant overall lower reaction rate compared to pure platinum.
Moreover, the authors investigated the alloy reactivity of a rhodium/platinum catalyst and
showed that adding rhodium increased the carbon dioxide yield versus the acetaldehyde yield
(complete oxidation pathway vs incomplete oxidation). However, this alloy was able to show
good activity only for small ratio Rh/Pt. Consequently, the use of a different alloy catalyst was
suggested such as ruthenium which, as we have just described in the previous section, is a very
promising cocatalyst.
A recent study[15] looked at the possibly of substituting Pt by another PGM with an lower cost
to meet economical goals. Thus, they tested palladium/tin alloys due to the excellent catalyst
properties demonstrated by Pt/Sn alloys. Their conclusions stated that Pd-Sn demonstrated a
better catalyst activity under a high pH and high ethanol environment compared to commercial
Pd/C. They also highlighted the promoting effect of Sn on the catalyst properties similarly to
platinum based catalyst reinforcing the interest for tin as a cocatalyst. Unfortunately, no
comparison to pure platinum catalyst was conducted in this research work.

28
C. Conclusions on potential future catalyst
1. Structure
Various conclusions can be drawn from the previous experiments conducted with different
catalysts. The most promising pathway clearly seems to be the one consisting of alloy structures
that are resistant to CO-like species or promote C-C bond breaking if not both. For example,
experiments by Jiang et al [32] support this idea since they have been able to show that tin oxides
in the vicinity of Pt atoms offer oxygen species necessary for the removal of CO-like species via
their oxidation and are responsible for the augmentation of the number of free Pt sites (CO-like
species poisoning is reduced since they are oxidized by the oxygen species adsorbed on tin
oxide). The advantage of alloy structures is no longer to be proven with numerous binary
structure already tested; for example Pt–M with M=W, Pd, Rh, Re, Mo, Ti, Ce always
demonstrated a higher EOR activity[14] than pure platinum as an anode catalyst.
2. Reactivity
Different binary structures have been tried and the scientific community agrees on a number of
effects attributed to added metals. Ru has been proven [29] to partially inhibit the formation of
chemisorbed species coming from dissolved ethanol. It resulted in the oxidation pathway being
favored through weakly adsorbed species (physisorption mechanism) and the overall activity of
the catalyst to be better. According to the promoted mechanism, Antolini [14] attributed to Ru
oxide the capacity of strongly adsorbing oxygen atoms leading to an easier oxidation of adsorbed
species due to their close vicinity to metal sites. What is known as the intrinsic mechanism
suggests that the electronic structure of the catalysts surface is modified by the presence of Ru
and changes the adsorption properties of the latter. Camara et al.[33] showed that a content lower
than 20 at % of Ru in a catalyst was not enough to improve the cell performance (e.g the
29
oxidation reaction) reinforcing the idea that an Ru site need to be next a noble metal site where
the species may be oxidized.
The promoted mechanism is also presented in other terms by Du et al [3] where they argue that
in a binary system (noble metal / transition metal) higher transition metal content will generate
more OH complexes adsorbed on transition metal sites and OH complexes are responsible for the
oxidation of CO into CO2. However, a surface with very high transition metal content would
prevent the active noble metals from fulfilling their catalytic role and results in a decrease in the
overall performance of the cell
Similar findings have been established with Sn, which acts according to the promotion
mechanism (Sn sites adsorb oxygen and provide them to noble metal site for the oxidation
process) but Rousseau et al.[34] argue another point regarding the addition of tin to the catalyst.
It clearly appears that Sn addition improves the overall performance of the cell since the
oxidation of the ethanol is promoted but Sn also changes the product distribution: less CO2 and
acetaldehyde is produced while acetic acid is found is greater quantities indicating that the
addition of Sn does not promote the complete oxidation pathway (leading to CO2 ) neither the C-
C bond breaking.
To obtain the highest amount of energy out of the fuel but also to get a clean device releasing
only water and CO2, C-C bond breaking has to be favored and a few transitions metals
demonstrated such behavior. The addition of Rh seems to promote the C-C bond cleavage as
described by De Souza et al [21] while a more promising one, Mo, not only promotes the
oxidative desorption of intermediate like CO but also seems to favor the breaking of the C-C
bond[35].

30
D. Iridium based catalysts: a promising pathway
Elements from the platinum group metals (PGM) are well known for their exceptional catalytic
properties. Many experimental or theoretical studies can be found in the literature concerning Pt
[24] [26], Pd [15], Ru [36]and Rh[21] as catalysts for the EOR but little work as been conducted
with Ir. In 2007, experimental work with Ir and Sn was reported [4] and showed comparable
results to that of a Pt3Sn/C catalyst, currently one of the most efficient anode catalysts for the
EOR [26] [37]. More recently, Du et al. [2] showed using theoretical and experimental
techniques that iridium could be a very good catalyst candidate for the EOR obtaining an high
electrochemical activity compared to commercial PtSn/C catalyst with a Ir-Sn-SnO2/C catalyst.
They observed a core shell structure where Ir was concentrated in the core (center) of the
nanoparticles, while Sn was concentrated in the shell (surface) region. The same group worked
on a new Iridium based alloyed [3], iridium being associated with ruthenium this time. The alloy
reacted well with respect to the EOR showing enhanced activity compared to Pt/C or Ir/C. The
CO tolerance was also greatly enhanced with this alloy and its activity depending on the
experimental conditions was comparable or greater that Pt-Sn catalyst. In addition, this group
confirmed its experimental findings using DFT calculations with success which motivated us to
produce a similar DFT analysis on a larger scale.

31
Chapter 2: Methodology
I. Density functional theory
A. Schrödinger equation
Density functional theory is a computational technique that establishes an approximate solution
to the fundamental equation that describes the quantum behavior of atoms and molecules: the
Schrödinger equation. In its simple form, known as the time independent, nonrelativistic version,
the Schrödinger equation is with being the Hamiltonian operator and a set of
solutions of the Hamiltonian called eigenstates, also called wave functions. A wave function
describes the quantum states of a particle but has no direct physical meaning. Its closest physical
meaning is a probability amplitude since is the probability of finding a particle at a given
time in a given space. The Schrödinger equation does not have a unique solution and each
solution can be associated with its corresponding eigenvalue . The general expression of the
Hamiltonian operator is given by the following formula:
In the above equation, m is the electron mass, N the total number of electrons,
represents the kinetic energy of all the electrons, the electrostatic interaction energy
between different electrons and the atomic nuclei, and the electrostatic
interaction energy between electrons. is the electronic wave function, which is a function of
the spatial coordinates of all N electrons so and E is the ground-state energy
of the electrons.

32
An approximation known as the Hartree product considers that it is possible to write the wave
function as a product of individual electron wave functions to obtain
This will be useful later to reduce the number of variables in the Schrödinger equation. Indeed,
having a look at the equation in its current form, we realize that it is necessary to know the wave
function of all the electrons to calculate the wave function of only one electron due to their
interactions.
At this point, it can be interesting to define two quantities: the probability of the N electrons to
be at a position r given by:
and the density of electrons at a particular position r noted:
The probability is one of the only quantities that can be measured. The great difficulty of
modeling a system is to solve the Schrödinger equation to determine the system energy and wave
function.
B. Born-Oppenheimer approximation
DFT aims at calculating the energy of a collection of atoms and a fundamental approximation is
made in order to simplify the mathematical challenge that this problem represents. Atoms are
composed of electrons, protons and neutrons and a key observation was made in quantum

33
mechanics: electrons are much lighter than protons or neutrons ( ≈1:1800 ratio) in a nucleus so
they respond much more rapidly to changes in their surroundings than nuclei. The Born-
Oppenheimer approximation is based on this observation and states that we can consider that
only the electrons are moving around the nuclei according to quantum effects. The motion of the
nucleus is considered to be governed by the law of classical mechanic and is not subjected to any
quantum effect (no wave function represents the nucleus). For a given set of electrons moving
around a fixed set of nuclei, we define the lowest energy state of the electrons as the ground state
C. The Kohn-Sham equation
1. First Hohenberg and Kohn theorem
This theorem states that the ground-state energy from Schrödinger’s equation is a unique
functional of the electron density meaning that there is a direct correspondence between the
ground state wave function and the ground-state electron density.
A functional is a mathematical operator that associates a function with a specific value. It differs
from a function since a function uses as input a number and gives a number as output while a
functional uses a function as input and gives a number as output. For instance
is a
functional since it returns a numerical value as we enter a function:
34
Mathematically the Hohenberg and Kohn theorem can be written:
The ground state energy can be expressed by a functional that uses as an input the electron
density n(r). This theorem is important since it implies that instead of solving for the
Schrödinger‘s equation by looking at the ground-state energy defined by N electron wave
functions (one wave function per electron in three dimensions gives a total function of 3N
variables), we can solve it by looking for the electron density (function of only 3 space variables)
and then obtain the ground state energy from this density functional.
2. Second Hohenberg and Kohn theorem
The electron density that minimizes the energy of the overall functional is the true electron
density corresponding to the full solution of the Schrödinger‘s equation. In other words, the
ground-state electron density function is the electron density function that minimizes the
functional stated in the first Hohenberg and Kohn theorem {5}.
D. Approximate functionals
The Hohenberg and Kohn theorem does not give any information about the form of the
functional {5} so an easy way to write it is to separate its expression in two parts with the known
contribution on one part and the unknown part on the other.subject to parameterization and some
approximations; this second part is called the exchange correlation functional. It intends to take
into account all the quantum mechanical effects that are not included in the ―known‖ terms:

35
The known part can be written as follows:
with from left to right the various terms are: electron kinetic energy, the Coulomb interactions
between the electrons and the nuclei, the Coulomb interactions between pairs of electrons, and
the Coulomb interactions between pairs of nuclei.
1. Local density approximation (LDA)
Separating the functional in two terms give us a formal equation to solve but still does not define
the unknown part. Indeed, the general form of the functional is simply unknown. Fortunately,
there is one specific case where we know its expression: the uniform electron gas. In this case the
electron density is known to be constant ( ). The local density approximation
defines the exchange correlation potential by setting its value at each position to be the known
exchange-correlation potential from the uniform electron gas at the electron density observed at
this position. In other words, the local density approximation establishes a correspondence
between the electron density and the exchange correlation potential. It assumes that for a same
electron density at a specific position the exchange correlation potential is the same. Since we
know the exchange-correlation potential for the uniform electron gas in for any electron density
we use this value. In mathematical terms, this approximation is:
. This technique may seem simplifying large
simplification but gives a practical way to define the unknown part of the exchange correlation
functional, and, by extension, to use the Kohn-Sham equation.

36
2. Generalized gradient approximation (GGA)
The local density approximation assumes the exchange correlation potential only depends on the
local electron density at each position which is not the case in real materials. To create a more
realistic functional, the generalized gradient approximation (GGA) was developed and uses not
only the local electron density as a parameter but also its gradient. This can be summarized in the
following formula: . It is important to notice that there are
various GGA functional, such as (Perdew –Wang 91, Perdew-Burke-Ernzerhov, etc…) and that
while GGA functional are generally more accurate, this may not be the case for all chemical
systems. For surface reactions, however GGA exchange correlation functional are typically used.
Here, we detail the Perdew-Burke-Ernzerhov functional since this is the functional used in the
current work.
3. Perdew, Burke and Ernzerhof (PBE) functional
Perdew et al. published the details on this functional in 1996 [38] and it is still one of the most
widely use exchange correlation functionals. The Kohn-Sham equation, due to its specific
formalism has been proven to satisfy various properties that do not need to be detailed here but
the reader needs to understand that the approximation made by using an exchange correlation
functional may lead in these properties not to be satisfied anymore. Contrary to other famous
functional like the PW-91that were aiming at satisfying as many of these known properties; PBE
functionals were designed to satisfy only the energy significant ones More details on the PBE
functional are in the original paper [38].

37
E. The Kohn-Sham equation
Kohn and Sham showed that solving the previous equation for the electron density could be
reduced to a simpler problem that involves solving a set of equations in which each equation
only involves a single electron. This set of equations is called the Kohn-Sham equations:
The potential represents the interaction energy between different electrons and the nuclei,
is the Hartree potential between electrons defined by
and
is the exchange and correlation contribution to the single electron equations. It can be seen as a
―functional derivative‖ of the exchange-correlation functional:
.A related
approach is the Hartree-Fock method which does not take into account the correlation
contributions.
F. Pseudopotential
Pseudopotentials are a way to represent interactions between core and valence electrons. Since
valence electrons are mainly responsible for the reaction properties of an atom, the
pseudopotential approach models the complicated effects of the motion of the core electrons with
a fixed potential (these core electrons not being represented by a wave function in contrast with
valence electrons which are represented by wave functions). This leads to a decrease in the
number of wave functions needed to be found and the number of electrons represented by wave
functions (doing so, the computing time decreases). The differentiation between core and valence
atoms is usually based on electron ordering. For instance, 1s2s2p electrons may be described by
38
a pseudopotential for Na, while the 3s electron may be modeled by a wave function. CP2K uses
the Goedecker-Tetter-Hutter (GTH) pseudopotentials, and more information about this
pseudopotential can be found in the literature[39][40] .
G. Wave function modeling
Finding the wave function is a mathematical problem, and there must be a way to define the
wave functions for computational implementation. A wave function needs a specific
mathematical formalism to be represented in a manner that leads to the most accurate results but
also only requires reasonable amount of computer power. Consequently, there is often an effort
to try to reach a balance between good accuracy and fast computing time.
1. Basis set
A basis set is a set of function that is used to represent a wave function. The wave function is a
linear combination of these functions:
In this expression, we only need to find the coefficients to fully define the wave function since
the basis set is already defined. The higher the number of functions in the basis set, the better the
representation of the wave function will be but at an increase in the computing time.
a) Slater type orbitals (STO’s)
An early implementation of the basis set was composed of atomic orbitals (AO) and this
technique was called the Linear Combination of Atomic Orbitals (LCAO) meaning that

39
molecular orbitals were formed as a linear combinations of atomic orbitals. An atomic orbital is
a wave function representing only one electron in an atom and Slater Type Orbitals (STO‘s) have
been introduce as basis set functions due to their similarities with the atomic orbitals of
hydrogen-like atoms. STO‘s share the same mathematical formalism given as follow:
with the following definitions:
N is a normalization constant
are spherical coordinates of the electron
is the angular momentum part, usually using spherical harmonic functionswhich describing
the "shape" of the wave function)
are quantum numbers; respectively principal, angular momentum, and magnetic number
b) Gaussian type orbitals (GTO’s)
STO‘s are not usually computationally efficient, so an approximation of the STO‘s was proposed
using a linear combination of Gaussian functions. These functions have the advantage of being
easier to mathematically manipulate. Thus, from a computing perspective it is more efficient to
model an STO using 5 GTO‘s than using only one STO [41]. The general form of a GTO is the
following:
with the following definitions:

40
N is a normalization constant
is called the "exponent"
x, y, and z are Cartesian coordinates
l, m, and n are integral exponents that are fitted so the orbital looks like a real one.
c) Plane waves
Plane waves are often used for periodic systems, such as solids or liquids. A plane waves basis
set requires the use of a good pseudopotential since the core region of an atom is not represented
by the plane waves. A wave function expressed using a plane waves basis set has the following
formalism:
where G is the reciprocal lattice vector
is a fitted parameter
H. Solving algorithm
Performing a density functional theory calculation is equivalent to solving the Kohn-Sham
equations for a specific atom configuration. Nevertheless, the solving process is not a matter of
plugging known variables in the equation to get the solution. Since we have two unknown
variables, the electron density and the wave functions, the solving process requires making an
initial guess on one of the unknowns before calculating the other one using the Kohn-Sham

41
equation. Then, the consistency of the result has to be tested by expressing one variable as a
function of the calculated one and verify that we obtained the same value previously guessed. To
be more precise, we initially guess a value of the electron density and then deduce the wave
functions using the Kohn-Sham equation. We are left with the verification process that consists
in calculating the electron density using the wave functions. If the value of the electron density
from the initial guess and the verification do not match, the initial guess of the electron density
has to be adjusted. If they do, the convergence point is reached and it is called a self consistent
solution. Figure 3 gives an illustration of the process.

42
Figure 3-Diagram of the DFT solving process

43
I. Periodic boundary conditions
A common approach to represent a catalyst surface is to use periodic boundary conditions. The
user defines the desired structure in a 3d box called the unit cell and this box will then be
repeated in all directions. Typically, a vacuum region of at least 10 Å is present between two
catalyst surfaces leaving enough space for the adsorbate to adsorb at the surface of the catalyst.
This is done by fixing a unit cell size box along the z direction at least 10 Å bigger than the
thickness of the slab. Generally, the bottom layer(s) of the slab (the dark blue layer(s)) is also
kept fixed and no adsorption process is allowed on this surface (the adsorbate is placed on the
other side of the slab). A visual representation of a periodic boundary condition can be found in
Figure 4.
Figure 4. Illustration of periodic boundary condition. The unit cell contains the catalyst (dark
blue for iridium and light blue for the transition metal), the adsorbate (CHCO in this case) and a
layer of vacuum on top of the surface and is repeated in the 3 directions (x,y,z). Blue arrows are
drawn only for clarity; cells are right next to each other.

44
II. Simulation details
A. Simulation Parameters
All calculations were performed using the CP2K code[42] [43]. The PBE exchange correlation
function was used[38]. CP2K uses the Gaussian and Plane Wave (GPW)[44] method so electron
densities were treated by plane wave functions and molecular orbital were represented by
double-zeta Gaussian basis functions[45]. Core electrons were represented by Goedecker-Teter-
Hutter (GTH) pseudopotentials[39][46]. The current version of CP2K only samples reciprocal
spaces at the Γ point, which could potentially result in simulations errors. Consequently, the slab
that we used was rather large so any errors from k-point sampling were minimized. With the
exception of Ni, Co, and Fe, which display magnetic properties all bimetallic structures were
modeled as non-spin polarized, similar to previous work [47]. For instance, we calculated the CO
adsorption energy over a Au-Ir alloy to differ by only 10-4
eV between spin polarized and non-
spin polarized calculations.
B. Surface Model
The Ir (111) surface was modeled using the slab approach, with a 6x6 super cell under periodic
boundary conditions. Each slab was repeated periodically with at least 30 Å of vacuum between
neighboring metal slabs and was three atomic layers thick. The bottom layer of the slab was kept
frozen. Two different alloys configurations were used as shown in Figure 5: the first
configuration consisted of replacing the top layer of Ir with another transition metal (overlayer
structure), while the second consisted of replacing the middle Ir layer with another transition
metal (underlayer structure). Similar alloy structures were used by Greeley and Mavrikakis [27]
or by Su et al[24] in their study of near-surface alloys. Adsorption was allowed only on the top

45
layer of the slab. Transition metals between groups 4 (Ti, Zr, and Hf) and 11 (Cu, Ag, and Au) of
the periodic table were all alloyed with Ir.
Figure 5. Ir (111) alloyed surface showing a Pt/Ir overlayer structure (top) and Pt/Ir Underlayer
structure (bottom). Side and front views are shown. Pt and Ir atoms are respectively grey and
blue.
Adsorption energies were determined according the following formula:
{13}
where Eadsorbate/surface is the energy of the surface/adsorbate system, Esurface is the energy of the
clean surface, and Eadsorbate in gas phase is the energy of the gas-phase molecule. We modeled
adsorption of CO, CH, and CHCO over the various alloys. As previously mentioned, C-C bond

46
breaking is typically the hardest step in the ethanol oxidation reaction. Work by Alcalá et al. [6]
showed that C-C breaking of CHCO had the lowest barrier of various possible intermediates over
the Pt (111) surface. Later work by Ferrin et al. [5]expanded to other (111) surfaces, including Ir.
The rate-determining step was found to also involve CHCO C-C scission. Hence, we modeled
CHCO adsorption and its derivatives. CO was adsorbed on top sites which are the most preferred
sites over Ir (111) according to our calculations (see Figure 7) and previous experimental testing
[48], whereas for CH adsorption calculations by Abild-Pedersen et al. [49] reported that CH
adsorbs preferentially on threefold sites (hcp or fcc). Previous work also indicated that CH over
Pt (111) prefers hollow sites, with differences in energies between hpc and fcc sites less than 0.1
eV [3][50]. The adsorbed CHCO geometry had the CH group near a hcp site, so only CH in the
hcp position was modeled. The initial geometry of CHCO on the surfaces was taken first from
Alcala et al.[6], but this geometry did not necessarily converge to a stable configuration on
several alloys, so we modeled several other initial geometries involving the two C atoms either in
top, bridge, or hollow sites. The energies for the most stable configurations are presented in the
current paper.

47
Figure 6. Top and side views of CH and CO adsorption.
C. Model Verification
CP2K has previously been found to model Pt well [51] where calculated surface and bulk
properties of platinum were found comparable to previous literature results. We also conducted
our own tests in order to validate our approach. In Figure 7, we compare our adsorption results
over Ir to those obtained by Krekelberg et al [48]. They used a four layer Ir (111) slab,
periodically repeated in a 2x2 unit cell with five equivalent layers of vacuum between the metal
slabs. Similar to our work, adsorption was only allowed on one side of the slab and the first
layer of metal atoms was fixed in the bulk positions. Krekelberg et al. used a plane wave basis
set and the PW91 exchange correlation functional[52].
48
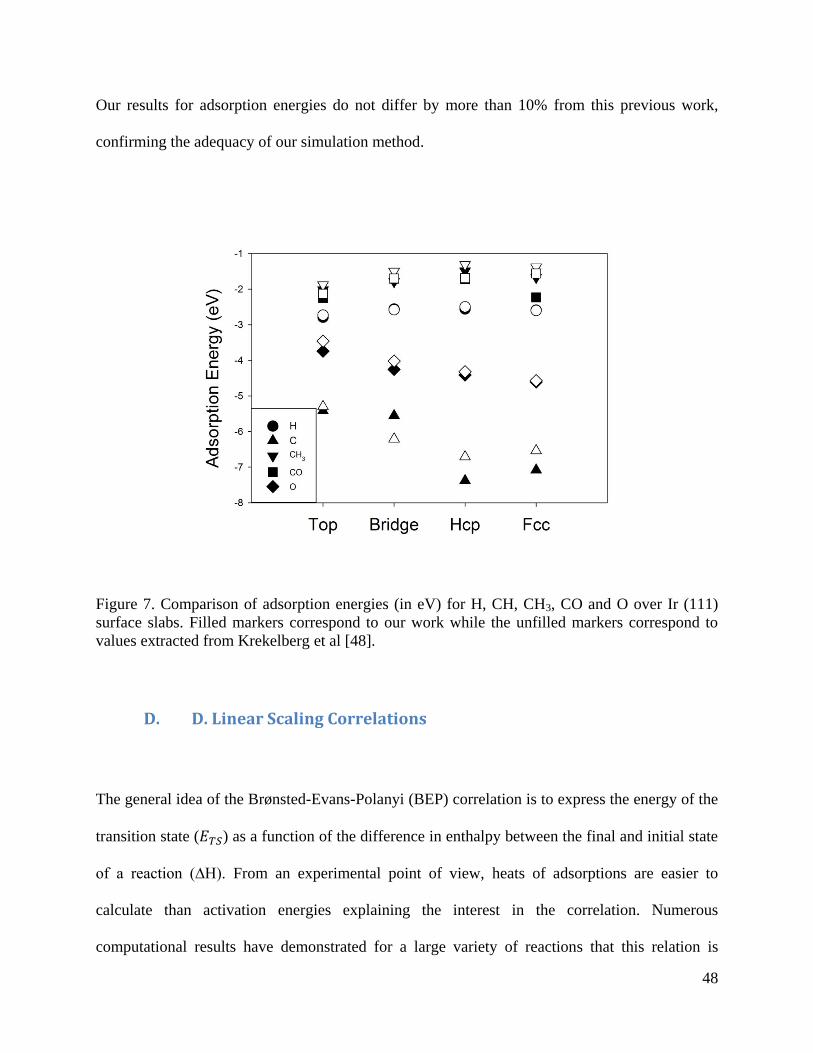
Our results for adsorption energies do not differ by more than 10% from this previous work,
confirming the adequacy of our simulation method.
Figure 7. Comparison of adsorption energies (in eV) for H, CH, CH3, CO and O over Ir (111)
surface slabs. Filled markers correspond to our work while the unfilled markers correspond to
values extracted from Krekelberg et al [48].
D. D. Linear Scaling Correlations
The general idea of the Brønsted-Evans-Polanyi (BEP) correlation is to express the energy of the
transition state ( ) as a function of the difference in enthalpy between the final and initial state
of a reaction (∆H). From an experimental point of view, heats of adsorptions are easier to
calculate than activation energies explaining the interest in the correlation. Numerous
computational results have demonstrated for a large variety of reactions that this relation is

49
linear. For instance, theoretical work conducted by Michaelides et al[53] showed that for
different classes of reactions such as dehydrogenation reactions and hydrocarbon cracking
reactions (C-C bond breaking) that the BEP correlation was a reliable way to calculate the
activation energy , while Dahl et al[54] were the first to quantify such a correlation for a surface
reaction in the case in heterogeneous catalysis, more particularly on top of different metal
surfaces. The explanation for such a correspondence between transition and adsorption energies
comes from the fact that the adsorption sites on the different surfaces are geometrically similar
but also very similar to the adsorption geometry during the transition state. Thus the transition
state energy and the adsorption energies vary in identical ways and the main difference from one
surface to another is the difference in the electronic structure that is captured by the adsorption
energy, and, thus, by the BEP correlation. Later on, Nørskov et al [55] concluded, based on DFT
calculations, that for a given class of catalytic reactions, there is often a universal correlation
between the transition state energy and the adsorption energy of the reaction intermediate.
Moreover, this universal correlation was shown to be reactant independent and the authors
emphasized the possibility of catalyst research that this universal correlation offers.
In this thesis, transition state energies were not calculated through DFT simulations due to time
concerns so we took advantage of the Brønsted-Evans-Polanyi (BEP) correlations that have
already been proven useful for reactions over metal surfaces. The parameters used in this thesis
were extracted from the paper published by Wang et al.[7] and lead to the following formula for
the reaction :
with and {14}

50
and are referenced relative to the reactant molecule in the gas so is defined by the
following formula :
{15}

51
Chapter 3: Results and discussion
―Screening Iridium-based Bimetallic Alloys as Catalysts for Direct Ethanol Fuel Cells‖
Julien Courtois, N. Aaron Deskins
Department of Chemical Engineering
Worcester Polytechnic Institute
100 Institute Road
Worcester, MA 01609
Abstract
Current ethanol oxidation catalysts in direct ethanol fuel cells (typically platinum-based)
suffer from low conversion and are susceptible to CO poisoning. Therefore we determined to
find viable alternative catalysts for ethanol oxidation based on iridium using density functional
theory to model bimetallic alloy (111) surfaces. Iridium was alloyed with another transition
metals M in an overlayer (one layer of metal M on top of bulk iridium) or subsurface
configuration (M is inserted under the first layer of iridium). Complete oxidation of ethanol is
limited by the breaking of strong C-C bonds, so any catalyst must lower the barriers for C-C
bond breaking. We modeled the reaction .Segregation energies were
calculated and the subsurface configuration was the most stable configuration in the vast
majority of alloy cases. CO adsorption was also studied and a lower CO adsorption energy was
found in many alloy cases compared to pure Pt (, providing encouraging results about the
possibility of reducing CO poisoning. Activation energies were lowered for the vast majority of
the alloys used in an underlayer structure, reinforcing our interest in the underlayer structures or
―subsurface‖ alloys. Finally, we found, based on the CO adsorption energies, activation energies
of the C-C breakage reaction, and metal cost, three important catalyst descriptors, a number of
promising catalysts for the ethanol oxidation reaction. The most interesting alloys all adopted the

52
underlayer structure Ir/M/Ir. With M = Ta, Hf, Nb, V, Zr, they demonstrated enhanced reactivity
and high CO tolerance, having the advantage of reducing the cost of the catalyst, potentially
substituting expensive platinum group metals by more affordable components.

53
I. Introduction
The world‘s energy demand is continually growing, and it is crucial to find alternatives to current
fossil fuels. Indeed, more efficient and environmentally friendly energy production processes are
needed. Numerous solutions are currently being investigated including fuel cells which may
produce energy with low environmental footprint. Polymer electrolyte membrane (PEM) fuel
cells have large theoretical efficiency when a fuel, such as hydrogen is supplied to the device,
much more than combustion which is limited by the Carnot cycle efficiency[11]. Nevertheless,
the problem of storage currently hinders the use of hydrogen as a fuel. For example, storage may
require high pressure tanks operating at 200-700 bar, or a cryogenic tanks working at -223 °C
[9][10]. Other fuels have been investigated, including alcohols such as ethanol or methanol.
Ethanol is an attractive fuel choice because it is easily stored as a liquid and has high energy
density[11][2][14][15], similar to gasoline‘s energy density[13]. Furthermore, ethanol can be
produced in important quantities from biomass[14].
Slow kinetics for the ethanol oxidation reaction (EOR) at the anode catalyst limits the efficiency
of DEFCs. For example, on current Pt-based catalysts incomplete oxidation of ethanol produces
acetaldehyde and acetic acid which releases only 2 and 4 electrons [2][11]. Complete oxidation
however forms CO2 and releases 12 electrons [2] [11], increasing the available electrical energy.
CH3CH2OH +3H2O → 12H+ 12e
- + 2CO2 (total oxidation) (1)
2CH3CH2OH +H2O → 6H+ 6e
- +CH3COOH + CH3CHO (partial oxidation) (2)
Current Pt-based catalysts are expensive and also suffer from CO poisoning. It is therefore
necessary to find new electro-catalysts that would increase the overall kinetics of the oxidation

54
reactions and increase the selectivity of the reaction towards CO2 formation [10]. DEFC anode
catalysts have been extensively studied but most of the work has focused on platinum.
Nevertheless, it has been shown that the loading of platinum needs to be reduced significantly,
such as by a factor 3[19], to achieve a economically viable device. Various attempts have been
employed to reduce the Pt loading, such using alloys or carbon supports or even using other
materials like carbides and oxides as anode catalyst [20]. Alloying by adding another
element[10][14][24][25][26] or by even adding a third element[14] has been a popular method of
catalyst development. Different alloys structures have been studied from metal doping to near
surface alloys (NSA)[27], or even core/shell structures [22] [28].
The bottleneck for efficient ethanol oxidation is believed to be breaking of strong C-C bonds
[10]. Various C-H, C-O, or C-C scission steps may occur at the catalyst surface, but complete
oxidation involves C-C bond breaking, while incomplete oxidation does not. Density functional
theory (DFT) calculations are commonly used to identify new potential catalysts and numerous
studies have been performed for ethanol oxidation/decomposition[56][6][37][57]. Ferrin et al.[5]
screened various transitions metals as catalyst for ethanol decomposition using Brønsted-Evans-
Polanyi (BEP) correlations to determine the activation barrier for each possible intermediate and
they have been able to show that, for most transitions metals, including iridium, the rate
determining step for C-C cleavage involves a CHCO intermediate being separated in two
molecules, respectively CH and CO. Another previous DFT study led by Alcalá et al. [6]
investigated C-O and C-C cleavage pathways over Pt for ethanol and concluded that C-C
scission was likely to proceed through a ketenyl species (CHCO).

55
Platinum group metals are well known for their exceptional catalytic properties. Ferrin et al.[5]
reported that metals such as Pt, Pd, Ru , Ir or Rh could be interesting candidates for the EOR.
Many experimental or theoretical studies can be found in the literature such as concerning Pt
[26][58][32][23], Pd [15], Ru[36][33][29]and Rh[10] as catalysts for the EOR but little work as
been conducted with Ir. Recent experimental work with Ir and Sn was reported [4] and showed
comparable results to that of a Pt3Sn/C catalyst, currently one of the most efficient anode
catalysts for the EOR [26][37]. More recently, Du et al. [2] also showed that Ir could be a very
good catalyst candidate for the EOR, obtaining a high electrochemical activity comparable to
commercial PtSn catalyst with an Ir-Sn-SnO2 catalyst. They observed a core-shell structure for
the Ir alloy. The same group developed a Ir-Ru alloy[3]. This alloy also showed enhanced
activity compared to Pt or Ir.
Motivated by previous experimental and theoretical work, the reactivity of Ir-based catalysts for
the EOR has been investigated, using core-shell bimetallic structures made of Ir and another
transition metal. Emphasis was placed on C-C bond breaking as a potential rate determining step
(CHCO CH + CO) and in identifying potential catalysts to replace Pt. Our efforts focused on
modeling a large number of alloys and screening these alloys for potential ethanol oxidation
activity. Accordingly, activation energies were calculated using a previously established BEP
correlation [7]. We also examined the resistance of the studied alloys to CO adsorption. The
preferred location of alloyed metals (surface or sub-surface) was examined and we determined
under what conditions such alloys are stable. Our analysis indicates which alloys would
potentially be economically feasible and also catalytically active, suggesting directions for
experimental studies.
56
II. Results and discussion
A. Segregation of the alloy
The first step of our approach was to examine which of the two structures (overlayer and
underlayer, see Figure 5) under consideration were the most stable. To evaluate the relative
stability of the two structures, we calculated the segregation energy associated with each
transition metal by the following:
(5)
where is the calculated energy of the underlayer alloy structure and is the
energy of the overlayer alloy structure.
The calculated segregation energies are given in Table 2. Positive segregation energy indicates
that the underlayer structure is preferred while negative segregation energy indicates that the
overlayer structure is preferred. The segregation energy is thus an indicator of the strength of
interaction between the metal alloyed with iridium. For instance, gold and silver have very strong
negative segregation energies, indicating that these elements would prefer to segregate and
potentially separate from an iridium alloy.
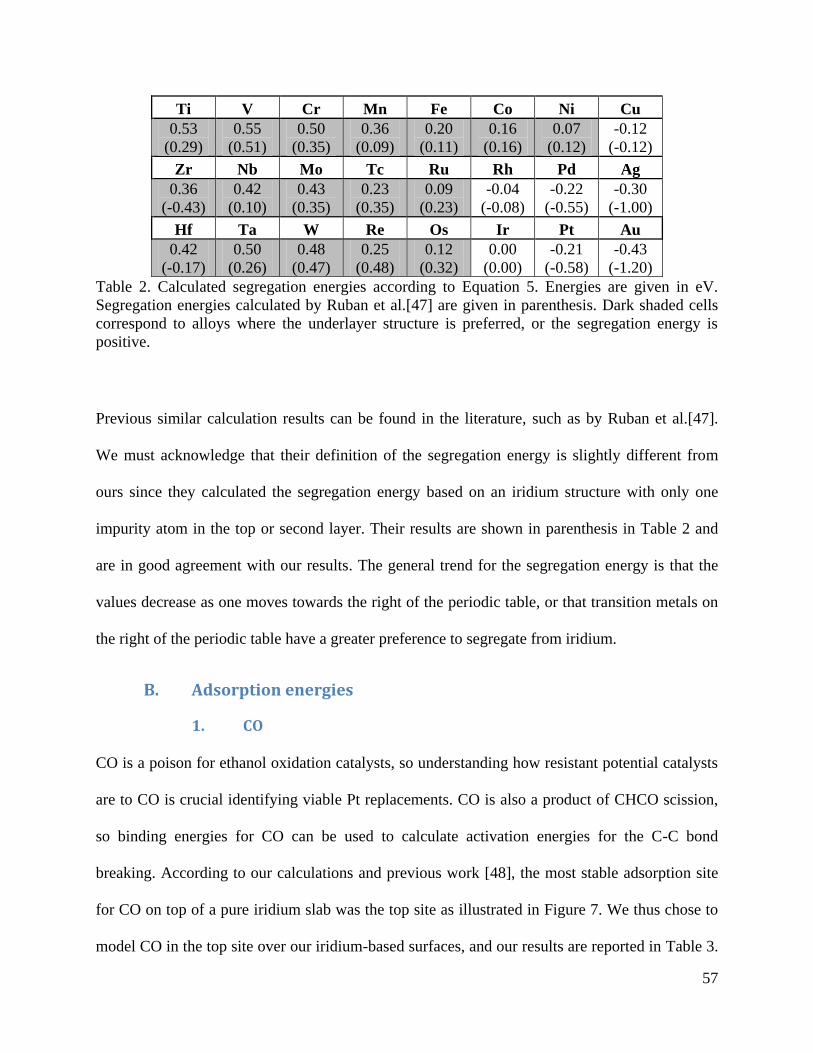
57
Ti V Cr Mn Fe Co Ni Cu
0.53
(0.29)
0.55
(0.51)
0.50
(0.35)
0.36
(0.09)
0.20
(0.11)
0.16
(0.16)
0.07
(0.12)
-0.12
(-0.12)
Zr Nb Mo Tc Ru Rh Pd Ag
0.36
(-0.43)
0.42
(0.10)
0.43
(0.35)
0.23
(0.35)
0.09
(0.23)
-0.04
(-0.08)
-0.22
(-0.55)
-0.30
(-1.00)
Hf Ta W Re Os Ir Pt Au
0.42
(-0.17)
0.50
(0.26)
0.48
(0.47)
0.25
(0.48)
0.12
(0.32)
0.00
(0.00)
-0.21
(-0.58)
-0.43
(-1.20)
Table 2. Calculated segregation energies according to Equation 5. Energies are given in eV.
Segregation energies calculated by Ruban et al.[47] are given in parenthesis. Dark shaded cells
correspond to alloys where the underlayer structure is preferred, or the segregation energy is
positive.
Previous similar calculation results can be found in the literature, such as by Ruban et al.[47].
We must acknowledge that their definition of the segregation energy is slightly different from
ours since they calculated the segregation energy based on an iridium structure with only one
impurity atom in the top or second layer. Their results are shown in parenthesis in Table 2 and
are in good agreement with our results. The general trend for the segregation energy is that the
values decrease as one moves towards the right of the periodic table, or that transition metals on
the right of the periodic table have a greater preference to segregate from iridium.
B. Adsorption energies
1. CO
CO is a poison for ethanol oxidation catalysts, so understanding how resistant potential catalysts
are to CO is crucial identifying viable Pt replacements. CO is also a product of CHCO scission,
so binding energies for CO can be used to calculate activation energies for the C-C bond
breaking. According to our calculations and previous work [48], the most stable adsorption site
for CO on top of a pure iridium slab was the top site as illustrated in Figure 7. We thus chose to
model CO in the top site over our iridium-based surfaces, and our results are reported in Table 3.

58
CO adsorption energies on both under- and overlayer alloy surfaces. Shaded values correspond
to alloys where CO binds more strongly than on pure platinum. Pure Pt has a calculated
adsorption energy of -2.17 eV. Data corresponding to Ir-Ni and Ir-Cu are missing due to
difficulties encountered to reach convergence with these geometries. All energies are given in
eV.. As a reference, we calculated the CO adsorption energy on a pure Pt (111) surface (using a
similar cell to those shown in Figure 5) to be -2.17 eV. As a first approximation, this value
serves as a benchmark on whether a catalyst is more or less CO-resistant than Pt, based on
whether the adsorption energy over the alloy is higher or lower than this value.
Ti V Cr Mn Fe Co Ni Cu
Overlayer -2.07 -2.48 -2.59 -2.73 -1.94 -1.97 -1.92 -1.10
Underlayer -1.66 -1.71 -1.55 -1.70 -1.96 N/A N/A -2.43
Zr Nb Mo Tc Ru Rh Pd Ag
Overlayer -1.89 -1.92 -2.07 -2.01 -2.10 -1.96 -1.44 -0.39
Underlayer -1.71 -1.60 -1.63 -1.99 -2.00 -2.27 -2.58 -2.61
Hf Ta W Re Os Ir Pt Au
Overlayer -1.79 -2.08 -2.30 -2.21 -2.35 -2.25 -1.63 -0.63
Underlayer -1.66 -1.66 -1.55 -1.97 -1.98 -2.25 -2.38 -0.13
Table 3. CO adsorption energies on both under- and overlayer alloy surfaces. Shaded values
correspond to alloys where CO binds more strongly than on pure platinum. Pure Pt has a
calculated adsorption energy of -2.17 eV. Data corresponding to Ir-Ni and Ir-Cu are missing due
to difficulties encountered to reach convergence with these geometries. All energies are given in
eV.

59
All the underlayer bimetallic structures involving early transition metals have CO adsorption
energies smaller in magnitude than over Pt, while the underlayer structures for later transition
metals have CO adsorption energies more stable than over Pt (with the exception of Au). For the
underlayer structures, the CO binding energy tends to increase when moving to the right of the
periodic table. The underlayer structures are more stable for metals of group 8 and smaller (see
Table 2. Calculated segregation energies according to Equation 5. Energies are given in eV.
Segregation energies calculated by Ruban et al.[47] are given in parenthesis. Dark shaded cells
correspond to alloys where the underlayer structure is preferred, or the segregation energy is
positive.) and these preferred alloys all have smaller CO binding energies, suggesting several
alloys with stable structures that are more CO-resistant than Pt. As a point of comparison, recent
experimental results by Du et al.[3] indicated that an Ir/Ru alloy demonstrated superior anti-
poisoning ability compared to CO. For the underlayer structures, the effect of alloying is largely
electronic. The top surface layer is still Ir, but the sub-surface layer alters the electronic orbitals
of the Ir atoms sufficiently to weaken CO binding.
The trends in the overlayer structures are not so apparent. Several period 4 (V, Cr, Mn) and
period 6 (W, Re, Os, Ir) metals show increased CO adsorption relative to Pt, while all period 5
metals having the overlayer structure have CO adsorption energies less exothermic than Pt.
There is no trend when moving across the periodic table. The top layers of the alloys are
composed of the substituted metal, so the presence of the sub-surface Ir modifies the electronic
structure of the substituted metals, but the trends in this effect are not apparent. We note that CO
adsorption energies for the Au alloys are all very low. Au is known to generally be inert, except
typically for nano-sized particles, which is consistent with our results. We also note that the CO
adsorption energy over all the preferred alloy structures, that is the energetically most stable

60
alloys (either overlayer or underlayer) according to Table 2, have CO adsorption energies lower
in magnitude than pure Pt (with the exception of pure Ir, Ir/Cu and Ir/Pt), indicating that Ir-M
alloys may be potential substitutes for Pt in the fuel cells.
2. CH
The most stable adsorption site for CH over pure Ir was found to be at an hcp site as shown in
Figure 7. Literature studies also strongly suggest that CH preferably adsorbs at hollow
sites[49][59]. Similarly to our approach with CO adsorption in which top sites were considered,
we modeled adsorption of CH over hcp sites for the alloys under consideration. Our calculated
CH adsorption energies are reported in Table 4. Most adsorption energies appear to be near -6 to
-7 eV. A few notable exceptions appear in the work. Binding energies for Cr appear to be
unrealistically large, and may simply be indicative of the unstable nature of the alloy structure.
We have modeled only underlayer and overlayer structures, which are simplistic representations
of the alloy surface. More stable, complicated structures may exist for an Ir-Cr alloy. Mn results
for CH adsorption were also not obtained. The alloy structure distorted significantly to the point
of not being a flat underlayer or overlayer structure. Again, these distortions are likely indicative
that the Ir-Mn alloy structures that we employed are simplistic and may not be representative of
an actual Ir-Mn alloy surface. Also, some buckling was observed on the surface of Zr/Ir alloy in
the overlayer configuration and prevented the slab to reach a stable geometry.

61
Ti V Cr Mn Fe Co Ni Cu
Overlayer -7.36 -8.58 -17.64 - -6.71 -6.98 -6.68 -4.82
Underlayer -6.51 -6.48 -7.92 - -6.64 -7.91 -6.47 -8.72
Zr Nb Mo Tc Ru Rh Pd Ag
Overlayer N/A -6.71 -7.15 -6.91 -6.96 -6.71 -5.75 -3.20
Underlayer -7.06 -6.81 -5.99 -6.57 -6.72 -6.91 -7.62 -8.09
Hf Ta W Re Os Ir Pt Au
Overlayer -6.69 -7.13 -7.45 -7.25 -7.22 -6.94 -6.09 -3.99
Underlayer -6.96 -6.83 -5.86 -6.61 -7.41 -6.94 -7.17 -8.48
Table 4. CH adsorption energies on both under- and overlayer structures. Energies are given in
eV. Adsorption energies for Ir-Mn were not given due to difficulties in reaching a stable CH-
adsorbed geometry as discussed in the text. Pure Pt has an adsorption energy of -7.46 eV. Shaded
values correspond to alloys where CH binds more strongly than on pure platinum.
3. CHCO
The initial geometry that we used for CHCO was the most stable geometry identified by Alcalá
et al. [6] over a Pt(111) surface. This initial geometry appeared to be the stable when the surface
was made of a platinum group metals, thus all CHCO adsorption energies on an underlayer
structures were calculated with CHCO in the configuration presented on Figure 8a. In this
geometry the CO is oriented in a top-like position, while the CH is oriented in a bridge-like
position. For the overlayer structures, two different structures were identified as most stable. The
first geometry was the one proposed in [6] that is displayed on Figure 8a and was encountered
with overlayer atoms from the PGM. The second one is represented on Figure 8b in the case of a
Ti overlayer.

62
Ti V Cr Mn Fe Co Ni Cu
Overlayer -5.85 -7.09 -15.81 -32.42 -3.35 -4.34 -3.90 -2.42
Underlayer -2.74 -2.56 -4.33 -18.83 -3.09 -3.60 -2.74 -5.22
Zr Nb Mo Tc Ru Rh Pd Ag
Overlayer N/A -4.64 -4.76 -4.22 -3.21 -3.20 -2.90 -1.73
Underlayer -3.00 -2.58 -2.30 -2.96 -3.03 -3.64 -4.26 -4.68
Hf Ta W Re Os Ir Pt Au
Overlayer N/A -5.22 -5.09 -4.26 -3.59 -3.58 -3.15 -2.24
Underlayer -2.85 -2.58 -2.17 -3.07 -3.17 -3.58 -3.93 -5.33
Table 5. CHCO adsorption energies on both the under- and overlayer alloy structures. Energies
are given in eV. Pure Pt has an adsorption energy of -4.15 eV. Shaded values correspond to
alloys where CHCO binds more strongly than on pure platinum.
Figure 8. (a) CHCO geometry on a Ru/Ir overlayer structure. (b) CHCO geometry on a Ti/Ir
overlayer structure. Ruthenium, titanium, iridium, carbon, oxygen and hydrogen atoms are
respectively turquoise, light grey, blue, dark grey, red and white.
b
a

63
A few problems were encountered in the simulations. CHCO adsorption over the silver and gold
overlayer structures did not reach a stable structure, despite modeling a number of different
initial geometries. In these cases the CHCO adsorbate converged to a geometry where only the
carbon atom linked to the hydrogen atom was bound to the surface, while the second carbon
atom moved away from the surface. These surfaces are apparently resistant to CHCO adsorption,
and are therefore expected to have low catalytic activity. The adsorption energies of CHCO over
the Ir-Cr overlayer and Ir-Mn structure are all extremely exothermic to the point of being
unrealistic, which indicates that these alloy structures are likely unstable and/or unrealistic
models. We therefore do not consider these adsorption energies reliable and do not use these
values in further analysis. Zr and Hf overlayer structures demonstrated some buckling at the
surface leading to very unrealistic structures that did not reach a convergence point. The strongly
deformed structures showed that the overlayer structures were an unlikely realistic model so we
did not consider those two geometries further in this paper.
Underlayers surface or subsurface alloys have the interesting advantage to allow a weak CHCO
binding energy and low activation energy for the dissociation reaction at the same time whereas
the two effects are usually opposite [8]. Indeed, a high CO tolerance usually implies a high
activation energy for the CHCO dissociation energy since CO is a product of the CHCO
dissociation. Destabilizing the product of a reaction tends to make its activation energy larger as
suggested by the BEP correlation discussed earlier. Having high CO tolerance corresponds to
having an unstable CO adsorption at the surface of the catalyst and should therefore increase he
activation energy of the corresponding reaction. Nevertheless, underlayer structures seems to
have the ability to get low adsorption energy of the reaction products as well as low activation

64
energy. This property of underlayer structures has already been experienced with H2 dissociation
over similar subsurface alloys [27]
C. Effects of Adsorbates on Segregation
The environment may change the thermodynamically preferred state of the alloy. For example
Greeley and Mavrikakis[27] showed that hydrogen adsorption could induce segregation in select
alloys. Other work also showed that the presence of adsorbates can alter segregation
preferences[60][61][62]. Determining how the reaction environment affects segregation is
crucial for designing and understanding stable catalysts. We thus calculated segregation energies
in the presence of CO. The segregation energy of the bare surfaces represents the relative
stability of the underlayer and overlayer structures in the absence of adsorption. When an
adsorbate is present, the energy released upon adsorption may be such that the segregation trend
changes. This is illustrated in Figure 9 for an Ir/V alloy. The bare segregation energy is 0.55 eV,
indicating that the underlayer structure is preferred. The adsorption energies for CO over the
overlayer and underlayer structures are -1.71 and -2.48 eV, respectively. There is 0.77 eV more
energy released when CO is adsorbed on the overlayer alloy, which is more than the segregation
energy of 0.55 eV. Consequently, CO adsorption may induce the migration of the sub-layer V
atoms towards the surface. The net effect is a gain of 0.22 eV (0.77 - 0.55 eV) when the
segregation occurs.

65
Figure 9. Illustration of adsorbate-induced segregation for the case of an Ir/V alloy.
In Figure 10 we have plotted the bare segregation energies versus the difference in CO
adsorption energies for overlayer and underlayer structures. This plot shows which alloys may
undergo a change in segregation preference in the presence of CO, as indicated by the grey areas.
The majority of bare alloys prefer to form underlayer structures (positive segregation energies).
However over most of the alloys CO prefers to bind to overlayer structures. There are a number
of alloys where this preference may induce segregation upon CO adsorption, such as Os, W, or
V. Other alloys (involving Ru, Re, and Mo) have segregation energies close to the CO adsorption
energy differences, so it is difficult to gauge whether segregation may actually occur. A few bare
alloys (Pt and Rh) prefer the overlayer structure, but upon CO adsorption prefer the underlayer
structure. Our results have only considered select alloy structures and one adsorbate, but do show

66
that segregation trends can change under reaction conditions and such effects must be examined
to have fully relevant molecular models.
Figure 10. Stability of bimetallic structures with respect to CO-induced segregation. The
segregation energies indicate the most stable structures for the bare surfaces. Positive values
correspond to alloys where the underlayer surface is preferred. Positive values in difference in
binding energy indicate that CO prefers to adsorb over the underlayer structure, while negative
values indicate that CO prefers to adsorb over the overlayer structure. Alloys situated in the grey
area are likely to undergo adsorbate-induced segregation. Alloys containing Pd, Ag, Cu and Mn
are not represented on this figure for clarity purposes since they have a very high absolute value
of their segregation energy and are situated either far right (Pd, Ag, Cu) on the graph or far left
(Mn) in an area not influenced by adsorbate-induced segregation.
-1.0
-0.8
-0.6
-0.4
-0.2
0.0
0.2
0.4
0.6
0.8
1.0
-1.0 -0.8 -0.6 -0.4 -0.2 0.0 0.2 0.4 0.6 0.8 1.0
Bin
din
g e
ner
gy (
ove
rlay
er)
-
Bin
din
g e
ne
rgy
( u
nd
erl
aye
r) [
eV
]
Segregation energy [eV]
Mo
Ru
Rh
Ta
W
Re
Os
Ir
Pt
Au
V
Fe
Tc
Ti
Zr
Nb
Hf

67
D. Alloying Effects
There are two major effects related to alloys that influence adsorption energies and surface
chemistry [8][63]. The first is the strain effect. Because the bond lengths and lattice parameters
are different for each metal, alloying may put strain on metal atoms as they adapt new bond
lengths to fit into the parent metal. This strain induces changes in the electronic orbitals of the
metals. For example, under tensile strain an upshift in the d-band occurs, while under
compressive strain the d-band moves down in energy. These shifts in d-band energies can
weaken (downward d-band energy) or strengthen (upward d-band energy) adsorption. Such
effects have shown and discussed in the literature[8] [64][63][65].
The second effect arises due to intrinsic electronic differences between two metals and is called
the ligand effect. The presence of another nearby metal may alter the electronic structure of the
metals due to new interactions between the metals. In the case of the underlayer structure, the
top layer of Ir atoms are only under strain in the vertical direction (the surface lattice parameter
is not changed) so the predominant change in adsorption is attributed to the ligand, or electronic
effect. In contrast, for the overlayer structure, the top layer of surface metal atoms may
experience both strain and ligand effects.
We have plotted the adsorption energies for CO and CH over the underlayer (Figure 11 and
Figure 12) and overlayer (Figure 13 and Figure 14) structures. Our results show that for the
underlayer structures stronger adsorption occurs for alloyed metals to the right of the periodic.
These results can be explained in terms of the d-band model by Hammer and Norskov [8]. Upon
adsorption, bonding and anti-bonding states form between the surface d electrons and adsorbate

68
electrons. Higher d-band energies lead to more anti-bonding orbitals being above the Fermi
level, and thus more anti-bonding states being unfilled. To compensate for the unfilled anti-
bonding states, more filling of bonding states occurs. Thus, more stable adsorption occurs for
surfaces with higher d-band energies. Kitchin et al. [64] modeled Pt surfaces where the second
layer was replaced by another metal, analogous to our underlayer structures. They did indeed
observe that alloying with late transition metals increased the d-band energy and thus would
expected to increase adsorption energies, which is similar to what we observe with Ir-based
alloys.
Figure 11. CO adsorption energies over the underlayer (Ir/M/Ir) alloys. Adsorption energies are
plotted relative to the respective position of the alloyed metal in the periodic table.
Ti
V Fe
Cu
Zr
NbMo
Tc Ru
Rh
PdAg
Hf Ta
W
ReOs
IrPt
Au
Cr
Mn
-3.0
-2.5
-2.0
-1.5
-1.0
3 4 5 6 7 8 9 10 11 12
Ad
sorp
tio
n e
ne
rgy
[eV
]
Transition Metal Group
3d
4d
5d

69
Figure 12. CH Adsorption energies over the Ir/M/Ir catalyst structures. Adsorption energies are
plotted relative to the respective position of the alloyed metal in the periodic table. The Ir-Mn
alloy is not included, as discussed in the text.
With the overlayer structure, the adsorption energies obtained using the different transition
metals for the overlayer are mainly constant with the exception of the atoms from the 11th
column (Au, Ag, Cu) that are usually known for their non-reactive behavior explaining the high
adsorption engines associated these metals. Su et al[24] investigated CO adsorption energies at
the surface of various platinum based overlayer structure and found similarly that the range of
adsorption energies obtained was small (from -1.78eV to -1.86eV scanning Cr, Mn, Fe , Co Ni
and Cu overlayer structures).Contrary to the underlayer structure, late transition metal alloys in
the overlayer configuration demonstrated the least stable adsorption energies
Ti
V
Fe
Co
Ni
Cu
Zr
NbMo Tc
RuRh
Pd Ag
Hf Ta
W
Re
Os
Ir
Pt
AuCr
-10.0
-9.0
-8.0
-7.0
-6.0
-5.0
-4.0
3 4 5 6 7 8 9 10 11 12
Ad
sorp
tio
n e
ner
gy [e
V]
Transition Metal Group
3d
4d
5d

70
Figure 13. CO adsorption energies over the overlayer (M/Ir/Ir) alloys. Adsorption energies are
plotted relative to the respective position of the alloyed metal in the periodic table.
Figure 14. CH adsorption energies over the overlayer (M/Ir/Ir) alloys. Adsorption energies are
plotted relative to the respective position of the alloyed metal in the periodic table.
E. Activation energy of the ethanol oxidation reaction: C-C Bond
Breaking
We used the transition state scaling relationship of Wang et al.[7] to calculate the activation
energies for CHCO dissociation to CH and CO over the various alloys, as displayed in Table 6.
We calculated the activation energy over Pt (111) to be 1.89 eV. As a point of comparison, our
Ti
V
Fe
Co Ni
Cu
ZrNb
Mo TcRu
Rh
Pd
Ag
Hf
TaW Re
Os Ir
Pt
Au
Cr Mn-3.0
-2.5
-2.0
-1.5
-1.0
-0.5
0.0
3 4 5 6 7 8 9 10 11 12
Ad
sorp
tio
n e
ner
gy [
eV]
Transition Metal Group
3d4d5d
Ti
V
Fe
Co Ni
Cu
NbMo Tc
RuRh
Pd
Ag
Hf
TaW Re Os Ir
Pt
Au
-10.0
-9.0
-8.0
-7.0
-6.0
-5.0
-4.0
-3.0
-2.0
3 4 5 6 7 8 9 10 11 12
Ad
sorp
tio
n e
ner
gy [
eV]
Transition Metal Group
3d
4d
5d

71
results compare favorably with previous work [3] that utilized a similar method, but a four-layer
slab. This previous work calculated activation energies over Pt, Ir-Ru, and Ir surfaces to be 1.69,
1.05, and 1.31 eV, respectively. We calculated activation energies to be 1.88, 1.42, and 1.69 eV
for the three surfaces. The trends between the three surfaces are similar for both the current and
previous work, but the exact energy differences can be attributed to the slab model choice (three
versus four layers).
Ti V Cr Mn Fe Co Ni Cu
Overlayer 3.76 3.66 4.86 7.57 1.89 2.64 2.49 3.20
Underlayer 1.68 1.48 2.20 4.03 1.68 N/A N/A 1.73
Zr Nb Mo Tc Ru Rh Pd Ag
Overlayer N/A 3.20 2.83 2.54 1.42 1.73 2.65 4.44
Underlayer 1.46 1.32 1.69 1.58 1.51 1.76 1.53 1.54
Hf Ta W Re Os Ir Pt Au
Overlayer N/A 3.31 2.74 2.14 1.39 1.69 2.45 4.09
Underlayer 1.43 1.25 1.73 1.67 1.10 1.69 1.75 1.68
Table 6. Activation energies for the reaction step CH+COCHCO over different Ir/M bimetallic
structures using the BEP correlation from Wang et al.[7]. Pure Pt has an activation energy of
1.88 eV. Grey values correspond to higher activation energies than on a pure Pt. Energies are
given in eV. The overlayer values for Ir-Zr and Ir-Hf are not shown because of alloy stability
problems, as discussed in the text. Data corresponding to Ir-Ni and Ir-Cu are missing due to
difficulties encountered to reach convergence with these geometries
Almost all underlayer structures have lower activation energies than pure Pt, while only a few
overlayer structures have activation energies less than Pt. Typical activation energies are lowered

72
by 0.1-0.3 eV, but may be lowered as much as 0.8 eV (Ir-Os). These results suggest that sub-
layer modification of Ir may lead to more facile C-C bond breaking, which is desirable for
ethanol oxidation. The issue is further complicated because the alloy structure may change
depending on the environment, as section III.C shows. For several alloys segregation occurs in
the presence of CO which may not occur in an otherwise bare environment. The actual
environment will be much more complex with a large number of adsorbates so it is difficult to
predict which alloy structure is thermodynamically preferred. Nonetheless, we have identified
several candidate alloys that may oxidize ethanol with more efficiency than Pt. For example, Ir-
Ru, Ir-Rh, and Ir-Os all have lower activation energies for C-C scission than Pt, regardless of the
alloy structure. Other alloys, such as Ir-Cr and Ir-Mn, do not appear to be effective for C-C bond
breaking. Our results reinforce the possibility of using iridium-based alloys as a primary
component in EOR catalysts.
F. Towards an economically viable catalyst
In this work we have determined the adsorption energies of the different reaction intermediates
and the activation energies for a potential rate determining step of the EOR over various Ir-M
catalysts. These values, or descriptors, allow the prediction of catalyst candidates for the EOR.
This notion of descriptors in combination with modeling results is described by Nørskov et al.
[66] where the value of DFT for screening catalysts is shown. A desirable ethanol oxidation fuel
cell catalyst should be resistant to CO poisoning (e.g. low CO adsorption energy) and readily
break apart ethanol (e.g. low activation energy for C-C breaking). A third descriptor could be the
cost of the catalyst. The catalyst is a significant portion of the fuel cell‘s cost and cheaper
catalysts may drive down the cost of the fuel cell significantly.

73
In Figure 15, these three descriptors are gathered into one graph with the activation energy
plotted against the CO adsorption. These values are taken from the most preferred structure
(overlayer or underlayer determined by the segregation energy). The cost of the alloyed
transition metal is represented by the size of the sphere. Metal costs were taken from the website
metalprices.com[67].We note that the two surface chemistry parameters (CO adsorption energy
and activation energy) are not strictly independent. A catalyst with low CO adsorption energy
will likely have large activation energy, since one of the final products (CO) is weakly bound to
the surface and the reaction energy will therefore be more endothermic. A more endothermic
reaction energy leads to higher activation energies in the BEP formalism (Equation 2). Similarly,
more stable CO binding lowers the activation energy for CHCO dissociation. Because of this
relationship, the data can be fitted by a line with positive slope.
Figure 15. Activation energies versus CO adsorption energy for the various alloys in their
preferred configuration. The sphere sizes are proportional to metal prices[67]. A few select
alloys are framed, which correspond to metals with an extremely low cost (too small to appear
on the graph).
Pure PtRh
Cu
Nb
Tc
HfTaV
Re
IrPt
Pd
MoOsRu
AuAg
Zn
TiZr
Cr
Fe
W
0.5
1.0
1.5
2.0
2.5
3.0
3.5
4.0
4.5
5.0
-2.5 -2.0 -1.5 -1.0 -0.5
Act
ivat
ion
En
erg
y [e
V]
CO Adsorption Energy [eV]

74
Our calculations found that pure Pt has a CO adsorption energy of -2.17 eV and activation
energy of 1.89 eV (indicated by the sphere to the left), and any catalysts to the right and below
this sphere are of interest. Interestingly, the recent Ir-Ru alloy, found to be very efficient by Du
et al.[3] can be found in this specific region. This encouraging result appeared as a confirmation
of our choice of descriptors. There are a number of potential catalysts with CO adsorption
energies between -2 and -1.5 eV that appear promising: Ir-Ru, Ir-Re, Ir-Os, Ir-Hf, Ir-Ta, Ir-Nb,
etc. Further experimental work is needed to synthesize and test these catalysts. We must also
admit that some of the identified catalysts may not even be stable under reaction conditions;
segregation and/or oxidation are real possibilities for some of the alloys and further work is
needed to assess this possibility.
75
Conclusion
Iridium-based bimetallic structures were investigated as a potential candidate for replacing
platinum as anode catalysts for the ethanol oxidation reaction. Overlayer (alloyed metal directly
on surface) and underlayer (alloyed metal in subsurface position) structures made of a transition
metal associated with iridium were used as idealized models of alloy surfaces. Density functional
theory calculations were used to estimate two important descriptors: CO tolerance (e.g. CO
adsorption energy) and activation energy for C-C scission. Breaking of strong C-C bonds is
necessary for complete oxidation of ethanol. Based on previous work, we modeled dissociation
of CHCO, a strong candidate for the rate-determining step. Underlayer structures demonstrated
an enhanced CO tolerance in most cases with early transition metals being the most promising
alloys. CHCO bond breaking also appeared to be more favorable on underlayer surfaces than on
overlayer surfaces, always having a lower CHCO activation energy on an underlayer structure
than on the overlayer structure for a given transition metal (with the exception of Ru and Rh
where comparable energies were obtained). Moreover, underlayer structures generally exhibited
better activation energy for CHCO dissociations than a pure platinum catalyst. Combined with
their good CO tolerance, iridium-based underlayer structure catalysts show excellent promise for
the ethanol oxidation reaction. We identified several alloys ( Nb/Ir, Hf/Ir,Ta/Ir, Zr/Ir, V/Ir) as the
most promising catalysts. Overlayer structures also demonstrated good CO tolerance but their
potential as an EOR catalyst was reduced by the relatively high activation energy for CHCO
dissociation these alloys demonstrated. We would like to point out that our efforts have focused
on screening potential catalysts, and further work is needed to determine whether such catalysts
are stable under experimental conditions, evaluate full electrochemical environmental effects and

76
determine full reaction pathways. We have nonetheless identified several potential alloys that
warrant more attention for direct ethanol fuel cells. .

77
References
[1] C. J. Weststrate, W. Ludwig, J. W. Bakker, A. C. Gluhoi, and B. E. Nieuwenhuys,
―Ethanol Adsorption , Decomposition and Oxidation on Ir( 111 ): A High Resolution XPS
Study,‖ ChemPhysChem, vol. 8, pp. 932–937, 2007.
[2] W. Du, Q. Wang, D. Saxner, N. A. Deskins, D. Su, J. E. Krzanowski, A. I. Frenkel, and X.
Teng, ―Highly Active Iridium / IridiumÀTin / Tin Oxide Heterogeneous Nanoparticles as
Alternative Electrocatalysts for the Ethanol Oxidation Reaction,‖ Journal of American
Chemical Society, vol. 133, pp. 15172–15183, 2011.
[3] W. Du, N. A. Deskins, D. Su, and X. Teng, ―Iridium−Ruthenium Alloyed Nanoparticles
for the Ethanol Oxidation,‖ ACS Catalysis, vol. 2, pp. 1226–1231, 2012.
[4] B. L. Cao, G. Sun, H. Li, and Q. X. Direct, ―Carbon-supported IrSn catalysts for direct
ethanol fuel cell,‖ Fuel Cells Bulletin, no. November, pp. 2–6, 2007.
[5] P. Ferrin, D. Simonetti, S. Kandoi, E. Kunkes, J. A. Dumesic, J. K. Nørskov, and M.
Mavrikakis, ―Modeling Ethanol Decomposition on Transition Metals : A Combined
Application of Scaling and Brønsted-Evans-Polanyi Relations,‖ Journal of American
Chemical Society, vol. 131, pp. 5809–5815, 2009.
[6] R. Alcalá, M. Mavrikakis, and J. A. Dumesic, ―DFT studies for cleavage of C – C and C –
O bonds in surface species derived from ethanol on Pt ( 111 ),‖ Journal of Catalysis, vol.
218, pp. 178–190, 2003.
[7] S. Wang, B. Temel, J. Shen, G. Jones, L. C. Grabow, F. Studt, T. Bligaard, F. Abild-
Pedersen, C. H. Christensen, and J. K. Nørskov, ―Universal Brønsted-Evans-Polanyi
Relations for C–C, C–O, C–N, N–O, N–N, and O–O Dissociation Reactions,‖ Catalysis
Letters, vol. 141, no. 3, pp. 370–373, Nov. 2010.
[8] B. Hammer and J. K. Nørskov, ―Theoretical Surface Science and Catalysis —
Calculations and Concepts,‖ Advances In Catalysis, vol. 45, pp. 71–129, 2000.
[9] S. a. Kirillov, P. E. Tsiakaras, and I. V. Romanova, ―Adsorption and oxidation of
methanol and ethanol on the surface of metallic and ceramic catalysts,‖ Journal of
Molecular Structure, vol. 651–653, pp. 365–370, Jun. 2003.
[10] F. Vigier, C. Coutanceau, A. Perrard, E. M. Belgsir, and C. Lamy, ―Development of anode
catalysts for a direct ethanol fuel cell,‖ Journal of Applied Electrochemistry, vol. 34, pp.
439–446, 2004.
[11] F. Vigier, S. Rousseau, C. Coutanceau, J.-M. Leger, and C. Lamy, ―Electrocatalysis for
the direct alcohol fuel cell,‖ Topics in Catalysis, vol. 40, no. 1–4, pp. 111–121, Nov. 2006.

78
[12] O. Skoplyak, M. a Barteau, and J. G. Chen, ―Reforming of oxygenates for H2 production:
correlating reactivity of ethylene glycol and ethanol on Pt(111) and Ni/Pt(111) with
surface d-band center.,‖ The journal of physical chemistry. B, vol. 110, pp. 1686–94, Feb.
2006.
[13] F. Cell, J. Mann, N. Yao, and A. B. Bocarsly, ―Characterization and Analysis of New
Catalysts for a Direct Ethanol,‖ Langmuir, vol. 22, pp. 10432–10436, 2006.
[14] E. Antolini, ―Catalysts for direct ethanol fuel cells,‖ Journal of Power Sources, vol. 170,
pp. 1–12, 2007.
[15] W. Du, K. E. Mackenzie, D. F. Milano, N. A. Deskins, D. Su, and X. Teng, ―Palladium −
Tin Alloyed Catalysts for the Ethanol Oxidation Reaction in an Alkaline Medium,‖
Journal of American Chemical Society, vol. 2, pp. 287–297, 2012.
[16] A. Z. Weber, ―Gas-Crossover and Membrane-Pinhole Effects in Polymer-Electrolyte Fuel
Cells,‖ Journal of The Electrochemical Society, vol. 155, no. 6, p. B521, 2008.
[17] U.S. Department of Energy, ―Fuel Cell Technologies Program,‖ 2012. [Online].
Available: http://www1.eere.energy.gov/hydrogenandfuelcells/accomplishments.html.
[18] H.-F. Wang and Z.-P. Liu, ―Comprehensive mechanism and structure-sensitivity of
ethanol oxidation on platinum: new transition-state searching method for resolving the
complex reaction network.,‖ Journal of the American Chemical Society, vol. 130, no. 33,
pp. 10996–1004, Aug. 2008.
[19] S. Desai, G. Brown, and S. Bollepalli, ―PEM Fuel Cell Catalysts: Cost, Performance, and
Durability,‖ The Electrochemical Society Interface, pp. 41–44.
[20] B. Li, J. Qiao, D. Yang, R. Lin, H. Lv, H. Wang, and J. Ma, ―Effect of metal particle size
and Nafion content on performance of MEA using Ir-V / C as anode catalyst,‖
International Journal of Hydrogen Energy, vol. 35, pp. 5528–5538, 2010.
[21] J. P. I. De Souza, S. L. Queiroz, K. Bergamaski, E. R. Gonzalez, F. C. Nart, U. De Sa, and
C. Sp, ―Electro-Oxidation of Ethanol on Pt , Rh , and PtRh Electrodes . A Study Using
DEMS and in-Situ FTIR Techniques,‖ pp. 9825–9830, 2002.
[22] S. Alayoglu, A. U. Nilekar, M. Mavrikakis, and B. Eichhorn, ―Ru-Pt core-shell
nanoparticles for preferential oxidation of carbon monoxide in hydrogen.,‖ Nature
materials, vol. 7, no. 4, pp. 333–8, Apr. 2008.
[23] C. Lamy, S. Rousseau, E. M. Belgsir, C. Coutanceau, and J. Léger, ―Recent progress in
the direct ethanol fuel cell : development of new platinum – tin electrocatalysts,‖
Electrochimica Acta, vol. 49, pp. 3901–3908, 2004.

79
[24] H.-Y. Su, X.-K. Gu, X. Ma, Y.-H. Zhao, X.-H. Bao, and W.-X. Li, ―Structure evolution of
Pt–3d transition metal alloys under reductive and oxidizing conditions and effect on the
CO oxidation: a first-principles study,‖ Catalysis Today, vol. 165, pp. 89–95, May 2011.
[25] J. Leger, S. Rousseau, C. Coutanceau, F. Hahn, and C. Lamy, ―How bimetallic
electrocatalysts does work for reactions involved in fuel cells?Example of ethanol
oxidation and comparison to methanol,‖ Electrochimica Acta, vol. 50, pp. 5118–5125,
Sep. 2005.
[26] W. Zhou, Z. Zhou, S. Song, and W. Li, ―Pt based anode catalysts for direct ethanol fuel
cells,‖ Applied Catalysis B: Environmental, vol. 46, pp. 273–285, 2003.
[27] J. Greeley and M. Mavrikakis, ―Alloy catalysts designed from first principles,‖ Nature,
vol. 3, no. November, 2004.
[28] A. U. Nilekar, S. Alayoglu, B. Eichhorn, and M. Mavrikakis, ―Preferential CO oxidation
in hydrogen: reactivity of core-shell nanoparticles.,‖ Journal of the American Chemical
Society, vol. 132, pp. 7418–28, Jun. 2010.
[29] V. M. Schmidt, R. Ianniello, E. Pastor, and S. Gonza, ―Electrochemical Reactivity of
Ethanol on Porous Pt and PtRu : Oxidation / Reduction Reactions in 1 M HClO 4,‖ vol.
3654, no. 96, pp. 17901–17908, 1996.
[30] F. Colmati, E. Antolini, and E. R. Gonzalez, ―Effect of temperature on the mechanism of
ethanol oxidation on carbon supported Pt, PtRu and Pt3Sn electrocatalysts,‖ Journal of
Power Sources, vol. 157, no. 1, pp. 98–103, Jun. 2006.
[31] W. J. Zhou, W. Z. Li, S. Q. Song, Z. H. Zhou, L. H. Jiang, G. Q. Sun, Q. Xin, K.
Poulianitis, S. Kontou, and P. Tsiakaras, ―Bi- and tri-metallic Pt-based anode catalysts for
direct ethanol fuel cells,‖ Journal of Power Sources, vol. 131, no. 1–2, pp. 217–223, May
2004.
[32] L. Jiang, G. Sun, S. Sun, J. Liu, S. Tang, H. Li, B. Zhou, and Q. Xin, ―Structure and
chemical composition of supported Pt–Sn electrocatalysts for ethanol oxidation,‖
Electrochimica Acta, vol. 50, no. 27, pp. 5384–5389, Sep. 2005.
[33] G. . Camara, R. . de Lima, and T. Iwasita, ―Catalysis of ethanol electrooxidation by PtRu:
the influence of catalyst composition,‖ Electrochemistry Communications, vol. 6, no. 8,
pp. 812–815, Aug. 2004.
[34] S. Rousseau, C. Coutanceau, C. Lamy, and J.-M. Léger, ―Direct ethanol fuel cell (DEFC):
Electrical performances and reaction products distribution under operating conditions with
different platinum-based anodes,‖ Journal of Power Sources, vol. 158, no. 1, pp. 18–24,
Jul. 2006.

80
[35] a. Oliveira Neto, E. G. Franco, E. Aricó, M. Linardi, and E. R. Gonzalez, ―Electro-
oxidation of methanol and ethanol on Pt–Ru/C and Pt–Ru–Mo/C electrocatalysts prepared
by Bönnemann‘s method,‖ Journal of the European Ceramic Society, vol. 23, no. 15, pp.
2987–2992, Jan. 2003.
[36] E. Christoffersen, P. Liu, A. Ruban, H. L. Skriver, and J. K. Nørskov, ―Anode Materials
for Low-Temperature Fuel Cells: A Density Functional Theory Study,‖ Journal of
Catalysis, vol. 199, pp. 123–131, Apr. 2001.
[37] P. Catalysts, R. Alcala, J. W. Shabaker, G. W. Huber, M. A. Sanchez-castillo, and J. A.
Dumesic, ―Experimental and DFT Studies of the Conversion of Ethanol and Acetic Acid
on,‖ Journal of Physical Chemistry, vol. 109, pp. 2074–2085, 2005.
[38] J. Perdew, K. Burke, and M. Ernzerhof, ―Generalized Gradient Approximation Made
Simple.,‖ Physical review letters, vol. 77, no. 18, pp. 3865–3868, Oct. 1996.
[39] S. Goedecker, M. Teter, and J. Hutter, ―Separable dual-space Gaussian pseudopotentials,‖
Physical Review B, vol. 54, no. 3, pp. 1703–1710, 1996.
[40] C. Hartwigsen, S. Goedecker, and J. Hutter, ―Relativictic separable dual-space Gaussian
Pseudopotentials form H to Rn,‖ vol. 58, no. 7, 1998.
[41] Jan K. Labanowski, ―Simplified introductions to ab inito basis sets terms and notations,‖
1996. [Online]. Available: http://www.ccl.net/cca/documents/basis-sets/basis.html.
[Accessed: 02-Feb-2013].
[42] J. VandeVondele, M. Krack, F. Mohamed, M. Parrinello, T. Chassaing, and J. Hutter,
―Quickstep: Fast and accurate density functional calculations using a mixed Gaussian and
plane waves approach,‖ Computer Physics Communications, vol. 167, no. 2, pp. 103–128,
Apr. 2005.
[43] ―CP2K Open source Molecular Dynamics.‖ [Online]. Available: http://www.cp2k.org/.
[44] P. Taylor, B. G. Lippert, J. Hutter, and M. Parrinello, ―A Hybrid Gaussian and Plane
Wave Density Functional Scheme,‖ Molecular Physics, vol. 92, no. 3, pp. 477–487, 1997.
[45] J. VandeVondele and J. Hutter, ―Gaussian basis sets for accurate calculations on
molecular systems in gas and condensed phases.,‖ The Journal of chemical physics, vol.
127, no. 11, p. 114105, Sep. 2007.
[46] M. Krack, ―Pseudopotentials for H to Kr optimized for gradient-corrected exchange-
correlation functionals,‖ Theoretical Chemistry Accounts, vol. 114, no. 1–3, pp. 145–152,
May 2005.
[47] A. Ruban, H. Skriver, and J. Nørskov, ―Surface segregation energies in transition-metal
alloys,‖ Physical Review B, vol. 59, no. 24, pp. 15990–16000, Jun. 1999.

81
[48] W. P. Krekelberg, J. Greeley, and M. Mavrikakis, ―Atomic and Molecular Adsorption on
Ir ( 111 ),‖ Journal of Physical Chemistry, no. 108, pp. 987–994, 2004.
[49] F. Abild-Pedersen, J. Greeley, F. Studt, J. Rossmeisl, T. Munter, P. Moses, E. Skúlason,
T. Bligaard, and J. Nørskov, ―Scaling Properties of Adsorption Energies for Hydrogen-
Containing Molecules on Transition-Metal Surfaces,‖ Physical Review Letters, vol. 99, p.
016105(1)–016105(4), Jul. 2007.
[50] D. C. Ford, Y. Xu, and M. Mavrikakis, ―Atomic and molecular adsorption on Pt ( 1 1 1 ),‖
Surface Science, vol. 587, pp. 159–174, 2005.
[51] G. Santarossa, A. Vargas, M. Iannuzzi, C. a Pignedoli, D. Passerone, and A. Baiker,
―Modeling bulk and surface Pt using the ‗Gaussian and plane wave‘ density functional
theory formalism: validation and comparison to k-point plane wave calculations.,‖ The
Journal of chemical physics, vol. 129, no. 23, p. 234703, Dec. 2008.
[52] J. P. Perdew, Electronic Structure of Solids. Akademie Verlag, Berlin, 1991.
[53] A. Michaelides, Z. Liu, C. J. Zhang, A. Alavi, D. A. King, and P. Hu, ―Identification of
General Linear Relationships between Activation Energies and Enthalpy Changes for
Dissociation Reactions at Surfaces,‖ no. 2, pp. 3704–3705, 2003.
[54] S. Dahl, A. Logadottir, C. J. H. Jacobsen, and J. K. Nørskov, ―Electronic factors in
catalysis : the volcano curve and the effect of promotion in catalytic ammonia synthesis,‖
vol. 222, pp. 19–29, 2001.
[55] B. T. B. A. L. S. B. L. B. H. M. B. Nørskov, JH, B. Hammer, Z. Sljivancanin, M.
Mavrikakis, Y. Xu, S. Dahl, and C. J. H. Jacobsen, ―Universality in Heterogeneous
Catalysis,‖ Journal of Catalysis, vol. 209, no. 2, pp. 275–278, Jul. 2002.
[56] M. Li, W. Guo, R. Jiang, L. Zhao, and H. Shan, ―Decomposition of ethanol on Pd(111): a
density functional theory study.,‖ Langmuir : the ACS journal of surfaces and colloids,
vol. 26, no. 3, pp. 1879–88, Feb. 2010.
[57] H. Xin, A. Holewinski, N. Schweitzer, E. Nikolla, and S. Linic, ―Electronic Structure
Engineering in Heterogeneous Catalysis: Identifying Novel Alloy Catalysts Based on
Rapid Screening for Materials with Desired Electronic Properties,‖ Topics in Catalysis,
vol. 55, no. 5–6, pp. 376–390, Apr. 2012.
[58] L. Colmenares, H. Wang, Z. Jusys, L. Jiang, S. Yan, G. Q. Sun, and R. J. Behm, ―Ethanol
oxidation on novel, carbon supported Pt alloy catalysts—Model studies under defined
diffusion conditions,‖ Electrochimica Acta, vol. 52, no. 1, pp. 221–233, Oct. 2006.
[59] I. M. Ciobıca, F. Frechard, R. A. van Santen, A. W. Kleyn, and J. Hafner, ―A theoretical
study of CH x chemisorption on the Ru (0001) surface,‖ Chemical Physics Letters, vol.
311, pp. 185–192, 1999.
82
[60] G. E. Ramirez-Caballero and P. B. Balbuena, ―Surface segregation of core atoms in core–
shell structures,‖ Chemical Physics Letters, vol. 456, no. 1–3, pp. 64–67, Apr. 2008.
[61] M. Kettner, W. B. Schneider, and a. a. Auer, ―Computational Study of Pt/Co Core–Shell
Nanoparticles: Segregation, Adsorbates and Catalyst Activity,‖ The Journal of Physical
Chemistry C, vol. 116, no. 29, pp. 15432–15438, Jul. 2012.
[62] G. E. Ramírez-Caballero, Y. Ma, R. Callejas-Tovar, and P. B. Balbuena, ―Surface
segregation and stability of core-shell alloy catalysts for oxygen reduction in acid
medium.,‖ Physical chemistry chemical physics : PCCP, vol. 12, no. 9, pp. 2209–18, Mar.
2010.
[63] J. R. Kitchin, J. K. Nørskov, M. a Barteau, and J. G. Chen, ―Modification of the surface
electronic and chemical properties of Pt(111) by subsurface 3d transition metals.,‖ The
Journal of chemical physics, vol. 120, no. 21, pp. 10240–6, Jun. 2004.
[64] A. Ruban, B. Hammer, P. Stoltze, and H. L. Skriver, ―Surface electronic structure and
reactivity of transition and noble metals,‖ Journal of Molecular Catalysis, vol. 115, pp.
421–429, 1997.
[65] M. Mavrikakis, B. Hammer, and J. Nørskov, ―Effect of Strain on the Reactivity of Metal
Surfaces,‖ Physical Review Letters, vol. 81, no. 13, pp. 2819–2822, Sep. 1998.
[66] J. K. Nørskov, T. Bligaard, J. Rossmeisl, and C. H. Christensen, ―Towards the
computational design of solid catalysts.,‖ Nature chemistry, vol. 1, no. 1, pp. 37–46, Apr.
2009.
[67] ―Metal prices accessed on 11/20/2012.‖ [Online]. Available:
http://www.metalprices.com/.

83
Appendices
Appendix 1: Sample Input file for Pt overlayer
&FORCE_EVAL
METHOD Quickstep
&DFT
#UKS
#MULTIPLICITY 1
BASIS_SET_FILE_NAME ./GTH_BASIS_SETS_5-12-10
POTENTIAL_FILE_NAME ./GTH_POTENTIALS_5-12-10
WFN_RESTART_FILE_NAME x.wfn
&MGRID
CUTOFF 300
NGRIDS 5
&END MGRID
&QS
WF_INTERPOLATION ASPC
# WF_INTERPOLATION PS
EXTRAPOLATION_ORDER 3
&END QS
&SCF
MAX_SCF 30
SCF_GUESS ATOMIC
EPS_SCF 2.0E-6
&OT
PRECONDITIONER FULL_SINGLE_INVERSE
MINIMIZER CG
&END
&OUTER_SCF
MAX_SCF 50
EPS_SCF 2.0E-6
&END
&RESTART
&EACH
GEO_OPT 2
&END
ADD_LAST NUMERIC
FILENAME RESTART
&END
&RESTART_HISTORY OFF
&END
&END
&END SCF
&XC
&XC_FUNCTIONAL PBE
&END XC_FUNCTIONAL
&END XC
&END PRINT
&END DFT
&SUBSYS

84
&CELL
ABC 16.3765930523 16.3765930523 35
ALPHA_BETA_GAMMA 90.0 90.0 60.0
&END CELL
&COORD
Pt -0.0018238034 -0.0027928306 -0.0925372762
Pt 1.3683003172 2.3621087916 -0.0923848224
Pt 2.7297728411 4.7316412458 -0.0923573867
Pt 4.0906688192 7.0893596001 -0.0924826026
Pt 5.4615342634 9.4552175943 -0.0921408880
Pt 6.8228387498 11.8219520470 -0.0924862232
Pt 2.7291802551 0.0039219506 -0.0923275535
Pt 4.0917531444 2.3623998628 -0.0919032744
Pt 5.4616659284 4.7263369925 -0.0922647879
Pt 6.8232996535 7.0937569120 -0.0925747996
Pt 8.1858918311 9.4541346674 -0.0922677275
Pt 9.5552445795 11.8177082275 -0.0926933468
Pt 5.4614019159 -0.0021151883 -0.0924171346
Pt 6.8239691197 2.3671872946 -0.0922569208
Pt 8.1852109917 4.7272002797 -0.0923820661
Pt 9.5562249612 7.0896779867 -0.0921715446
Pt 10.9172730858 9.4577079234 -0.0924695067
Pt 12.2806233161 11.8171305472 -0.0924884078
Pt 8.1855695963 -0.0018050558 -0.0921816255
Pt 9.5553626271 2.3629745633 -0.0921549971
Pt 10.9174248733 4.7310014748 -0.0924121549
Pt 12.2793325027 7.0892272989 -0.0927273987
Pt 13.6500230442 9.4533294325 -0.0920429830
Pt 15.0110451973 11.8230626320 -0.0925443203
Pt 10.9167261782 0.0032671877 -0.0924579738
Pt 12.2795877716 2.3617292862 -0.0922236737
Pt 13.6509814912 4.7264451097 -0.0921226580
Pt 15.0112063099 7.0956414956 -0.0919063080
Pt 16.3738407011 9.4524278290 -0.0923117890
Pt 17.7437014464 11.8186917758 -0.0927555327
Pt 13.6503652232 -0.0003278954 -0.0925799199
Pt 15.0117119687 2.3671963688 -0.0918942509
Pt 16.3738109707 4.7248361336 -0.0920606939
Pt 17.7458374484 7.0899328273 -0.0925855910
Pt 19.1051190642 9.4579998212 -0.0927544977
Pt 20.4685425648 11.8168992814 -0.0925686864
Ir 1.3636582436 0.7875230548 -2.3019315663
Ir 2.7290739099 3.1531656155 -2.3013819993
Ir 4.0949888888 5.5149579300 -2.3021865520
Ir 5.4578861035 7.8786890548 -2.3013612579
Ir 6.8235894911 10.2433257833 -2.3015975594
Ir 8.1884916021 12.6058742877 -2.3021855365
Ir 4.0948974052 0.7875229375 -2.3017062649
Ir 5.4580154391 3.1513200724 -2.3016625562
Ir 6.8237053774 5.5159594806 -2.3018077147
Ir 8.1893228947 7.8785042234 -2.3011768922
Ir 9.5525258034 10.2423660187 -2.3019504912
Ir 10.9175867663 12.6077544063 -2.3014944422
Ir 6.8236100201 0.7894007491 -2.3012701696
Ir 8.1890655470 3.1514262991 -2.3014367296
Ir 9.5521784561 5.5149290668 -2.3023198111
Ir 10.9182106703 7.8802282207 -2.3021173204
85
Ir 12.2831355916 10.2424831560 -2.3017641624
Ir 13.6462799885 12.6064769957 -2.3021406956
Ir 9.5518941988 0.7875095238 -2.3015960241
Ir 10.9180511284 3.1525741063 -2.3016013272
Ir 12.2835829537 5.5148657884 -2.3015591054
Ir 13.6458345099 7.8794844880 -2.3014793832
Ir 15.0119083429 10.2446952275 -2.3015676535
Ir 16.3772807110 12.6067361556 -2.3020598572
Ir 12.2830560865 0.7872165138 -2.3013973176
Ir 13.6462997206 3.1509773478 -2.3012028932
Ir 15.0120601670 5.5169025141 -2.3012498069
Ir 16.3775788514 7.8783955406 -2.3014765299
Ir 17.7401586544 10.2427487138 -2.3013710664
Ir 19.1064026520 12.6074074457 -2.3020678525
Ir 15.0124329369 0.7886328229 -2.3017053242
Ir 16.3773563328 3.1511768006 -2.3015444277
Ir 17.7399552962 5.5147997341 -2.3016348301
Ir 19.1059872328 7.8801598307 -2.3023836634
Ir 20.4710638493 10.2423135916 -2.3015861050
Ir 21.8347100338 12.6062267271 -2.3018336056
Ir 2.7291723354 1.5761992957 -4.4769902778
Ir 4.0939403662 3.9395845034 -4.4773346388
Ir 5.4587254880 6.3032376031 -4.4773985120
Ir 6.8236800505 8.6668467703 -4.4772745828
Ir 8.1881777162 11.0307244983 -4.4773631892
Ir 9.5529073414 13.3951184218 -4.4772060992
Ir 5.4588035870 1.5760106136 -4.4772982001
Ir 6.8237240071 3.9394355746 -4.4772871052
Ir 8.1882281913 6.3032426309 -4.4774460224
Ir 9.5529815206 8.6670510416 -4.4776288396
Ir 10.9175081567 11.0313822848 -4.4770355846
Ir 12.2820077123 13.3947556574 -4.4774183195
Ir 8.1884468320 1.5757650740 -4.4776251597
Ir 9.5530531260 3.9393943834 -4.4772577159
Ir 10.9179162660 6.3033709656 -4.4773156756
Ir 12.2826986208 8.6676863418 -4.4778372114
Ir 13.6472937360 11.0310981191 -4.4776551500
Ir 15.0119155590 13.3952560512 -4.4772324849
Ir 10.9180045372 1.5755930755 -4.4772443613
Ir 12.2827835875 3.9394254322 -4.4773181797
Ir 13.6474302866 6.3037558164 -4.4773360142
Ir 15.0118864713 8.6675464846 -4.4769582782
Ir 16.3764295980 11.0309117981 -4.4777845044
Ir 17.7415482748 13.3947605648 -4.4777983561
Ir 13.6471024290 1.5761716533 -4.4774315456
Ir 15.0115993111 3.9399666452 -4.4769667372
Ir 16.3761440431 6.3034859119 -4.4774012633
Ir 17.7410644811 8.6671708479 -4.4774393843
Ir 19.1064911124 11.0304966530 -4.4772100138
Ir 20.4709286425 13.3945881669 -4.4775390601
Ir 16.3763557192 1.5758793548 -4.4772965934
Ir 17.7410554147 3.9397614330 -4.4774046204
Ir 19.1057352590 6.3031077929 -4.4772195972
Ir 20.4707438412 8.6667714840 -4.4772787996
Ir 21.8351920953 11.0305368725 -4.4772924767
Ir 23.1999539584 13.3943164170 -4.4774561636
&END COORD

86
&KIND Ir
BASIS_SET DZVP-MOLOPT-SR-GTH
POTENTIAL GTH-PBE-q17
&END KIND
&KIND O
BASIS_SET TZVP-MOLOPT-GTH
POTENTIAL GTH-PBE-q6
&END KIND
&KIND Pt
BASIS_SET DZVP-MOLOPT-SR-GTH
POTENTIAL GTH-PBE-q18
&END KIND
&KIND C
BASIS_SET TZVP-MOLOPT-GTH
POTENTIAL GTH-PBE-q4
&END KIND
&KIND H
BASIS_SET TZVP-MOLOPT-GTH
POTENTIAL GTH-PBE-q1
&END KIND
&END SUBSYS
&END FORCE_EVAL
&GLOBAL
#########################
PROJECT 1layer_Pt
#########################
RUN_TYPE GEO_OPT
# RUN_TYPE ENERGY
PRINT_LEVEL LOW
&END GLOBAL
&MOTION
&GEO_OPT
MAX_ITER 200
MAX_FORCE 0.0009725
OPTIMIZER BFGS
&END GEO_OPT
&CONSTRAINT
&FIXED_ATOMS
LIST 73 74 75 76 77 78 79 80 81 82 83 84 85 86 87 88 89 90 91 92 93 94 95
96 97 98 99 100 101 102 103 104 105 106 107 108
&END FIXED_ATOMS
&END CONSTRAINT
&END MOTION

87
Appendix 2: Sample output file (Pt overlayer, bare surface)
**** **** ****** ** PROGRAM STARTED AT 2012-11-27
13:37:38.466
***** ** *** *** ** PROGRAM STARTED ON
hafnia.wpi.edu
** **** ****** PROGRAM STARTED BY
nadeskins
***** ** ** ** ** PROGRAM PROCESS ID
24745
**** ** ******* ** PROGRAM STARTED IN
/research/nadeskins/work6/tmp2/tmp
CP2K| version string: CP2K version 2.1.342 (Development
Version)
CP2K| is freely available from
http://cp2k.berlios.de/
CP2K| Program compiled at Fri Aug 13 14:04:08 EDT
2010
CP2K| Program compiled on
titania.wpi.edu
CP2K| Program compiled for Linux-x86-64-
gfortran
CP2K| Last CVS entry input_cp2k_motion.F/1.226/Fri Aug 13 03:37:43
2010
CP2K| Input file name Pt-111-6x6x4-
hex.inp
GLOBAL| Force Environment number
1
GLOBAL| Basis set file name ./GTH_BASIS_SETS_5-
12-10
GLOBAL| Geminal file name
BASIS_GEMINAL
GLOBAL| Potential file name ./GTH_POTENTIALS_5-
12-10
GLOBAL| MM Potential file name
MM_POTENTIAL
GLOBAL| Coordinate file name
__STD_INPUT__
GLOBAL| Method name
CP2K
GLOBAL| Project name Pt-111-6x6x4-
hex
GLOBAL| Preferred FFT library
FFTW3
GLOBAL| Run type
GEO_OPT
GLOBAL| All-to-all communication in single precision
F
GLOBAL| FFTs using library dependent lengths
F
GLOBAL| Global print level
LOW
GLOBAL| Total number of message passing processes
16

88
GLOBAL| Number of threads for this process
1
GLOBAL| This output is from process
0
MEMORY| system memory details [Kb]
MEMORY| rank 0 min max
average
MEMORY| MemTotal 132285816 132285816 132285816
132285816
MEMORY| MemFree 99958744 99958744 99968168
99967114
MEMORY| Buffers 201824 201824 201824
201824
MEMORY| Cached 18081480 18081480 18081480
18081480
MEMORY| Slab 214740 214740 214740
214740
MEMORY| SReclaimable 148916 148916 148916
148916
MEMORY| MemLikelyFree 118390964 118390964 118400388
118399334
GENERATE| Preliminary Number of Bonds generated:
0
GENERATE| Achieved consistency in connectivity generation.
GENERATE| Number of Bonds generated:
0
GENERATE| Preliminary Number of Bends generated:
0
GENERATE| Number of Bends generated:
0
GENERATE| Number of UB generated:
0
GENERATE| Preliminary Number of Torsions generated:
0
GENERATE| Number of Torsions generated:
0
GENERATE| Number of Impropers generated:
0
GENERATE| Number of 1-4 interactions generated:
0
*****************************************************************************
**
*****************************************************************************
**
**
**
** ##### ## ##
**
** ## ## ## ## ##
**

89
** ## ## ## ######
**
** ## ## ## ## ## ##### ## ## #### ## ##### #####
**
** ## ## ## ## ## ## ## ## ## ## ## ## ## ##
**
** ## ## ## ## ## ## ## #### ### ## ###### ######
**
** ## ### ## ## ## ## ## ## ## ## ## ##
**
** ####### ##### ## ##### ## ## #### ## ##### ##
**
** ## ##
**
**
**
** ... make the atoms dance
**
**
**
** Copyright (C) by CP2K Developers Group (2000 - 2010)
**
**
**
*****************************************************************************
**
SCF PARAMETERS Density guess:
ATOMIC
-----------------------------------------------------
---
max_scf:
30
max_scf_history:
0
max_diis:
4
-----------------------------------------------------
---
eps_scf:
1.00E-06
eps_scf_history:
0.00E+00
eps_diis:
1.00E-01
eps_eigval:
1.00E-05
-----------------------------------------------------
---
level_shift [a.u.]:
0.00
-----------------------------------------------------
---
Outer loop SCF in use
No variables optimised in outer loop

90
eps_scf
1.00E-06
max_scf
50
No outer loop optimization
step_size
5.00E-01
2D_MC| Monte Carlo annealing to optimize the distribution_2d
2D_MC| Number of moves
400000
2D_MC| Number of annealing cycles
10
2D_MC| Number of reduction steps per cycle
5
2D_MC| Reduction factor per step
0.8000000000
2D_MC| Termination tolerance
0.0200000000
2D_MC| Maximum temperature
0.5000000000
2D_MC| Swap probability
0.9000000000
2D_MC| Number of processor rows
4
2D_MC| Number of processor cols
4
2D_MC| Number of elements
144
2D_MC| What do we minimize SMALLEST
MAXIMUM
2D_MC| Cost of optimal distribution
441090
2D_MC| Cost of found distribution
448864
2D_MC| Difference in percent
2
*****************************************************************************
**
*** STARTING GEOMETRY OPTIMIZATION
***
*** BFGS
***
*****************************************************************************
**
Number of electrons:
2592
Number of occupied orbitals:
1296
Number of molecular orbitals:
1296

91
Number of orbital functions:
3744
Number of independent orbital functions:
3744
Extrapolation method: initial_guess
SCF WAVEFUNCTION OPTIMIZATION
----------------------------------- OT ------------------------------------
---
Allowing for rotations: F
Optimizing orbital energies: F
Minimizer : CG : conjugate gradient
Preconditioner : FULL_SINGLE_INVERSE : cholesky inversion of H + eS
Precond_solver : DEFAULT
Line search : 2PNT : 2 energies, one gradient
stepsize : 0.15000000
energy_gap : 0.20000000
eps_taylor : 0.10000E-15
max_taylor : 4
mixed_precision : F
----------------------------------- OT ------------------------------------
---
Step Update method Time Convergence Total energy
Change
---------------------------------------------------------------------------
---
1 OT CG 0.15E+00 27.3 0.01270964 -17111.1241058816 -
1.71E+04
2 OT LS 0.44E+00 10.6 -17208.7930226240
3 OT CG 0.44E+00 21.8 0.00751369 -17242.4072265627 -
1.31E+02
4 OT LS 0.15E+00 10.6 -17225.1455707073
5 OT CG 0.15E+00 21.3 0.00733750 -17249.1352089837 -
6.73E+00
6 OT LS 0.28E+00 10.6 -17278.0992393896
7 OT CG 0.28E+00 21.5 0.00163274 -17284.1682625975 -
3.50E+01
8 OT LS 0.69E+00 10.7 -17286.6079021859
9 OT CG 0.69E+00 21.6 0.00189849 -17287.9316511473 -
3.76E+00
10 OT LS 0.55E+00 10.5 -17292.3553922697
11 OT CG 0.55E+00 21.3 0.00184408 -17292.6840253336 -
4.75E+00
12 OT LS 0.32E+00 10.7 -17293.9730041723
13 OT CG 0.32E+00 21.8 0.00150197 -17295.2564969820 -
2.57E+00
14 OT LS 0.43E+00 10.7 -17297.4396849516
15 OT CG 0.43E+00 21.1 0.00099520 -17297.6130727504 -
2.36E+00

92
16 OT LS 0.58E+00 10.5 -17298.9430756874
17 OT CG 0.58E+00 21.7 0.00089398 -17299.0329552064 -
1.42E+00
18 OT LS 0.71E+00 10.7 -17300.3483665169
19 OT CG 0.71E+00 21.7 0.00085305 -17300.3932436207 -
1.36E+00
20 OT LS 0.44E+00 10.5 -17300.9058008982
21 OT CG 0.44E+00 21.2 0.00070585 -17301.1670479417 -
7.74E-01
22 OT LS 0.53E+00 10.6 -17301.7917310746
23 OT CG 0.53E+00 21.8 0.00067272 -17301.8110931174 -
6.44E-01
24 OT LS 0.61E+00 10.7 -17302.4803334599
25 OT CG 0.61E+00 21.1 0.00054790 -17302.4915736898 -
6.80E-01
26 OT LS 0.65E+00 10.5 -17302.9635877347
27 OT CG 0.65E+00 21.4 0.00046779 -17302.9654573639 -
4.74E-01
28 OT LS 0.72E+00 10.8 -17303.3450414780
29 OT CG 0.72E+00 21.6 0.00042835 -17303.3484864030 -
3.83E-01
30 OT LS 0.71E+00 10.5 -17303.6653625752
*** SCF run NOT converged ***
Total electronic density (r-space): -2592.0000000089 -
0.0000000089
Total core charge density (r-space): 2591.9999998438 -
0.0000001562
Total charge density (r-space): -
0.0000001651
Total charge density (g-space): -
0.0000001651
Overlap energy of the core charge distribution:
0.00000000289736
Self energy of the core charge distribution: -
26322.82921000411807
Core Hamiltonian energy:
5852.04783389286513
Hartree energy:
4851.43174046383228
Exchange-correlation energy: -
1684.31572693068892
Total energy: -
17303.66536257521511
outer SCF iter = 1 RMS gradient = 0.43E-03 energy = -
17303.6653625752
----------------------------------- OT ------------------------------------
---
Allowing for rotations: F
Optimizing orbital energies: F

93
Minimizer : CG : conjugate gradient
Preconditioner : FULL_SINGLE_INVERSE : cholesky inversion of H + eS
Precond_solver : DEFAULT
Line search : 2PNT : 2 energies, one gradient
stepsize : 0.15000000
energy_gap : 0.20000000
eps_taylor : 0.10000E-15
max_taylor : 4
mixed_precision : F
----------------------------------- OT ------------------------------------
---
Step Update method Time Convergence Total energy
Change
---------------------------------------------------------------------------
---
1 OT CG 0.15E+00 44.6 0.00061840 -17303.6653947814 -
3.17E-01
2 OT LS 0.16E+00 10.0 -17303.8094405111
3 OT CG 0.16E+00 21.8 0.00043471 -17303.8096246251 -
1.44E-01
4 OT LS 0.38E+00 10.7 -17303.9230589168
5 OT CG 0.38E+00 21.1 0.00053877 -17303.9841527304 -
1.75E-01
6 OT LS 0.37E+00 10.5 -17304.2466974587
7 OT CG 0.37E+00 21.5 0.00043669 -17304.2468278666 -
2.63E-01
8 OT LS 0.45E+00 10.9 -17304.4490724371
9 OT CG 0.45E+00 21.5 0.00034353 -17304.4555870475 -
2.09E-01
10 OT LS 0.57E+00 10.5 -17304.6116321843
11 OT CG 0.57E+00 21.3 0.00039802 -17304.6186577391 -
1.63E-01
12 OT LS 0.33E+00 10.5 -17304.6727406378
13 OT CG 0.33E+00 21.7 0.00035559 -17304.7434317464 -
1.25E-01
14 OT LS 0.41E+00 10.8 -17304.8642042015
15 OT CG 0.41E+00 21.1 0.00041242 -17304.8699266021 -
1.26E-01
16 OT LS 0.31E+00 10.5 -17304.9807615363
17 OT CG 0.31E+00 21.6 0.00033685 -17304.9961920444 -
1.26E-01
18 OT LS 0.31E+00 10.7 -17305.0815415350
19 OT CG 0.31E+00 21.7 0.00032335 -17305.0815684309 -
8.54E-02
20 OT LS 0.39E+00 10.5 -17305.1770211565
21 OT CG 0.39E+00 21.3 0.00029129 -17305.1814148884 -
9.98E-02
22 OT LS 0.33E+00 10.7 -17305.2477639899
23 OT CG 0.33E+00 21.8 0.00021033 -17305.2499363855 -
6.85E-02
24 OT LS 0.62E+00 10.6 -17305.3023003194
25 OT CG 0.62E+00 21.2 0.00024030 -17305.3167248280 -
6.68E-02

94
26 OT LS 0.36E+00 10.5 -17305.3392659825
27 OT CG 0.36E+00 21.6 0.00017303 -17305.3667465197 -
5.00E-02
28 OT LS 0.36E+00 10.8 -17305.3928078365
29 OT CG 0.36E+00 21.6 0.00019678 -17305.3928086396 -
2.61E-02
30 OT LS 0.43E+00 10.5 -17305.4319124893
*** SCF run NOT converged ***
Total electronic density (r-space): -2592.0000000081 -
0.0000000081
Total core charge density (r-space): 2591.9999998438 -
0.0000001562
Total charge density (r-space): -
0.0000001643
Total charge density (g-space): -
0.0000001643
Overlap energy of the core charge distribution:
0.00000000289736
Self energy of the core charge distribution: -
26322.82921000411807
Core Hamiltonian energy:
5840.75234993214690
Hartree energy:
4859.37371242443442
Exchange-correlation energy: -
1682.72876484462495
Total energy: -
17305.43191248926450
outer SCF iter = 2 RMS gradient = 0.20E-03 energy = -
17305.4319124893
----------------------------------- OT ------------------------------------
---
Allowing for rotations: F
Optimizing orbital energies: F
Minimizer : CG : conjugate gradient
Preconditioner : FULL_SINGLE_INVERSE : cholesky inversion of H + eS
Precond_solver : DEFAULT
Line search : 2PNT : 2 energies, one gradient
stepsize : 0.15000000
energy_gap : 0.20000000
eps_taylor : 0.10000E-15
max_taylor : 4
mixed_precision : F
----------------------------------- OT ------------------------------------
---

95
Step Update method Time Convergence Total energy
Change
---------------------------------------------------------------------------
---
1 OT CG 0.15E+00 44.9 0.00021062 -17305.4329305178 -
4.01E-02
2 OT LS 0.19E+00 9.9 -17305.4523374734
3 OT CG 0.19E+00 21.2 0.00015180 -17305.4531663388 -
2.02E-02
4 OT LS 0.37E+00 9.9 -17305.4688775758
5 OT CG 0.37E+00 21.9 0.00016438 -17305.4739680574 -
2.08E-02
6 OT LS 0.40E+00 10.5 -17305.5002165965
7 OT CG 0.40E+00 21.5 0.00016743 -17305.5003686024 -
2.64E-02
8 OT LS 0.49E+00 10.9 -17305.5327773863
9 OT CG 0.49E+00 21.9 0.00016303 -17305.5339191604 -
3.36E-02
10 OT LS 0.44E+00 10.6 -17305.5621271813
11 OT CG 0.44E+00 21.3 0.00015427 -17305.5624954750 -
2.86E-02
12 OT LS 0.41E+00 10.5 -17305.5860719585
13 OT CG 0.41E+00 21.7 0.00015899 -17305.5862187479 -
2.37E-02
14 OT LS 0.38E+00 10.8 -17305.6090226955
15 OT CG 0.38E+00 21.3 0.00014526 -17305.6092295764 -
2.30E-02
16 OT LS 0.39E+00 10.5 -17305.6291155337
17 OT CG 0.39E+00 21.5 0.00012961 -17305.6291388251 -
1.99E-02
18 OT LS 0.46E+00 10.6 -17305.6474034525
19 OT CG 0.46E+00 21.7 0.00013505 -17305.6478463646 -
1.87E-02
20 OT LS 0.39E+00 10.5 -17305.6643354691
21 OT CG 0.39E+00 21.2 0.00013332 -17305.6649545448 -
1.71E-02
22 OT LS 0.29E+00 10.6 -17305.6762750577
23 OT CG 0.29E+00 21.7 0.00012746 -17305.6775510200 -
1.26E-02
24 OT LS 0.46E+00 10.7 -17305.6933500187
25 OT CG 0.46E+00 21.5 0.00012741 -17305.6958049847 -
1.83E-02
26 OT LS 0.46E+00 10.5 -17305.7138529427
27 OT CG 0.46E+00 21.1 0.00012392 -17305.7138538724 -
1.80E-02
28 OT LS 0.46E+00 10.7 -17305.7310356705
29 OT CG 0.46E+00 21.5 0.00010987 -17305.7310356814 -
1.72E-02
30 OT LS 0.46E+00 10.7 -17305.7443803477
*** SCF run NOT converged ***
Total electronic density (r-space): -2592.0000000079 -
0.0000000079
Total core charge density (r-space): 2591.9999998438 -
0.0000001562
96
Total charge density (r-space): -
0.0000001640
Total charge density (g-space): -
0.0000001640
Overlap energy of the core charge distribution:
0.00000000289736
Self energy of the core charge distribution: -
26322.82921000411807
Core Hamiltonian energy:
5841.60990275317090
Hartree energy:
4858.52732082131115
Exchange-correlation energy: -
1683.05239392095018
Total energy: -
17305.74438034768900
outer SCF iter = 3 RMS gradient = 0.11E-03 energy = -
17305.7443803477
----------------------------------- OT ------------------------------------
---
Allowing for rotations: F
Optimizing orbital energies: F
Minimizer : CG : conjugate gradient
Preconditioner : FULL_SINGLE_INVERSE : cholesky inversion of H + eS
Precond_solver : DEFAULT
Line search : 2PNT : 2 energies, one gradient
stepsize : 0.15000000
energy_gap : 0.20000000
eps_taylor : 0.10000E-15
max_taylor : 4
mixed_precision : F
----------------------------------- OT ------------------------------------
---
Step Update method Time Convergence Total energy
Change
---------------------------------------------------------------------------
---
1 OT CG 0.15E+00 44.8 0.00011663 -17305.7443820947 -
1.33E-02
2 OT LS 0.23E+00 9.9 -17305.7510917483
3 OT CG 0.23E+00 21.1 0.00008885 -17305.7520615007 -
7.68E-03
4 OT LS 0.45E+00 10.1 -17305.7586821729
5 OT CG 0.45E+00 21.3 0.00009281 -17305.7607262327 -
8.66E-03
6 OT LS 0.38E+00 9.9 -17305.7683381090
7 OT CG 0.38E+00 21.8 0.00008453 -17305.7686387103 -
7.91E-03
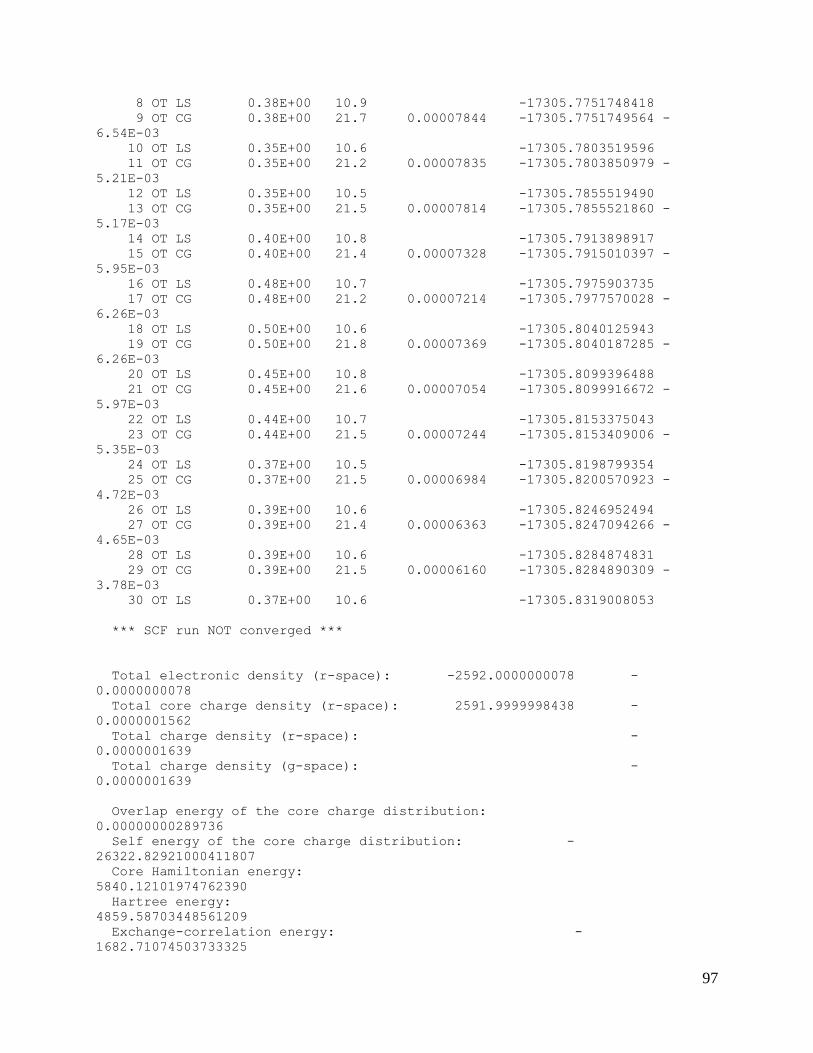
97
8 OT LS 0.38E+00 10.9 -17305.7751748418
9 OT CG 0.38E+00 21.7 0.00007844 -17305.7751749564 -
6.54E-03
10 OT LS 0.35E+00 10.6 -17305.7803519596
11 OT CG 0.35E+00 21.2 0.00007835 -17305.7803850979 -
5.21E-03
12 OT LS 0.35E+00 10.5 -17305.7855519490
13 OT CG 0.35E+00 21.5 0.00007814 -17305.7855521860 -
5.17E-03
14 OT LS 0.40E+00 10.8 -17305.7913898917
15 OT CG 0.40E+00 21.4 0.00007328 -17305.7915010397 -
5.95E-03
16 OT LS 0.48E+00 10.7 -17305.7975903735
17 OT CG 0.48E+00 21.2 0.00007214 -17305.7977570028 -
6.26E-03
18 OT LS 0.50E+00 10.6 -17305.8040125943
19 OT CG 0.50E+00 21.8 0.00007369 -17305.8040187285 -
6.26E-03
20 OT LS 0.45E+00 10.8 -17305.8099396488
21 OT CG 0.45E+00 21.6 0.00007054 -17305.8099916672 -
5.97E-03
22 OT LS 0.44E+00 10.7 -17305.8153375043
23 OT CG 0.44E+00 21.5 0.00007244 -17305.8153409006 -
5.35E-03
24 OT LS 0.37E+00 10.5 -17305.8198799354
25 OT CG 0.37E+00 21.5 0.00006984 -17305.8200570923 -
4.72E-03
26 OT LS 0.39E+00 10.6 -17305.8246952494
27 OT CG 0.39E+00 21.4 0.00006363 -17305.8247094266 -
4.65E-03
28 OT LS 0.39E+00 10.6 -17305.8284874831
29 OT CG 0.39E+00 21.5 0.00006160 -17305.8284890309 -
3.78E-03
30 OT LS 0.37E+00 10.6 -17305.8319008053
*** SCF run NOT converged ***
Total electronic density (r-space): -2592.0000000078 -
0.0000000078
Total core charge density (r-space): 2591.9999998438 -
0.0000001562
Total charge density (r-space): -
0.0000001639
Total charge density (g-space): -
0.0000001639
Overlap energy of the core charge distribution:
0.00000000289736
Self energy of the core charge distribution: -
26322.82921000411807
Core Hamiltonian energy:
5840.12101974762390
Hartree energy:
4859.58703448561209
Exchange-correlation energy: -
1682.71074503733325
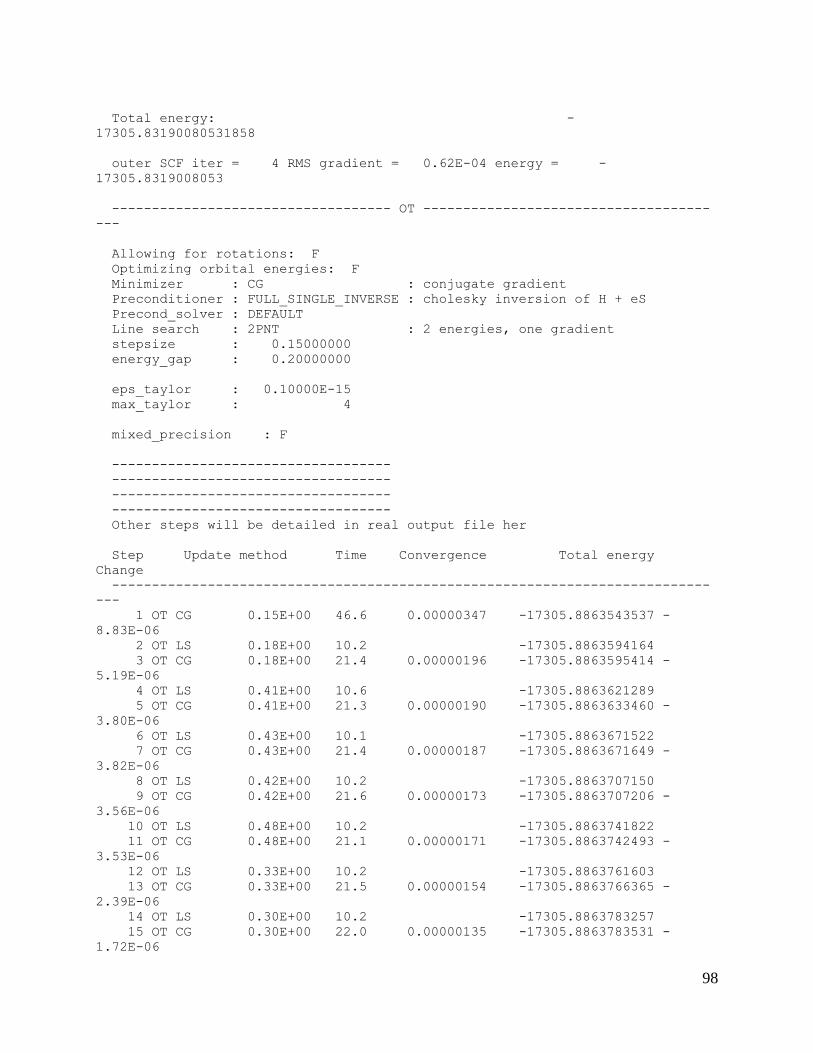
98
Total energy: -
17305.83190080531858
outer SCF iter = 4 RMS gradient = 0.62E-04 energy = -
17305.8319008053
----------------------------------- OT ------------------------------------
---
Allowing for rotations: F
Optimizing orbital energies: F
Minimizer : CG : conjugate gradient
Preconditioner : FULL_SINGLE_INVERSE : cholesky inversion of H + eS
Precond_solver : DEFAULT
Line search : 2PNT : 2 energies, one gradient
stepsize : 0.15000000
energy_gap : 0.20000000
eps_taylor : 0.10000E-15
max_taylor : 4
mixed_precision : F
-----------------------------------
-----------------------------------
-----------------------------------
-----------------------------------
Other steps will be detailed in real output file her
Step Update method Time Convergence Total energy
Change
---------------------------------------------------------------------------
---
1 OT CG 0.15E+00 46.6 0.00000347 -17305.8863543537 -
8.83E-06
2 OT LS 0.18E+00 10.2 -17305.8863594164
3 OT CG 0.18E+00 21.4 0.00000196 -17305.8863595414 -
5.19E-06
4 OT LS 0.41E+00 10.6 -17305.8863621289
5 OT CG 0.41E+00 21.3 0.00000190 -17305.8863633460 -
3.80E-06
6 OT LS 0.43E+00 10.1 -17305.8863671522
7 OT CG 0.43E+00 21.4 0.00000187 -17305.8863671649 -
3.82E-06
8 OT LS 0.42E+00 10.2 -17305.8863707150
9 OT CG 0.42E+00 21.6 0.00000173 -17305.8863707206 -
3.56E-06
10 OT LS 0.48E+00 10.2 -17305.8863741822
11 OT CG 0.48E+00 21.1 0.00000171 -17305.8863742493 -
3.53E-06
12 OT LS 0.33E+00 10.2 -17305.8863761603
13 OT CG 0.33E+00 21.5 0.00000154 -17305.8863766365 -
2.39E-06
14 OT LS 0.30E+00 10.2 -17305.8863783257
15 OT CG 0.30E+00 22.0 0.00000135 -17305.8863783531 -
1.72E-06

99
16 OT LS 0.34E+00 10.4 -17305.8863798263
17 OT CG 0.34E+00 21.7 0.00000114 -17305.8863798500 -
1.50E-06
18 OT LS 0.40E+00 10.3 -17305.8863810933
19 OT CG 0.40E+00 21.7 0.00000105 -17305.8863811243 -
1.27E-06
20 OT LS 0.37E+00 10.2 -17305.8863821097
21 OT CG 0.37E+00 22.2 0.00000096 -17305.8863821162 -
9.92E-07
*** SCF run converged in 21 steps ***
Total electronic density (r-space): -2592.0000000240 -
0.0000000240
Total core charge density (r-space): 2591.9999998411 -
0.0000001589
Total charge density (r-space): -
0.0000001828
Total charge density (g-space): -
0.0000001828
Overlap energy of the core charge distribution:
0.00000000324001
Self energy of the core charge distribution: -
26322.82921000411807
Core Hamiltonian energy:
5841.83603781334568
Hartree energy:
4858.37060564619787
Exchange-correlation energy: -
1683.26381557481682
Total energy: -
17305.88638211615034
outer SCF iter = 3 RMS gradient = 0.96E-06 energy = -
17305.8863821162
outer SCF loop converged in 3 iterations or 81 steps
ENERGY| Total FORCE_EVAL ( QS ) energy (a.u.): -
17305.886382116150344
----------------------------------------------------------------------------
---
-
-
- MESSAGE PASSING PERFORMANCE
-
-
-
----------------------------------------------------------------------------
---

100
ROUTINE CALLS TOT TIME [s] AVE VOLUME [Bytes] PERFORMANCE
[MB/s]
MP_Group 5 0.000
MP_Bcast 2195 0.044 100687.
5022.88
MP_Allreduce 12804 204.935 235.
0.01
MP_Gather 52 0.000 192.
0.00
MP_Sync 16 0.000
MP_Alltoall 33669 1920.035 27441772.
481.21
MP_ISendRecv 145530 5.326 105536.
2883.71
MP_Wait 304571 1389.162
MP_comm_split 11 0.001
MP_ISend 136328 1.338 898132.
91510.08
MP_IRecv 136328 5.667 896706.
21571.58
MP_Recv 2499 2.066 909946.
1100.66
----------------------------------------------------------------------------
---
----------------------------------------------------------------------------
---
-
-
- R E F E R E N C E S
-
-
-
----------------------------------------------------------------------------
---
CP2K version 2.1.342 (Development Version), the CP2K developers group
(2010).
CP2K is freely available from http://cp2k.berlios.de/ .
VandeVondele, J; Hutter, J.
JOURNAL OF CHEMICAL PHYSICS, 127 (11), 114105 (2007).
Gaussian basis sets for accurate calculations on molecular systems in
gas and condensed phases.
http://dx.doi.org/10.1063/1.2770708
Krack, M.
THEORETICAL CHEMISTRY ACCOUNTS, 114 (1-3), 145-152 (2005).
Pseudopotentials for H to Kr optimized for gradient-corrected
exchange-correlation functionals.
http://dx.doi.org/10.1007/s00214-005-0655-y
VandeVondele, J; Krack, M; Mohamed, F; Parrinello, M; Chassaing, T;
Hutter, J. COMPUTER PHYSICS COMMUNICATIONS, 167 (2), 103-128 (2005).

101
QUICKSTEP: Fast and accurate density functional calculations using a
mixed Gaussian and plane waves approach.
http://dx.doi.org/10.1016/j.cpc.2004.12.014
Frigo, M; Johnson, SG.
PROCEEDINGS OF THE IEEE, 93 (2), 216-231 (2005).
The design and implementation of FFTW3.
http://dx.doi.org/10.1109/JPROC.2004.840301
Kolafa, J.
JOURNAL OF COMPUTATIONAL CHEMISTRY, 25 (3), 335-342 (2004).
Time-reversible always stable predictor-corrector method for molecular
dynamics of polarizable molecules.
http://dx.doi.org/10.1002/jcc.10385
VandeVondele, J; Hutter, J.
JOURNAL OF CHEMICAL PHYSICS, 118 (10), 4365-4369 (2003).
An efficient orbital transformation method for electronic structure
calculations.
http://dx.doi.org/10.1063/1.1543154
Hartwigsen, C; Goedecker, S; Hutter, J.
PHYSICAL REVIEW B, 58 (7), 3641-3662 (1998).
Relativistic separable dual-space Gaussian pseudopotentials from H to Rn.
http://dx.doi.org/10.1103/PhysRevB.58.3641
Lippert, G; Hutter, J; Parrinello, M.
MOLECULAR PHYSICS, 92 (3), 477-487 (1997).
A hybrid Gaussian and plane wave density functional scheme.
http://dx.doi.org/10.1080/002689797170220
Perdew, JP; Burke, K; Ernzerhof, M.
PHYSICAL REVIEW LETTERS, 77 (18), 3865-3868 (1996).
Generalized gradient approximation made simple.
http://dx.doi.org/10.1103/PhysRevLett.77.3865
Goedecker, S; Teter, M; Hutter, J.
PHYSICAL REVIEW B, 54 (3), 1703-1710 (1996).
Separable dual-space Gaussian pseudopotentials.
http://dx.doi.org/10.1103/PhysRevB.54.1703
----------------------------------------------------------------------------
---
-
-
- T I M I N G
-
-
-

102
----------------------------------------------------------------------------
---
SUBROUTINE CALLS ASD SELF TIME TOTAL
TIME
AVERAGE MAXIMUM AVERAGE
MAXIMUM
CP2K 1 1.0 0.06 0.07 35830.04
35830.05
geoopt_bfgs 1 3.0 0.04 0.36 35829.21
35829.25
cp_geo_opt 1 2.0 0.00 0.00 35829.21
35829.25
cp_eval_at 13 4.0 0.00 0.01 35825.64
35825.70
qs_energies_scf 13 5.9 0.00 0.00 35428.68
35428.73
scf_env_do_scf 13 6.9 0.00 0.01 35189.45
35189.49
qs_forces 12 5.0 0.47 0.78 34460.53
34460.53
scf_env_do_scf_inner_loop 2135 8.0 0.64 0.81 33243.18
33294.48
qs_rho_update_rho 2148 9.0 0.04 0.06 12977.75
12999.66
calculate_rho_elec 2148 10.0 10078.43 10896.25 12977.71
12999.61
qs_ks_build_kohn_sham_matrix 2147 9.9 25.46 36.74 12937.44
12967.47
qs_ks_update_qs_env 2213 9.0 0.05 0.07 12774.43
12803.83
cp_dbcsr_multiply_d 32317 12.8 0.25 0.29 9824.37
9884.85
qs_scf_loop_do_ot 2135 9.0 0.01 0.02 8334.38
8385.99
integrate_v_rspace 1086 10.9 5971.00 6211.72 7024.51
7027.79
ot_scf_mini 2135 10.0 0.09 0.11 6791.93
6812.61
density_rs2pw 2148 11.0 16.36 17.74 2516.74
4672.26
qs_vxc_create 2147 10.9 0.13 0.14 4312.14
4334.05
fft_wrap_pw1pw2 30202 12.7 1.23 1.45 4118.44
4163.89
dbcsr_mult_NSS_NRN 3729 12.0 3973.15 4069.63 3973.15
4069.63
fft_wrap_pw1pw2_150 17266 13.9 220.83 257.99 3896.12
3920.37
rs_pw_transfer 16195 12.3 0.55 0.65 1608.59
3804.45
rs_pw_transfer_RS2PW_150 2161 12.9 1261.61 3454.02 1261.61
3454.02
fft3d_ps 30202 14.7 1481.12 1769.85 3189.81
3366.18
xc_rho_set_and_dset_create 2147 12.9 154.31 162.97 3066.87
3164.49

103
xc_vxc_pw_create 1086 11.9 73.83 92.58 2753.01
2774.93
ot_mini 2135 11.0 0.07 0.08 2648.73
2672.23
qs_ot_get_derivative 1074 12.0 0.02 0.03 2075.83
2098.06
distribute_matrix 3246 11.3 748.38 1945.30 815.45
1985.09
init_scf_loop 78 8.0 0.00 0.01 1938.72
1941.91
dbcsr_mult_NRN_TRN 2160 12.0 1554.97 1596.26 1554.97
1596.26
calculate_dm_sparse 2148 10.0 0.02 0.03 1552.39
1593.80
dbcsr_mult_NRN_NSN 7570 13.6 1543.34 1559.92 1543.34
1559.92
xc_exc_calc 1061 12.0 62.08 93.92 1559.00
1559.01
qs_ot_get_derivative_taylor 984 13.0 0.06 0.07 1343.85
1363.78
xc_functional_eval 2147 13.9 0.15 0.19 1233.23
1315.65
pbe_lda_eval 2147 14.9 1233.08 1315.48 1233.08
1315.48
dbcsr_mult_TRN_NRN 5513 13.8 1221.53 1290.58 1221.53
1290.58
x_to_yz 15105 16.1 1039.85 1232.40 1039.85
1232.40
qs_ot_get_p 2213 10.9 20.22 31.91 1009.97
1064.87
dbcsr_mult_NSN_NSN 11513 14.6 909.73 914.50 909.73
914.50
qs_ot_get_orbitals 2135 11.0 0.02 0.03 864.48
873.25
yz_to_x 15097 15.2 668.62 854.14 668.62
854.14
----------------------------------------------------------------------------
---
**** **** ****** ** PROGRAM ENDED AT 2012-11-27
23:34:48.804
***** ** *** *** ** PROGRAM RAN ON
hafnia.wpi.edu
** **** ****** PROGRAM RAN BY
nadeskins
***** ** ** ** ** PROGRAM PROCESS ID
24745
**** ** ******* ** PROGRAM STOPPED IN
/research/nadeskins/work6/tmp2/tmp