parsymg: a parallel clustering approach for unsupervised...
TRANSCRIPT

Full Terms & Conditions of access and use can be found athttp://www.tandfonline.com/action/journalInformation?journalCode=tjde20
Download by: [66.168.42.134] Date: 08 April 2017, At: 12:29
International Journal of Digital Earth
ISSN: 1753-8947 (Print) 1753-8955 (Online) Journal homepage: http://www.tandfonline.com/loi/tjde20
ParSymG: a parallel clustering approach forunsupervised classification of remotely sensedimagery
Zhenhong Du, Yuhua Gu, Chuanrong Zhang, Feng Zhang, Renyi Liu, JeanSequeira & Weidong Li
To cite this article: Zhenhong Du, Yuhua Gu, Chuanrong Zhang, Feng Zhang, Renyi Liu,Jean Sequeira & Weidong Li (2017) ParSymG: a parallel clustering approach for unsupervisedclassification of remotely sensed imagery, International Journal of Digital Earth, 10:5, 471-489, DOI:10.1080/17538947.2016.1229818
To link to this article: http://dx.doi.org/10.1080/17538947.2016.1229818
Published online: 27 Sep 2016.
Submit your article to this journal
Article views: 86
View related articles
View Crossmark data

ParSymG: a parallel clustering approach for unsupervisedclassification of remotely sensed imageryZhenhong Dua,b, Yuhua Gua , Chuanrong Zhangc, Feng Zhanga , Renyi Liub ,Jean Sequeirad and Weidong Lic
aGeographic Information Science Institution, School of Earth Sciences, Zhejiang University, Hangzhou, People’sRepublic of China; bZhejiang Key Laboratory of Geographic Information System, Zhejiang University, Han gzhou,People’s Republic of China; cGeography and Center for Envrionmental Sciences and Engineering, University ofConnecticut, Storrs, CT, USA; dDepartment of Computer Science, Aix-Marseille University, Marseille, France
ABSTRACTSymmetry is a common feature in the real world. It may be used toimprove a classification by using the point symmetry-based distance asa measure of clustering. However, it is time consuming to calculate thepoint symmetry-based distance. Although an efficient parallel pointsymmetry-based K-means algorithm (ParSym) has been propsed toovercome this limitation, ParSym may get stuck in sub-optimal solutionsdue to the K-means technique it used. In this study, we proposed anovel parallel point symmetry-based genetic clustering (ParSymG)algorithm for unsupervised classification. The genetic algorithm wasintroduced to overcome the sub-optimization problem caused byinappropriate selection of initial centroids in ParSym. A message passinginterface (MPI) was used to implement the distributed master–slaveparadigm. To make the algorithm more time-efficient, a three-phasespeedup strategy was adopted for population initialization, imagepartition, and kd-tree structure-based nearest neighbor searching. Theadvantages of ParSymG over existing ParSym and parallel K-means(PKM) alogithms were demonstrated through case studies using threedifferent types of remotely sensed images. Results in speedup and timegain proved the excellent scalability of the ParSymG algorithm.
ARTICLE HISTORYReceived 27 April 2016Accepted 24 August 2016
KEYWORDSUnsupervised classification;parallel clustering; geneticalgorithm; point symmetry-based distance
1. Introduction
With the development and integration of the Digital Earth and Big data, how to rapidly mine usefulinformation from the volume Digital Earth data including remotely sensed satellite imagery thus widenthe applications of Digital Earth has become the focus of Digital Earth research in the Big data era (Cra-glia et al. 2012; Goodchild et al. 2012). As an unsupervised classification method, clustering is becom-ing popular for mining useful information from remotely sensed imagery. Clustering is a multivariatestatistical analysis method for classifying a collection of objects into a set of natural clusters, and it is animportant unsupervised pattern recognition (or unsupervised classification) technique (Jain, Murty,and Flynn 1999; Jain, Duin, and Mao 2000). Clustering can divide a data set, which has no categorylabels, into several subsets based on some criteria (Kaufman and Rousseeuw 2009). It is widely usedto extract useful information from massive imagery data of digital earth (Bao et al. 2015; Qiao et al.2015). Many clustering techniques had been developed during last decades (Pal and Pal 1993; Jain,Murty, and Flynn 1999; Jain, Duin, and Mao 2000). For example, some recent clustering works for
© 2016 Informa UK Limited, trading as Taylor & Francis Group
CONTACT Feng Zhang [email protected] Geographic Information Science Institution, School of Earth Sciences,Zhejiang University, Xixi Campus, Hangzhou, Zhejiang CN 310027, People’s Republic of China
INTERNATIONAL JOURNAL OF DIGITAL EARTH, 2017VOL. 10, NO. 5, 471–489http://dx.doi.org/10.1080/17538947.2016.1229818

remotely sensed imagery include the spectral-spatial clustering with a local weight parameter determi-nation method (Ma, Zhong, and Zhang 2016), the adaptive multi-objective memetic fuzzy clusteringalgorithm (Ma, Zhong, and Zhang 2015), the adaptive memetic fuzzy clustering algorithm with spatialinformation (Zhong, Ma, and Zhang 2014), and the automatic fuzzy clustering based on adaptivemulti-objective differential evolution (Zhong, Zhang, and Zhang 2013). Among them the K-meansalgorithm is a well-known clustering approach. Recently, many K-means-based techniques were devel-oped, such as fuzzy semi-Kmeans (Liu, Chang, and Li 2013), DSKmeans (Huang et al. 2014), andimproved Cop-Kmeans (Yang et al. 2012). These K-means-based techniques can detect clustersusing the Euclidean or Mahalanobis distance as a measure of similarity. However, they face challengesin detecting clusters with different shapes and sizes under the situation where no a priori informationabout the geometric characteristics of a data set exists. They have difficulties in properly partitioning agiven data set that has the symmetric property.
For remotely sensed satellite imagery, symmetry, which can be a measure of clustering, is a com-mon characteristic among various features (Maulik and Sarkar 2012). Therefore, it is reasonable toassume some kinds of symmetry exist in the structures of clusters in remotely sensed data. Based onthis idea, Su and Chou (2001) proposed the symmetry-based K-means (SBKM) algorithm to group agiven data set into a set of clusters with different geometrical structures. While SBKM does makeproper clustering when some points in the data set are symmetrical, it fails when clusters themselvesin the data set are symmetric. To overcome this limitation, Chou, Su, and Lai (2002) suggested themodified SBKM to compute the similarity distance, thus making some improvements in finding thenumber of clusters with different geometrical structures by combining symmetry with the Euclideandistance. However, the failure of SBKM in identifying clusters with symmetric shapes irrespective ofgeometric structure, size, and overlapping was not completely solved by their modified algorithm.Bandyopadhyay and Saha (2007) proposed the point symmetry-based distance as a new distancemeasure for clustering. However, the clustering methods proposed by them (Bandyopadhyay andSaha 2007) may get stuck in sub-optimal solutions, depending on the choice of the initial cluster cen-ters. In addition, it is time consuming to calculate the point symmetry-based distance, especiallywhen it is applied to unsupervised classification of remotely sensed satellite imagery. With the devel-opment of digital earth and the availability of higher resolutionsensors, the size and number of thebands of remotely sensed imagery increase fast (Guo 2014; Huadong 2016). This may lead to anunprecedented mass of data and tremendous calculation requirement for digital earth applications(Yang et al. 2011; Liu et al. 2016). The parallel approach may be applied to overcome the perform-ance issue, while the genetic algorithm (GA) may be used to resolve the problem of stucking in sub-optimal solutions.
The GA (Davis 1991) is a global stochastic search algorithm capable of performing adaptive androbust search over a wide range of search space topologies based on the mechanisms of genetic andevolutionary biological processes in natural systems. GA can automatically acquire and accumulateknowledge about the searching space and adaptively adjust the searching process to obtain an opti-mal or quasi-optimal solution. Using a set of solutions rather than a single solution in each gener-ation is an important characteristic of GA, which distinguishes GA from most of other searchtechniques. GA has been successfully applied to different fields. Since GA eliminates the restrictionof fixing the number of clusters a priori, it was proposed as a robust method for image clustering andclassification (Srikanth et al. 1995). In fact, different GA-based methods have been developed for theclustering purpose. For example, Krishna and Murty (1999) proposed a novel hybrid geneticK-means algorithm (GKA) to optimally partition a given data set into a specified number of clusters.In their approach, only one-step of the K-means algorithm was used as a search operator in GKA.Their study results show that GKA can converge a clustering to the global optimum. However, theinitialization phase in GKA might end up with illegal strings. The elimination of illegal strings couldlimit the performance of GKA. To improve the performance of GKA, Lu et al. (2004a) proposed afast GKA, which permits illegal strings in the initialization phase. The flexibility of allowing illegalstrings in the evolution process improved the time performance of the algorithm. Recently this
472 Z. DU ET AL.

algorithm was further extended to the incremental GKA (Lu et al. 2004b), which was proved to out-perform the former when the mutation probability is low. These previous related studies proved thatGA could help K-means-based clustering methods to overcome the local optimization problem.However, the aforementioned GA-based clustering methods face the performance challenge causedby large population sizes and complex evolution processes.
Parallel clustering approaches using the MPI or MapReduce may offer a solution to improve theperformance of GA-based clustering methods. In fact, many studies on this topic have been done(Sarkar and Maulik 2009; Goodall, Pettinger, and Di Fatta 2013; Kumar, Kiran, and Prathap2013; Hadian and Shahrivari 2014; Shi et al. 2014; Sun et al. 2014). For example, Lin, Yang, andRutayisire (2011) proposed a parallel Cop-Kmeans clustering algorithm based on a MapReduce fra-mework, which did the Depth-First Search in parallel to improve efficiency. However, their MapRe-duce framework wrote the output of each reducer to the disk during each iteration, consequentlymaking hard disk I/O a bottleneck. To overcome this limitation, Hadian and Shahrivari (2014) pro-posed an algorithm that combines PKM clustering with single-pass stream-clustering. The proposedsingle-pass stream-clustering method is able to utilize the maximum capabilities of a regular multi-core PC to efficiently cluster a data set while resulting in acceptable quality of clusters. Although thisalgorithm can improve clustering efficiency greatly, it does not take local optimal solutions into con-sideration. Recently, Maulik and Sarkar (2012) designed a parallel point SBKM (ParSym) algorithmfor image classification. As an efficient parallel clustering technique, this method is able to correctlyidentify symmetrical clusters by using a distributed master–slave paradigm based on point sym-metry-based distances. However, ParSym may get stuck in sub-optimal solutions, depending onthe choice of the initial cluster centers. Moreover, ParSym still faces the performance challengefor satellite image classification, because it requires a huge amount of computing time. Furtherresearch is needed to improve the ParSym method.
To overcome both the sub-optimization limitation and the computing limitation in existingmethods, in this study we proposed a novel parallel point symmetry-based genetic clustering algor-ithm (ParSymG) for efficient classification of remotely sensed imagery in digital earth. The proposedalgorithm solves the information extraction problems for Digital Earth applications, thus it may dra-matically enlarge the basic data of Digital Earth. In addition, the proposed new algorithm may assistparallelization and optimization of some of the recently proposed fuzzy clustering algorithms basedon the evolutionary computation methods. In general, the information extracted with our algorithmmay effectively provide a further data service for users of Digital Earth, and the new clustering strat-egies proposed by us may help optimize the information extraction methods of digital earth appli-cations. The main advantage of ParSymG is that it is able to solve both the sub-optimization problemand the performance problem via combining the GA with ParSym. In this proposed approach, the Kcluster centers were encoded into a string for each chromosome by using the float-encoding method.The Fitness function was used as the principle for population evolution. Crossover and Mutationoperations were used to mutate the process to achieve the local optimum goal. To improve perform-ance, a three-phase speedup strategy was implemented in this approach.
The remainder of this paper is organized as follows. In Section 2, we briefly introduce the relatedstuties in PKM and ParSym. In Section 3, we introduce methods used in this study, including theproposed ParSymG algorithm, time complexity analysis, and the indices used for the validation pur-pose. In Section 4, three types of high-resolution remotely sensed satellite images were used to verifythe proposed algorithm. Finally, we conclude this paper with the perspective of future research.
2. Related work
2.1. Parallel K-means
K-means is one of the most popular and also the simplest partition algorithm, but it is restricted byperformance efficiency (Kantabutra and Couch 2000). Rodrigues et al. (2012) proposed a parallel
INTERNATIONAL JOURNAL OF DIGITAL EARTH 473

and distributed algorithm for K-means, which could be used for image segmentation, using pro-gramming models for shared memory and message passing. Zhang et al. (2011) proposed a PKMclustering algorithm with MPI, which enabled the clustering algorithm effectively in the parallelenvironment. Zhang et al. (2006) adopted the data parallel strategy and the master–slave modelin a PKM algorithm (master–slave here means a master process/device and multiple slave pro-cesses/devices). These researches use different techniques to realize PKM. The PKM algorithmcan be summarized as follows.
At the beginning, the master process divides the data set intoM sub-datasets and sends them withcluster centroids to different slave processes. Each slave receives a sub-dataset with the size of�N = N/M, where N is the size of the entire data set and M is the number of slaves. Each slave exe-cutes a clustering operation with received data using the Euclidean distances between points andcluster centers, and returns the clustering results to the master for updating centroids. This pro-cedure is continued until the value difference between two successive error-squared functions issmaller than a specific number. The algorithm ends when the clustering converges.
The time complexity of PKM is O(N/M) while the time complexity of K-means is O(N). Withincreaing number of slaves, the runtime of PKM can be effectively reduced. As for the algorithmaccuracy, however, PKM cannot overcome the problem of local optimization of K-means.
2.2. ParSym
To speed up the computation of the point symmetry-based distance, Maulik and Sarkar (2012) pro-posed the ParSym algorithm. ParSym is an efficient scalable parallel technique for clustering multi-spectral remotely sensed imagery using the point symmetry-based distance. This algorithm uses adistributed master–slave paradigm (Beaumont, Legrand, and Robert 2003; Almeida, González,and Moreno 2006) in a parallel point SBKM algorithm. The kd-tree data structure is used as aspeedup strategy for computing the point symmetry distance.
The ParSym algorithm is composed of three phases: (1) a data set with N elements is partitionedhorizontally. (2) Centroids are updated in slaves using the K-means method. (3) The point sym-metry-based fine-tuning operation is performed in parallel. The horizontally partitioned data setbecomes a N/M sub-dataset, where M is the number of slaves. After initial random cluster assign-ment is conducted, each slave updates the centroids of locally partitioned data and returns its localassignment result to the master. Subsequently, the master merges the local assignment results into aglobal cluster assignment result using the union-find data structure. The final fine-tuning phase uti-lizes the point symmetry distance as a clustering measure. Each point will be reassigned to a newcluster only if its symmetrical point also resides in the new cluster and its point symmetry distanceto the centroid of the new cluster is minimum. After each correction, the master collects all resultsand updates centroids. This leads to convergence to stop the execution process.
The case studies by Maulik and Sarkar (2012) demonstrated that ParSym is superior to the well-known PKM algorithms both intuitively and quantitatively. However, due to the limitations of the K-means technique, each update of cluster centroids is only determined by the values of pixels in cor-responding classes in each iteration. This may cause the ParSym algorithm to get stuck at sub-opti-mal solutions due to the inappropriate selection of initial clustering centers.
3. Methods
3.1. Proposed algorithm
By combining the GA with the point symmetry-based distance, a new parallel point symmetry-basedgenetic clustering algorithm (ParSymG) is proposed in this study.
Considering the fact that symmetry is a well-known property of objects/features, ParSymG usesthe point symmetry-based distance measure to determine clusters, and it achieves the effectiveness
474 Z. DU ET AL.

goal for classifying symmetric features in smaller regions via image partition. In addition, a three-phase speedup strategy is proposed to overcome the slowness limitation of the GAPS algorithm(Bandyopadhyay and Saha 2007) in detecting different clusters: (1) considering the irrelevancebetween the chromosomes in the population of the GA, the chromosomes are computed parallelly.(2) Based on the regional symmetry of remotely sensed imagery, an image is divided into partitionsand each partition is computed parallelly, so as to improve the time efficiency of clustering andenhance the clustering effect. (3) The kd-tree-based data structure is used for nearest neighborsearching to reduce the complexity of computing the point symmetry distance, thus acceleratingthe computation.
The methods, including the proposed ParSymG algorithm, complexity analysis, and the validityindices, are introduced in the following sections. The major steps of the proposed ParSymG algor-ithm are given as follows:
ParSymG Algorithm:Step 1: Population Initialization and Image Partition:1.1: On the master node M0, centroids are encoded into chromosomes. All these chromosomes together have a population size ofpopSize.
1.2: Horizontally partition the image and population into M slaves. The size of the image block for each slave to process is�N = Width× Height × PopSize/M.
1.3: Compute u and broadcast it, where u is the maximum nearest neighbor distance in the image data set.Step 2: Point Assignment:2.1: The master sends chromosomes to each slave.2.2: The M slaves receive chromosomes and u. For all points xi belonging to the image block, find k∗ = Argmin j= 1,...,Kdps(xi , zj ), if
xi , xi belongs to cluster k∗ ; otherwise, find �k∗ = Argmin j=1,...,Kde(xi , zj ), xi is assigned to cluster �k
∗.
Step 3: Centroids Update:3.1: Each slave computes the intermediate values of sumFitness and sumChromosome, then sends them to the master.3.2: The master receives the intermediate values to update the fitness and the centroids.Step 4: Selection: The selection operation is performed popSize times on the master node. For each selection, a random numberbetween 0 and 1 is firstly generated. If
∑i−1j=1 (fj/fsum) ≤ rand0−1 ,
∑ij=1 (fij/fsum), the ith chromosome is selected to be
inherited to the next generation.Step 5: Crossover: The population is randomly paired by the master. For each chromosome in the population, a crossover point ischosen randomly by the master. If the crossover probability mc is satisfied, the portions of the chromosomes to the right of thecrossover point will be exchanged between the paired chromosomes to end the crossover process.
Step 6: Mutation: For i = 1 to popSize, mutation with a fixed probability mm on the randomly chosen position of chromosomei iscarried out by the master.
Step 7: If the centroids have converged or the maximun iteration has been reached, go to Step 8; otherwise, go to Step 2.Step 8: Use the chromosome in the Best variable to generate the classified image and compute the final validity indices Jm , XB, I ,and Sym, and then stop.
There are six major components in this algorithm, which include population initialization, pointsassignment, fitness computation and cluster centers updating, selection, crossover, and mutation.These six components are introduced in details as follows.
3.1.1. String representation and population initializationEach string is a sequence of the real numbers representing the K cluster centers. The chromosome foran image data set with k clusters in d dimensions is represented by:
C = {x11, x12, . . . , x1d , x21, x22, . . . , x2d , . . . , xk1, xk2, . . . , xkd}. (1)
Each chromosome has the length of k× d encoded as a float number. This kind of encoding is clearand intuitive, and can overcome many problems faced by the binary encoding, such as repeatedlydecoding during the process and the requirement for a limited chromosome length. The K clustercenters encoded in each chromosome are initialized to K randomly chosen points from a remotelysensed image. This process is repeated popSize times for each chromosome in the population, wherepopSize is the size of the population.
The image is horizontally partitioned into blocks by the master process. Then the blocks are allo-cated to each slave process by the master. Here, popSize is the size of the population and M is thenumber of the slaves. When M is smaller than popSize, the image is divided into M blocks. Each
INTERNATIONAL JOURNAL OF DIGITAL EARTH 475
slave has popSize chromosomes and needs to process an image with the size ofWidth × Height/M.WhenM is larger than popSize, the image is divided intoM/popSize blocks. Under this situation eachslave only has one chromosome and needs to process an image with the size ofWidth× Height/(M/popSize). So it is equal that each slave needs to processWidth× Height × popSize/M data.
Thereafter, PKM will be executed five iterations (Maulik and Sarkar 2012) to make the centroidsbeing separated more quickly.
3.1.2. Assignment of pointsAll slaves receiving chromosomes and image blocks from the master perform their classificationsparallelly. Each point xi, 1≤ i≤ n, find its cluster k∗ = Argmin j=1,...,Kdps(xi, zj).
If dps(xi, zk∗) , u, xi belongs to cluster k∗; otherwise, Euclidean distance will be used to reassignthe point xi to other clusters.
After the points are assigned to their respective clusters, a ClusterMetric is calculated as formular(2). For all points xi e kth cluster, the sumFitness is computed using sumFitness + = dps(xi, zj).Moreover, the sumChromosome is also calculated and used to accelerate the update of the centroids.
3.1.3. Computing fitness and updating cluster centersTo achieve a better clustering result the distance between each point and its corresponding clustercenter should be minimized. Because the point symmetry-based distance is used as the clusteringmeasurement, the objective function of ClusterMetric is defined as:
ClusterMetric =∑ni=1
dps(xi, ck) where xi [ ck. (2)
The GA is used to search for the minimum value of the objective function of ClusterMetric. A fitnessfunction e is constructed via the objective function of ClusterMetric using the following formula:
Fitness = 1ClusterMetric
= 1∑i=1,...,n and xi[ck
d ps(xi, ck). (3)
The classification result of each slave is transferred to the master. Then master compute the corre-sponding fitness of each population and use the fitness to update the cluster centers. The average ofall points belonging to one class is assigned to the new, updated center point of the class, which iscalculated by
Centroidsk =∑
i[ckxi
Nk. (4)
3.1.4. SelectionSelection operation is used to select parents for breeding based on the calculated fitness. Chromo-somes with higher fitness will have a greater probability of being selected so that the outstandinggenes can be inherited by the next generation. The roulette wheel selection method (Lipowski andLipowska 2012), which assumes that the selection probability is proportional to the fitness of an indi-vidual, is adopted in this algorithm. The specific procedure of the roulette wheel selectionmethod isdescribed as follows:
Firstly, the sum of fitness values of all chromosomes in the population is calculatedusing the function fsum = ∑ popSize
i=1 fi;Secondly, the probability fi/fsum is calculated to measure the relative fitness of each chromosome.
This probability value serves as the inherited probability of each chromosome by the next
476 Z. DU ET AL.
generation. The individual probability of each chromosome is used to construct the roulettewheel for selection, and the sum of all the individual probabilities should be 1;
Finally, a random number between 0 and 1 is used for selecting an individual chromosome based onthe probability region where the random number is located. The above process is repeated pop-Size times until a new population is picked up.
3.1.5. CrossoverCrossover is a major operation to produce diversified and potentially promising new chromosomesin this algorithm. It is used to swap parts of genes between two paired parent chromosomes with acertain probability to form two offsprings with the features of the two parent chromosomes.
Single-point crossover (Deb, Pratap, and Agarwal 2002) is deployed in this algorithm. It consistsof three phases. In the first phase, the population is paired randomly. In the second phase, the cross-over point is chosen randomly. In the final phase, if the crossover probability, mc, is satisfied, theportions of the chromosomes lying to the right of the crossover point will be exchanged betweenpaired chromosomes to end the crossover process.
Let �f be the average fitness value of the population and f ′ be the larger one of the fitness values ofthe paired chromosomes to be crossed. Then the probability of crossover, mc, is calculated as:
mc = k1 × (fmax − f ′)(fmax − �f )
if f ′ . �f ,
mc = k3 if f ′ ≤ �f ,
(5)
where, as Srinivas and Patnaik suggested (1994), the values of k1 and k3 are kept equal to 1.0. Notethat when fmax = �f , we have f ′ = fmax and then mc will be equal to k3. This strategy will help toachieve a trade-off between exploration and exploitation. When f ′ becomes smaller, the value ofmc increases; this means the paired chromosomes are not appropriate solutions but they are morelikely to be crosseovered. On the contrary, when one of paired chromosomes is a good solution,mc will be low and thus the chromosome will have less probability to be distrupted.
3.1.6. MutationEach chromosome will undergo mutation with a fixed probability mm by randomly choosing a pos-ition on the chromosome. The mutation probability will be adaptive for each chromosome, as did in(Srinivas and Patnaik 1994). The formula to calculate the mutation probability mm is shown as:
mm = k2 × (fmax − f )
(fmax − �f )if f . �f ,
mm = k4 if f ≤ �f ,
(6)
where mm is the mutation probability, both k2 and k4 are equal to 0.5, fmax and �f are the same asdefined above, and f is the fitness of the chromosome under mutation.
If this mutation probability is too small, it will be difficult to generate new chromosomes. But if itis too large, the GA will degenerate to a random algorithm. Each time when �f converges to fmax,which means that clustering may converge to a sub-optimum, mm will be increased to make surethat the GA will not be stucked at the sub-optimal solution. To make sure the best chromosomeis retained to the next generation, mm and mc of the best chromosome with maximum fitness isset up to 0.
In order to ensure the best chromosome will not be destroyed, this algorithm uses an elitist strat-egy. Throughout the algorithm, a global variable Best is defined to store the current best chromo-some. The best chromosome is picked out in each generation and its fitness is compared withthat of the best chromosome (saved in the Best variable) in the previous generation. If the fitnessof the current best is better than that of the best in the previous generation, then the best in the
INTERNATIONAL JOURNAL OF DIGITAL EARTH 477

previous generation will be replaced by the current best chromosome. The Best variable, therefore,stores the final cluster centroids after the ParSymG is terminated. Based on the results of the Bestvariable, the master will generate the finally classified image and calculate the related validity indices.
3.2. Complexity analysis
The time complexity of ParSymG is analyzed as follows.
(1) Initialization
This phase consists of the population initialization and the image and chromosome partition. Thetotal time of initialization is given by Tinit = TpopInit + Tpartition. The time complexity of initializingthe population is O(popSize× clusterNum× Dimension). It is obvious thatTpopInit = O(Constant) and Tpartition = O(M), where M is the number of slaves.
(2) Assignment of points
For each slave, the size of the image block to be classified is calculated using the below formula:
�N = N × popSize/M, (7)where N = Width× Height is the size of image and M is the number of slaves.
In the process of point assignment, the minimum point symmetry distance to the center pointneeds to be computed. The kd-tree-based nearest neighbor search method can successfully reducethe complexity of computing the point symmetry distance from O(�N) down to O(log �N). So inorder to find the minimal point symmetry distance of a particular point, O(K log�N) time is needed.The total time complexity of assigning points becomes O(�NK log�N).
(3) Fitness and centroids update
In order to update fitness and centroids for the master classification, the intermediate values ofsumFitness and sumChromosome are calculated in each slave node. The time complexity of comput-ing sumFitness and sumChromosome are O(�NK log�N) and O(�N) based on formula (4) and formula(3), respectively.
The master will receive all sumFitness from the slaves and compute fitness using the formula (3).So the time complexity for updating fitness in the master will be O(M) for receiving sumFitness fromM slaves plus O(popSize) for summarizing the fitness popSize time (please notes that each chromo-some has one fitness value, so we need to iterate popSize times for popSize chromosomes). The mas-ter will receive all sumChromosome from the slaves and update the centroids using the formula (4).So the time complexity for updating the centroids in the master will be O(M) for receiving sumChro-mosome from the M slaves plus O(K × popSize) for summarizing popSize chromosomes and eachchromosome will have K centroids. So the time complexity for updating centroids and fitness areO (M + K × popSize) and O(M + popSize), respectively.
WhenM, K, and popSize are constants or much less than �N , in this stage the total time complexitywill be O(�NK log�N)+ O(�N)+ O(M + K × popSize)+ O(M + popSize) � O(�NK log�N).
(4) Selection, Crossover, and Mutation
These three steps of the ParSymG algorithm each require O( popSize× K × Dim) time.In each generation, therefore, the time complexity is O(�NK log�N) =O
(((N × popSize)/M)K log((N × popSize)/M)). For the max generationmaxIter, the total time com-plexity becomes O(maxIter × ((N × popSize)/M)K log((N × popSize)/M)). Because popSize and
478 Z. DU ET AL.

maxIter are constants, the total time complexity is equal to O((N/M)K log(N/M)). So the ParSymGalgorithm has the same time complexity as ParSym has, but has smaller time complexity than theGAPS algorithm (Bandyopadhyay and Saha 2007) has.
3.3. Validity indices
There are several ways to verify the unsuperived classification results of remotely sensed imageryusing the proposed ParSymG algorithm. For example, the clustering results of remotely sensed ima-gery can be verified via visual inspection. For another example, validity indices can be used to moreprecisely evaluate the classification results quantitatively. In this study, we used the Jm, XB, I , andSym indices to verify the remotely sensed image classification results.
The mean-squared error Jm (Bezdek 1981) is defined as
Jm =∑Kk=1
∑nkj=1
||xj − zk||2, (8)
where K is the number of clusters, nk is the number of points in kth cluster, and ||xj − zk||2 representsthe squared Euclidean distance between xj and its corresponding centroid zk. Because a smallerJmmeans a better solution, our algorithm aims to minimize the Jm index value for compact partitioning.
The XB index, which was defined by Xie and Beni(1991), is a fuzzy clutstering validity function. Itcan be used to measure the overall average compactness and separation of a cluster analysis. The XBindex is defined as:
XB =∑K
k=1
∑nj=1 u2kj||xj − zk||2
n mini,j||zi − zj||2, (9)
where ukj is the membership of the jth point to the kth cluster. If the jth point belongs to the kthcluster, ukj is equal to 1, otherwise, ukj is 0. mini,j||zi − zj||2 is the minimum squared Euclidean dis-tance between any paired cluster centers.
∑Kk=1
∑nj=1 u
2kj||xj − zk||2 is the sum of squared Euclidean
distances between point xj and the centroid zk of the kth cluster for all j and k.The proper partition of a data set means a lower
∑Kk=1
∑nj=1 u
2kj||xj − zk||2 and a higher
mini,j||zi − zj||2. Thereofore, a lower XB index indicates better clustering results.The index I, which was proposed in (Maulik and Bandyopadhyay 2002) as a unique validity
measurement for determing the degree of clustering goodness, does not require the true partitioninginformation and is mathematically formulated as:
I(K) = 1K× E1
EK× DK
( )p
, (10)
where K is the number of clusters, EK = ∑Kk=1
∑nj=1 ukjxj − xk andDK = maxi,j=1,...,K ‖zi − zj‖. E1 is
a constant to serve as a normalizing factor for a given data set, and EK denotes the degree of dis-persion between any paired clusters. DK is the maximum Euclidean distance between all possiblecluster centers. p is equal to 2 based on Bandyopadhyay and Maulik (2001). A larger value of theI index indicates better classification results.
The Sym index, which was inspired by the I-index and defined by Saha and Bandyopadhyay(2008), is defined as:
Sym(K) = 1K× 1
1K× DK , (11)
where 1/1K = 1/∑K
k=1 Ek is used to replace the factor E1/EK in I index, and Ek has a new definitionas Ek =
∑nkj=1 dps(xj, ck). The formula of Ek represents the total point symmetry distance between the
center of the kth cluster and all the points belonging to the cluster. Therefore, the Sym index is able to
INTERNATIONAL JOURNAL OF DIGITAL EARTH 479

indicate the presence of clusters with different sizes. A larger Sym index means better clusteringresults with symmetrical properties.
4. Case studies
The parallel algorithm ParSymG was implemented using MPI (Gropp et al. 1996) on a high-per-formance computing cluster with 30 computing nodes in this study. Each node has two Otca-core 3000 MHz AMD Opteron (TM) Processor 6220 processors with 32GB RAM and is intercon-nected with Infiniband of 40 Gb/s speed. All execution time data were obtained through MPI_W-time() function in seconds. The PKM and ParSym methods were also implemented for thecomparison purpose. The Jm, XB, I, and Sym validity indices were used to evaluate the effectivenessof the compared algorithms. The efficiency of ParSymG was also verified visually from the clusteredimages based on the ground truth land cover information.
4.1. Classification results
4.1.1. QuickBirdThe Quickbird satellite imagery, which is provided by US DigitalGlobe Company, is a commercialhigh-resolution optical satellite imagery with the maximum resolution of 0.61 m. Figure 1(a) showsthe original QuickBird image used in this study in true color with histogram equalization. TheQuickbird image includes a dock under construction, which belongs to the Beihai ShipbuildingHeavy Industry, in Jiaozhou Bay, Qingdao, Shandong Province, China. The image has four availablebands – red, green, blue, and near infrared bands. The size of the image is 400 × 400.
In Figure 1(a), there are many materials piled on the ground because the dock was under con-struction. These materials might have an impact on clustering classification due to their similar spec-tral reflectance properties. The Quickbird image was classified by PKM, ParSym, and ParSymG,respectively. Features in the image were classified into four categories: open space, ocean, steels(including ships and trestle; these steels have the same spectral reflectance as mud), and buildings.Figure 1(b–d) shows the classification results. We introduce some examples of the classificationresults in the following sections.
For example, the upper right corner of the image in Figure 1(a) is a shipyard warehouse. The roofstructure of the warehouse has an excellent symmetry shape. As shown in the classification results inFigure 1(b), PKM failed to recognize the specific details of the roof structure, which was classified asalmost a homogeneous area. From Figure 1(c and d), it can be seen that ParSym and ParSymG had abetter recognization of the symmetry of the roof structure by using the point symmetry distance, andboth methods retained the details of the roof structure.
For another example, as shown in the lower left corner of the Figure 1(a) image, there is a mooredvessel as well as makeshift trestle for constructing the port. From classification results in Figure 1(b–d), it can be seen that the PKM algorithm only extracted a part of the trestle while both the ParSymalgorithm and the ParSymG algorithm extracted the complete trestle with continuity, and that thevessel extracted by PKM appears fragmented while both ParSym and ParSymG have preferablyextracted the outline of the vessel.
Table 1 shows the calculated Jm, XB, I, and Sym indices for evaluating the classfication results ofthe Qingdao QuickBird image by the ParSym algorithm and the ParSymG algorithm. From the table,it can be seen that ParSymG has smaller Jm and XB values and larger I and Sym values compared withParSym. These results mean that the clustering effect of ParSymG is relatively better than that ofParSym.
4.1.2. Aerial imageThe UAV (Unmanned Aerial Vehicle) aerial image for the area of Guogezhuang village in Fangshandistrict of Beijing was chosen as experiment data. The image is available in three bands – blue, green,
480 Z. DU ET AL.

and red. The resolution of the image is 1 m, and the size is 400× 650 pixels. Figure 2 (a) shows theorginal aerial image in true color.
The image was classified into five classes: concrete (including roads and habitation), highlightobjects, crops, weed, and bare land. Figure 2 (b–d) shows the classified images by the PKM, ParSym,and ParSymG algorithms, respectively.
Compared to the orginal three road features in the red rectangle in the top of Figure 2(a), theclassified results by the PKM, ParSym, and ParSymG algorithms (Figure 2(b–d)) show that PKMdid not detect the three linear road features effectively, while ParSymG and ParSym extractedthem more successfully. All algorithms successfully identified the residential houses in the redoval in Figure 2(a), but it is obvious that the identified results by ParSymG have the most details.For the rows of buildings in the rectangule in the middle of the Figure 2(a) image, the clustered
Figure 1. Unsupervised classifications of the QuickBird image in Jiaozhou Bay: (a) the original QuickBird image in true color withhistogram equalization, (b) the classified image by PKM, (c) the classified image by ParSym, and (d) the classified image byParSymG.
Table 1. Validity indices of ParSym and ParSymG for the QuickBird image.
Qingdao QuickBird Jm XB I Sym
ParSym 63,277,780 0.08221867 110,405.6 0.006583216ParSymG 62,003,500 0.08055323 112,668.2 0.006646323
INTERNATIONAL JOURNAL OF DIGITAL EARTH 481
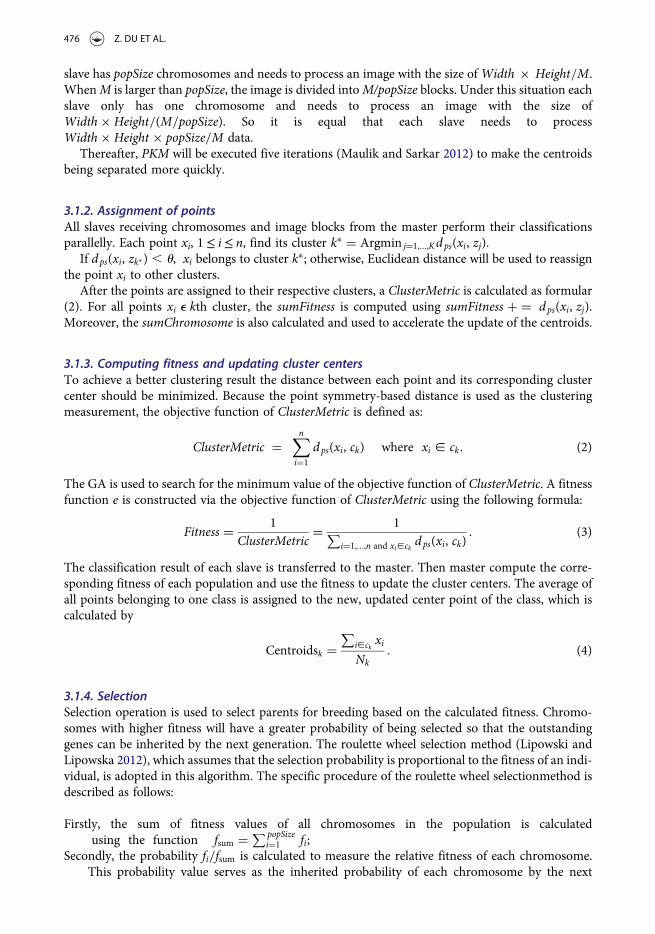
results by PKM (Figure 2(b)) are very fragmented and messy, certainly not suitable to be used as thebasis for further image segmentation. However, the clustered results by ParSymG and ParSym arerelatively better and ParSymG provides the clearest results. In the middle right area of Figure 2, Par-Sym and ParSymG successfully extracted the bare land with cross structure while PKM classified it asconcrete.
The quantitative Jm, XB, I, and Sym indices calculated from the classified Beijing aerial image bythe ParSym and ParSymG algorithms are shown in Table 2. The smaller Jm value from the classifiedimage by ParSymG indicates that ParSymG performed better than ParSym. The smaller XB valuefrom the classified image by ParSymG further confirms that ParSymG is relatively superior to Par-Sym. A larger I value indicates a better classification, so the larger I value produced by ParSymG alsoindicates that ParSymG performed better than ParSym. However, the Sym values indicate the con-trary, that is, ParSym performed better than ParSymG. In fact, ParSym is more suitable for imageswith large-scale symmetric land cover objects, but ParSymG, due to the image partition operation,performed better in keeping partial symmetry while it might fail in keeping large-scale symmetry.
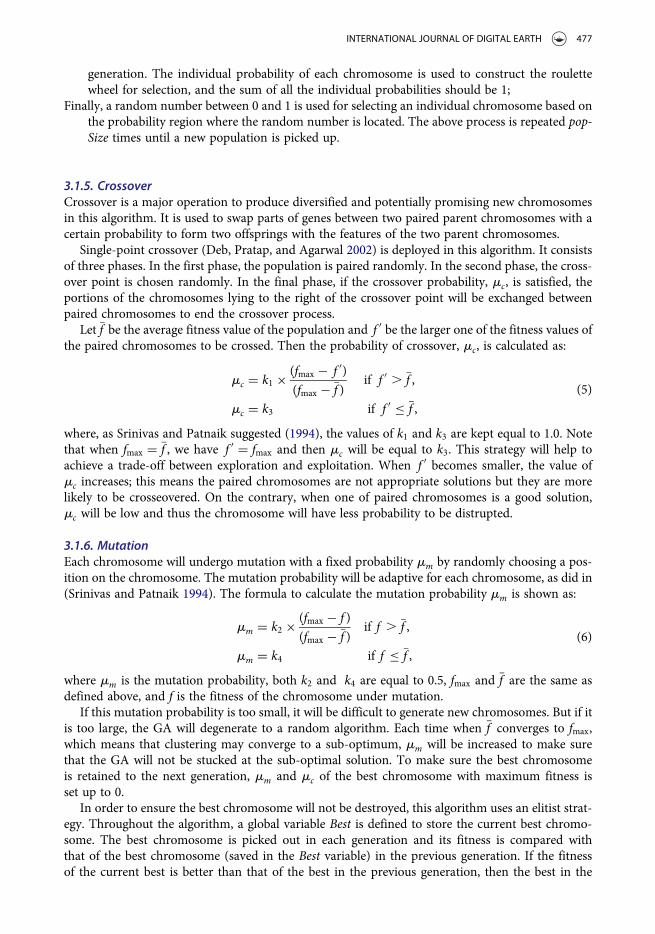
4.1.3. GF-1 (GaoFen-1)GF-1 is a high-resolution remote sensing satellite launched by China on 26 April 2013. The GF-1satellite provides 2 m panchromatic resolution and 8 m multi-spectral resolution image data.A GF-1 image of Hangzhou with four bands (blue, green, red, and near infrared bands) photo-graphed on 21 November 2014 was used in this case study. The image has a size of 1270× 1940 pix-els and a resolution of 8 m. Figure 3(a) shows the orginal GF-1 image in true color with histogramequalization. The Qiantang River cuts through the image. The left side of the river is the West LakeDistrict, where the world-famous West Lake is located. The right part of the image is the BinjiangDistrict. There are four bridges across the section of the Qiantang River within the area of theimage, including Xixin Bridge, Fuxing Bridge, Qiantang River Bridge, and Zhijiang Bridge. Theimage was classified into seven classes – pond water, river, concrete (including habitation, roads,
Figure 2. Unsupervised classifications of the aerial image for an area in Fangshan District, Beijing: (a) the original aerial image intrue color; (b) the classified image by PKM; (c) the classified image by ParSym; (d) the classified image by ParSymG.
Table 2. Validity indices of ParSym and ParSymG Algorithms for the classifiedaerial image for an area in Beijing.
Index ParSym ParSymG
Jm 105,728,200 94,710,980XB 0.1504358 0.1460235I 21,628.35 22,568.36Sym 0.004048568 0.003920936
482 Z. DU ET AL.
and bridges), light-colored vegetation, dark-colored vegetation, clouds (including highlightbuildings), and red brick buildings.
An important observation from the experiment is that the mountain area near the West Lake inthe red oval in Figure 3(a) has different spectral reflectances in different places, probably due todifferent angles of sunlight directions. The PKM algorithm classified almost the whole mountainousarea into one class, while the ParSym and ParSymG algorithms distinguished the vegetation intodifferent classes with different spectral reflectances caused by different angles of sunlight directions.Figure 3 also shows that PKM failed to differentiate pond water from concrete (see the city area in theupper-middle area of the image), while these two classes were correctly clasffied by ParSym and Par-SymG. Figure 4(b–d) shows the classified images obtained by PKM, ParSym, and ParSymG
Figure 3. Unsupervised classifications of the GF-1 image of Hangzhou: (a) the original GF-1 image of Hangzhou in true color withhistogram equalization, (b) the classified image by PKM, (c) the classified image by ParSym, and (d) the classified image byParSymG.
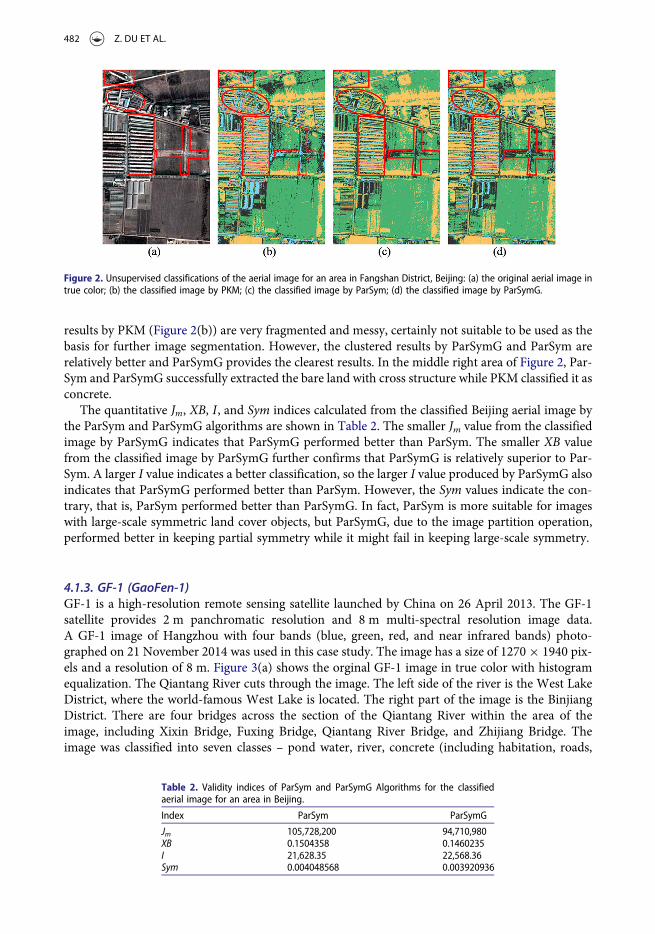
Figure 4. Unsupervised classifications of the GF-1 image of Binjiang District: (a) The original GF-1 image of Binjiang District in truecolor with histogram equalization, (b) The classified image by PKM, (c) The classified image by ParSym, and (d) The classified imageby ParSymG.
INTERNATIONAL JOURNAL OF DIGITAL EARTH 483
algorithms, respectively. As shown in Figure 4(a and b), because the Qiantang River Bridge is toovague, the PKM algorithm failed to recognize the bridge and incorrectly classified it into the riverclass (Figure 4(b) in red oval). However, both the ParSym algorithm and the ParSymG algorithmdetected the bridge accurately. Moreover, as shown in the red frames in Figure 4, the proposed algor-ithm ParSymG is more effective than PKM in recognizing several major roads in Binjiang district,such as Jiangnan Avenue and Caihong Expressway. ParSym classified the small blue patchesalong the rightside bank of the river as pond water due to the shadow of building while ParSymGclassified those areas as concrete (buildings).
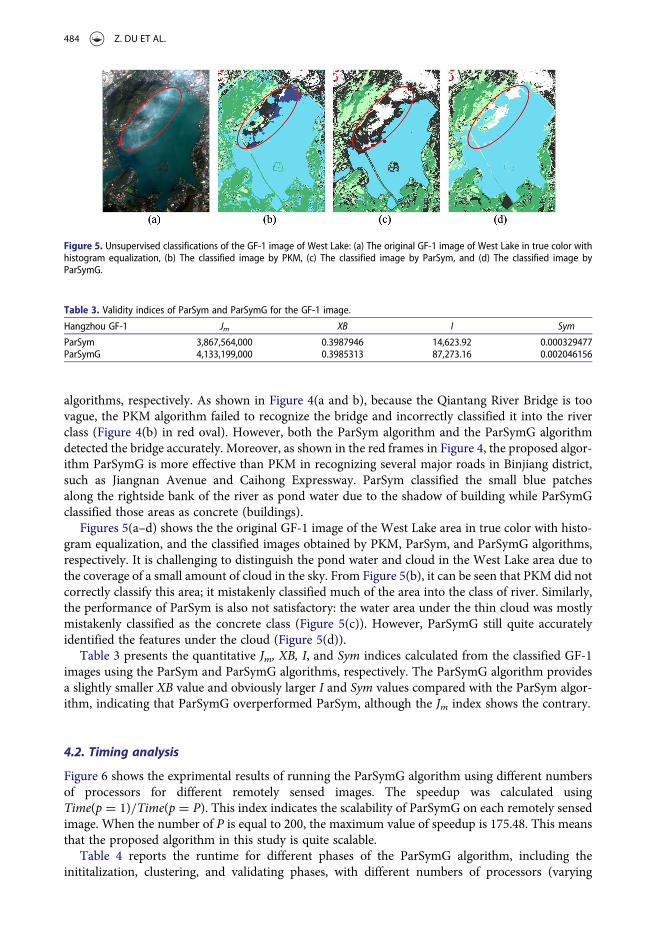
Figures 5(a–d) shows the the original GF-1 image of the West Lake area in true color with histo-gram equalization, and the classified images obtained by PKM, ParSym, and ParSymG algorithms,respectively. It is challenging to distinguish the pond water and cloud in the West Lake area due tothe coverage of a small amount of cloud in the sky. From Figure 5(b), it can be seen that PKM did notcorrectly classify this area; it mistakenly classified much of the area into the class of river. Similarly,the performance of ParSym is also not satisfactory: the water area under the thin cloud was mostlymistakenly classified as the concrete class (Figure 5(c)). However, ParSymG still quite accuratelyidentified the features under the cloud (Figure 5(d)).
Table 3 presents the quantitative Jm, XB, I, and Sym indices calculated from the classified GF-1images using the ParSym and ParSymG algorithms, respectively. The ParSymG algorithm providesa slightly smaller XB value and obviously larger I and Sym values compared with the ParSym algor-ithm, indicating that ParSymG overperformed ParSym, although the Jm index shows the contrary.
4.2. Timing analysis
Figure 6 shows the exprimental results of running the ParSymG algorithm using different numbersof processors for different remotely sensed images. The speedup was calculated usingTime(p = 1)/Time(p = P). This index indicates the scalability of ParSymG on each remotely sensedimage. When the number of P is equal to 200, the maximum value of speedup is 175.48. This meansthat the proposed algorithm in this study is quite scalable.
Table 4 reports the runtime for different phases of the ParSymG algorithm, including theinititalization, clustering, and validating phases, with different numbers of processors (varying
Figure 5. Unsupervised classifications of the GF-1 image of West Lake: (a) The original GF-1 image of West Lake in true color withhistogram equalization, (b) The classified image by PKM, (c) The classified image by ParSym, and (d) The classified image byParSymG.
Table 3. Validity indices of ParSym and ParSymG for the GF-1 image.
Hangzhou GF-1 Jm XB I Sym
ParSym 3,867,564,000 0.3987946 14,623.92 0.000329477ParSymG 4,133,199,000 0.3985313 87,273.16 0.002046156
484 Z. DU ET AL.

from 1 to 200) and for different images. Time gain (TG) is defined asTG = ((Time(p = 1)− Time(p = P))/Time(p = 1))× 100%, which indicates the percentage oftime gain with increasing number of processors. TG data in Table 4 are in the range of 86.47–99.33% for QuickBird, 84.76–99.43% for Aerial, and 84.83–99.37% for GF-1, demonstrating thehigh time efficiency of the ParSymG algorithm. In the inititalization phase, due to the partitionand allocation operations of the images, the initialization runtime increases with increasing numberof processors; but this phase only accounts for a very small portion of the total time. In the phase ofclustering, which spends the majority of the total runtime, the runtime decreases linearly in accord-ance with the increase of the number of processors, reflecting good scalability of the algorithm. In thevalidating phase, the runtime, which is negligible, does not change much with the changes of thenumber of processors. This is because only the master was in charge of quantitatively validatingthe clustering results and generating the classified image.
Table 5 shows improvement in the runtime of the PKM, ParSym, ParSymG algorithms withdifferent numbers of processors for the Qingdao QucikBird image, the Beijing Aerial image, and
Figure 6. Scalability of the ParSymG algorithm with increasing number of processors.
Table 4. Time spent for different phases of ParSymG for the QuickBird image, the Aerial image, and the GF-1 image.
Data P
Execution time (seconds)
SpeedUp TG%Inititalization Clustering Validating Total
QuickBird 1 0.153 1226.310 0.010 1226.470 1.00 0.0010 0.207 165.714 0.012 165.932 7.39 86.4720 0.211 79.805 0.011 80.028 15.33 93.4750 0.272 32.958 0.011 33.242 36.90 97.29100 0.271 14.881 0.011 15.163 80.88 98.76200 0.423 7.841 0.011 8.274 148.22 99.33
Aerial Image 1 0.274 2612.840 0.026 2613.140 1.00 0.0010 0.315 397.925 0.026 398.266 6.56 84.7620 0.332 200.672 0.028 201.032 13.00 92.3150 0.354 66.015 0.028 66.397 39.36 97.46100 0.440 28.210 0.028 28.678 91.12 98.90200 0.672 14.160 0.029 14.861 175.84 99.43
GF-1 1 4.179 89,608.400 0.154 89,612.733 1.00 0.0010 4.425 13,588.900 0.153 13,593.478 6.59 84.8320 5.624 5888.730 0.149 5894.503 15.20 93.4250 6.496 2554.820 0.296 2561.612 34.98 97.14100 7.664 1204.230 0.260 1212.154 73.93 98.65200 8.781 555.174 0.274 564.229 158.82 99.37
INTERNATIONAL JOURNAL OF DIGITAL EARTH 485

the Hangzhou GF-1 image, respectively. The speedup of PKM is limited, especially for small images.The speedup of ParSym increases greatly with increasing number of processors, showing the greatvalue of using a number of processors. ParSymG achieved the largest speedup, ranging from 7.39to 148.22, 6.56 to 175.84, and 6.59 to 158.82 for the three different images, with increasing numberof processors. Apparently, the runtime for both parallel algorithms (ParSym and ParSymG) are sig-nificantly reduced with the increase of the processor number until the communication overheadarises. As for the different increases in speedup, ParSymG needs more calculation than ParSym inthe master (including centroids updating, selection, crossover, and mutation), which means thespeedup of ParSymG is not as good as ParSym when the number of slaves is relatively small. Butwhen the number of slaves is large and the calculation time in the master is fixed, the speedup ofParSymG will be greatly increased. It also can be seen that ParSym is more scalable than ParSymGwhen P is relatively small. In general, the number of processors or the size of image may cause thedifference between the speedup of ParSymG and ParSym. In the experiments, the three images havedifferent sizes and the speedup of ParSymG and ParSym increased almost in the same way, whichrules out the influence of image size. So we consider that ParSymG has a bigger speedup whenthe number of processors is larger than 50. However, with the increase of P, the scalablity of Par-SymG is much better than ParSym. As for PKM, when P is larger than 100, the increase in communi-cation time is larger than the reduction in clustering time. The clustering procedure of PKM issimpler than those of ParSym and ParSymG. When the communication time is fixed, PKM hasless speedup than ParSym and ParSymG. In general, the proposed ParSymG algorithm shows excel-lent scalability in parallel execution.
5. Conclusions
In this article, we proposed an efficient and scalable parallel point symmetry-based genetic clusteringalgorithm (ParSymG) for unsupervised classification of remotely sensed imagery. This parallel algor-ithm not only can realize local optimization that traditional unsupervised classification algorithmssuch as K-means cannot, but also can greatly reduce the runtime of the classification procedure.The use of both point symmetry-based distance and Euclidean distance makes the algorithm capableof identifying various types and shapes of land cover classes more accurately, especially when theland cover objects possess a high degree of symmetry.
The experimental results obtained from unsupervised classifications of three different types ofremotely sensed images show that the proposed ParSymG algorithm is effective and can obviouslyreduce classification time. The speedup and TG restuls prove the scalability of ParSymG, while theefficiency of the PKM algorithm even decreases when the increase in the number of processors can-not compensate the increase in communication time. In general, case studies indicated that Par-SymG is much better than PKM and to some extent also outperformed ParSym, not only inefficiency and scalability but also in detecting the symmetric-shaped clusters in remotely sensedimages.
Conflicted results reported by the Sym index for the second image and by the Jm index for thethird image imply that ParSymG has some limitations in correctly classifying land cover classes
Table 5. Speedup comparision among PKM, ParySym, and ParSymG using different numbers of processors.
Processors
PKM ParSym ParSymG
QB Aerial GF-1 QB Aerial GF-1 QB Aerial GF-1
P = 1 1.00 1.00 1.00 1.00 1.00 1.00 1.00 1.00 1.00P = 10 4.49 6.01 5.41 9.28 10.48 9.27 7.39 6.56 6.59P = 20 5.80 8.14 7.13 21.89 21.71 18.72 15.33 13.00 15.20P = 50 6.01 9.98 9.33 31.29 43.94 45.75 36.90 39.36 34.98P = 100 0.67 1.48 9.97 38.85 64.11 75.50 80.88 91.12 73.93P = 200 0.65 1.40 10.36 58.75 92.05 124.97 148.22 175.84 158.82
486 Z. DU ET AL.

with large-scale symmetric objects, compared with ParSym. This should be caused by the image par-tition operation, and might be overcomed by an optimized image partition strategy. Future work willbe focused on developing an optimized image partition strategy to overcome the classification pro-blem with large-scale symmetric objects. To conduct a more time-efficient image classification, wewill further develop the ParSymG algorithm to make full use of distributed-memory parallel clusters(LaSalle and Karypis 2014; Szalkowski and Stpiczynski 2015). In our future study, considering thatthe ParSymG algorithm has the capability of extracting symmetrical features, we would also like toimprove the algorithm for accurate recognization of highways (Niu 2006; Zhang and Lin 2013; Yinet al. 2015) in the shape of a narrow and long belt in our future study. For some recently proposedevolutionary computation-based clustering methods (Zhong, Ma, and Zhang 2014; Ma, Zhong, andZhang 2016), we may use the validation index I and the point symmetry-based distance for vali-dation of clustering results or evolutionary objective functions to obtain a better classification result.In order to improve the efficiency of the evolutionary computation methods, we may adjust thethree-phase speedup strategy to parallelize some of the recently proposed fuzzy clustering algorithmson remotely sensed imagery (Zhong, Zhang, and Zhang 2013; Ma, Zhong, and Zhang 2015).
Disclosure statement
No potential conflict of interest was reported by the authors.
Funding
This work was supported by the National Natural Science Foundation of China [grant number 41471313], [grant num-ber 41101356], [grant number 41671391]; the Fundamental Research Funds for the Central Universities [grant num-ber 2016XZZX004-02]; the Science and Technology Project of Zhejiang Province [grant number 2015C33021], [grantnumber 2013C33051]; Major Program of China High Resolution Earth Observation System [grant number 07-Y30B10-9001].
ORCiD
Yuhua Gu http://orcid.org/0000-0002-8707-8200Feng Zhang http://orcid.org/0000-0003-1475-8480Renyi Liu http://orcid.org/0000-0003-4001-4266
References
Almeida, Francisco, Daniel González, and Luz Marina Moreno. 2006. “The Master–Slave Paradigm on HeterogeneousSystems: A Dynamic Programming Approach for the Optimal Mapping.” Journal of Systems Architecture 52 (2):105–116.
Bandyopadhyay, Sanghamitra, and Ujjwal Maulik. 2001. “Nonparametric Genetic Clustering: Comparison of ValidityIndices.” Systems, Man, and Cybernetics, Part C: Applications and Reviews, IEEE Transactions on 31 (1): 120–125.
Bandyopadhyay, Sanghamitra, and Sriparna Saha. 2007. “GAPS: A Clustering Method Using a New Point Symmetry-based Distance Measure.” Pattern Recognition 40 (12): 3430–3451.
Bao, Ying, Qingjiu Tian, Min Chen, and Hui Lin. 2015. “An Automatic Extraction Method for Individual Tree CrownsBased on Self-adaptive Mutual Information and Tile Computing.” International Journal of Digital Earth 8 (6): 495–516.
Beaumont, Olivier, Arnaud Legrand, and Yves Robert. 2003. “The Master-Slave Paradigm with HeterogeneousProcessors.” Parallel and Distributed Systems, IEEE Transactions on 14 (9): 897–908.
Bezdek, James C. 1981. Pattern Recognition with Fuzzy Objective Function Algorithms. Dordrecht: Kluwer Academic.Chou, Chien-Hsing, Mu-Chun Su, and Eugene Lai. 2002. “Symmetry as a New Measure for Cluster Validity.” Paper
presented at the 2nd WSEAS Int. Conf. on Scientific Computation and Soft Computing.Craglia, Max, Kees de Bie, Davina Jackson, Martino Pesaresi, Gábor Remetey-Fülöpp, Changlin Wang, Alessandro
Annoni, Ling Bian, Fred Campbell, and Manfred Ehlers. 2012. “Digital Earth 2020: Towards the Vision for theNext Decade.” International Journal of Digital Earth 5 (1): 4–21.
Davis, Lawrence. 1991. Handbook of Genetic Algorithms. Vol. 115. New York: Van Nostrand Reinhold.
INTERNATIONAL JOURNAL OF DIGITAL EARTH 487
Deb, Kalyanmoy, Amrit Pratap, Sameer Agarwal, and TAMT Meyarivan. 2002. “A Fast and Elitist MultiobjectiveGenetic Algorithm: NSGA-II.” Evolutionary Computation, IEEE Transactions on 6 (2): 182–197.
Goodall, T., D. Pettinger, and G. Di Fatta. 2013. “Non-uniform Data Distribution for Communication-efficient ParallelClustering.” Journal of Computational Science 4 (6): 489–495. doi:10.1016/j.jocs.2013.01.007.
Goodchild, Michael F., Huadong Guo, Alessandro Annoni, Ling Bian, Kees de Bie, Frederick Campbell, Max Craglia,Manfred Ehlers, John van Genderen, and Davina Jackson. 2012. “Next-generation Digital Earth.” Proceedings of theNational Academy of Sciences 109 (28): 11088–11094.
Gropp, William, Ewing Lusk, Nathan Doss, and Anthony Skjellum. 1996. “A High-performance, PortableImplementation of the MPI Message Passing Interface Standard.” Parallel Computing 22 (6): 789–828.
Guo, Huadong. 2014. “Digital Earth: Big Earth Data.” International Journal of Digital Earth 7 (1): 1–2.Hadian, A., and S. Shahrivari. 2014. “High Performance Parallel-means Clustering for Disk-resident Datasets on
Multi-core CPUs.” Journal of Supercomputing 69 (2): 845–863. doi:10.1007/s11227-014-1185-y.Huadong, Guo. 2016. “Digital Earth and Future Earth.” International Journal of Digital Earth 9 (1): 1–2. doi:10.1080/
17538947.2015.1135667.Huang, Xiaohui, Yunming Ye, Huifeng Guo, Yi Cai, Haijun Zhang, and Yan Li. 2014. “DSKmeans: A New Kmeans-
type Approach to Discriminative Subspace Clustering.” Knowledge-Based Systems 70: 293–300.Jain, Anil K., Robert PW Duin, and Jianchang Mao. 2000. “Statistical Pattern Recognition: A Review.” IEEE
Transactions on Pattern Analysis and Machine Intelligence 22 (1): 4–37.Jain, Anil K., M Narasimha Murty, and Patrick J. Flynn. 1999. “Data Clustering: A Review.” ACM Computing Surveys
(CSUR) 31 (3): 264–323.Kantabutra, Sanpawat, and Alva L. Couch. 2000. “Parallel K-means Clustering Algorithm on NOWs.” NECTEC
Technical Journal 1 (6): 243–247.Kaufman, Leonard, and Peter J. Rousseeuw. 2009. Finding Groups in Data: An Introduction to Cluster Analysis. Vol.
344. Hoboken: John Wiley & Sons.Krishna, K., and M Narasimha Murty. 1999. “Genetic K-means Algorithm.” Systems, Man, and Cybernetics, Part B:
Cybernetics, IEEE Transactions on 29 (3): 433–439.Kumar, A., M. Kiran, B. R. Prathap, and IEEE. 2013. “Verification and Validation of MapReduce Program Model for
Parallel K-Means Algorithm on Hadoop Cluster.” 2013 Fourth International Conference on Computing,Communications and Networking Technologies (Icccnt).
LaSalle, D., and G. Karypis. 2014. “MPI for Big Data: New Tricks for an Old Dog.” Parallel Computing 40 (10): 754–767. doi:10.1016/j.parco.2014.07.003.
Lin, Chao, Yan Yang, and Tonny Rutayisire. 2011. “A Parallel Cop-Kmeans Clustering Algorithm Based onMapReduce framework.” In Knowledge Engineering and Management: Proceedings of the Sixth InternationalConference on Intelligent Systems and Knowledge Engineering, Shanghai, China, Dec 2011 (ISKE2011), edited byYinglin Wang and Tianrui Li, 93–102. Berlin: Springer Berlin Heidelberg.
Lipowski, Adam, and Dorota Lipowska. 2012. “Roulette-wheel Selection via Stochastic Acceptance.” Physica A:Statistical Mechanics and its Applications 391 (6): 2193–2196.
Liu, Chien-Liang, Tao-Hsing Chang, and Hsuan-Hsun Li. 2013. “Clustering Documents with Labeled and UnlabeledDocuments using Fuzzy Semi-Kmeans.” Fuzzy Sets and Systems 221: 48–64.
Liu, Jia, Dustin Feld, Yong Xue, Jochen Garcke, Thomas Soddemann, and Peiyuan Pan. 2016. “An EfficientGeosciences Workflow on Multi-core Processors and GPUs: A Case Study for Aerosol Optical Depth Retrievalfrom MODIS Satellite data.” International Journal of Digital Earth 9 (12): 1–18.
Lu, Yi, Shiyong Lu, Farshad Fotouhi, Youping Deng, and Susan J. Brown. 2004a. “FGKA: A Fast Genetic K-means Clustering Algorithm.” Paper presented at the Proceedings of the 2004 ACM symposium on Appliedcomputing.
Lu, Yi, Shiyong Lu, Farshad Fotouhi, Youping Deng, and Susan J. Brown. 2004b. “Incremental Genetic K-meansAlgorithm and its Application in Gene Expression Data Analysis.” BMC Bioinformatics 5 (1): 172.
Ma, Ailong, Yanfei Zhong, and Liangpei Zhang. 2015. “Adaptive Multiobjective Memetic Fuzzy Clustering Algorithmfor Remote Sensing Imagery.” IEEE Transactions on Geoscience and Remote Sensing 53 (8): 4202–4217.
Ma, Ailong, Yanfei Zhong, and Liangpei Zhang. 2016. “Spectral-spatial Clustering with a Local Weight ParameterDetermination Method for Remote Sensing Imagery.” Remote Sensing 8 (2): 124.
Maulik, Ujjwal, and Sanghamitra Bandyopadhyay. 2002. “Performance Evaluation of Some Clustering Algorithms andValidity Indices.” IEEE Transactions on Pattern Analysis and Machine Intelligence 24 (12): 1650–1654.
Maulik, Ujjwal, and Anasua Sarkar. 2012. “Efficient Parallel Algorithm for Pixel Classification in Remote SensingImagery.” Geoinformatica 16 (2): 391–407.
Niu, X. T. 2006. “A Semi-automatic Framework for Highway Extraction and Vehicle Detection Based on a GeometricDeformable Model.” ISPRS Journal of Photogrammetry and Remote Sensing 61 (3–4): 170–186. doi:10.1016/j.isprsjprs.2006.08.004.
Pal, Nikhil R., and Sankar K. Pal. 1993. “A Review on Image Segmentation Techniques.” Pattern Recognition 26 (9):1277–1294.
488 Z. DU ET AL.

Qiao, Cheng, Jinfei Wang, Jiali Shang, and Bahram Daneshfar. 2015. “Spatial Relationship-assisted Classification fromHigh-resolution Remote Sensing Imagery.” International Journal of Digital Earth 8 (9): 710–726.
Rodrigues, Laerte M., Luis E. Zárate, Cristiane N. Nobre, and Henrique C. Freitas. 2012. “Parallel and DistributedKmeans to Identify the Translation Initiation Site of Proteins.” Paper presented at the 2012 IEEE InternationalConference on Systems, Man, and Cybernetics (SMC).
Saha, Sriparna, and Sanghamitra Bandyopadhyay. 2008. “Application of a New Symmetry-based Cluster ValidityIndex for Satellite Image Segmentation.” Geoscience and Remote Sensing Letters IEEE 5 (2): 166–170.
Sarkar, Anasua, and Ujjwal Maulik. 2009. “Parallel Point Symmetry Based Clustering for Gene Microarray Data.”Paper presented at the Seventh International Conference on Advances in Pattern Recognition, 2009. ICAPR’09.
Shi, Xuan, Miaoqing Huang, Haihang You, Chenggang Lai, and Zhong Chen. 2014. “Unsupervised ImageClassification over Supercomputers Kraken, Keeneland and Beacon.” GIScience & Remote Sensing 51 (3): 321–338.
Srikanth, Radhakrishnan, Roy George, N. Warsi, Dev Prabhu, Frederick E. Petry, and Bill P. Buckles. 1995. “AVariable-length Genetic Algorithm for Clustering and Classification.” Pattern Recognition Letters 16 (8): 789–800.
Srinivas, M., and Lalit M. Patnaik. 1994. “Adaptive Probabilities of Crossover and Mutation in Genetic Algorithms.”IEEE Transactions on Systems, Man and Cybernetics 24 (4): 656–667.
Su, Mu-Chun, and Chien-Hsing Chou. 2001. “A Modified Version of the K-means Algorithm with a Distance Basedon Cluster Symmetry.” IEEE Transactions on Pattern Analysis and Machine Intelligence 23 (6): 674–680.
Sun, Z. Q., G. Fox, W. D. Gu, and Z. Li. 2014. “A Parallel Clustering Method Combined Information BottleneckTheory and Centroid-based Clustering.” Journal of Supercomputing 69 (1): 452–467. doi:10.1007/s11227-014-1174-1.
Szalkowski, D., and P. Stpiczynski. 2015. “Using Distributed Memory Parallel Computers and GPU Clusters forMultidimensional Monte Carlo Integration.” Concurrency and Computation-Practice & Experience 27 (4): 923–936. doi:10.1002/cpe.3365.
Xie, Xuanli Lisa, and Gerardo Beni. 1991. “A Validity Measure for Fuzzy Clustering.” IEEE Transactions on PatternAnalysis and Machine Intelligence 13 (8): 841–847.
Yang, Chaowei, Michael Goodchild, Qunying Huang, Doug Nebert, Robert Raskin, Yan Xu, Myra Bambacus, andDaniel Fay. 2011. “Spatial Cloud Computing: How Can the Geospatial Sciences Use and Help Shape CloudComputing?” International Journal of Digital Earth 4 (4): 305–329.
Yang, Yan, Wei Tan, Tianrui Li, and Da Ruan. 2012. “Consensus Clustering Based on Constrained Self-organizingMap and Improved Cop-Kmeans Ensemble in Intelligent Decision Support Systems.” Knowledge-Based Systems32: 101–115.
Yin, Dandong, Shihong Du, Shaowen Wang, and Zhou Guo. 2015. “A Direction-Guided Ant Colony OptimizationMethod for Extraction of Urban Road Information from Very-High-Resolution Images.” IEEE Journal ofSelected Topics in Applied Earth Observations and Remote Sensing 8 (10): 4785–4794. doi:10.1109/JSTARS.2015.2477097.
Zhang, J. X., and X. G. Lin. 2013. “Semi-Automatic Extraction of Straight Roads from Very High Resolution RemotelySensed Imagery by a Fusion Method.” Sensor Letters 11 (6–7): 1229–1235. doi:10.1166/sl.2013.2846.
Zhang, Jing, Gongqing Wu, Xuegang Hu, Shiying Li, and Shuilong Hao. 2011. “A Parallel K-means ClusteringAlgorithm with mpi.” Paper presented at the 2011 Fourth International Symposium on Parallel Architectures,Algorithms and Programming (PAAP).
Zhang, Yufang, Zhongyang Xiong, Jiali Mao, and Lingo Ou. 2006. “The Study of Parallel K-Means Algorithm.” Paperpresented at the WCICA 2006. The Sixth World Congress on Intelligent Control and Automation, 2006.
Zhong, Yanfei, Ailong Ma, and Liangpei Zhang. 2014. “An Adaptive Memetic Fuzzy Clustering Algorithm with SpatialInformation for Remote Sensing Imagery.” IEEE Journal of Selected Topics in Applied Earth Observations andRemote Sensing 7 (4): 1235–1248.
Zhong, Yanfei, Shuai Zhang, and Liangpei Zhang. 2013. “Automatic Fuzzy Clustering Based on Adaptive Multi-objec-tive Differential Evolution for Remote Sensing Imagery.” IEEE Journal of Selected Topics in Applied EarthObservations and Remote Sensing 6 (5): 2290–2301.
INTERNATIONAL JOURNAL OF DIGITAL EARTH 489