parliamentary studies centre - anu€¦ · parliamentary studies centre, ... on committee reports...
TRANSCRIPT

PAR
LIAM
ENTA
RY
STU
DIES
PAP
ER 11
OF ECONOMICS AND GOVERN-
A Statistical Analysis of Government Responses to Committee Reports:Reports Tabled between the 2001 and 2004 Elections
David Monk
PARLIAMENTARY STUDIES CENTRECRAWFORD SCHOOL OF ECONOMICS AND GOVERNMENT
www.parliamentarystudies.anu.edu.au
ANU COLLEGE OF ASIA & THE PACIFIC

About the PArliAmentAry StudieS Centre
The Parliamentary Studies Centre is devoted to furthering academic research into parliamentary institutions, structures and processes, with a particular emphasis on comparative studies. The Centre operates as a research broker or facilitator, as distinct from a stand-alone research entity. Funding is sought for researchers who are already well placed to carry out relevant research, thereby minimising organisational overheads.
The Centre was established by the Policy and Governance Program in the Crawford School of Economics and Government and the Political Science Program, Research School of Social Sciences at the Australian National University. In 2007, the Centre began a three-year project entitled “Strengthening Parliamentary Institutions”, funded through an Australian Research Council linkage grant and co-sponsored by the Department of the Senate and the House of Representatives, Commonwealth Parliament of Australia. The research consists of case studies of aspects of the Australian Parliament and comparative studies of institutional strengthening in legislatures elsewhere in Australia and overseas.
The Centre welcomes expressions of interest from researchers seeking advice or assistance with academic research in parliamentary studies, including those interested in participating in the current project on strengthening parliamentary institutions.
This paper can be cited as: Monk, David (2009), ‘A statistical analysis of government responses to committee reports:reports tabled between the 2001 and 2004 elections’, Parliamentary Studies Paper 11, Crawford School of Economics and Government, Australian National University, Canberra.
About the Author
David Monk is Director, Executive and Committee Support, at the Department of the House of Representatives in Canberra. He has worked for a number of parliamentary committees and central government agencies in New South Wales and Canberra. He is currently undertaking a doctorate in political science at the Australian National University.
This paper may be read in conjunction with Parliamentary Studies Paper 10 by David Monk, which describes the rationale for the approach adopted here. Readers with a particular interest in the topic are also encouraged to review the dataset on which this paper is based. Both are available on the Parliamentary Studies Centre website; see http://www.parliamentarystudies.anu.edu.au/publications.php.
© Crawford School of Economics and Government, The Australian National University 2009.
ISSN [online] 1835-4831
The views expressed are those of the individual authors and are not necessarily those of the Crawford School of Economics and Government, The Australian National University.

PARLIAMENTARY STUDIES PAPER 11Parliamentary Studies Centre, Crawford School of Economics and Government,
ANU College of Asia & the Pacific, The Australian National University
This paper measures government acceptance of parliamentary committee recommendations. This is one way in which a committee can demonstrate its effectiveness. Of the reports in our sample recom-mending new action by the government, 60.0 per cent demonstrated a minimum level of effectiveness in that at least one of their recommendations was accepted. The most important factors correlated with a report’s effectiveness were the type of commit-tee, the type of inquiry, the level of bipartisanship, the level of press coverage and whether a majority report contained recommendations.
introduCtion
The requirement for governments to respond to committee reports has existed since the 1970s. The Senate set up its extended committee system in 1970, and in 1973 passed a resolution requiring the government to respond to Senate committee rec-ommendations within three months.1 In 1978, the government declared that it would respond to all committee reports within six months, effectively extending the Senate system to the House of Rep-resentatives and joint committees. This period was reduced to three months in 1983.2 In most cases, the government response takes the form of a document tabled in the relevant chamber(s). For bill inquiries, the practice is for the relevant minister to comment on committee reports during debate on the bill. These comments tend to be briefer than the tabled written responses.
A government response is a significant milestone in the life of an inquiry. In it, the government usu-ally lists what action it plans to take, or has taken, with respect to each recommendation. Where the government rejects a recommendation, it will often
state the reasons. The House of Representatives Standing Committee on Procedure has noted the importance of a government response, stating that, without some indication that the government has at least seriously considered the recommendations in a report, then ‘The value of the activity becomes questionable’.3
As I suggest in the companion paper to this one,4 because committees are political entities operating in a political environment, it seems fair to evaluate them according to how various groups react subjec-tively to their reports. One way of measuring how the government perceives a report is to calculate the number of recommendations it agrees to implement. This is not a perfect measure, because in practice the government may not meet its commitments. As an approximation or ‘proxy’ of the government’s per-ception, however, it can be considered a reasonable measure of a report’s effectiveness.
Committee reports have various aims and there are a number of diverse groups in the political sys-tem. Therefore, it seems fair to view the government response as just one way among many in which committees can demonstrate their effectiveness. If other groups, such as stakeholders, voters or the leg-islature, respond favourably to a committee report, then the lack of a government response should not prevent that report from being considered effective. In other words, a positive government response is a sufficient, but not necessary, way for committees to demonstrate their effectiveness.
ColleCtinG the dAtA
Notwithstanding the three-month requirement, governments have sometimes taken over three years to draft and table a response to a committee report.
A Statistical Analysis of Government Responses to Committee Reports:
Reports Tabled between the 2001 and 2004 Elections
David Monk

2 PARLIAMENTARY STUDIES CENTRE, CRAWFORD SCHOOL OF ECONOMICS AND GOVERNMENT
Therefore, the start date for this study needed to be at least three years before the project commenced (in September 2007). This led to the selection of the period between the 2001 and 2004 elections (the 40th Parliament) as the focus of the study. The Senate and House registers of committee reports were copied and combined into one master list of 512 reports. A list of random numbers was generated and paired with this master list, giving a random ordering of reports. Because some joint committees were included in both chambers’ registers, House listings of such reports were omitted and only the Senate listings were used. The master list then comprised 496 reports.
The reports were assessed in the order in which they appeared on the random list. To be included in the sample, a majority or minority report needed to make at least one recommendation to the gov-ernment for new action. Previous studies have noted that committees are sometimes able to word recommendations in such a way that the govern-ment finds it easy to accept them, thus inflating the acceptance rate.5 This study’s requirement for new action was to prevent the distorting effect of such recommendations.
Reports that did not make recommendations were excluded from the sample. This meant that Senate estimates reports and the regular Senate inquiries into annual reports were not included. Nor were the activities of the Senate Standing Committee on Regulations and Ordinances, which rarely tables reports. It also meant that reports containing single recommendations supporting proposed government action, as do many of the reports by the Parliamen-tary Standing Committee on Public Works, were excluded.
In total, 196 reports from the master list of 496 were examined to generate a sample of 95. The sample comprised 34 joint committee reports; 21 Senate references and select committee reports; 30 Senate legislation committee reports; and 10 House committee reports. All the reports and government responses were collected from the parliamentary website (http://www.aph.gov.au).
deSCribinG And deFininG the dAtA
Attaching numbers to a flexible, subjective process such as committee reporting and the government response requires a number of decisions to be made on rules and definitions, to ensure that the data are prepared in a systematic, uniform way. These rules and definitions are listed below, along with some summary data for the sample. Further information is given in Appendix 1.
Government response
Generally, this was simple to resolve. For most inquiries, the government tables in one or both chambers a document entitled the ‘government response’. In the case of bills, however, the govern-ment’s response is made orally in chamber debate. For this study, the government was considered to have responded to a report where either a minister or a parliamentary secretary had made a statement, recorded in Hansard, about the government’s atti-tude towards a recommendation. Of the 95 reports in the sample, 63 (66.3 per cent) received a govern-ment response.
recommendations
Identifying majority recommendations was straight-forward. Majority reports generally use automated formatting for recommendations that results in them being listed under a special heading in the text as well as at the front of the report. This made it easy to compile a list of majority recommendations.
The recommendations of minority reports were harder to identify, because they do not conform to any set style. The definition of a minority recom-mendation was therefore widened to include any statement that the government should take some reasonably defined new action, or that a bill should be amended. Terms like ‘should’ or ‘must’ generally indicated a recommendation, whereas terms like ‘could’ or ‘might’ did not.
The next step was to exclude recommendations that were either too easy or too hard for the govern-ment to accept or implement. The remainder were termed ‘eligible recommendations’. To be deemed eligible, a recommendation had to fall within the government’s area of responsibility and require new action. Therefore, recommendations directed at the private sector or at independent entities such as the Australian Securities and Investment Commis-sion were not included. Recommendations for the government to maintain the current arrangements, usually indicated by the word ‘continue’, were also excluded.6
The presence of either majority or minority rec-ommendations in a report depended on the political dynamics of the inquiry. Where there was no dissent, then the report contained majority recommendations only. If there was dissent, then the report usually contained both majority and minority recommenda-tions. It was also possible for a report to contain only minority recommendations. This occurred where a majority on the committee (usually government members) declared that the government should continue with a planned course of action, and the minority raised its own recommendations. Almost

PARLIAMENTARY STUDIES PAPER 11 3
all such reports were produced by Senate legislation committees. Figure 1 demonstrates the pattern of recommendations made by each type of committee.
One of the aims of this paper is to determine whether the type of recommendations in a commit-tee report (minority or majority) affects the govern-ment response to a report.
Acceptance of a recommendation
It was generally straightforward to judge whether or not the government had accepted a recommen-dation, but there were some situations where this could be less clear. For instance, the government might say that it agreed with a recommendation ‘in principle’ but did not have the resources to imple-ment it. For this study, the government response to individual recommendations was graded according
to its degree of conformity with the proposal. The categories are shown in Figure 2.
The first three categories in Figure 2—‘agreed’, ‘partially agreed’ and ‘under examination’—are counted as acceptance of a recommendation. ‘Agreed’ is self-explanatory. ‘Partially agreed’ occurred where a recommendation had several parts and the government agreed to implement at least one, but not all, of them. It also occurred where the government agreed with the idea behind a recom-mendation but used a different method to achieve a similar result. ‘Under examination’ occurred where the government was still considering a recom-mendation. Given that the government could take several years to respond to a report, it seemed fair to count this as acceptance. After all, if the govern-ment had wished to reject such a recommendation, it could have done so at the outset. The principle
FiGure 1 recommendations (majority, minority or both) by type of committee, 2001–04 (%)
Source: Sample of 95 committee reports.
Joint Senate references Senate legislation House Weighted average0
20
40
60
80
100
Majority only Majority and minority Minority only
FiGure 2 Grading of possible government responses to individual recommendations
AcceptAnce Agreed
Partially agreed
Under examination
Already being done
Agreed in principle
Rejection Rejected

4 PARLIAMENTARY STUDIES CENTRE, CRAWFORD SCHOOL OF ECONOMICS AND GOVERNMENT
underpinning the decision to count such cases as acceptance was that the government had promised new action or at least left open the possibility of it.7
In a small number of cases, the government made a general comment in support of some or all of a report’s recommendations, without specify-ing which ones it would accept. This was treated as the government accepting one majority and one minority recommendation, where these types of recommendations existed. Such cases were therefore placed in the ‘agreed’ category.
The other three categories are considered rejec-tions because they preclude the government taking new action. Sometimes, a government response will state that programs and procedures are already in place, so no new action is required. Where these programs and procedures were implemented before a report was tabled, this was counted as rejection. If this occurred afterwards, it was counted as accept-ance. The disadvantage of this decision is that it is arbitrary. It does not allow for instances of ‘bureau-cratic anticipation’, where the government and the bureaucracy begin to address an issue before a report is tabled due to committee pressure. The advantage of the rule is that it is clear and allows for consistent decision making within the current limits of information. As noted earlier, in-principle agreement implies that the government will not take new action in relation to a recommendation. Lack of a government response is treated as rejection of all recommendations.
In making judgments about government responses, the study was careful to look at the con-tent of the response to each recommendation, not just the heading, which could be misleading.8
After deciding which recommendations had been accepted, the study calculated two acceptance rates, one for majority recommendations and the other for
minority recommendations. Across all reports, the average acceptance rate was 39.5 per cent for major-ity recommendations and 5.9 per cent for minority recommendations. The government accepted at least one recommendation (either majority or minority) for 57 reports (60.0 per cent).
Committee type
Over time, the chambers have made changes to their committee systems to suit their needs. During the sample period (2001–04), there were four main types of committee: (1) joint; (2) Senate references and select;9 (3) Senate legislation; and (4) House. The Senate introduced the arrangement of having two types of committee in 1994. By convention, the gov-ernment has a majority on the legislation committees and the opposition a majority on the references com-mittees. Table 1 shows the sources of referral to com-mittee and the composition of the various committee types during the sample period.
The main point of difference between the commit-tees is that Senate references committees are the only ones on which the opposition has a majority. Within Australia’s institutions of state, there are few bodies that an opposition can control. Achieving a majority on the floor of the House delivers that chamber and the whole of the executive to the dominant political party. On the other hand, since 1972 governments have rarely held the balance of power in the Sen-ate.10 This makes it the one institution where oppo-sitions are able to exert some measure of control. Over time, oppositions have used the prestige and resources of the Senate to promote their values and challenge the government. Thus, the Senate gives parties that have lost the last election, or at least do not have a majority of seats in the House, a ‘second bite of the policy cherry’.11 Due the ‘invisible hand’
tAble 1 Committees’ sources of referral and composition, 2001–04
Committee type External referral Self-referral Majority
Joint House, Senate and ministers
Self-referral sometimes within terms of reference
Government
Senate references and select
Senate Self-referral sometimes within terms of reference for select committees
Opposition
Senate legislation Senate Estimates and annual reports Government
House House and ministers Annual reports and Auditor-General reports
Government
Source: Harry Evans (ed.), Odgers’ Australian Senate Practice, 11th edition, Department of the Senate, 2004, p. 382; I.C Harris, B.C. Wright and P.E. Fowler, House of Representatives Practice, 5th edition, Department of the House of Representatives, 2005, pp. 624, 628.
PARLIAMENTARY STUDIES PAPER 11 5
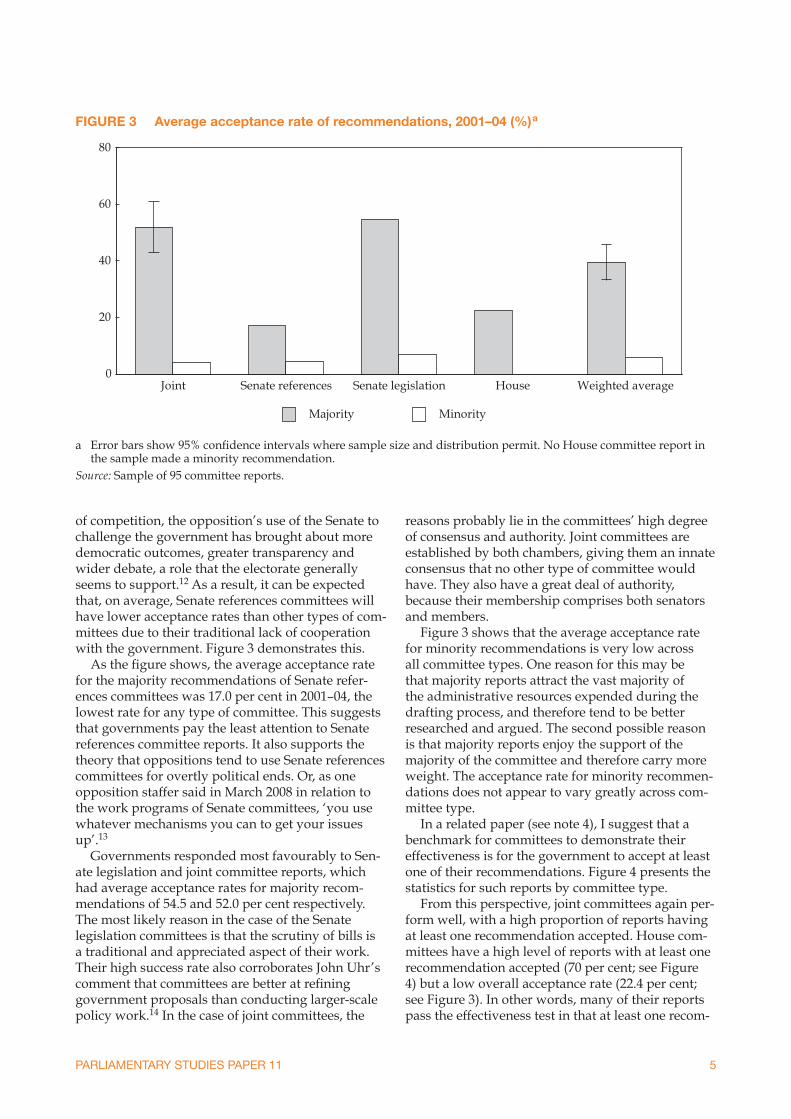
of competition, the opposition’s use of the Senate to challenge the government has brought about more democratic outcomes, greater transparency and wider debate, a role that the electorate generally seems to support.12 As a result, it can be expected that, on average, Senate references committees will have lower acceptance rates than other types of com-mittees due to their traditional lack of cooperation with the government. Figure 3 demonstrates this.
As the figure shows, the average acceptance rate for the majority recommendations of Senate refer-ences committees was 17.0 per cent in 2001–04, the lowest rate for any type of committee. This suggests that governments pay the least attention to Senate references committee reports. It also supports the theory that oppositions tend to use Senate references committees for overtly political ends. Or, as one opposition staffer said in March 2008 in relation to the work programs of Senate committees, ‘you use whatever mechanisms you can to get your issues up’.13
Governments responded most favourably to Sen-ate legislation and joint committee reports, which had average acceptance rates for majority recom-mendations of 54.5 and 52.0 per cent respectively. The most likely reason in the case of the Senate legislation committees is that the scrutiny of bills is a traditional and appreciated aspect of their work. Their high success rate also corroborates John Uhr’s comment that committees are better at refining government proposals than conducting larger-scale policy work.14 In the case of joint committees, the
reasons probably lie in the committees’ high degree of consensus and authority. Joint committees are established by both chambers, giving them an innate consensus that no other type of committee would have. They also have a great deal of authority, because their membership comprises both senators and members.
Figure 3 shows that the average acceptance rate for minority recommendations is very low across all committee types. One reason for this may be that majority reports attract the vast majority of the administrative resources expended during the drafting process, and therefore tend to be better researched and argued. The second possible reason is that majority reports enjoy the support of the majority of the committee and therefore carry more weight. The acceptance rate for minority recommen-dations does not appear to vary greatly across com-mittee type.
In a related paper (see note 4), I suggest that a benchmark for committees to demonstrate their effectiveness is for the government to accept at least one of their recommendations. Figure 4 presents the statistics for such reports by committee type.
From this perspective, joint committees again per-form well, with a high proportion of reports having at least one recommendation accepted. House com-mittees have a high level of reports with at least one recommendation accepted (70 per cent; see Figure 4) but a low overall acceptance rate (22.4 per cent; see Figure 3). In other words, many of their reports pass the effectiveness test in that at least one recom-
FiGure 3 Average acceptance rate of recommendations, 2001–04 (%)a
a Error bars show 95% confidence intervals where sample size and distribution permit. No House committee report in the sample made a minority recommendation.
Source: Sample of 95 committee reports.
Joint Senate references Senate legislation House Weighted average0
20
40
60
80
Majority Minority

� PARLIAMENTARY STUDIES CENTRE, CRAWFORD SCHOOL OF ECONOMICS AND GOVERNMENT
mendation is accepted, but overall a high proportion of the recommendations of House committee reports are not accepted. Senate legislation committees have the highest acceptance rate of majority recommen-dations of all committees (54.5 per cent; see Figure 3) but the lowest proportion of reports with at least one recommendation accepted (38.5 per cent; see Figure 4). One possible explanation for this is that a high proportion of Senate legislation committee reports contain only minority recommendations for new action.
Some joint committees are established by an act of parliament rather than a resolution of both cham-bers. Examples are the Joint Committee of Public Accounts and Audit and the Joint Committee on Corporations and Financial Services. This extra pres-tige may increase the acceptance rate for those com-mittees’ reports. Of the 34 joint committee reports in the sample, 21 were produced by committees established by legislation. The regressions at the end of the paper test whether a legislated function is cor-related with the acceptance rate (see Appendix 1).
It is also possible to check whether the way in which the government accepts or rejects a recom-mendation differs across committee type. Figure 5 presents the data for majority recommendations; presenting the data for minority recommendations would not be instructive, because almost all minor-ity recommendations are rejected.
The figure provides a breakdown of the data by category of acceptance or rejection. The first three categories—‘agreed’, ‘partially agreed’ and ‘under examination’—therefore add up to the totals for majority reports shown in Figure 3. The chart sup-ports a number of observations. First, House com-
mittees have the highest proportion of ‘already taking action’ responses, where the government lists a number of actions that it is already taking in response to a recommendation. House committees are the only type of committee where the govern-ment has exclusive control of the committee refer-ral process as well as a majority on the committee. This supports the view that House committees tend to conduct low-risk inquiries whose recommenda-tions simply reflect current government thinking on an issue. This may explain why House committees have a low acceptance rate of recommendations but a large number of reports where the government has accepted at least one recommendation.
The short deadline for bill inquiries and the fact that ministers respond to them during debate in the chamber leaves little scope for the government to respond that it is ‘already taking action’ on a recommendation or that it is ‘under examination’. Therefore, these two categories are absent for Sen-ate legislation committees. Also, the total number of times that the government has responded that a matter is ‘under examination’ is low, suggesting that this is not a routine method of avoiding responding to a report. This supports the decision in this study to interpret ‘under examination’ responses as accept-ance of a report’s recommendations.
type of inquiry
In an analysis of committee effectiveness, Derek Hawes suggests that the subject matter of a report may affect how the government responds to it.15 We tested this proposition in two ways. The first was to select reports that had a contentious subject mat-
FiGure 4 Proportion of reports where at least one recommendation is accepted, 2001–04 (%)a
a Error bars show 95% confidence intervals. Clopper and Pearson values are used for House committees.Source: Sample of 95 committee reports.
Joint Senate references Senate legislation House Weighted average0
20
40
60
80
100

PARLIAMENTARY STUDIES PAPER 11 �
ter. During the 40th Parliament (2001–04), probably the two most contentious issues were terrorism and immigration. Our sample contained 10 terrorism reports and five immigration reports. The regres-sions at the end of the paper test whether these cat-egories are correlated with the government response (see Appendix 1). The expectation would be that their contentious nature would be associated with a reduced acceptance rate.
The second was to classify inquiries according to the object of scrutiny: ministerial conduct (three reports),16 administration (13 reports), bills (31 reports) and policy (48 reports). One theory to be tested was Hawes’ observation that administrative inquiries are less contentious and therefore have higher acceptance rates.17
In distinguishing between administrative and policy reports, we looked at whether a report focused on how agencies managed themselves, in which case it was classified as an administrative report, or rather on new programs, legislation or large funding initiatives, in which case it was classified as a policy report. Where a report contained a blend of administrative and policy recommendations, the classification was based on which sort was most numerous. A similar approach was taken to differentiating bill inquiries from policy inquiries. On occasion, a report that ostensibly discussed a bill contained mainly policy recommendations. In such cases, the report was classified as a policy rather than bill inquiry.
bipartisanship
The value or otherwise of bipartisanship in commit-tee work is a major topic in the literature. Bipartisan-ship is a matter of balance. If committees conduct ‘safe’ inquiries that are sure to result in bipartisan reports, there may be doubt about their relevance. But if they conduct very contentious inquiries, members may not be able to reach agreement on the report, giving it less authority. Some commentators suggest that committees should concentrate on areas where political parties are yet to form a position. This would give committee members more flexibil-ity in negotiating (because they would not be locked into a party political position) and increase the chances of a bipartisan report.18
Bipartisan reports are attractive to government. One way of viewing government is as a seeker of ideas to develop new policy and satisfy the simul-taneous demands of those who fund and support the party and those who allocate power between the political parties (voters). Governments have close links to their power bases and are well informed about their demands and interests. However, they are less well informed about what policies have sup-port across the electorate. One source of mainstream policies is bipartisan committee reports.
This study uses an index to measure rates of bipartisanship. The basis for the calculation is the percentage of committee members who support a majority report and do not attach additional comments to it. Where there is no majority report,
FiGure 5 breakdown of government responses to majority recommendations, 2001–04 (%)
Source: Subsample of 77 committee reports.
Joint Senate references Senate legislation House Weighted average0
20
40
60
80
100
Agreed
Partially agreed
Under examination
Already taking action
Agreed in principle
Rejected

8 PARLIAMENTARY STUDIES CENTRE, CRAWFORD SCHOOL OF ECONOMICS AND GOVERNMENT
the index is the largest percentage of committee members who support an individual report. If some committee members support a majority report but attach additional comments, this is still categorised as dissent because the majority report clearly did not meet their needs. If the entire committee supports a majority report and no member makes additional comments, then the bipartisanship index for that report is 100. If two members of a six-person committee dissent, then the index will be 66.7. Figure 6 shows the level of bipartisanship in the sampled reports.
The first observation one can make from the chart is that House committee reports display a very high level of bipartisanship. Only one member dissented, once, in the 10 House reports in the sample. With 10 members on each committee, the average biparti-sanship index for these committees was 99. While it may be correct to value bipartisanship, the very high levels in House committees, combined with the low acceptance rate for House recommendations, further supports the argument that they tend to conduct low-risk inquiries. Joint committees also displayed high levels of bipartisanship, with an average score of 92, but had a much higher acceptance rate of rec-ommendations. One interpretation would be that joint committees conduct inquiries of greater rel-evance to the government.
Finally, Senate committees often split along party lines. During the period covered by this study, most Senate committees had six members, including two minority members. A split along party lines would indicate a bipartisanship index of 66.7, which is close to the average for Senate references and Senate legislation committees. Of the 51 Senate committee
reports in the sample, only seven had a bipartisan-ship index of 100.
These comments have clear implications for com-mittee effectiveness. Governments will probably be less likely to accept recommendations where com-mittee members are unable to produce a unanimous report. From the perspective of the government, dissent reduces committee effectiveness. This may explain the low acceptance rate for the majority reports of Senate references committees, which also had the lowest rate of bipartisanship in the sample.
media coverage
Committees work in a political environment. Therefore, one way of assessing the effectiveness of reports is to consider the amount of media coverage they receive. To measure this, we prepared an index based on the coverage of reports in five major metro-politan newspapers: the Sydney Morning Herald, the Age, the Australian, the Australian Financial Review and the Canberra Times. These are the newspapers for which the parliamentary library maintains com-prehensive coverage.19 It would have been difficult to track publicity across the life of an inquiry, which might last over a year, so we focused instead on the period shortly after tabling. The papers were searched electronically for any mention of a report during the two days after it was tabled. A period of two days was chosen because some Senate reports tabled late in the day would have missed the dead-line for publication in the next day’s paper.
The index had two components. The first was whether a report was mentioned in a particular newspaper. For each paper in which it was
FiGure 6 Average bipartisanship index for committee reports tabled in 2001–04 (%)a
a Error bars show 95% confidence intervals where sample size and distribution permit.Source: Sample of 95 committee reports.
Joint Senate references Senate legislation House Weighted average0
20
40
60
80
100

PARLIAMENTARY STUDIES PAPER 11 9
mentioned, the report was awarded one point. The second component was the location of the article: the closer to the front page, the more newsworthy the report. The inverse of the page number was calculated for this: if an article was located on page 1, the report received one point plus one extra point; if on page 2, one point plus half a point; if on page 3, one point plus one-third of a point; and so on. The highest score that a report could receive per newspaper was two, giving each report a potential score of between zero (no mention in any newspaper) and 10 (page 1 article in all five newspapers). Figure 7 shows the results for each committee type.
From the graph it is clear, first, that committee reports overall do not receive a great deal of media coverage. The average for the whole sample was 1.16, which equates roughly to an article on page 6 in one of the five sampled newspapers. Second, it is apparent that Senate references committees received the most coverage by a clear margin. Their score was 2.94, which equates to an article towards the end of the news section in three of the five newspapers. Of the eight reports in the sample that received scores greater than five, all but one was a Senate references inquiry report. The three highest-scoring reports in the sample concerned the intelligence on Iraq’s weapons of mass destruction (10), the Bali bomb-ing (7.98) and a certain maritime incident (7.83).20 Predictably, all three were also reports inquiring into ministerial conduct.
One might expect that more intense press cov-erage would make a government more likely to respond positively to a committee report. In John Uhr’s words, ‘just think of which types of parlia-
mentary committees generate the most media pub-licity and you probably have a committee that has already got the attention of the Government’.21 This proposition will be tested later in the paper.
number of recommendations
The final factor examined here is the number of eligible recommendations in a report. In 2004 Bob Charles, the retiring chair of the Joint Committee of Public Accounts and Audit, said in an interview that he believed that committees should try to produce bipartisan reports that did not contain too many rec-ommendations: ‘If you have 50 recommendations, the three or four that are really important tend to get lost in the flood’.22 Staff who have worked for Charles say that he would express concern about any draft committee report that contained more than 12 recommendations.
In the sample, the number of eligible majority recommendations ranged from zero (because some reports contained no majority recommendations for new action) to 89. Three reports, all by Senate references committees, contained 50 or more recom-mendations; one of these contained 89. The average number of majority recommendations (in reports that contained such recommendations) was 10.9. The number of eligible minority recommendations ranged from zero to nine. The average number of recommendations (in reports that contained such recommendations) was 3.2.
Although this paper makes the simplifying assumption that all recommendations are equally important, Bob Charles’s economical philosophy can be tested. The statistical study that follows tests
FiGure 7 Average press coverage rate for committee reports tabled in 2001–04a
a Error bars show 95% confidence intervals where sample size and distribution permit.permit. Source: Sample of 95 committee reports.
Joint Senate references Senate legislation House Weighted average0
1
2
3
4
5

10 PARLIAMENTARY STUDIES CENTRE, CRAWFORD SCHOOL OF ECONOMICS AND GOVERNMENT
whether the number of recommendations is corre-lated with the government response.
modellinG the GoVernment reSPonSe23
Assessing minimum effectiveness
This part of the study involved running a regres-sion on a number of report characteristics against government acceptance of at least one of a report’s recommendations.24 The aim was to determine whether there was a statistical association between each characteristic and the government response. This was then used to formulate an equation that could be used to predict the probability that the gov-ernment would accept at least one of a report’s rec-ommendations and therefore that the report would achieve a minimum level of effectiveness from the government’s perspective. For example, the model might be used to obtain an estimate of the change in effectiveness of Senate references committees if their (currently very low) levels of bipartisanship increased but all else remained the same. The model was also used to weed out those characteristics that were not statistically significant, that is, those where the association between a characteristic and the government response varied so much that it was not possible to predict with any reliability what the association was. In such cases, the characteristic was removed from the model. After removing charac-teristics with low reliability, the model was left with
nine characteristics. The results are given in Table 2. A more thorough discussion of these processes is in the appendix.
The p-value provides a measure of how reliable (or statistically significant) a characteristic is in predicting whether the government will find a com-mittee report effective. A p-value of 0.05 (or 5 per cent) means that there is a 5 per cent chance of being incorrect if one concludes that there is an actual cor-relation. This is the most commonly used p-value for determining significance, although many studies report the 1 and 10 per cent levels of significance as well. The other factor that should be taken into account is effect size. If a characteristic is correlated with both a large change in effect across the varia-tions typically found in the sample, as well as being statistically reliable, then it is very important to the model.
The table adopts a hypothetical base case of a joint committee tabling a report with four majority recommendations on a topic other than ministerial conduct, terrorism or a bill. The bipartisanship score for the base case is 80.0 per cent, equivalent to eight of 10 members agreeing on a report. This is close to the sample average of 78.5 per cent. With these char-acteristics, the model predicts a 77.3 per cent chance that the government will accept at least one of a report’s recommendations.
The ‘change’ column shows how the figure of 77.3 per cent would increase or decrease in response to a change in characteristic (shown in the ‘new value’ column). For example, if a report was tabled by a
tAble 2 Association between report characteristics and the probability of the government accepting at least one recommendation, reports tabled 2001–04, logit model
Characteristic p-value Base case New value Change (%)
Senate references 0.022 Joint Senate references –47.7House 0.063 Joint House –41.7Terrorism inquiry 0.141 No Yes –32.8Bill inquiry 0.103 No Yes +15.7Inquiry into ministerial conduct 0.068 No Yes –74.7Any majority recommendations? 0.058 Yes No –57.3No. of majority recommendationsa 0.024 4 20 +18.5
2 –5.7Bipartisanship 0.0024 80 100 +14.7
66.7 –17.1Press coverage 0.0098 1.1 5 +20.5
0 –15.0
a The characteristics for the number of majority recommendations appear more than once in the mathematical model. The lower p-value has been reported for this characteristic.
Source: Sample of 95 committee reports.

PARLIAMENTARY STUDIES PAPER 11 11
Senate references committee rather than a joint com-mittee (row 1), then the probability of effectiveness would drop by 47.7 per cent to 29.6 per cent.25 This does not mean that exactly the same report would have a reduced chance of its recommendations being accepted simply because a different type of com-mittee wrote it, although something like this may be involved. What it more likely means is that the approach and tone adopted by a Senate references committee would make its recommendations less acceptable to the government than those of a joint committee.
The type of committee running an inquiry tends to have large-scale effects. For House committees, for example, the probability of effectiveness (com-pared with joint committees) drops by 41.7 per cent. The type of committee that most resembles a joint committee is a Senate legislation committee. The dif-ference between these two committee types was not sufficiently large to warrant including Senate legisla-tion committees as an additional characteristic in the model.
Reports that investigate ministerial conduct also have large-scale effects. All else being equal, this type of report is correlated with a reduced chance of effectiveness of 74.7 per cent. These were the most partisan reports during the period, so it is unsurprising that the government was least inclined to respond publicly to them. Also important were reports that contained majority recommendations. Reducing the number of majority recommendations from four to zero was associated with a decrease in the probability of effectiveness of 57.3 per cent.
Under the scenario presented in the table, press coverage is not associated with a large effect. However, in certain circumstances press coverage can have a major impact on the probability of effectiveness. For example, if we assume a different base case of a Senate references inquiry tabling a report with a 66.7 per cent bipartisanship measure, four majority recommendations and no press coverage, the chance of the government finding this report effective would be 8.4 per cent. But increasing the press coverage index to 5 would be associated with a new chance of effectiveness of 70.7 per cent, and increasing it to 10 would be associated with a new chance of effectiveness of 98.5 per cent. That is, it is possible to use the media to push the government into accepting some of a report’s recommendations, but only if the media coverage is intense.
Tested against the 95 reports in the sample, the model predicts the correct result 85.3 per cent of the time, compared with 50 per cent for flipping a coin or 60 per cent for automatically predicting a positive result in all cases. Therefore, the model has reason-able predictive power.
These results confirm some of the observations made earlier in the paper. The exception is Bob Charles’s comment about the desirability of limiting the number of recommendations. Rather, a larger number of majority recommendations in a report appears to increase the chance that the government will find something useful in it. This is similar to the lottery effect, where the more tickets one buys, the greater the chance of winning a prize. The impact of this characteristic is a result of setting a non-zero acceptance rate as the benchmark, rather than a par-ticular proportion, such as 50 per cent.
However, there is a limit to the lottery effect. This is because the number of majority recommendations appears in the model as both linear and squared terms. The coefficient for recommendations squared has a negative sign, which means the second deriva-tive will also have a negative sign. Differentiating the regression equation by majority recommenda-tions and solving gives a global maximum of 46 majority recommendations. That is, if the govern-ment does not find anything worth accepting in a report with 46 recommendations, then adding more majority recommendations will not, on average, be associated with an increased chance of a report being deemed effective by the government.
A criticism of this model is that committees can maximise their chance of effectiveness by tabling larger reports with more recommendations. A number of observations can be made in response to this concern. First, government acceptance of at least one recommendation is not the only measure of effectiveness included in the framework. The accept-ance rate of recommendations, for instance, can be considered a supplementary performance indicator for this initial measure of effectiveness. The views of the legislature, stakeholders and the public must also be considered in assessing overall effectiveness. Inflating one effectiveness measure is likely to result in lower performance on these other three measures. Second, it is advisable to compare any effectiveness measure with an efficiency measure, such as cost. It should be possible to publish the cost of a commit-tee report as Canadian committees have done in the past, and as the Audit Office of New South Wales does for its performance audits.26 Including the cost of an inquiry in a report should moderate any ten-dency to overemphasise the importance of a particu-lar effectiveness measure.
Acceptance rate of majority recommendations
This part of the study involved running a regression to determine what factors were correlated with the acceptance rate for majority reports.27 The regres-sion was based on the subsample of 77 committee reports that contained majority recommendations.

12 PARLIAMENTARY STUDIES CENTRE, CRAWFORD SCHOOL OF ECONOMICS AND GOVERNMENT
Our interest was in determining which characteris-tics made an effective report more so from the per-spective of the government. The results are given in Table 3.
The model adopts a base case of a joint or Senate legislation committee publishing a policy or admin-istrative report with four majority recommendations, a bipartisanship score of 80 per cent and a press cov-erage score of 1.1. The model predicts that, on aver-age, the government will agree to implement 37.8 per cent of the recommendations in such a report. In practical terms, this amounts to the government accepting one or two of its four recommendations.
The sample is similar to that in Table 2 and a related issue is being investigated. Therefore, there are a number of similarities in the results. All the characteristics in this model appear in the previous one and have the same sign over typical ranges in the sample. However, the removal of reports with minority recommendations made the presence or otherwise of majority recommendations irrelevant, so it does not appear in Table 3. Once again, Senate legislation committees are statistically no different to joint committees. All else being equal, the govern-ment found the reports of these two committee types to be the most valuable according to this measure.
The effects in this model are reasonably large: between 25 and 50 per cent for the values typically found in the sample. All except terrorism are sta-tistically significant, which means that the effects are reliable as well. However, the model would
probably benefit from the inclusion of additional characteristics. Currently, it explains 38.3 per cent of the variation in the regression, which is similar to stating that it explains 38.3 per cent of the variation in the acceptance rate for reports with majority rec-ommendations.28 One rule of thumb is that a model should explain at least 50 per cent of the variation in a regression. Nevertheless, the results again confirm some of the initial discussion in relation to the effect of committee type, inquiry type, bipartisanship and press coverage.
Acceptance of at least one minority recommendation
This part of the study involved running a regression to determine what factors were correlated with the government accepting at least one minority recom-mendation.29 The regression was based on the sub-sample of 44 committee reports containing at least one minority recommendation. Although it might have been preferable to model the acceptance rate for these reports, the skewed distribution of the data did not permit this and it was necessary to construct a more limited model.30 The results are given in Table 4.
The model adopts a base case of any committee type conducting a bill inquiry, with the report hav-ing three minority recommendations and 10 majority recommendations. Under these circumstances, the model predicts that there is a 15.7 per cent chance
tAble 3 Association between report characteristics and the government acceptance rate for majority recommendations, reports tabled 2001–04, olS model
Characteristic p-value Base case New value Change (%)
Senate references 0.00037 Joint or Senate legislation Senate references –32.3House 0.00055 Joint or Senate legislation House –34.2Terrorism inquiry 0.210 No Yes –25.9Bill inquiry 0.017 Policy or admin. inquiry Bill +48.8Inquiry into ministerial conduct
0.00020 Policy or admin. inquiry Ministerial –36.2
No. of majority recommendationsa
0.174 4 8 +4.12 –2.3
Bipartisanship 0.0030 80 100 +28.366.7 –15.9
Press coverage 0.0020 1.1 5.0 +45.90 –12.8
a The characteristics for the number of majority recommendations appear more than once in the mathematical model. The lowest p-value has been reported for this characteristic.
Source: Subsample of 77 committee reports.

PARLIAMENTARY STUDIES PAPER 11 13
that the government will accept at least one recom-mendation. This low level of effectiveness from the perspective of government is consistent with the pattern for minority recommendations shown in Fig-ure 3. It is also consistent with the previous finding that committee type is not relevant to how the gov-ernment responds to minority recommendations. On average, it appears that minority recommendations have such a low profile and are so poorly resourced during development that they have a uniformly low acceptance rate, regardless of committee type.
Once again, the lottery effect is relevant to whether the government accepts at least one minority recommendation. In this case, however, the number of majority as well as minority recom-mendations in a report becomes relevant. The low level of attention given minority recommendations generally means that they are not a significant characteristic in determining whether the govern-ment accepts at least one of a report’s recommenda-tions. But when one focuses on reports that contain only minority recommendations, then the number of minority recommendations in the report does become relevant.
Also interesting is that the number of majority recommendations affects whether the government accepts minority recommendations. This suggests that the overall scale of a report is important. If a report is sufficiently large, then it is possible that the government may be induced to consider its minor-ity recommendations seriously, as a by-product of examining a large number of majority recommenda-tions. For the hypothetical case of a committee con-ducting a non-bill inquiry with 60 majority and three minority recommendations, then the chance of the government accepting at least one minority recom-mendation rises to 44.3 per cent.
A number of characteristics could not be included in the model due to the nature of the sample. In particular, the government did not accept any of the
minority recommendations in the reports inquiring into immigration, terrorism or ministerial conduct. Therefore, the model could not attach effect sizes or statistical probabilities to these characteristics. The best conclusion that can be drawn for these charac-teristics is that minority recommendations in these types of reports have a very low chance of being accepted by the government.
APPlyinG the model
This study focuses on explaining the government response to reports tabled between the 2001 and 2004 elections. Groups and individuals who use it to assist them in their decision making about future reports should be aware of the assumptions underlying the research. The analysis assumes, for example, that all recommendations in a report are equally important, but in the real world this is rarely the case. Also, there has been a change of govern-ment since the sample period. To apply the results of the regression to a different government implies that there are negligible differences between govern-ments in relation to committee reports, but this may not be the case. We also know that the models leave a large proportion of the government response unex-plained. Therefore, the regression results should be considered indicative of the trade-offs that commit-tees face, rather than an authoritative predictor of the likely government response.
maintaining bipartisanship
Let us assume that a joint committee is deliberating on a report with nine recommendations on a non-terrorism-related policy matter. The expected press coverage is 1.1 and all 20 committee members are expected to agree on the report. But let us assume that, due to external factors, the eight opposition
tAble 4 Association between report characteristics and the government accepting at least one minority recommendation, reports tabled 2001–04, logit model
Characteristic p-value Base case New value Change (%)
Bill inquiry 0.0854 Bill inquiry No –15.4
No. of minority recommendations 0.0788 3 6 +38.8
1 –10.6
No. of majority recommendations 0.213 10 20 +7.6
50 +74.7
0 –2.1
Source: Subsample of 44 committee reports.

14 PARLIAMENTARY STUDIES CENTRE, CRAWFORD SCHOOL OF ECONOMICS AND GOVERNMENT
members inform the committee that they cannot support a number of recommendations and plan to insert three recommendations in a minority report. How should the different sides approach the negotiations?
If we assume that the government members wish to maximise the chance that at least some recommendations will be implemented, then they should secure full bipartisanship. For example, if the opposition members support five of the nine recommendations and the government members agree to this reduction, then the chance of the government accepting at least one recommendation will be 93.0 per cent. If the committee adopts all nine recommendations and the eight opposition members dissent, then the chance of the government accepting at least one recommendation will drop to 80.5 per cent. This calculation assumes that there is a small increase in press coverage due to the dispute (to 2.2). These calculations are based on the first model.
The other possible scenario is that the 12 government members are not risk averse and instead wish to maximise the number of recommendations that the government will accept. This figure is calculated by multiplying the number of recommendations by the predicted acceptance rate, using the second model. If the committee adopts all nine recommendations and the eight opposition members dissent, the likely number of recommendations that the government will accept is 2.7.
So what does the model predict if government members trade off some recommendations to secure full bipartisanship? While 100 per cent bipartisan-ship will maximise the likely acceptance rate, trad-ing off recommendations will reduce the number of recommendations available for the government’s consideration. If we assume that the government members need to drop only one recommendation to secure the agreement of the opposition members, then the likely number of accepted recommenda-tions will be 5.6. In this case, negotiating to secure bipartisanship is worthwhile. If two recommenda-tions need to be dropped from the report to achieve consensus, leaving seven recommendations in the report, then the likely number of accepted recom-mendations will be 4.8. If three, four or five recom-mendations are dropped, then the figures will be 4.1, 3.4 and 2.6 respectively.
In practical terms, dropping five recommenda-tions is equivalent to accepting dissent on all nine recommendations. Therefore, the government mem-bers know that dropping up to four recommenda-tions to secure consensus will make them better off, but there is little benefit in trading off any more. If the opposition members require more than this number to be dropped, then the government mem-
bers might as well keep all nine recommendations and accept the consequences of a minority report. Of course, opposition members can make these calcula-tions as well.
The negotiations are also affected by the minority’s extra three recommendations. Assume that the minority’s main goal is to have at least one of these minority recommendations accepted. Assume also that they are considering supporting the nine majority recommendations if one of their minority recommendations is included in the majority report. If they dissent, then the chance of at least one of their recommendations being accepted by the government is 0.3 per cent, or virtually nil. If they support the majority report on the basis that one of their three recommendations is included among the majority recommendations, then the predicted acceptance rate for the 10 recommendations is 71.4 per cent, which also becomes the chance that this individual recommendation will be accepted. Therefore, the probability of having a minority recommendation accepted by the government is much higher if the minority is able and willing to negotiate with the majority to have some of its recommendations included in the majority report.
A number of conclusions can be drawn from these examples. First, a majority’s approach to bipartisan-ship will depend on how risk averse it is: the more risk averse a committee majority, the more likely it will be to seek consensus. Bipartisanship is also relevant for less risk-averse committee majorities. Where committees are seeking to maximise the likely number of recommendations accepted, then negotiating to achieve an agreed report is worth-while, provided the majority does not give up too many recommendations. Bipartisanship has value in this case, but it is possible to pay too high a price to secure it.
Second, bipartisanship can also be worthwhile for a committee minority. If minority committee mem-bers want the government to accept certain recom-mendations, then there is value in negotiating with the majority to have at least some of their proposals included in a bipartisan report. However, if they would rather appeal to a particular interest group or make an ideological statement, then a dissenting report is preferable. In 2001–04, Senate committees received a high proportion of their references from the opposition, had low levels of bipartisanship and had a high proportion of reports with minority rec-ommendations. It appears that, during the period studied, the opposition usually found more value in using Senate committees to conduct high-profile political debate than to persuade the government to take new action.

PARLIAMENTARY STUDIES PAPER 11 15
Choice of committee
Tables 2 and 3 revealed clear differences between the effect of an inquiry conducted by a joint com-mittee on the one hand, and by a Senate references or House committee on the other. Indeed, in the latter two cases the chance that the government would accept at least one recommendation could drop by as much as 40–50 per cent. Assume that a parliamentarian wants a committee to investigate a policy issue and wants the government to commit to new action on that issue. Let us assume further that the parliamentarian does not mind which type of committee conducts the inquiry. The results of this research suggest that the senator or member in ques-tion should lobby to have the inquiry conducted by a joint committee, rather than a Senate references or House committee.
Joint committees have reasonably wide terms of reference to examine specified areas of govern-ment activity, such as foreign affairs, defence, trade, financial services, security, crime and migration. For matters outside these areas, the Joint Commit-tee on Public Accounts and Audit is able to conduct inquiries. This committee has wide terms of refer-ence, including the ability to examine the receipt and expenditure of funds by the Commonwealth and any connected circumstances.31 It can inquire into almost any area of Commonwealth activity and has almost always delivered bipartisan reports. This, as we saw, increases the chance of the government
accepting a committee’s recommendations. With a joint committee available for every type of inquiry (at least in theory), parliamentarians who are com-mitted to a particular inquiry should attempt to maximise the chance of new action by persuading a joint committee to conduct it.
more or less majority recommendations?
The final topic in this area concerns the relationship between the size of a report and the acceptance rate of recommendations. Figure 8 shows the association between the number of majority recommendations in a report and the expected acceptance rate for each committee type. The example assumes that the bipartisanship and press coverage rates for each of the four main committee types are the same as their respective sample averages. The inquiries by Sen-ate legislation committees are all assumed to be bill inquiries. None of the inquiries by other committees are assumed to relate to bills.
In terms of maximising the expected acceptance rate, the optimal number of recommendations is 27. This number is the same across all committee types. Some of the reports of joint and Senate references committees contained more than this number of recommendations, but those of House and Senate legislation committees did not.
The results support Bob Charles’s view that 12 majority recommendations is the optimum for an inquiry in the sense that a preferred point does exist.
FiGure 8 Association between number of majority recommendations and expected acceptance rate of majority recommendationsa
a The lines for the various committee types reflect the actual sample and are not projections.Source: Subsample of 77 committee reports.
10 20 30 40 50 60 70 800
10
20
30
40
50
60
70
Exp
ecte
d a
ccep
tanc
e ra
te (%
)
No. of majority recommendations
Joint Senate references Senate legislation House

1� PARLIAMENTARY STUDIES CENTRE, CRAWFORD SCHOOL OF ECONOMICS AND GOVERNMENT
The main point to take from the graph is that large reports tend to be inefficient. While committees generally draft their reports according to the inquiry topic and the issues therein, a useful rule of thumb is that they should scrutinise closely any reports that exceed 30 recommendations. Of course, this pre-scription is made on the assumption that a particu-lar committee wishes to maximise the return on its resources, as measured by the government accepting its recommendations. For Senate references inquir-ies, this does not appear to have been the case. Rather, these inquiries were often a platform for opposition parties to engage in political debate with the government. The government response may not have been relevant to their effectiveness.
ConCluSion
In the sample of 95 reports, the government accepted at least one recommendation in 57 cases. In other words, where committee reports suggested new action, the government found their suggestions use-ful 60.0 per cent of the time. While different observ-ers may have different views about the appropriate benchmarks, it seems fair to judge this as constitut-ing a reasonable level of performance, at least in the Australian context.
From the perspective of the government, joint committees are the most effective type of committee. They had the highest proportion of reports where the government accepted at least one recommenda-tion (82.4 per cent) and the second highest accept-ance rate of majority recommendations (52.0 per cent). Senate legislation committees were the next most effective. They had the highest acceptance rate of majority recommendations (54.5 per cent) but the lowest acceptance rate of at least one recommenda-tion (36.7 per cent). This was because they issued a high proportion of reports that contained only minority recommendations. The acceptance rate of minority recommendations was universally low, so this could not be used as a third way of assess-ing committee effectiveness from the government’s perspective.
The study carried out three regressions to exam-ine the association between report characteristics and the government response. The first focused on the characteristics linked to report effectiveness, defined as the government accepting at least one of a report’s recommendations, whether from the majority or the minority. The most important factors in this regression were type of committee, inquiry topic, bipartisanship, press coverage and majority recommendations.
The second regression investigated the link between report characteristics and the proportion
of majority recommendations accepted by the gov-ernment. The relevant factors were similar to those for the previous regression. The main difference was that the effect of the inclusion of recommen-dations in a majority report was not investigated. It would not have been relevant to do so, because the entire sample comprised reports with majority recommendations.
The third model examined the correlation between report characteristics and the government accepting at least one of a report’s minority recom-mendations. (Because of the distribution of the data, it was not possible to investigate the proportion of minority recommendations accepted.) The relevant characteristics in this model were the number of minority and majority recommendations in the report and whether the inquiry concerned a bill. This was the only regression where committee type was unimportant.
The first two regressions found a clear difference between joint committee reports and the reports of Senate references committees and House com-mittees. Interestingly, the size of the association was similar for both types of committee. This sug-gests that Senate references committees and House committees are fundamentally similar, despite the former being the only type of committee where the opposition holds a majority. Perhaps the main reason for this is that they are both single-chamber committees with non-specific roles. From the gov-ernment’s perspective, House committees are more effective due to their higher levels of bipartisanship.
Senate legislation committees came the closest to performing like joint committees from the perspec-tive of the government. They had the highest accept-ance rate for majority recommendations, although the large number of reports containing only minor-ity recommendations meant that the government found their reports least effective overall. In the regressions, they were statically very similar to joint committees. In all three cases the difference between the two committee types was too small to warrant including Senate legislation committees as a sepa-rate characteristic. This, together with their empha-sis on the examination of bills, suggests that there is something inherently valuable to government about their work.
The one report characteristic that proved impor-tant in all regressions was whether an inquiry con-cerned a bill. There are two possible explanations for this. First, debating and examining bills is a core parliamentary activity. Second, parliament and par-liamentary committees are better at scrutinising gov-ernment policy than they are at building policy from the ground up. This is driven by both resources and processes. Parliamentary budgets are a fraction of government budgets. And parliaments are purpose-

PARLIAMENTARY STUDIES PAPER 11 1�
built to place information on the public record and debate the issues placed before them.
The other generally important factors in the regressions were the number of recommendations, bipartisanship, press coverage and inquiry topic. Here, the results reinforce Gavin Drewry’s observa-tion that committees are at their most effective when they conduct contentious inquiries but deliver bipar-tisan reports.32 From the perspective of government, this certainly appears to be the case.
ACknowledGmentS
A number of people contributed to this paper in various ways. They include Russell Chafer, Ian Hol-land, Phil Larkin, Robyn McClelland, Robyn Webber and an anonymous referee.
APPendiX 1 the Statistics
Summary data
The text provides a detailed examination of the sum-mary data. For completeness, summary data tables for the three regressions are provided in this appen-dix. The independent variable for each regression is listed in the first row of each table.
Table A1 shows the summary data for minimum committee effectiveness. It can be observed that the continuous variables in the last four rows are skewed to the right. For example, the mean number of majority recommendations is nine, but the maximum is 89. A linear specification implies that a change from one recommendation to 11 will be the same as that from 40 to 50. Practically, however, any report that had over 20 recommendations would be considered a large report. In theory, the impact of changing the number of recommendations from one to nine would be much greater than a change from 40 to 50. This suggests that diagnostic tests to check for the non-linearity of this variable should be con-ducted. A similar argument could be made for the other continuous variables.
Table A2 shows the summary data for the accept-ance rate of majority recommendations. It comprises only those reports that contained at least one major-ity recommendation. Therefore, the values in the table have been shaped by this criterion. The bipar-tisanship score is higher, because the reports con-taining only minority recommendations have been removed. Many of these were Senate legislation committee reports, so there are fewer reports from this type of committee in the sample as well.
Table A3 shows the summary data for the govern-ment accepting at least one minority recommenda-tion. The sample comprises reports containing at least one minority recommendation. Predictably, this sample has a low average bipartisanship index and a high proportion of Senate legislation committee reports.
regression results for minimum effectiveness
Table A4 shows the regression results for the logit model of minimum committee effectiveness. In this case, government acceptance of at least one of a report’s recommendations was counted as a positive response and a zero acceptance rate was counted as a negative response. The regression procedure was generally to run each model with all variables and cull variables that had a t-value of less than one. Diagnostic tests were performed, including for heteroskedasticity and specification (linearity of independent variables). Squared terms could then be added if necessary.

18 PARLIAMENTARY STUDIES CENTRE, CRAWFORD SCHOOL OF ECONOMICS AND GOVERNMENT
tAble A1 Summary data for the logit model of minimum committee effectiveness
Variable Minimum Maximum Average Standard errora
Effectiveness dummy 0 1 0.60 0.039Senate references dummy 0 1 0.22 0.033Senate legislation dummy 0 1 0.32 0.037House dummy 0 1 0.11 0.025Terrorism dummy 0 1 0.11 0.025Immigration dummy 0 1 0.05 0.018Administration dummy 0 1 0.14 0.028Bill dummy 0 1 0.33 0.038Ministerial dummy 0 1 0.03 0.014Legislated functions dummy 0 1 0.22 0.033Majority recommendations dummy 0 1 0.81 0.031Minority recommendations dummy 0 1 0.46 0.040Majority recommendations 0 89 8.87 1.086Minority recommendations 0 9 1.48 0.175Bipartisanship index 25 100 78.50 1.744Press coverage index 0 10 1.16 0.170
a Standard errors are adjusted by the finite population correction factor.Source: Sample of 95 committee reports.
tAble A2 Summary data for the olS model of the acceptance rate of majority recommendations
Variable Minimum Maximum Average Standard errora
Majority acceptance rate 0 100 39.55 3.162Transformed acceptance rate –4.60 4.60 –0.85 0.272Senate references dummy 0 1 0.26 0.039Senate legislation dummy 0 1 0.18 0.034House dummy 0 1 0.13 0.030Terrorism dummy 0 1 0.13 0.030Immigration dummy 0 1 0.06 0.021Administration dummy 0 1 0.17 0.033Bill dummy 0 1 0.22 0.037Ministerial dummy 0 1 0.04 0.017Legislated functions dummy 0 1 0.27 0.039Minority recommendations dummy 0 1 0.34 0.042Majority recommendations 1 89 10.95 1.272Minority recommendations 0 9 1.12 0.184Bipartisanship index 25 100 83.48 1.850Press coverage index 0 10 1.39 0.204
a Standard errors are adjusted by the finite population correction factor.Source: Subsample of 77 committee reports.

PARLIAMENTARY STUDIES PAPER 11 19
Adding the square of minority recommenda-tions to the model meant that the variables related to minority recommendations acted as a proxy for bipartisanship. This resulted in bipartisanship and a number of other variables not being statistically significant. Because the model that resulted from this alternative process had a lower overall explana-tory power, the model described in Table A4 was preferred.
Logit models are asymptotic and assume a large sample size. What is ‘large’ depends on the skew-ness of the data and the number of independent variables. For example, if the data are skewed and there are four to six variables, then a sample size of 200 would be necessary.33 Therefore, the sample size here of 95 is not large enough to be confident about the results. In order to check that the logit results were robust, a series of regressions repeat-ing the logit models were conducted using ordinary least squares (OLS), where a sample size of 95 is not problematic. Although the results are not suitable for modelling purposes, they can be used to check the sign and statistical significance of the coefficients in the logit model. The results using the same vari-ables as in the final logit model are shown in Table A5. The results of some diagnostic tests are given in Table A6.
The results of the robustness check are very similar to those for the logit model. The signs are the same and all but one variable has the same or a greater level of statistical significance. The exception is the square of majority recommendations, whose t-value has moved from –1.90 to –1.65. The variable should still stay in the model but it may not be as statistically significant as the logit model suggests.
The diagnostic tests for robustness produce the expected results. Heteroskedasticity does not appear to be an issue, so only the OLS t-values are given in Table A5. In conclusion, the robustness check largely verifies the results of the logit model.
The diagnostic issues in logit models are specifica-tion and heteroskedasticity. We used Davidson and MacKinnon’s OLS artificial regression to conduct these diagnostic tests (Table A7).34 The specification test was:
Vt–1/2(yt– Ft) = Vt
–1/2ftXtb + aVt–1/2(Xtβ)2ft+ residual
where:Vt = the variance of the error term = Pt– Pt
2;Pt = the predicted probability = Ft;yt = the observed dependent variable;ft = the derivative of Ft = Vt (logit model only); Xtβ = ln(Pt/(1 – Pt)); and
tAble A3 Summary data for the logit model of the government accepting at least one minority recommendation
Variable Minimum Maximum Average Standard errora
Minority recommendations effectiveness dummy
0 1 0.14 0.041
Senate references dummy 0 1 0.25 0.051Senate legislation dummy 0 1 0.57 0.058House dummyb – – – –Terrorism dummy 0 1 0.07 0.030Immigration dummy 0 1 0.07 0.030Administration dummyb – – – –Bill dummy 0 1 0.55 0.059Ministerial dummy 0 1 0.02 0.017Legislated functions dummy 0 1 0.11 0.037Majority recommendations dummy 0 1 0.59 0.058Majority recommendations 0 89 8.05 1.918Minority recommendations 1 9 3.20 0.258Bipartisanship index 25 93.75 60.14 1.631Press coverage index 0 7.98 1.47 0.286
a Standard errors are adjusted by the finite population correction factor.b None in sample.Source: Subsample of 44 committee reports.

20 PARLIAMENTARY STUDIES CENTRE, CRAWFORD SCHOOL OF ECONOMICS AND GOVERNMENT
Pt, Vt, Ft and ft are calculated using the estimates in the model.
The intuition behind the test is that, if the model is correctly specified, Xtb should not be related to the variation in the left-hand side (which is a transformed error term), and the square of the fit-ted value, Xtβ, should not have much explanatory power. It is similar to a RESET test. The test statistic is the explained sum of squares from the regression. It has a chi-square distribution with one degree of freedom. Table A7 shows that the test statistic of 1.03 is below the 10 per cent critical value. Therefore, we do not reject the null hypothesis that the model is correctly specified.
The heteroskedasticity test is related to the specifi-cation test. The formula is as follows:
Vt–1/2(yt – Ft) = Vt
–1/2ftXtb + Vt–1/2ftZt(–Xtβ)c + residual
The new term is the vector Zt, which comprises a number of variables drawn from those used in the regression. Once again, the test statistic is the explained sum of squares from the OLS regression. Its chi-square distribution has the same number of degrees of freedom as there are variables in Zt. Here, the vector comprises the squares of the continuous variables in the model. As Table A7 shows, the test statistic of 2.00 is below the relevant critical values. Therefore, we do not reject the null hypothesis that the errors are homoskedastic.
There are a number of ways of assessing the explanatory power of the model. The first is to test the hypothesis that the slope coefficients are jointly equal to zero. Table A7 shows the results for the likelihood ratio test. The test statistic of 49.12 clearly rejects the null hypothesis. It is also possible to summarise the model’s performance against both positive and negative predictions. Table A8 gives a
tAble A4 regression results for the logit model of minimum committee effectiveness
Variable First run Final model
Coefficient t-value Coefficient t-value
Senate references dummy –2.493 –1.98 ** –2.087 –2.30 **Senate legislation dummy –1.563 –1.20House dummy –2.041 –1.65 * –1.817 –1.86 *Terrorism dummy –1.641 –1.55 –1.442 –1.47Immigration dummy –0.325 –0.22Administration dummy 0.636 0.58Bill dummy 2.034 1.85 * 1.365 1.63Ministerial dummy –3.575 –1.15 –4.851 –1.83 *Legislated functions –0.908 –0.78Majority recommendations dummy 2.101 1.88 * 1.997 1.90 *Minority recommendations dummy 1.281 0.98Majority recommendations 0.164 2.08 ** 0.156 2.26 **Majority recommendations2 –0.00178 –1.73 * –0.00168 –1.90 *Minority recommendations 0.123 0.50Bipartisanship index 0.0832 2.78 *** 0.0607 3.04 ***Press coverage index 0.640 2.26 ** 0.655 2.58 ***Intercept –9.106 –2.79 *** –6.961 –3.66 ***
Log likelihood –37.65 –39.37McFadden’s pseudo R2 0.411 0.384Akaike information criterion 109.30 100.75Schwarz information criterion 152.72 128.84
* indicates significant at the 10% level of significance, ** indicates significant at the 5% level of significance and *** indicates significant at the 1% level of significance.Source: Sample of 95 committee reports.

PARLIAMENTARY STUDIES PAPER 11 21
tAble A5 OLSrobustnesscheckofthefinalregressionresultsforthelogitmodelofminimumcommittee effectiveness
Variable Coefficient t-value
Senate references dummy –0.306 –2.38 **House dummy –0.274 –1.85 *Terrorism dummy –0.241 –1.59Bill dummy 0.160 1.53Ministerial dummy –0.640 –2.16 **Majority recommendations dummy 0.367 2.52 **Majority recommendations 0.0185 2.26 **Majority recommendations2 –0.000181 –1.65Bipartisanship 0.00893 3.31 ***Press coverage 0.0855 2.83 ***Intercept –0.525 –2.45 **
R2 0.429Adjusted R2 0.361Akaike information criterion 102.86Schwarz information criterion 130.95
* indicates significant at the 10% level of significance, ** indicates significant at the 5% level of significance and *** indicates significant at the 1% level of significance. OLS standard errors used.Source: Sample of 95 committee reports.
tAble A6 DiagnostictestsfortheOLSrobustnesscheckofthefinalregressionresultsforthelogitmodel of minimum committee effectiveness
Test Test statistic
Distribution Critical values
10% 5%
Coefficients jointly non-significant (F-test) 6.30 F (10,84) 1.68 1.95Heteroskedasticity (Breusch–Pagan) 7.04 Chi2 (10) 15.99 18.31Heteroskedasticity (White) 35.35 Chi2 (44) 56.37 60.48Errors normally distributed (Jarque–Bera) 3.29 Chi2 (2) 4.61 5.99Specification (RESET – Ŷ2 and Ŷ3) 2.16 F (2,82) 2.37 3.11
Source: Sample of 95 committee reports.
tAble A7 diagnostic tests for the logit model of minimum committee effectiveness
Test Test statistic
Distribution Critical values
10% 5%
Coefficients jointly non-significant (likelihood ratio test)
49.12 Chi2 (10) 15.99 18.31
Specification (Davidson–MacKinnon) 1.03 Chi2 (1) 2.71 3.84Heteroskedasticity (Davidson–MacKinnon) 2.00 Chi2 (3) 6.25 7.81
Source: Sample of 95 committee reports.

22 PARLIAMENTARY STUDIES CENTRE, CRAWFORD SCHOOL OF ECONOMICS AND GOVERNMENT
breakdown of whether the model correctly predicted the outcome for each of the 95 reports in the sample.
One way of summarising Table A8 is to calculate the proportion of correct ‘not effective’ predictions and correct ‘effective’ predictions and add them. In mathematical terms:
Model performance = n11/(n11+ n10) + n00/(n00+ n01)
If each proportion ranges between zero and one, then adding them will give a statistic between zero and two. Flipping a coin would, on average, give a statistic of one. Always predicting an effective response would give a statistic of one as well. The model will, therefore, demonstrate value if its per-formance statistic is over one. In this case the statis-tic is 1.68, which demonstrates clearly that the model does add value. This statistic is preferable to a per-centage of correct predictions, because it gives equal weight to both positive and negative predictions.
regression results for the acceptance rate of majority recommendations
The dependent variable was transformed by the fol-lowing equation, with acceptance rates equal to 0 and 100 being adjusted to 1 and 99 respectively to allow a defined result for these values.
Dependent variable = ln [AR/(100 – AR)]
where AR is the acceptance rate. The transformation was used because the acceptance rate is bounded by 0 and 100, and an OLS model regressed on the untransformed acceptance rate would result in some predictions outside this range. The transformation ensures that the model’s predictions will stay within these bounds.
The culling process used for the logit model was also used here. The results are shown in Table A9. Squared terms were added to the first run of the model because a RESET test (squares and cubes) indicated non-linearity (p value = 0.065).
Table A10 shows the diagnostic tests conducted for the final model. The tests for slope coefficients,
normal distribution of errors and specification give the preferred results. The Breusch–Pagan test con-firms heteroskedasticity. The general White test does not, but its p-value is not large at 0.16. Comparing the usual standard errors and the White standard errors suggests that heteroskedasticity is present. In particular, the t-value for the ministerial dummy is –3.94 with White standard errors, but only –1.87 with the usual standard errors. Such a large swing suggests heteroskedasticity is present. Therefore, Table A9 uses White standard errors.
regression results for the acceptance of at least one minority recommendation
Forty-four reports in the sample contained at least one minority recommendation suggesting new action by the government. The government accepted a minority recommendation for only six of these reports. This affected the modelling that could be undertaken. In particular, it was not practical to develop a model for the proportion of minority rec-ommendations that would probably be accepted, because the skewed distribution meant that the error terms were skewed and non-normal at a relatively small sample size. Neither was it possible to verify such results through non-parametric tests, because it was not possible to order the 38 reports that had nil acceptance rates for minority recommendations. Therefore, a logit model for whether the government had accepted at least one minority recommendation was developed instead.
The skewed distribution of the dependent vari-able had implications for building the logit model. First, a number of report characteristics were per-fectly correlated with the dependent variable. The dummies for terrorism, immigration and ministe-rial conduct all predicted failure perfectly and were excluded from the model. Second, the coefficient for the legislated functions dummy had the same standard error and t-value as the coefficient for the Senate legislation and Senate references dum-mies and the intercept. Because this variable had no
tAble A8 Performance of the logit model of minimum committee effectiveness: allocation of observations
Model’s prediction
Outcome
Not effective Effective
Not effective 29 (n00) 9 (n01)
Effective 5 (n10) 52 (n11)
Source: Sample of 95 committee reports.

PARLIAMENTARY STUDIES PAPER 11 23
tAble A9 olS results for the acceptance rate of majority recommendations
Variable First run Final model
Coefficient t-value Coefficient t-value
Senate references dummy –2.676 –2.55 ** –2.355 –3.75 ***Senate legislation dummy –0.616 –0.41House dummy –2.490 –2.40 ** –2.776 –3.63 ***Terrorism dummy –1.423 –1.01 –1.504 –1.27Immigration dummy 0.349 0.19Administration dummy 0.986 0.86Bill dummy 2.485 2.44 ** 2.367 2.46 **Ministerial dummy –2.464 –1.04 –3.642 –3.94 ***Legislated functions –0.034 –0.03Minority recommendations dummy 0.836 0.42Majority recommendations 0.0571 1.29 0.0555 1.37Majority recommendations2 –0.00111 –2.31 ** –0.00103 –2.32 **Minority recommendations 0.0378 0.04Minority recommendations2 –0.022 –0.20Bipartisanship index 0.159 1.20 0.0583 3.08 ***Bipartisanship index2 –0.00067 –0.72Press coverage index 0.876 1.75 * 0.548 3.22 ***Press coverage index2 –0.0489 –0.71Intercept –9.799 –2.19 ** –5.970 –3.46 ***
R2 0.417 0.383Adjusted R2 0.236 0.300Akaike information criterion 386.23 372.60Schwarz information criterion 430.76 396.04
* indicates significant at the 10% level of significance, ** indicates significant at the 5% level of significance and *** indicates significant at the 1% level of significance. White standard errors used to generate t-values.Source: Sample of 95 committee reports.
tAble A10 diagnostic tests for the olS model for the acceptance rate of majority recommendations
Test Test statistic
Distribution Critical values
10% 5%
Coefficients jointly non-significant (F-test) 11.69 F (9,67) 1.73 2.02Heteroskedasticity (Breusch–Pagan) 21.26 Chi2 (9) 14.68 16.92Heteroskedasticity (White) 47.55 Chi2 (39) 50.66 54.57Errors normally distributed (Jarque–Bera) 2.03 Chi2 (2) 4.61 5.99Specification (RESET – Ŷ2 and Ŷ3) 1.96 F (2, 65) 2.39 3.14
Source: Subsample of 77 committee reports.

24 PARLIAMENTARY STUDIES CENTRE, CRAWFORD SCHOOL OF ECONOMICS AND GOVERNMENT
statistical significance in the previous model, it was excluded from this model in order to produce more reliable results. The details of the model are shown in Table A11.
The intermediate model has a number of prob-lems. First, the coefficient for press coverage has changed sign from the first run. This raises ques-tions about the robustness of the t-value. Second, the Akaike information criterion has increased, whereas the expectation would be that it should decrease because the non-significant variables have been dropped. This suggests that non-significant variables may be left in the model. An OLS robustness check conducted to investigate this confirms these suspi-cions (Table A12). Specifically, the t-value for press coverage is between –1 and 1, which suggests that it should be excluded from the model.
The intermediate logit model was re-run without the press coverage variable and the Davidson and MacKinnon tests were conducted once again. How-ever, the model did not pass the specification test. The test statistic was 3.06, whereas the critical val-ues for the chi-square distribution with one degree of freedom were 2.71 (10 per cent) and 3.84 (5 per cent). Therefore, there was some non-linearity in the independent variables that was not being captured
by the model. After a process of trial and error, the square of majority recommendations was included in the model (Table A11). One of the pleasing results of this new specification was that the Akaike infor-mation criterion dropped in value, as one would expect.
A robustness check on the final model confirms these results. All the variables in the OLS model are of the same sign and have the same or a greater level of statistical significance as the logit model. Table A13 gives the results. The key result is that the resid-uals are not normally distributed. This is a by-prod-uct of the skewness of the dependent variable. As noted earlier, it is difficult to correct for this. Another feature of the table is that the Breusch–Pagan test strongly indicates heteroskedasticity whereas the White tests do not. The likely explanation for this is that the former test depends on whether the residu-als are normally distributed and tends to reject the null hypothesis of no heteroskedasticity with non-normal residuals. Therefore, traditional standard errors were used. In other respects, the table gives the preferred results.
Table A14 gives the results of the diagnostic tests for the final logit model on minority recommenda-tions. All results are as expected, including those for
tAble A11 regression results for the logit model of the government accepting at least one minority recommendation
Variable First run Intermediate model Final model
Coefficient t-value Coefficient t-value Coefficient t-value
Senate references dummy –16.277 –0.66Senate legislation dummy 10.245 0.48Bill dummy 11.882 1.03 7.754 1.61 4.266 1.72 *Majority recommendations dummy
0.684 0.37
Majority recommendations 0.432 1.34 0.200 1.96 *Majority recommendations2 0.00163 1.25Minority recommendations 1.471 1.86 * 0.746 1.86 * 0.621 1.76 *Bipartisanship index 0.0215 0.25Press coverage index 1.322 1.18 –0.902 –1.55Intercept –30.607 –1.19 –11.574 –2.03 ** –7.977 –2.44 **
Log likelihood –5.825 –9.935 –10.403McFadden’s pseudo R2 0.668 0.433 0.406Akaike information criterion 29.65 29.87 28.81Schwarz information criterion 45.71 38.79 35.94
* indicates significant at the 10% level of significance and ** indicates significant at the 5% level of significance.Source: Subsample of 44 committee reports.

PARLIAMENTARY STUDIES PAPER 11 25
tAble A12 OLSrobustnesscheckofthefinalregressionresultsforthelogitmodelofthegovernment accepting at least one minority recommendation
Variable Intermediate model Final model
Coefficient t-value Coefficient t-value
Bill dummy 0.226 2.13 ** 0.205 2.16 **Majority recommendations 0.0115 3.39 ***Majority recommendations2 0.000145 3.84 ***Minority recommendations 0.0425 1.93 * 0.0467 2.21 **Press coverage –0.0182 –0.82Intercept –0.189 –1.55 –0.172 –1.61
R2 0.293 0.329Adjusted R2 0.221 0.278Akaike information criterion 25.47 21.22Schwarz information criterion 34.39 28.35
* indicates significant at the 10% level of significance, ** indicates significant at the 5% level of significance and *** indicates significant at the 1% level of significance. OLS standard errors are used.Source: Subsample of 44 committee reports.
tAble A13 DiagnostictestsfortheOLSrobustnesscheckofthefinalregressionresultsforthelogit model of minority recommendations
Test Test statistic
Distribution Critical values
10% 5%
Coefficients jointly non-significant (F-test) 6.53 F (3,40) 2.23 2.84Heteroskedasticity (Breusch–Pagan) 19.15 Chi2 (3) 6.25 7.81Heteroskedasticity (White) 12.72 Chi2 (8) 13.36 15.51Heteroskedasticity (White – squares only) 8.67 Chi2 (5) 9.24 11.07Errors normally distributed (Jarque–Bera) 56.33 Chi2 (2) 4.61 5.99Specification (RESET – Ŷ2 and Ŷ3) 1.47 F (2,38) 2.45 3.24
Source: Subsample of 44 committee reports.
tAble A14 diagnostic tests for the logit model of minority recommendations
Test Test statistic
Distribution Critical values
10% 5%
Coefficients jointly non-significant (LR test) 14.25 Chi2 (3) 6.25 7.81
Specification (Davidson–MacKinnon) 2.39 Chi2 (1) 2.71 3.84
Heteroskedasticity (Davidson–MacKinnon) 3.49 Chi2 (2) 4.61 5.99
Source: Subsample of 44 committee reports.

2� PARLIAMENTARY STUDIES CENTRE, CRAWFORD SCHOOL OF ECONOMICS AND GOVERNMENT
the specification test. Adding the square of major-ity recommendations has had the desired result. The model correctly predicts the likelihood of the government accepting at least one minority recom-mendation in 39 cases, or 88.6 per cent of the time. However, this result is somewhat affected by the skewed nature of the distribution of the dependent variable.
Another approach is to use the composite predict-ing statistic discussed for the general effectiveness logit model. Table A15 shows the predictive power of the model according to the actual outcome. Here, the predicting statistic is 1.45. This is a good result considering the skewed distribution of the depend-ent variable.
noteS
1 ‘Resolution expressing opinion of the Senate No. 37’, Standing Orders and Other Orders of the Senate, September 2006.
2 M.E. Aldons, ‘Promise and performance: an analysis of time taken for Commonwealth governments to respond to reports from parliamentary committees’, Legislative Studies, 1(2): 20–23, 1986, p. 20.
3 House of Representatives Standing Committee on Procedure, It’s Your House: Community Involvement in the Procedures and Practices of the House of Representatives and Its Committees, 1999, p. 66.
4 David Monk, ‘In the eye of the beholder? A framework for testing the effectiveness of parliamentary committees’, Parliamentary Studies Paper 10, Crawford School of Economics and Government, Australian National University, Canberra, 2009.
5 Malcolm Aldons, ‘Rating the effectiveness of committee reports: the methodology’, Legislative Studies, 1(15): 22–32, 2000, p. 26.
6 ibid., p. 26; Malcolm Aldons, ‘Rating the effectiveness of committee reports: some examples’, Australasian Parliamentary Review, 16(1): 52–60, 2001, p. 55.
7 This principle finds support in Aldons, ‘Rating the effectiveness of committee reports: some examples’, op. cit., p. 55.
8 The inconsistency of the headings in government responses was noted by Aldons, ‘Rating the effectiveness of parliamentary committee reports: the methodology’, op. cit., p. 30.
9 Select committees are technically different to standing committees in that they are appointed for the duration of an inquiry rather than the duration of the parliament. In other respects they operate in much the same way: they have the same majority structure and the same sources of referral. From this point on, the text refers only to references committees.
10 Senator George Brandis, ‘The Australian Senate and responsible government’, paper delivered to the 2005 Constitutional Law Conference, University of New South Wales Law School and Gilbert and Tobin Centre of Public Law, 18 February 2005, pp. 10, 16, http://www.gtcentre.unsw.edu.au/publications/papers/docs/2005/5_GeorgeBrandis.pdf, accessed 9 November 2007.
tAble A15 Performance of the logit model of minority recommendations: allocation of observations
Model’s prediction
Outcome
Not effective Effective
Not effective 36 (n00) 2 (n01)
Effective 3 (n10) 3 (n11)
Source: Subsample of 44 committee reports.

PARLIAMENTARY STUDIES PAPER 11 2�
11 This idea is raised in the context of judicial review by Martin Shapiro, ‘Judicial delegation doctrines: the US, Britain, and France’, West European Politics, 25(1): 173–99, 2002, p. 179.
12 Brandis, op. cit., p. 6.13 Stephanie Peatling, ‘Spawning season for
committees’, Sydney Morning Herald, 24 March 2008, p. 9.
14 John Uhr, ‘Parliamentary committees: what are appropriate performance standards?’, discussion paper prepared for the Constitutional Centenary Foundation, Canberra, May 1993, p. 16.
15 Derek Hawes, Power on the Back Benches? The Growth of Select Committee Influence, School for Advanced Urban Studies, Bristol, 1993, pp. 119–23.
16 These were: (1) the Senate Select Committee on Ministerial Discretion in Migration Matters, Report, 2004; (2) the Joint Committee on ASIO, ASIS and DSD, Intelligence on Iraq’s Weapons of Mass Destruction, 2003; and (3) the Senate Select Committee on a Certain Maritime Incident, Report, 2002.
17 Hawes, op. cit., pp. 119–23.18 Nevil Johnson, ‘Departmental select committees’,
in Michael Ryle and Peter G. Richards (eds), The Commons under Scrutiny, Routledge, London, 1988, pp. 169–70; Senator Bruce Childs, ‘The truth about parliamentary committees’, Papers on Parliament, 18: 39–54, 1992, p. 48; Gavin Drewry, ‘Scenes from committee life: the new committees in action’, in Gavin Drewry (ed.), The New Select Committees: A Study of the 1979 Reforms, 2nd edition, Clarendon Press, Oxford, 1989, pp. 362–4.
19 It would have been preferable to use the newspapers with the highest circulations, but the parliamentary library does not keep comprehensive records of them. In order of circulation, these papers are the Herald Sun, the Daily Telegraph, the Courier Mail and the West Australian. The Sydney Morning Herald ranks fifth.
20 Joint Committee on ASIO, ASIS and DSD, Intelligence on Iraq’s Weapons of Mass Destruction, 2003; Senate Foreign Affairs, Defence and Trade References Committee, Bali 2002: Security Threats to Australians in South East Asia, 2004; Senate Select Committee on a Certain Maritime Incident, Report, 2002.
21 John Uhr, ‘Marketing parliamentary committees’, Australasian Parliamentary Review, 16(2): 101–9, 2001, p. 103.
22 ‘Straight shooter’, About the House, March 2004, p. 26.23 The EasyReg and Gretl packages were used for the
regressions. See H.J. Bierens, ‘EasyReg International’, 2007, http://econ.la.psu.edu/~hbierens/EASYREG.HTM; and Allin Cottrell (Wake Forest University) and Riccardo Lucchetti (Università Politecnica delle Marche), ‘Gnu regression, econometrics and time-series library’, http://gretl.sourceforge.net/#use.
24 In the logit model, an acceptance rate of zero equated to a negative result and an acceptance rate greater than zero equated to a positive result.
25 The two models in the paper are non-linear. Therefore, the reduction applies only to the specific circumstances in the base case. Variations in the base
case will lead to changes in the effect of a Senate references inquiry (or any other new value).
26 Brian O’Neal, ‘Senate committees: role and effectiveness’, Canadian Parliamentary Information and Research Service, June 1994, http://www.parl.gc.ca/information/library/PRBpubs/bp361-e.htm, accessed 17 October 2007; New South Wales audit reports, http://www.audit.nsw.gov.au/publications/reports/performance/performance_reports.htm, accessed 21 December 2007.
27 An ordinary least squares regression on the natural log of the ratio between the acceptance rate and 100 minus the acceptance rate. Algebraically, this is ln(AR/(100 – AR)). Where the acceptance rate was 0 or 100, it was transformed to 1 or 99 respectively for the purposes of the calculation. This ensured that the predicted values from the model were always between 0 and 100.
28 Note that the independent variable is the log of the acceptance ratio, not the acceptance rate.
29 An ordinary least squares regression on the natural log of the ratio between the acceptance rate and 100 minus the acceptance rate. Algebraically, this is ln(AR/(100 – AR)). Where the acceptance rate was 0 or 100, it was transformed to 1 or 99 respectively for the purposes of the calculation. This ensured that the predicted values from the model were always between 0 and 100.
30 The sample size (44) was not large and the acceptance rate data were very skewed (skewness of 2.92).
31 See subsection 8(1) of the Public Accounts and Audit Committee Act 1951.
32 Gavin Drewry, op. cit., p. 364.33 Mary Stone and John Rasp, ‘Tradeoffs in the choice
between logit and OLS for accounting choice studies’, Accounting Review, 66(1): 170–87, 1991.
34 Russell Davidson and James G. MacKinnon, Estimation and Inference in Econometrics, Oxford University Press, New York, 1993, p. 527.