parker solar probe solar array cooling system in-orbit
TRANSCRIPT
49th International Conference on Environmental Systems ICES-2019-155 7-11 July 2019, Boston, Massachusetts
Copyright © 2019 Collins Aerospace
Parker Solar Probe Solar Array Cooling System In-Orbit
Performance Review
Wei-Lin Cho1, Christopher Miller2, Mark Zaffetti3, Harold Hansen4, Patrick Sears5,
Jonathan O’Neill6, Eric Bechard7, Gary Stewart8
Collins Aerospace, Windsor Locks, CT, 06096
After years of development, Parker Solar Probe (PSP) was launched on August 12, 2018, starting its seven-
year journey to unveil the long-sought mystery of our solar system. The in-situ measurements and imaging,
powered by a pair of solar array wings, will be used to understand how the sun's corona is heated and how the
solar wind is accelerated. As the PSP orbits close to the sun, the cooling system removes the excess heat from
the solar cells to prevent them from overheating.
Collins Aerospace started the development of the Solar Array Cooling System (SACS) in 2008. After
extensive studies, a single phase mechanical pump flow loop with water as the working fluid was selected due
to the unique operating environment of the PSP. Although it is an excellent heat transfer fluid, water has a
major disadvantage: its high freezing point. A unique operating strategy involving two activations and multiple
hot slews was developed to prevent the water from freezing throughout the whole mission. The PSP SACS
hardware includes two pumps and two motor controllers (one primary and one redundant), one accumulator,
two Solar Array Platens (SAPs), four Cooling System Primary Radiators (CSPRs), three isolation valves, three
service valves, and instruments. In November 2013, the PSP SACS completed the half scale thermal vacuum
tests and achieved TRL 6 advancement. The subsequent full scale SACS thermal-vacuum test and the post-
integration observatory level thermal-vacuum test were completed in March 2017 and February 2018,
respectively.
The PSP SACS has been operating successfully through four major operating points: the first activation,
trajectory correction maneuvers, the second activation, and the first perihelion. This paper reviews PSP SACS
hardware, the responses of PSP SACS at the aforementioned four operating points, and the overall
performance of the PSP SACS in its early mission.
Nomenclature
APL = Applied Physics Laboratory
AU = Astronomical Unit (1 AU = 149,597,871 km = 92,955,807 miles)
CSPR = Cooling System Primary Radiator
EMF = Electromagnetic Field
GSE = Ground Support Equipment
JHU = Johns Hopkins University
TCM = Trajectory Correction Maneuver
LWS = Living With a Star
MLI = Multi-Layer Insulator
MMOD = Micrometeoroids and Orbital Debris
PSP = Parker Solar Probe
RTD = Resistive Temperature Device
SACS = Solar Array Cooling System
SAP = Solar Array Platen
TPS = Thermal Protecting System
1 Principal Engineer, Advanced Systems & Technology, One Hamilton Rd., M/S 1A2-W66, Windsor Locks, CT 06096 2 Sr. Manager, Design Engineering, One Hamilton Rd., M/S 1A2-Z62, Windsor Locks, CT 06096 3 Principal Engineer, Design Engineering, One Hamilton Rd., M/S 1A2-Z62, Windsor Locks, CT 06096 4 Technical Fellow, E&E Engineering, One Hamilton Rd., M/S 1A2-Z62, Windsor Locks, CT 06096 5 Staff Engineer, E&E Engineering, One Hamilton Rd., M/S 1A2-W66, Windsor Locks, CT 06096 6 Staff Engineer, Systems Engineering, One Hamilton Rd., M/S 1A2-Z62, Windsor Locks, CT 06096 7 Staff Engineer, Project Engineering, One Hamilton Rd., M/S 1A3-W65, Windsor Locks, CT 06096 8 Manager, Manufacturing Engineering, One Hamilton Rd., M/S 1A1-W64, Windsor Locks, CT 06096
International Conference on Environmental Systems
2
UTC = Coordinated Universal Time
Rs = Solar Radius (1 Rs = 695,700 km = 432,288 miles)
I. Introduction
S part of NASA’s Living With a Star program (LWS), PSP was launched from Cape Canaveral, FL on Aug. 12,
2018 at 07:31 UTC. The main objectives of the PSP mission are to understand the coronal heating, the origination
of the solar wind, and the mechanisms which accelerate and transport the energetic particles. To achieve these
objectives, PSP is designed to make in-situ scientific measurements in the Sun’s atmosphere. In its mission life, the
PSP will achieve twenty-four perihelia. Using seven Venus gravity-assist flybys, the PSP gradually descends to the
Sun’s atmosphere from the first solar encounter at 35.7 Rs to the final three perihelia at 9.86 Rs, which is closer than
any other previous probe has achieved. During those passes, the peak solar flux can be as high as ~500 suns, or 70
W/cm2, which is more than 50 times higher than the solar heating seen by any previous spacecraft. In addition to the
high solar flux operating environment, the PSP’s vast solar distance variation (from 215 Rs during launch to 9.86 Rs
in its final perihelia) has also imposed a heat flux swing ratio of 20 : 1 on the SACS. Because PSP is solar powered, a
pair of solar array wings mounted on PSP’s +y and –y axes are responsible for providing the needed electricity to its
onboard electronics and instrument. Maintaining proper operating temperature for the solar cells in such a harsh
environment presented an extreme challenge to the success of the mission. Collins Aerospace and Johns Hopkins
University/Applied Physics Laboratory (JHU/APL) worked closely to develop an active SACS and unique SACS
operation strategies to enable the PSP science mission. Throughout the years, the PSP SACS has progressed from its
initial low TRL conceptual stage through multiple TRL advancements1,2,3 to the final flight worthy maturity. To date,
the PSP has successfully completed its first orbit and the SACS has executed multiple major operations with all the
SACS components operating properly.
II. PSP Spacecraft Mission Design
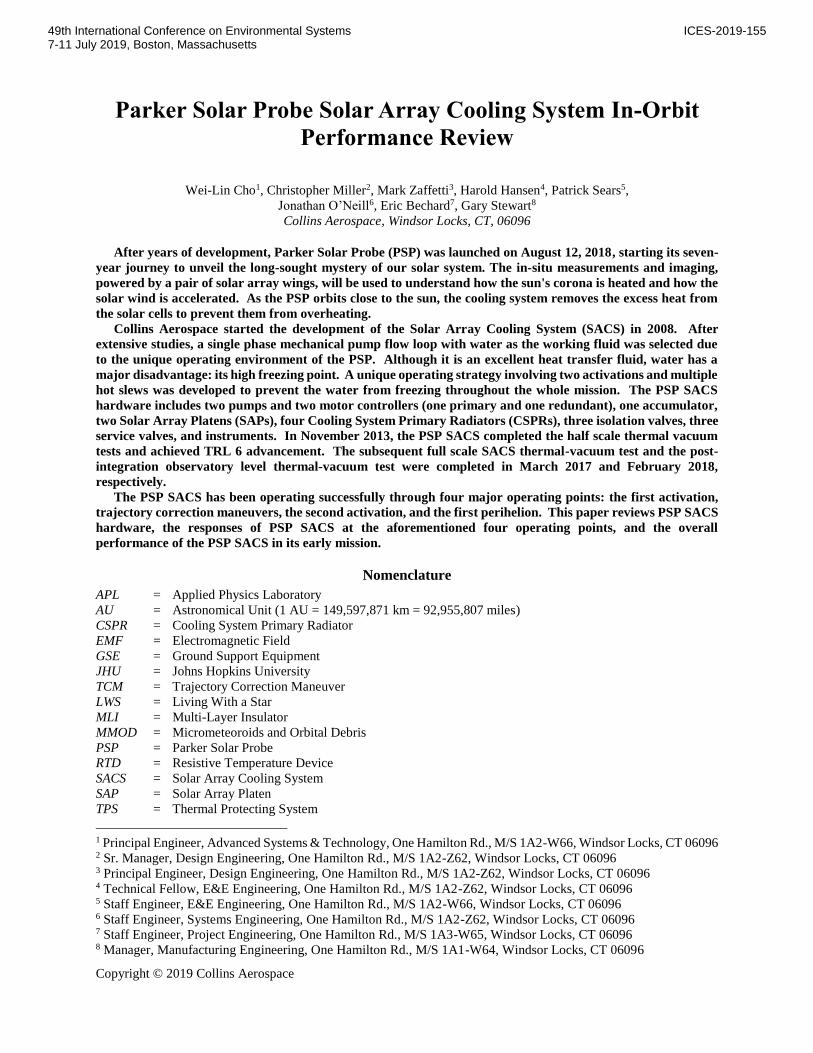
Figure 1 shows the PSP mission
timeline4. The x-axis represents the
year from 2018 to 2025. The first
y-axis indicates the PSP’s speed,
and the second y-axis represents
the distance from the PSP to the
surface of the sun. There are a total
of twenty-four solar encounters (as
indicated by the red circled
numbers in Figure 1), and seven
Venus gravity-assist flybys (as
indicated by the green color-filled
circled numbers in Figure 1) which
will descend the PSP gradually to
the sun’s atmosphere. During three of these seven
Venus flybys, the PSP will fly through Venus’s shadow
and experience approximately eleven minutes of Venus
eclipse. During these Venus eclipses, the PSP operation
will be solely relying on its onboard batteries for power.
The PSP SACS will also start to cool down during
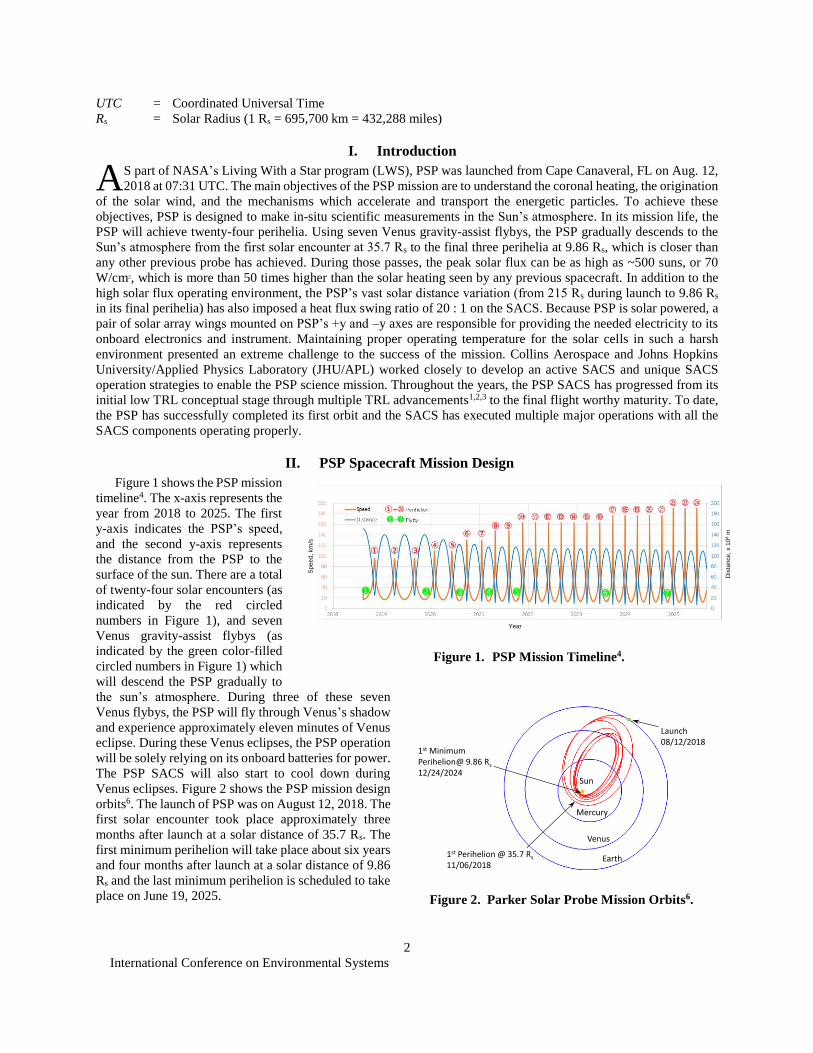
Venus eclipses. Figure 2 shows the PSP mission design
orbits6. The launch of PSP was on August 12, 2018. The
first solar encounter took place approximately three
months after launch at a solar distance of 35.7 Rs. The
first minimum perihelion will take place about six years
and four months after launch at a solar distance of 9.86
Rs and the last minimum perihelion is scheduled to take
place on June 19, 2025.
A
Figure 2. Parker Solar Probe Mission Orbits6.
Launch08/12/2018
1st Minimum Perihelion@ 9.86 Rs
12/24/2024
1st Perihelion @ 35.7 Rs
11/06/2018
Sun
Mercury
Venus
Earth
Figure 1. PSP Mission Timeline4.
Year
Sp
ee
d, km
/s
Dis
tance
, x 1
06
m
International Conference on Environmental Systems
3
III. PSP Solar Array Cooling System Architecture and Hardware
Based on mission design4, the PSP needs to have thirty to sixty minutes post-launch operation before the solar
array wings can be deployed. Prior to the deployment, there is no battery power available to maintain the SACS
temperature. The exposed SACS components, SAPs and CSPRs, will start to cool down. Their temperature can drop
to below -80 °C in the extreme case. In perihelion orbits, the SACS operating temperature can rise up to +150 °C.
Extensive study was conducted to select the proper working fluid which can meet the following three major
requirements. First, the working fluid should be able to be operated in a wide temperature range, from -80 °C to +150
°C. Second, the working fluid should be capable of rejecting the designed maximum amount of heat. Third, the
working fluid should not consume more than the allotted power throughout PSP’s mission. There is no suitable
working fluid that could meet all these three requirements simultaneously. In the end, water was selected as the
working fluid due to its superior heat transfer capability and low pumping power consumption. Because of the high
freezing temperature of water, a special operation strategy was developed to resolve the multiple low operating
temperature situations.
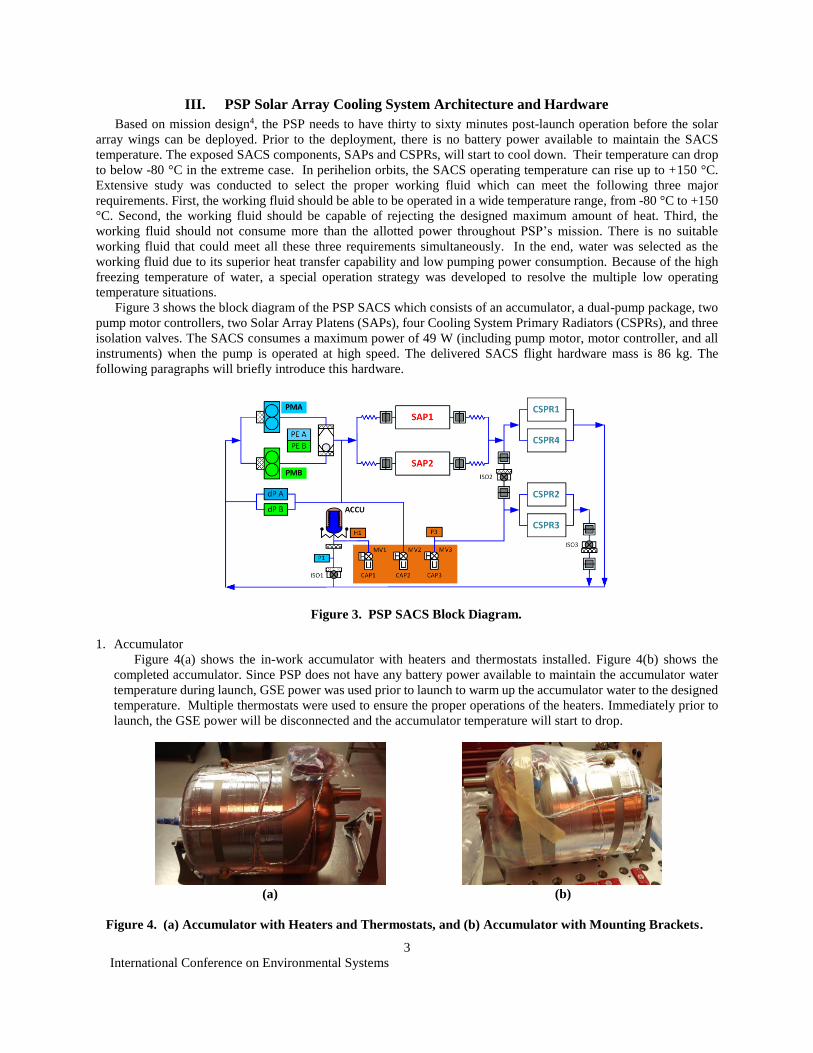
Figure 3 shows the block diagram of the PSP SACS which consists of an accumulator, a dual-pump package, two
pump motor controllers, two Solar Array Platens (SAPs), four Cooling System Primary Radiators (CSPRs), and three
isolation valves. The SACS consumes a maximum power of 49 W (including pump motor, motor controller, and all
instruments) when the pump is operated at high speed. The delivered SACS flight hardware mass is 86 kg. The
following paragraphs will briefly introduce this hardware.
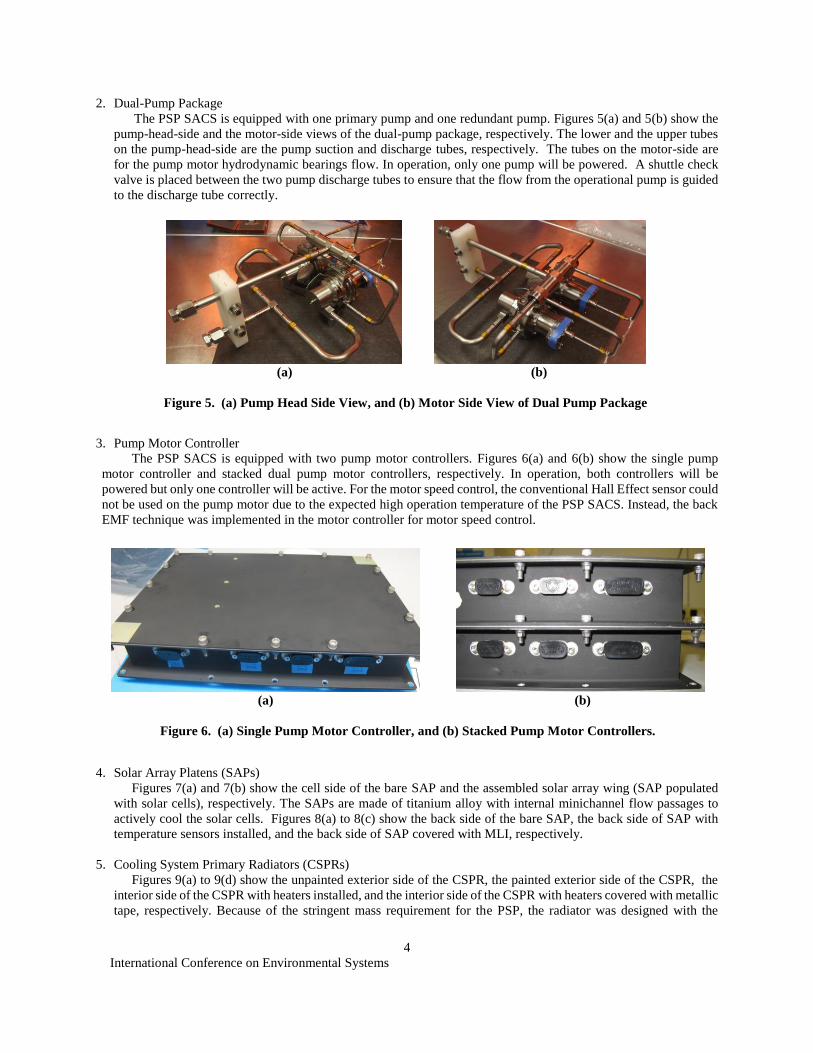
1. Accumulator
Figure 4(a) shows the in-work accumulator with heaters and thermostats installed. Figure 4(b) shows the
completed accumulator. Since PSP does not have any battery power available to maintain the accumulator water
temperature during launch, GSE power was used prior to launch to warm up the accumulator water to the designed
temperature. Multiple thermostats were used to ensure the proper operations of the heaters. Immediately prior to
launch, the GSE power will be disconnected and the accumulator temperature will start to drop.
Figure 3. PSP SACS Block Diagram.
(a) (b)
Figure 4. (a) Accumulator with Heaters and Thermostats, and (b) Accumulator with Mounting Brackets.
International Conference on Environmental Systems
4
2. Dual-Pump Package
The PSP SACS is equipped with one primary pump and one redundant pump. Figures 5(a) and 5(b) show the
pump-head-side and the motor-side views of the dual-pump package, respectively. The lower and the upper tubes
on the pump-head-side are the pump suction and discharge tubes, respectively. The tubes on the motor-side are
for the pump motor hydrodynamic bearings flow. In operation, only one pump will be powered. A shuttle check
valve is placed between the two pump discharge tubes to ensure that the flow from the operational pump is guided
to the discharge tube correctly.
3. Pump Motor Controller
The PSP SACS is equipped with two pump motor controllers. Figures 6(a) and 6(b) show the single pump
motor controller and stacked dual pump motor controllers, respectively. In operation, both controllers will be
powered but only one controller will be active. For the motor speed control, the conventional Hall Effect sensor could
not be used on the pump motor due to the expected high operation temperature of the PSP SACS. Instead, the back
EMF technique was implemented in the motor controller for motor speed control.
4. Solar Array Platens (SAPs)
Figures 7(a) and 7(b) show the cell side of the bare SAP and the assembled solar array wing (SAP populated
with solar cells), respectively. The SAPs are made of titanium alloy with internal minichannel flow passages to
actively cool the solar cells. Figures 8(a) to 8(c) show the back side of the bare SAP, the back side of SAP with
temperature sensors installed, and the back side of SAP covered with MLI, respectively.
5. Cooling System Primary Radiators (CSPRs)
Figures 9(a) to 9(d) show the unpainted exterior side of the CSPR, the painted exterior side of the CSPR, the
interior side of the CSPR with heaters installed, and the interior side of the CSPR with heaters covered with metallic
tape, respectively. Because of the stringent mass requirement for the PSP, the radiator was designed with the
(a) (b)
Figure 5. (a) Pump Head Side View, and (b) Motor Side View of Dual Pump Package
(a) (b)
Figure 6. (a) Single Pump Motor Controller, and (b) Stacked Pump Motor Controllers.

International Conference on Environmental Systems
5
simplest tube-and-face sheet structure. A doubler was placed on the exterior side of each of the flow lines to
enhance the heat transfer capability and to provide the required MMOD protection.
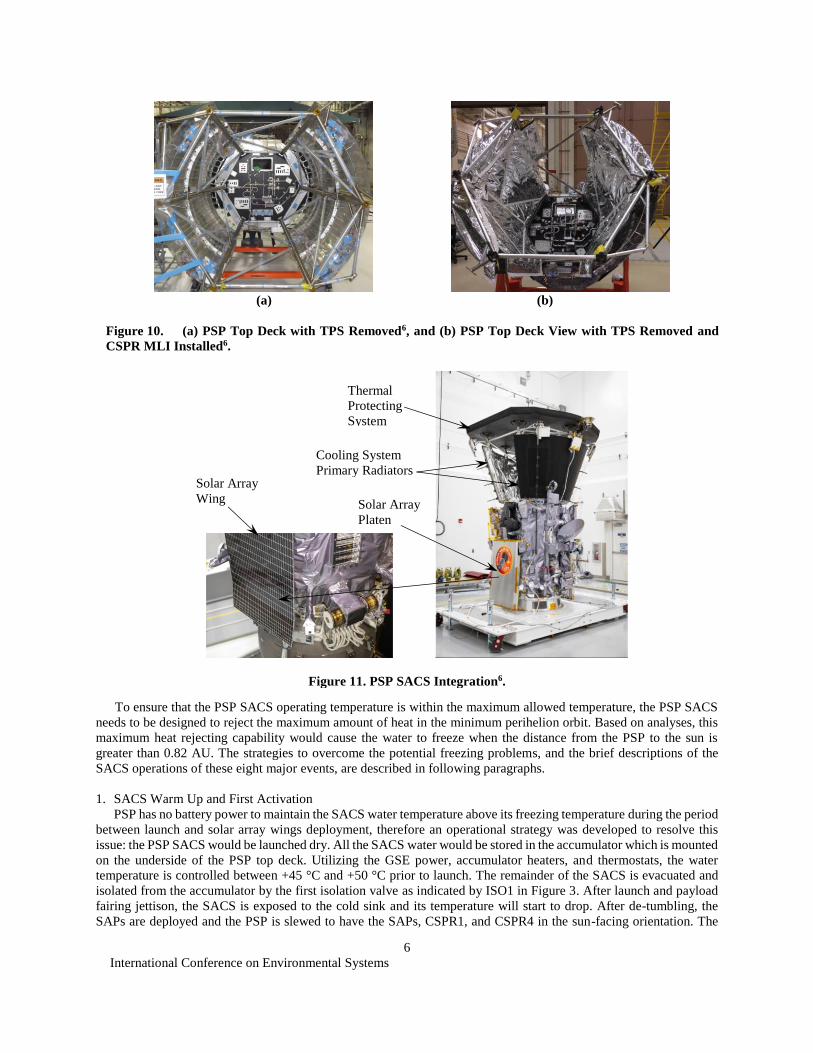
Figure 10(a) shows the top view of the PSP with TPS removed. The interior side of the CSPRs and all the
components installed on the top surface of the top deck have not been insulated by MLI. Figure 10(b) shows the
interior side of the CSPRs that have been covered with MLI. Figure 11 shows the PSP in its integration stage.
IV. PSP Solar Array Cooling System In-Orbit Operations
Eight major SACS operation events were identified based on PSP mission design. Figure 12 shows these eight
major events, the corresponding PSP orbit locations, the PSP in-orbit orientations, and the PSP coordinate systems.
The detailed PSP orientations viewed from the sun and the solar array wings deployment positions for various
operations are shown in Table 1.
(a) (b)
Figures 7. (a) Cell Side of Bare SAP, and (b) Assembled Solar Array Wing (SAP Populated with Solar Cells)6.
(a) (b) (c)
Figure 8. SAP (a) Back Side, (b) Back Side with Temperature Sensors Installed, and (c) Back Side Covered
with MLI.
(a) (b) (c) (d)
Figure 9. (a) CSPR Exterior Side Prior to Painting, (b) Painted CSPR Exterior Side, (c) CSPR Interior Side
with Heaters Installed, and (d) CSPR Interior Side with Heaters Covered with Metallic Tape.
International Conference on Environmental Systems
6
To ensure that the PSP SACS operating temperature is within the maximum allowed temperature, the PSP SACS
needs to be designed to reject the maximum amount of heat in the minimum perihelion orbit. Based on analyses, this
maximum heat rejecting capability would cause the water to freeze when the distance from the PSP to the sun is
greater than 0.82 AU. The strategies to overcome the potential freezing problems, and the brief descriptions of the
SACS operations of these eight major events, are described in following paragraphs.
1. SACS Warm Up and First Activation
PSP has no battery power to maintain the SACS water temperature above its freezing temperature during the period
between launch and solar array wings deployment, therefore an operational strategy was developed to resolve this
issue: the PSP SACS would be launched dry. All the SACS water would be stored in the accumulator which is mounted
on the underside of the PSP top deck. Utilizing the GSE power, accumulator heaters, and thermostats, the water
temperature is controlled between +45 °C and +50 °C prior to launch. The remainder of the SACS is evacuated and
isolated from the accumulator by the first isolation valve as indicated by ISO1 in Figure 3. After launch and payload
fairing jettison, the SACS is exposed to the cold sink and its temperature will start to drop. After de-tumbling, the
SAPs are deployed and the PSP is slewed to have the SAPs, CSPR1, and CSPR4 in the sun-facing orientation. The
Figure 11. PSP SACS Integration6.
(a) (b)
Figure 10. (a) PSP Top Deck with TPS Removed6, and (b) PSP Top Deck View with TPS Removed and
CSPR MLI Installed6.
Cooling System
Primary Radiators
Solar Array
Platen
Thermal
Protecting
System
Solar Array
Wing

International Conference on Environmental Systems
7
solar load heats up the SAPs and CSPRs. Once the SAPs and CSPRs temperatures are above the pre-set temperature,
the water is released from the accumulator to SAPs, CSPR1 and CSPR4, and the pump is activated. At this solar
distance (~1.02 AU), the solar load is not high enough to maintain the SACS temperature at the safe level if the water
were released to all four CSPRs, which is one of the reasons why only two of the four CSPRs are flooded at this stage.
After the first activation is completed, the PSP is slewed to have CSPR2 and CSPR3 in the sun-facing orientation.
With the solar heating, the dry CSPR2 and CSPR3 temperatures are maintained above -150 °C.
2. Trajectory Correction Maneuver (TCM)
In this operation, the PSP is slewed to an orientation such that the TPS is in the normal sunward orientation.
All the CSPRs are facing the cold sink. The temperatures of the wetted CSPR1 and CSPR4 can be maintained in
the safe range by the SAPs solar load. However, if the TCM operation exceeds three hours, the dry CSPR2 and
Figure 12. PSP SACS In-Orbit Major Events, Orbit Location, PSP Orientations, and PSP Coordinate
Systems.
0Aphelion
6Venus Hot Slew
0.82 AU
0.94 AU
~1.02 AU
0.82 AU
Venus0.72 AU
8Perihelion
7Venus Eclipse
5Venus
4Aphelion(Near Earth Orbit)
3 (3-a, 3-b)CSPR2-3 Warm UpCSPR2-3 Activation
SACS Post Launch Activation
1 (1-a, 1-b)CSPR1-4 Warm UpCSPR1-4 Activation
2 (2-a, 2-b)CSPR2-3 Low Temperature PreventionLaunch Correction Maneuver – COLDCSPR2-3 Low Temperature PreventionCSPR3
CSPR4
CSPR2
SAP2
SAP1x
yz
+x: Ram (CSPR1-4 ) Side+y: SAP1 Side+z: TPS Sun Side
Table 1. PSP Orientations and Solar Array Wings Deployment Status4
SPP Orientation
(View From Sun)
Operation1st
Activation
CSPR2-3
Low
Temperature
Prevention
Launch
Correction
Maneuver
2nd
Activation
Cruise &
Solar EncounterHot Slew
Solar Distance (AU) 1.02 > 0.94 ~1 0.94 < 0.7 > 0.7
SAPs Deployment Full Full Full Full Partial Full
StatusSuccess
08/12/2018
Success
08/12/2018Success
Success
09/13/2018
10/31/2018
11/11/2018
International Conference on Environmental Systems
8
CSPR3 temperature can drop down to below -150 °C, which might cause structural damage to the dry CSPRs.
Therefore, the longest TCM time is limited to 3 hours. After the TCM, the PSP is slewed back to have CSPR2 and
CSPR3 in the sun-facing orientation.
3. SACS Second Activation
At 0.94 AU, the PSP slew angle is increased such that the dry CSPR2 and CSPR3 would receive more direct
solar rays. With the increased solar load, the dry CSPR2 and CSPR3 are warmed up to above +20 °C. Once the
designed activation temperature is reached, water is released to the previously isolated CSPR2 and CSPR3.
4. Near Earth Orbit (> 0.82 AU)
The SPP SACS is designed to reject maximum heat load of 6,000 W at minimum perihelion of 9.86 Rs. When
the solar distance is greater than 0.82 AU, the SAPs solar load is not high enough to maintain the SACS operating
temperature above the safe level. Additional energy is needed to increase the SACS operating temperature. To
achieve this goal without consuming battery power, the PSP is slewed to expose CSPR2 and CSPR3 to the sun-
facing direction to absorb the needed additional solar energy.
5. Venus Orbit
During the Venus orbits, the PSP is oriented to have the TPS in the normal sunward orientation. When there is
no Venus eclipse, the SACS will operate at nominal temperature for the regular Venus flybys. This operation
establishes the reference SACS operating temperature for Venus Hot Slew and Venus Eclipse.
6. Venus Orbit Hot Slew
Based on the mission design, the PSP will experience three Venus eclipses in its seven Venus flybys. The
longest eclipse time is about eleven minutes. During these eclipses, the PSP will be powered solely by PSP’s
onboard batteries. With no solar load, the SACS temperature will start to drop. Based on the analyses, with the
PSP TPS in the sun-facing orientation, the SACS stored thermal energy prior to the eclipse is not high enough to
maintain at a safe level for the eleven-minute Venus eclipse. To increase the SACS stored thermal energy, the PSP
is slewed to expose CSPR2 and CSPR3 to the sun. Additional thermal energy is added to the SACS, and its
operating temperature is increased.
7. Venus Eclipse
Three Venus eclipses were identified in the mission design. The SACS needs to maintain its operating
temperature above the minimum safe level for at least eleven minutes.
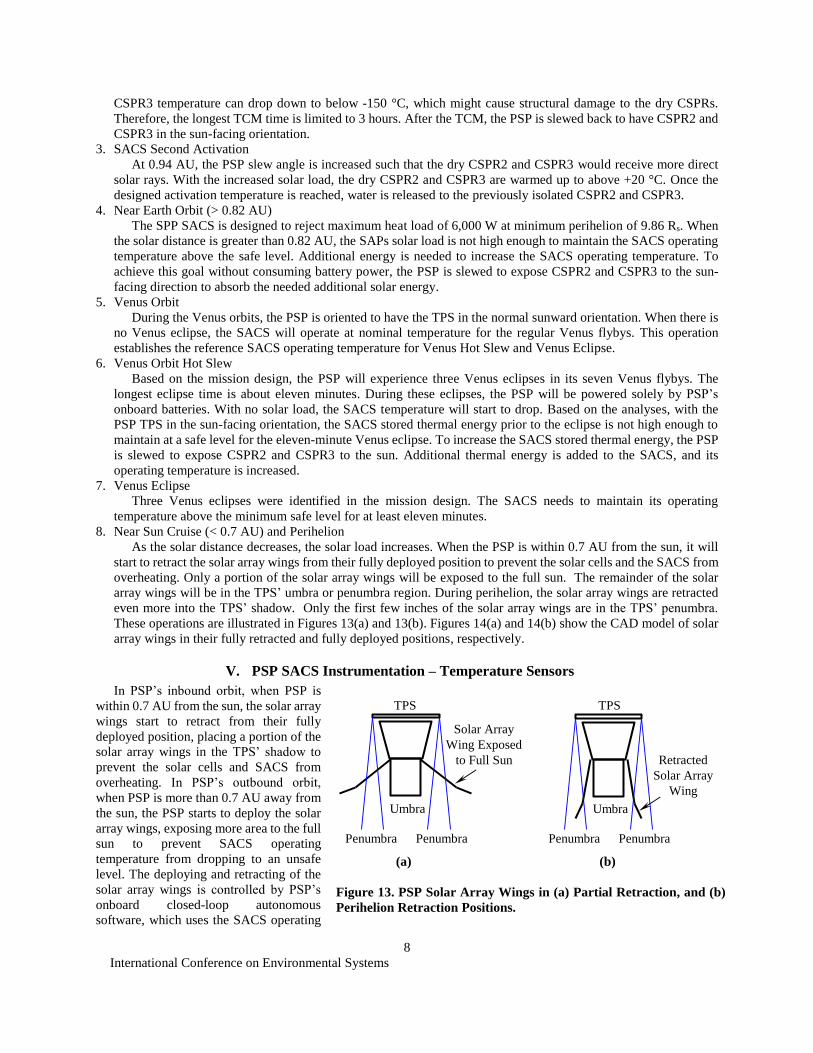
8. Near Sun Cruise (< 0.7 AU) and Perihelion
As the solar distance decreases, the solar load increases. When the PSP is within 0.7 AU from the sun, it will
start to retract the solar array wings from their fully deployed position to prevent the solar cells and the SACS from
overheating. Only a portion of the solar array wings will be exposed to the full sun. The remainder of the solar
array wings will be in the TPS’ umbra or penumbra region. During perihelion, the solar array wings are retracted
even more into the TPS’ shadow. Only the first few inches of the solar array wings are in the TPS’ penumbra.
These operations are illustrated in Figures 13(a) and 13(b). Figures 14(a) and 14(b) show the CAD model of solar
array wings in their fully retracted and fully deployed positions, respectively.
V. PSP SACS Instrumentation – Temperature Sensors
In PSP’s inbound orbit, when PSP is
within 0.7 AU from the sun, the solar array
wings start to retract from their fully
deployed position, placing a portion of the
solar array wings in the TPS’ shadow to
prevent the solar cells and SACS from
overheating. In PSP’s outbound orbit,
when PSP is more than 0.7 AU away from
the sun, the PSP starts to deploy the solar
array wings, exposing more area to the full
sun to prevent SACS operating
temperature from dropping to an unsafe
level. The deploying and retracting of the
solar array wings is controlled by PSP’s
onboard closed-loop autonomous
software, which uses the SACS operating
(a) (b)
Figure 13. PSP Solar Array Wings in (a) Partial Retraction, and (b)
Perihelion Retraction Positions.
Umbra
PenumbraPenumbra
TPS
Solar Array
Wing Exposed
to Full Sun
Umbra
PenumbraPenumbra
TPS
Retracted
Solar Array
Wing

International Conference on Environmental Systems
9
temperature as one of its decision making
parameters. To monitor the health and the
operations of the SACS, and to provide the
information to the autonomous control
algorithm, all the SACS components such
as the accumulator, SAPs, CSPRs, and
flow lines are instrumented with RTDs or
thermocouples.
Figure 15 shows the CAD model of the
SACS components on the top surface of
the PSP top deck. The temperature sensors
are installed on the outlet of the dual-
pump package, the inflow lines to the
SAPs, and the outflow lines from the
SAPs. Figures 16(a) and 16(b) show the
temperature sensors installed on the interior sides of CSPR1 and CSPR4. These temperature sensors cover the
radiators’ structural brackets, the upper manifolds, the lower manifolds, and the outermost flow tubes. Figures 17(a)
and 17(b) show the temperature sensors installed on the interior sides of CSPR2 and CSPR3. The selection of
temperature sensor locations follows the same approach as on CSPR1 and CSPR4. Four primary and four redundant
temperature sensors are also installed on the back side of each SAP to monitor their operating temperatures.
VI. PSP SACS Performance Review -
Early Mission
PSP was launched from Cape Canaveral
on August 12, 2018. This section reviews the
SACS components’ performance and system
responses from launch to first perihelion.
1. Post Launch to 1st Activation
After fairing jettison, the SAPs and
CSPRs were exposed to the cold sink, and
their temperatures started to drop. Figure 18
shows the solar array wings’ back side
temperature from launch to first activation.
After one hour of cooling, the lowest
temperature on the back side of the solar array
wing was -23 °C.
(a) (b)
Figure 14. PSP SACS with Solar Array Wings in (a) Retracted4,
and (b) Deployed Positions4.
Figure 15. PSP SCAS Top Deck Temperature Sensor
Locations5.
Solar Array Outlet Line
(a) (b)
Figure 16. PSP SACS (a) CSPR15 and (b) CSPR4 Temperature Sensor Locations5.

International Conference on Environmental Systems
10
At 08:35 UTC time, the PSP started the warm-
up and first activation sequence. The PSP was
slewed to have the solar array wings in the sun-
facing position (see Table 1 for PSP and SAP
viewed-from-sun orientation). After 32 minutes
of solar warm-up, the SAPs temperature had
exceeded the minimum activation temperature of
+20 °C. At 09:07 UTC time, water was released
from the accumulator to the SAPs, CSPR1, and
CSPR4. The pump was turned on at 09:08 UTC
time. Figures 19(a) and 19(b) show the CSPR1
and CSPR4 manifold temperatures during this
process. The lowest radiator manifold
temperature was -35 °C. After forty-three
minutes solar warm up, the lowest manifold
temperature was above the required minimum
activation temperature of +20 °C. It also can be
seen from Figures 18 and 19 that the solar array
wings were articulated to the sun-facing position
eleven minutes after PSP was slewed to the sun-
facing direction. Almost immediately after
powering up the pump at 09:08, the PSP was slewed to have CSPR1 and CSPR4 in the cold sink-facing direction.
Figure 18. Solar Array Wings Back Side Temperature
History from Launch to First Activation.
Launch
@ 07:31Pump On
@ 09:08
1st Activation
@ 09:07
Solar Array
Wings Warm
Up at @ 08:35
(a) (b)
Figure 17. PSP SACS (a) CSPR35 and (b) CSPR2 Temperature Sensor Locations5.
(a) (b)
Figure 19. CSPR1 and CSPR4 Manifold Temperature History from Launch to the First Activation.
Launch
@ 07:31
1st Activation
@ 09:07
1st Activation
Warm Up
@ 08:24
Launch
@ 07:31
1st Activation
@ 09:07
1st Activation
Warm Up
@ 08:24

International Conference on Environmental Systems
11
Figures 20(a) and 20(b) show the CSPR2 and CSPR3 manifold temperatures from launch to first activation,
respectively. Since CSPR2 and CSPR3 were kept dry until the second activation, their temperature was affected by
their view to the sun only. For one hour of cooling, the manifold temperature dropped from a maximum of +90 °C to
a minimum of -70 °C (indicated by the peaks and valleys of the manifold temperature in Figures 20(a) and 20(b)). To
prevent the temperatures of CSPR2 and CSPR3 from dropping below -150 °C, which might cause CSPRs structure
damage, PSP was slewed to have CSPR2 and CSPR3 in the sun-facing position at an angle between 40° and 45°. The
orientations of PSP, CSPR2 and CSPR3 can be seen in Table 1.
2. Trajectory Correction Maneuvers
There were multiple trajectory correction maneuvers performed on PSP between the first activation and the second
activation. Depending on how the PSP was slewed, the CSPRs were placed in the sun-facing or the cold sink-facing
position. Since the SAPs, CSPR1, and CSPR4 were wetted in the first activation, their temperatures were maintained
at a safe level by the solar load. The temperatures of the dry CSPR2 and CSPR3 would decrease or increase when
they were placed in the cold sink-facing or the sun-facing position, respectively. Figures 21(a) and 21(b) show the
CSPR2 and CSPR3 temperatures in one of the TCMs, with CSPR2 and CSPR3 orientated in an increased sun-facing
angle.
(a) (b)
Figure 21. (a) CSPR2 and (b) CSPR3 Manifold Temperature History during Trajectory Correction.
Maneuver.
(a) (b)
Figure 20. CSPR2 and CSPR3 Manifold Temperature History from Launch to First Activation.
Launch
@ 07:31
1st Activation
@ 09:07
1st Activation Warm
Up @ 08:24
CSPR2 & CSPR3
Low Temperature
Prevention @ 09:22
Launch
@ 07:311st Activation
@ 09:07
1st Activation Warm
Up @ 08:24
CSPR2 & CSPR3
Low Temperature
Prevention @ 09:22

International Conference on Environmental Systems
12
3. Second Activation
As the PSP approached 0.94 AU, the CSPR2 and CSPR3 sun-facing angle was increased to receive more solar
load. The PSP, CSPR2, and CSPR3 orientations can be seen in the fourth column in Table 1. Figures 22(a) and 22(b)
show the CSPR2 and CSPR3 manifold temperatures for this operation, respectively. After approximately sixty minutes
of warm up, the lowest CSPR temperature increased from -10 °C to +65 °C. After CSPR2 and CSPR3 reached the
activation temperature, the water was released into CSPR2 and CSPR3.
4. First Perihelion
When the PSP solar distance is less than 0.7 AU, the PSP autonomous control starts to retract the solar array wings
such that a portion of the wings are in the TPS shadow, thereby reducing the solar load. On Nov. 6, 2018 at 03:27
UTC time, the PSP achieved its first perihelion at a distance of approximately twenty-five million kilometers (fifteen
million miles) from the sun’s surface. Figures 23(a) and 23(b) show the PSP SACS SAP1 and SAP2 water inlet and
outlet temperature for the first perihelion, respectively. The x-axis indicates the date from Oct. 31, 2018 to Nov. 11,
2018. The first y-axis represents the SACS line temperature and the second y-axis represents the PSP solar distance.
The continuous retracting of the solar array wings kept the SAP inlet and outlet temperatures fairly constant. As the
PSP orbited away from the sun, the SAP water temperature started to drop as the solar load decreased. Figure 24(a)
shows the PSP SACS pump outlet temperature. Figure 24(b) shows the rise in water temperature from SAP inlet to
SAP outlet.
(a) (b)
Figure 22. (a) CSPR2 and (b) CSPR3 Manifold Temperature History during Second Activation.
Pre-2nd
Activation
Warm Up
2nd
Activation
Pre-2nd
Activation
Warm Up
2nd
Activation
(a) (b)
Figure 23. PSP SACS (a) SAP1 and (b) SAP2 Temperature History during First Perihelion.
International Conference on Environmental Systems
13
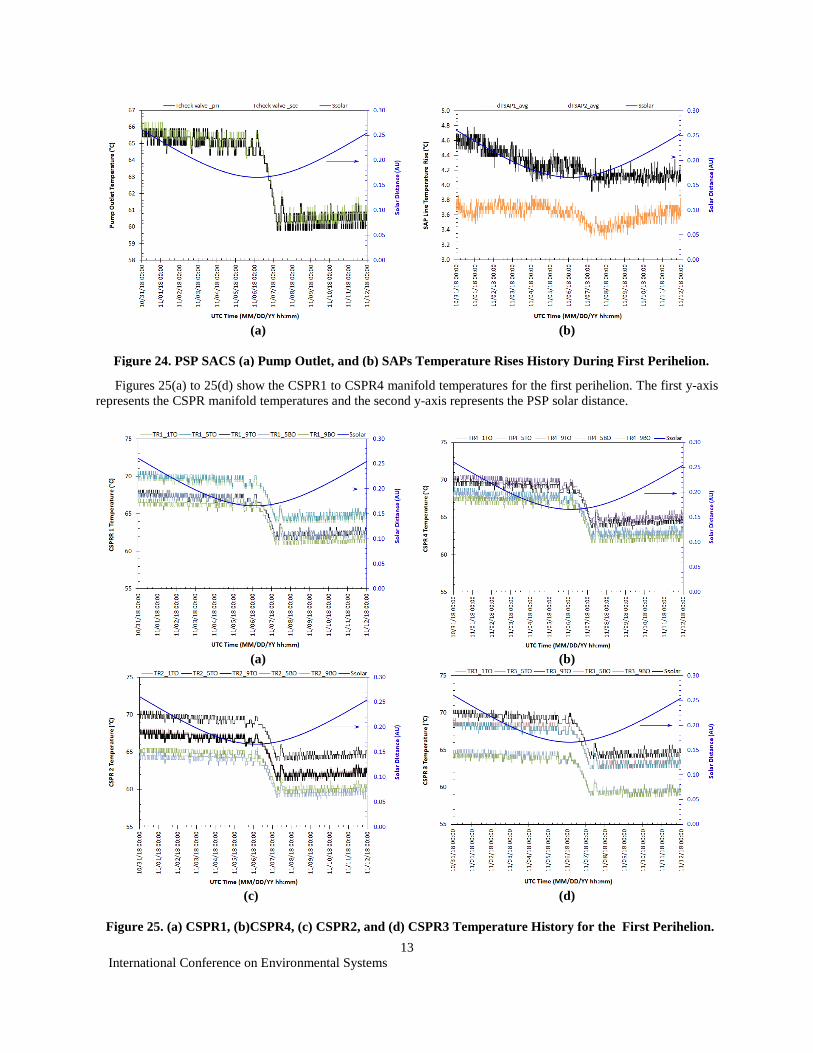
Figures 25(a) to 25(d) show the CSPR1 to CSPR4 manifold temperatures for the first perihelion. The first y-axis
represents the CSPR manifold temperatures and the second y-axis represents the PSP solar distance.
(a) (b)
Figure 24. PSP SACS (a) Pump Outlet, and (b) SAPs Temperature Rises History During First Perihelion.
(a) (b)
(c) (d)
Figure 25. (a) CSPR1, (b)CSPR4, (c) CSPR2, and (d) CSPR3 Temperature History for the First Perihelion.
International Conference on Environmental Systems
14
5. PSP SACS Performance
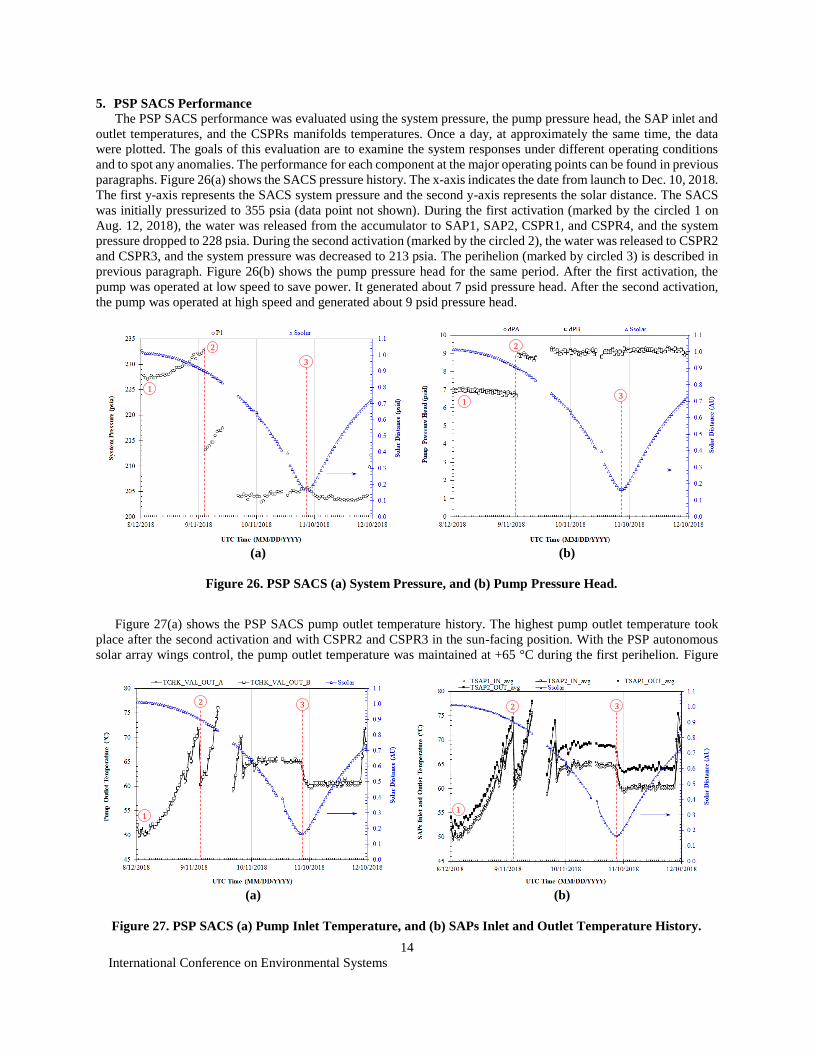
The PSP SACS performance was evaluated using the system pressure, the pump pressure head, the SAP inlet and
outlet temperatures, and the CSPRs manifolds temperatures. Once a day, at approximately the same time, the data
were plotted. The goals of this evaluation are to examine the system responses under different operating conditions
and to spot any anomalies. The performance for each component at the major operating points can be found in previous
paragraphs. Figure 26(a) shows the SACS pressure history. The x-axis indicates the date from launch to Dec. 10, 2018.
The first y-axis represents the SACS system pressure and the second y-axis represents the solar distance. The SACS
was initially pressurized to 355 psia (data point not shown). During the first activation (marked by the circled 1 on
Aug. 12, 2018), the water was released from the accumulator to SAP1, SAP2, CSPR1, and CSPR4, and the system
pressure dropped to 228 psia. During the second activation (marked by the circled 2), the water was released to CSPR2
and CSPR3, and the system pressure was decreased to 213 psia. The perihelion (marked by circled 3) is described in
previous paragraph. Figure 26(b) shows the pump pressure head for the same period. After the first activation, the
pump was operated at low speed to save power. It generated about 7 psid pressure head. After the second activation,
the pump was operated at high speed and generated about 9 psid pressure head.
Figure 27(a) shows the PSP SACS pump outlet temperature history. The highest pump outlet temperature took
place after the second activation and with CSPR2 and CSPR3 in the sun-facing position. With the PSP autonomous
solar array wings control, the pump outlet temperature was maintained at +65 °C during the first perihelion. Figure
(a) (b)
Figure 27. PSP SACS (a) Pump Inlet Temperature, and (b) SAPs Inlet and Outlet Temperature History.
1
2 3
1
2 3
(a) (b)
Figure 26. PSP SACS (a) System Pressure, and (b) Pump Pressure Head.
1
2
3
1
2
3
International Conference on Environmental Systems
15
27(b) shows the SAPs inlet and outlet water temperatures, which followed the same trend as that of the pump outlet
temperature.
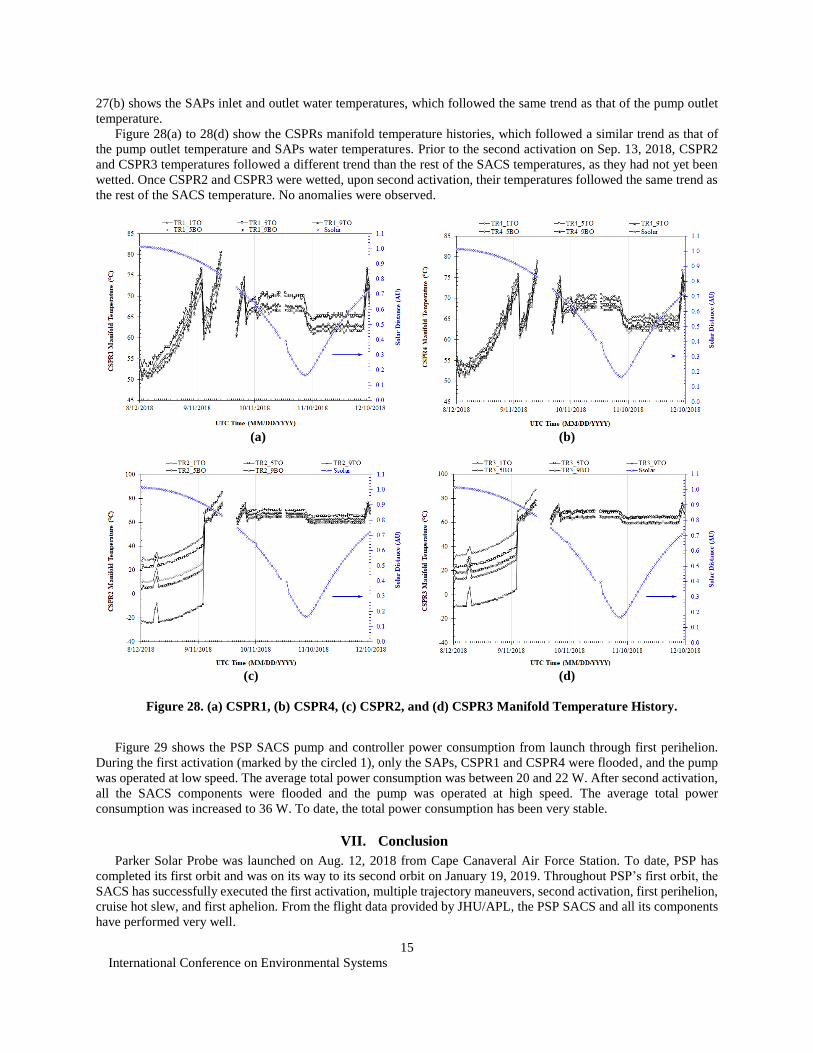
Figure 28(a) to 28(d) show the CSPRs manifold temperature histories, which followed a similar trend as that of
the pump outlet temperature and SAPs water temperatures. Prior to the second activation on Sep. 13, 2018, CSPR2
and CSPR3 temperatures followed a different trend than the rest of the SACS temperatures, as they had not yet been
wetted. Once CSPR2 and CSPR3 were wetted, upon second activation, their temperatures followed the same trend as
the rest of the SACS temperature. No anomalies were observed.
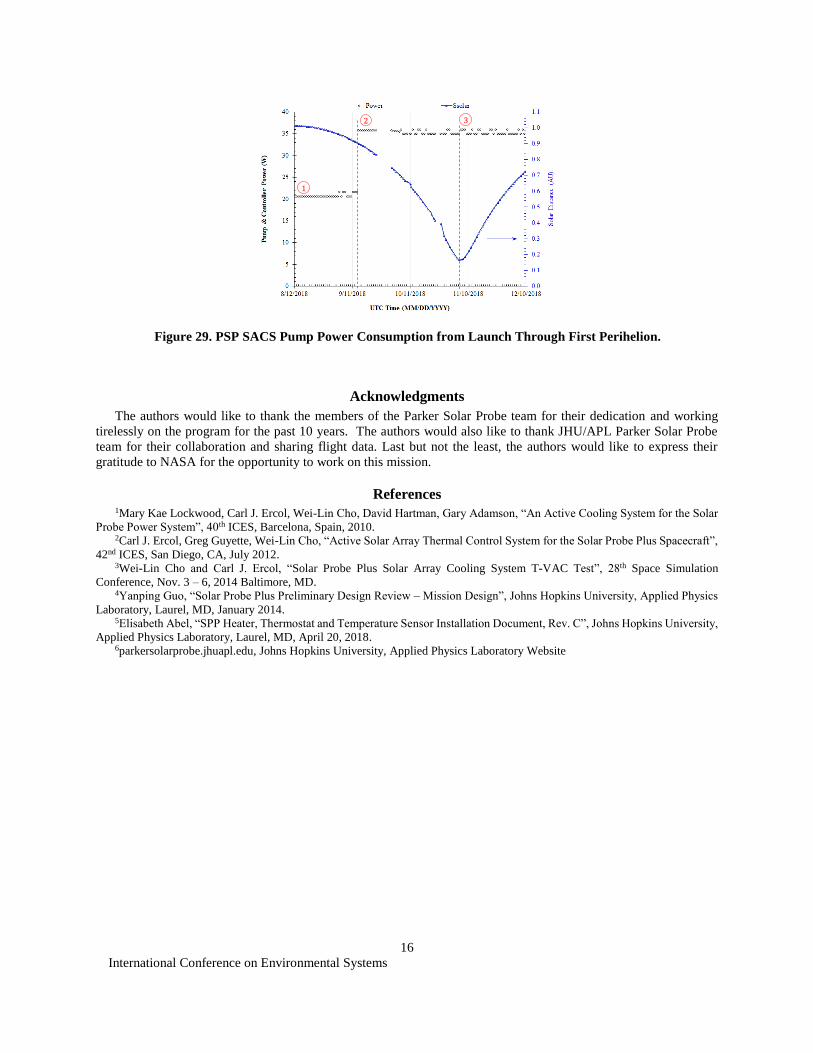
Figure 29 shows the PSP SACS pump and controller power consumption from launch through first perihelion.
During the first activation (marked by the circled 1), only the SAPs, CSPR1 and CSPR4 were flooded, and the pump
was operated at low speed. The average total power consumption was between 20 and 22 W. After second activation,
all the SACS components were flooded and the pump was operated at high speed. The average total power
consumption was increased to 36 W. To date, the total power consumption has been very stable.
VII. Conclusion
Parker Solar Probe was launched on Aug. 12, 2018 from Cape Canaveral Air Force Station. To date, PSP has
completed its first orbit and was on its way to its second orbit on January 19, 2019. Throughout PSP’s first orbit, the
SACS has successfully executed the first activation, multiple trajectory maneuvers, second activation, first perihelion,
cruise hot slew, and first aphelion. From the flight data provided by JHU/APL, the PSP SACS and all its components
have performed very well.
(a) (b)
(c) (d)
Figure 28. (a) CSPR1, (b) CSPR4, (c) CSPR2, and (d) CSPR3 Manifold Temperature History.
International Conference on Environmental Systems
16
Acknowledgments
The authors would like to thank the members of the Parker Solar Probe team for their dedication and working
tirelessly on the program for the past 10 years. The authors would also like to thank JHU/APL Parker Solar Probe
team for their collaboration and sharing flight data. Last but not the least, the authors would like to express their
gratitude to NASA for the opportunity to work on this mission.
References 1Mary Kae Lockwood, Carl J. Ercol, Wei-Lin Cho, David Hartman, Gary Adamson, “An Active Cooling System for the Solar
Probe Power System”, 40th ICES, Barcelona, Spain, 2010. 2Carl J. Ercol, Greg Guyette, Wei-Lin Cho, “Active Solar Array Thermal Control System for the Solar Probe Plus Spacecraft”,
42nd ICES, San Diego, CA, July 2012. 3Wei-Lin Cho and Carl J. Ercol, “Solar Probe Plus Solar Array Cooling System T-VAC Test”, 28th Space Simulation
Conference, Nov. 3 – 6, 2014 Baltimore, MD. 4Yanping Guo, “Solar Probe Plus Preliminary Design Review – Mission Design”, Johns Hopkins University, Applied Physics
Laboratory, Laurel, MD, January 2014. 5Elisabeth Abel, “SPP Heater, Thermostat and Temperature Sensor Installation Document, Rev. C”, Johns Hopkins University,
Applied Physics Laboratory, Laurel, MD, April 20, 2018. 6parkersolarprobe.jhuapl.edu, Johns Hopkins University, Applied Physics Laboratory Website
Figure 29. PSP SACS Pump Power Consumption from Launch Through First Perihelion.
1
2 3