on-orbit degradation of solar instruments€¦ · on-orbit degradation of solar instruments ......
TRANSCRIPT

Solar PhysDOI 10.1007/s11207-013-0290-z
On-Orbit Degradation of Solar Instruments
A. BenMoussa · S. Gissot · U. Schühle · G. Del Zanna · F. Auchère · S. Mekaoui ·A.R. Jones · D. Walton · C.J. Eyles · G. Thuillier · D. Seaton · I.E. Dammasch ·G. Cessateur · M. Meftah · V. Andretta · D. Berghmans · D. Bewsher · D. Bolsée ·L. Bradley · D.S. Brown · P.C. Chamberlin · S. Dewitte · L.V. Didkovsky ·M. Dominique · F.G. Eparvier · T. Foujols · D. Gillotay · B. Giordanengo · J.P. Halain ·R.A. Hock · A. Irbah · C. Jeppesen · D.L. Judge · M. Kretzschmar · D.R. McMullin ·B. Nicula · W. Schmutz · G. Ucker · S. Wieman · D. Woodraska · T.N. Woods
Received: 19 September 2012 / Accepted: 27 March 2013© Springer Science+Business Media Dordrecht 2013
Abstract We present the lessons learned about the degradation observed in several spacesolar missions, based on contributions at the Workshop about On-Orbit Degradation of Solar
A. BenMoussa · D. Bolsée · B. NiculaSolar Terrestrial Centre of Excellence, 1180 Brussels, Belgium
A. BenMoussae-mail: [email protected]
A. BenMoussa · S. Gissot (�) · D. Seaton · I.E. Dammasch · D. Berghmans · M. Dominique ·B. Giordanengo · B. NiculaRoyal Observatory of Belgium, 1180 Brussels, Belgiume-mail: [email protected]
U. SchühleMax-Planck-Insitut für Sonnensystemforschung, 37191 Katlenburg-Lindau, Germany
G. Del ZannaDAMTP – Centre for Mathematical Sciences, University of Cambridge, Wilberforce Road, CambridgeCB3 0WA, UK
F. AuchèreInstitut Astrophysique Spatiale, CNRS-Université Paris-Sud 11, 91405 Orsay, France
S. MekaouiEuropean Commission – Joint Research Centre, Ispra, Italy
S. Mekaoui · S. DewitteRoyal Meteorological Institute of Belgium, 1180 Brussels, Belgium
A.R. Jones · F.G. Eparvier · C. Jeppesen · G. Ucker · D. Woodraska · T.N. WoodsLaboratory for Atmospheric and Space Physics, University of Colorado, Boulder, CO, USA
D. Walton · L. BradleyMullard Space Science Laboratory, Holmbury St. Mary, Dorking, Surrey, RH5 6NT, UK

A. BenMoussa et al.
and Space Weather Instruments that took place at the Solar Terrestrial Centre of Excellence(Royal Observatory of Belgium) in Brussels on 3 May 2012. The aim of this workshopwas to open discussions related to the degradation observed in Sun-observing instrumentsexposed to the effects of the space environment. This article summarizes the various lessonslearned and offers recommendations to reduce or correct expected degradation with the goalof increasing the useful lifespan of future and ongoing space missions.
Keywords Degradation · Solar instruments · Space environment · Calibration ·Contamination · Solar mission
1. Introduction
Investigating and analyzing the degradation of space instruments are crucial parts of achiev-ing the scientific goals of all such instruments. Remote–sensing instrumentation exposed to
C.J. EylesSpace Science and Technology Department, Rutherford Appleton Laboratory, Chilton, Didcot, UK
C.J. EylesGrupo de Astronomia y Ciencias del Espacio, ICMUV, Universidad de Valancia, Valencia, Spain
G. Thuillier · M. Meftah · T. Foujols · A. IrbahLATMOS-CNRS UMR 8190, Université Paris VI, Université de Versailles, Versailles, France
G. Cessateur · W. SchmutzPMOD/WRC, Dorfstr 33, Davos, 7260, Switzerland
V. AndrettaINAF, Osservatorio Astronomico di Capodimonte, Salita Moiariello, 16, 80141 Naples, Italy
D. Bewsher · D.S. BrownJeremiah Horrocks Institute, University of Central Lancashire, Preston, UK
D. Bolsée · D. GillotayBelgium Institute for Space Aeronomy, 1180 Brussels, Belgium
P.C. ChamberlinGoddard Space Flight Center, Greenbelt, MD, USA
L.V. Didkovsky · D.L. Judge · S. WiemanSpace Sciences Center, University of Southern California, Los Angeles, CA, USA
J.P. HalainCentre Spatial de Liège, Université de Liège, Liège Science Park, 4013 Angleur, Belgium
R.A. HockAir Force Research Laboratory, Kirtland Air Force Base, Alburqueque, NM, USA
M. KretzschmarLPC2E/CNRS, (UMR 7328), Université d’Orléans, 45071 Orléans cedex 2, France
D.R. McMullinSpace Systems Research Corporation, 1940 Duke Street 200, Alexandria, VA 22314, USA

On-Orbit Degradation
Table 1 Solar space instruments used. The acronyms used in this table are defined in their correspondingsection.
Mission/instrument Telescope (T)Spectrometer (S)Radiometer (R)
Spectral range [nm] Mission length(. . . – present)
SOHO/SUMER T–S 66 – 161 Dec. 1995
SOHO/CDS S 15 – 79 Dec. 1995
SOHO/EIT T 17 – 30 Dec. 1995
SOHO/CELIAS-SEM R–S 0.1 – 50 Dec. 1995
SOHO/DIARAD R Total Solar Irradiance Dec. 1995
Hinode/EIS T–S 17 – 29 Sep. 2006
STEREO/HI1A HI1B T 630 – 730 Oct. 2006
ISS/SOLSPEC R–S 165 – 3080 Feb. 2008
PROBA2/SWAP T 17.4 Nov. 2009
PROBA2/LYRA R 0.1 – 70, 121.6, 190 – 222 Nov. 2009
SDO/EVE: EPS, MEGSA1-A2-B-P R–S 0.1 – 105, 121.6 Feb. 2010
Picard/PREMOS R 210, 215, 266, 535, 607, 782 June 2010
Picard/SODISM T 215, 393, 535, 607, 782 June 2010
the space environment usually degrades due to the harsh environment in which the instru-ments are expected to operate. Solar instruments – telescopes, spectrographs and radiome-ters – are particularly vulnerable because their optical elements are exposed to unshieldedsolar radiation. For example, these instruments have historically suffered substantial degra-dation due to a combination of solar irradiation and instrumental contamination that cancause polymerization of organic material and, subsequently, irreversible deposition of thismaterial on the instruments’ optical surfaces.
Different methods and approaches have been used to assess and monitor the evolutionof these instruments’ degradation. To reach a better understanding of how to both monitorand study this degradation, the Solar Terrestrial Centre of Excellence (STCE) at the RoyalObservatory of Belgium organized a workshop on this subject on 3 May 2012 in Brussels,Belgium. Representatives from several active space-based solar instruments (see Table 1)contributed to this workshop.
In this article we present analyses of these instruments’ degradation (or non-degradation),the causes of degradation when they could be identified, the consequences of degradation,and methods by which the impact of degradation can be mitigated. We also provide a sum-mary of the lessons learned and recommendations for best practices with the hope that thisinformation will help scientists and engineers to prevent – or cope with – degradation ofactive and future space-based solar instruments.
2. Solar Instruments Onboard SOHO
The Solar and Heliospheric Observatory (SOHO: Fleck, Domingo, and Poland, 1995) is asuccessful solar mission that includes – among other instruments – radiometers, spectrom-eters, and an extreme-ultraviolet (EUV) imager. It has operated for more than 16 years atthe Lagrangian L1 point. SOHO was launched in December 1995 and began routine opera-tions in January 1996. At the beginning of the development phase of SOHO, the degradation

A. BenMoussa et al.
processes were analyzed and appropriate procedures and design concepts were developed toeliminate them. During the design phase of SOHO’s instruments and spacecraft, a meticu-lous cleanliness program was implemented to control molecular and particle contamination(Pauluhn, Huber, and von Steiger, 2002). A substantial part of the success of SOHO is due tothe thoughtful design of the spacecraft, payload module, instruments, and a strict material-selection process.
2.1. Cleanliness and Calibration Stability of the SUMER Spectrograph
Among the suite of remote-sensing instruments onboard SOHO are three spectrographs op-erating in the vacuum and extreme ultraviolet (VUV–EUV) range. The Solar UltravioletMeasurements of Emitted Radiation (SUMER) instrument is a telescope/spectrometer. Thedetailed design has been described by Wilhelm et al. (1995). In brief, it consists of a singletelescope mirror and a spectrograph. The reflective optics, the telescope mirror, the colli-mator and wavelength scan mirror, and the grating are made of silicon carbide. The spec-trograph carries two detectors with an instantaneous spectral range of 4 nm in first order(the second-order spectrum is superposed). A wavelength-scanning mechanism selects thedisplayed spectral band in the range from 66 up to 161 nm.
2.1.1. Cleanliness Program
During the design phase of SUMER, a thorough cleanliness control program was imple-mented (Schühle, 1993). The cleanliness requirements were estimated by model calculationsof contaminants on the optical system. Particle fallout rates in cleanrooms published at thattime were used to calculate the exposure time of the flight hardware inside the cleanroomenvironments. With the results of the studies, a cleanliness-control plan was established thatcontains the cleanliness requirements, handling practices for all hardware, as well as thecontrol procedures and verification of cleanliness. The main features of the cleanliness pro-gram, however, were cleanliness design, material selection, cleaning, and bake-out for spaceconditioning.
2.1.2. Cleanliness Design
The SUMER structural housing is made of aluminum that was thoroughly cleaned and her-metically sealed when it was assembled. Only an aperture-door mechanism was able to openthe optical compartment to the environment at any time of the assembly, integration, tests,and validation phases. The spring-loaded door lid provided the functionality of a valve thatopens during launch for depressurization. A transparent window inside the door lid providedheat input by the Sun to the primary mirror when the door was closed. In this way, the pri-mary mirror stays the hottest element inside the instrument. Internally, the telescope andspectrograph form two compartments separated by walls containing the spectrograph en-trance slit. The two compartments were connected by large venting holes to avoid a pressuredifference between them and to prevent gas flowing through the slit. There are as few elec-tronic components inside the housing as possible. In addition to the optics, the mechanicaldriving mechanisms contain ultra-high vacuum motors and position encoders, temperaturesensors, and limit switches. To deflect the majority of the solar-wind particles, deflectorplates are implemented inside the entrance baffle, far ahead of the mirror.

On-Orbit Degradation
2.1.3. Material Selection
It was established that the usual outgassing properties of known space-qualified materials– the Total Mass Loss (TML) and the Collected Volatile Condensable Materials (CVCM)values – were not adequate to determine whether outgassing of organic material was suf-ficiently low to be acceptable. A contamination study was carried out to simulate the de-position of organic material and its polymerisation under vacuum and UV radiation. Inaddition, outgassing investigations of materials and components were conducted with gas-chromatography/mass-spectrometry (GC/MS) analysis to determine the outgassing of or-ganic species as a function of temperature and time. The species were enclosed in a glassvial that allows the specimen to be heated in an oven and purged by clean gas over ex-tended periods of time, while occasionally gas samples were drawn for GC/MS analysis.This procedure was particularly useful as it revealed either the rejection or the acceptanceof the component. The specimens were heated to the highest temperature compatible withtheir specifications and the duration was extended until acceptance was achieved, usuallywhen the outgassing of organic molecules was near the detection limit. Since this methodis more sensitive than residual-gas analysis under high vacuum, the bake-out procedure wasdesigned in a similar way.
2.1.4. Cleaning and Bake-out
Generally, all hardware used for assembly was precision-cleaned before entering the clean-room facilities. The cleaning procedures included, with only a few exceptions, an ultrasonicbath with detergent and ultra-clean water. Solvent-compatible items were also cleaned withisopropyl alcohol and acetone. A special procedure was applied to cables before produc-tion of harnesses with methyl–ethyl ketone (now replaced by a special detergent) to removepossible residues of silicons inside the cable insulation. After wet cleaning, items selectedfor integration were subjected to a bake-out procedure and transferred to the clean area indouble bags. The bake-out oven consists of a chamber with a controlled heating system andvacuum port for pump-out. All items were baked at the highest temperature compatible withthe material of construction. Subassemblies were either baked at component level beforeassembly or, if subjected to an outgassing test as described above, baked at the tempera-ture and duration determined by the test. This bake-out procedure replaced the usual spaceconditioning under high vacuum with heating and collecting contaminants at cold plates.
To guarantee the cleanliness of the six motor-driven mechanisms on SUMER, only drylubrication of bearings with sputtered molybdenum disulphide (MoS2) was considered ac-ceptable. The motor coils were baked in an oven under clean gas purging (N2 grade 5.0) at200 ◦C for 48 hours before assembly of the component.
2.1.5. Ground Calibration
The responsivity of SUMER was characterized in the laboratory with a transfer sourcestandard-calibrated by the Physikalisch-Technische Bundesanstalt (PTB) at the Berlin Elec-tron Storage Ring for Synchrotron Radiation (BESSY II: Hollandt et al., 1996). The transfersource is based on a hollow cathode (HC) discharge source, operated with inert gases todeliver a number of spectral lines inside the SUMER spectral range. However, the rangecould not be covered continuously, which left some gaps in the calibrated wavelength range(Schühle et al., 1994). Recently, the PTB has opened an electron storage ring, the MetrologyLight Source (MLS: Klein et al., 2008 and Gottwald et al., 2010), which operates with acontinuous spectrum and with capabilities to calibrate space instruments.

A. BenMoussa et al.
Figure 1 Common observations of the Mg X spectral-line emission at 62.4 nm in quiet-Sun areas by CDS(asterisks) and SUMER (squares) during the first years of SOHO operations (Pauluhn et al., 2001).
2.1.6. Onboard Calibration Tracking
It is very important to track any degradation during the time of the mission. For SUMER itwas possible to repeatedly observe UV-bright stars that come into the field of view (FOV)every year (Lemaire, 2002). Another way of tracking is observating the radiance of quiet-Sun areas that are unaffected by active regions with strong variability. The radiance of thesequiet-Sun areas has been shown to vary only slowly over time periods of a solar-activity cy-cle (Schühle et al., 1998). By observing the same objects simultaneously in common wave-length ranges, this method can be used for intercalibration between instruments. This hasbeen done successfully over several years between UV instruments on SOHO (Pauluhn, Hu-ber, and von Steiger, 2002). The Coronal Diagnostic Spectrometer (CDS) and SUMER spec-trometers have made such common observations from the start of their operational phases.Figure 1 (taken from Pauluhn et al., 2001) clearly depicts that by common observation ofthe quiet Sun, the degradation of the two instruments can be well accounted for, such thatthe remaining variation of the signal is not a systematic error of the instrumental throughput.This common intercalibration procedure, however, does not take into account longer-termeffects on the CDS responsivity, which are discussed in the following section.
2.2. The Calibration of the CDS
The CDS is composed of a normal incidence spectrometer (NIS) and a grazing inci-dence spectrometer (GIS: Harrison et al., 1995). The two instruments share a Wolter–Schwarzschild type II grazing-incidence telescope, a scan mirror, and a set of different slits.There is no entrance filter. The GIS uses a spherical grating that disperses the incident lightinto four spiral anode (SPAN) microchannel plate (MCP) detectors.
The NIS is composed of two stigmatic toroidal gratings that disperse the radiation intotwo wavebands (NIS 1: 30.8 – 37.9 nm and NIS 2: 51.3 – 63.3 nm). The NIS detector com-prises an MCP Philips model G12-33 with pores of 12 µm diameter. The EUV photons are

On-Orbit Degradation
converted into electrons via the photoelectric effect on the front face of the MCP, and arethen amplified at about 756 V. The electron cloud is proximity-focused onto a P-20 phos-phor coated on a fiber-optic output window. The visible phosphorescence is focused viaa lens onto a Tektronix 1024 × 1024 charge-coupled device (CCD) with square pixels of21 µm. The CCD is running cold, at a nominal temperature of −70 °C.
2.2.1. Calibration
About two years before launch, the CDS instrument was calibrated end-to-end at the Ruther-ford Appleton Laboratory (RAL) against a “transfer” source that was absolutely calibratedusing synchrotron emission. Details can be found in Lang et al. (2000). Immediately afterlaunch, it became obvious that considerable departures (factors of two to three) from thepre-launch calibration were present. On 15 May 1997, a National Aeronautics and SpaceAdministration (NASA)/Laboratory for Atmospheric and Space Physics (LASP) rocket car-ried an EUV Grating Spectrograph (EGS) that had been calibrated against synchrotron emis-sion. On the same day, NIS measurements were performed and compared to the EGS ones(Brekke et al., 2000), providing one key element in the long history of the in-flight cali-bration; see Del Zanna et al. (2010) for a summary. Further information on the NIS 1 wasobtained with the Solar EUV Rocket Telescope and Spectrograph (SERTS)-97 rocket flight(Del Zanna et al., 2001). The only in-flight radiometric calibration of all nine CDS chan-nels (three second-order) was obtained by Del Zanna et al. (2001) with the line-ratio tech-nique. The various NIS first-order calibrations were consistent, within 30 % to 50 %, withthe SUMER calibration, as discussed during two ISSI workshops (Lang et al., 2002), andas summarized in the previous section. Additional EGS rocket flights were flown in 2002,2003, and 2004, but were not useful for the CDS calibration. An update to the CDS radio-metric calibration was instead made possible by two Extreme-Ultraviolet Normal-IncidenceSpectrograph (EUNIS) rocket-flights that took place in 2006 and 2007 (Wang et al., 2011).
2.2.2. Detector Degradation and Long-Term Aging
MCPs are known to suffer a drop in gain owing to the exposure to solar radiation. For theNIS, this results in a depression at the core of the lines caused by exposures with the two-arcsec or four-arcsec slits (the so-called “burn-in” of the lines). This effect can be correctedfor by looking at the burn-in in 90-arcsec slit exposures of the quiet-Sun (Thompson, 2000).
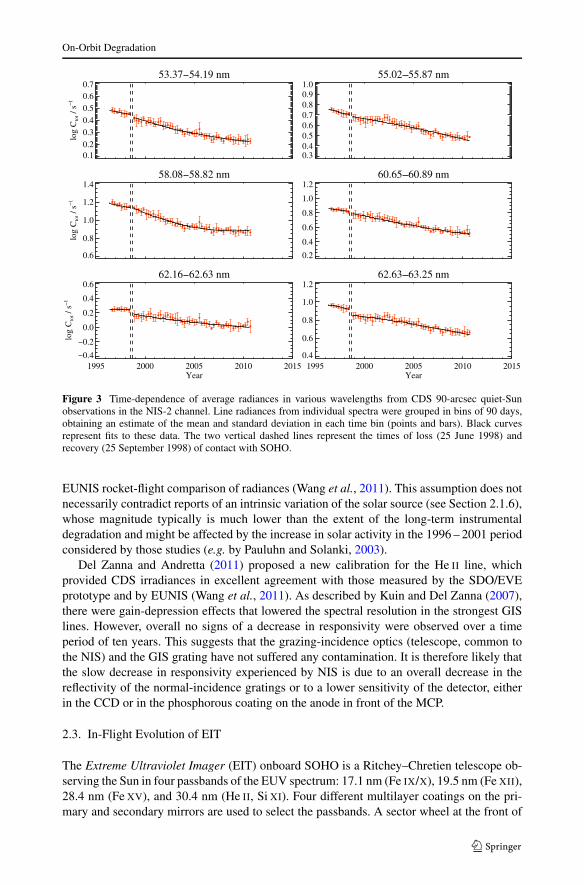
Figure 2 shows such a burn-in effect in a 13-year-long series of near simultaneous spectrataken with the narrow two-arcsec and the wide 90-arcsec slits.
It was thought that exposing with the 90-arcsec slit would significantly reduce (by morethan a factor of three over 13 years) the responsivity at the wavelengths where the strongerlines in the spectra are present (Thompson, 2000, 2006). However, as shown in a series ofarticles (see references in Del Zanna et al., 2010), this assumption turned out to be incorrect,because an overall decrease across all wavelengths of about a factor of two in 13 years wasmeasured. Some wavelength-dependent effects turned out to be minor.
The overall decrease and its magnitude over more than 13 years of monitoring are readilyapparent in the spectra shown in Figure 2. Note in the top panel of Figure 2 the discontinuitydue to the temporary loss of contact with SOHO that occurred in June through September1998. The resulting exposure to rather extreme and uncontrolled environmental conditionsduring that time interval caused significant changes in the characteristics of CDS, as of mostother SOHO instruments. Figure 3 illustrates this effect on the NIS sensitivities and showsthe measured aging in various wavelengths of the NIS 2 channel from 1996 to September

A. BenMoussa et al.
Figure 2 Top: the 13 years of CDS 90 arcsec NIS 2 data over the quiet Sun; the last spectrum shown herewas taken on 7 April 2009. Middle: A sample of averaged 90-arcsec spectra at three different epochs. Bottom:The corresponding two-arcsec spectra. Notice the overall decrease in the count rates [C] in the two-arcsecand 90-arcsec spectra, and the marked decrease of count rates corresponding to the core of strong lines suchas the He I 58.4 nm line. Figure adapted from Del Zanna et al. (2010).
2010. The coefficients of the fits to these data have been adopted as the default long-termradiometric correction in the latest version of the CDS analysis software. Figure 3 is similarto Figure 4 of Del Zanna et al. (2010), but shows data processed after the publication of thatarticle, until September 2010. The curves shown in Figure 3 therefore reflect the most up-to-date estimates of the long-term variation of the CDS/NIS sensitivity, as currently includedin the CDS analysis software.
The characterization of the long-term aging was found by Del Zanna et al. (2010) as-suming that the quiet-Sun radiances in low-temperature lines are constant over time. Somesupport for this assumption comes from ground-based measurements of equivalent widthsof photospheric and chromospheric lines (e.g. Ca II) over the quiet Sun (often Sun-center),which have provided firm evidence that the basal photospheric–chromospheric emission hasnot changed over the past three solar cycles (Livingston et al., 2007, 2010).
The validity of this assumption has been confirmed by the overall agreement foundbetween the CDS and the Solar Dynamics Observatory/EUV Variability Experiment(SDO/EVE) 2008 prototype irradiances (Del Zanna et al., 2010) and by a direct CDS-
On-Orbit Degradation
Figure 3 Time-dependence of average radiances in various wavelengths from CDS 90-arcsec quiet-Sunobservations in the NIS-2 channel. Line radiances from individual spectra were grouped in bins of 90 days,obtaining an estimate of the mean and standard deviation in each time bin (points and bars). Black curvesrepresent fits to these data. The two vertical dashed lines represent the times of loss (25 June 1998) andrecovery (25 September 1998) of contact with SOHO.
EUNIS rocket-flight comparison of radiances (Wang et al., 2011). This assumption does notnecessarily contradict reports of an intrinsic variation of the solar source (see Section 2.1.6),whose magnitude typically is much lower than the extent of the long-term instrumentaldegradation and might be affected by the increase in solar activity in the 1996 – 2001 periodconsidered by those studies (e.g. by Pauluhn and Solanki, 2003).
Del Zanna and Andretta (2011) proposed a new calibration for the He II line, whichprovided CDS irradiances in excellent agreement with those measured by the SDO/EVEprototype and by EUNIS (Wang et al., 2011). As described by Kuin and Del Zanna (2007),there were gain-depression effects that lowered the spectral resolution in the strongest GISlines. However, overall no signs of a decrease in responsivity were observed over a timeperiod of ten years. This suggests that the grazing-incidence optics (telescope, common tothe NIS) and the GIS grating have not suffered any contamination. It is therefore likely thatthe slow decrease in responsivity experienced by NIS is due to an overall decrease in thereflectivity of the normal-incidence gratings or to a lower sensitivity of the detector, eitherin the CCD or in the phosphorous coating on the anode in front of the MCP.
2.3. In-Flight Evolution of EIT
The Extreme Ultraviolet Imager (EIT) onboard SOHO is a Ritchey–Chretien telescope ob-serving the Sun in four passbands of the EUV spectrum: 17.1 nm (Fe IX/X), 19.5 nm (Fe XII),28.4 nm (Fe XV), and 30.4 nm (He II, Si XI). Four different multilayer coatings on the pri-mary and secondary mirrors are used to select the passbands. A sector wheel at the front of
A. BenMoussa et al.
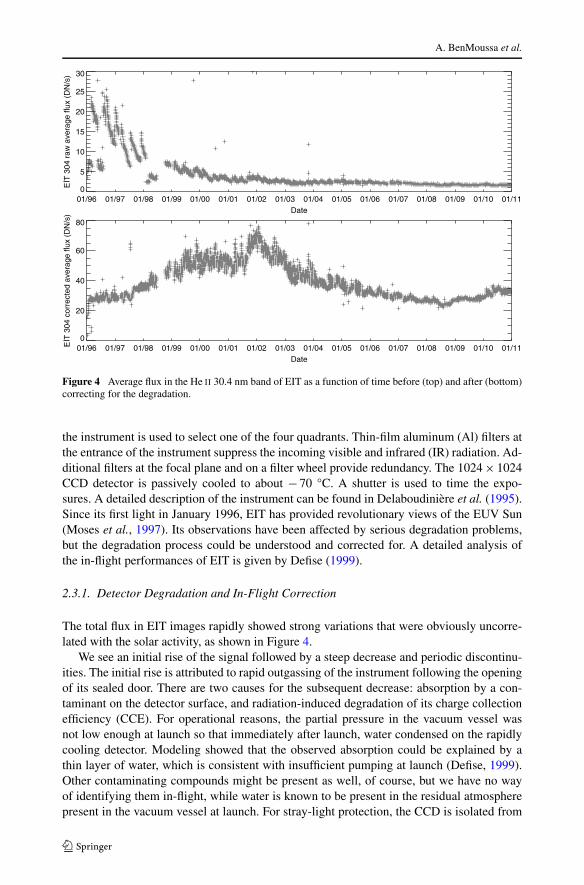
Figure 4 Average flux in the He II 30.4 nm band of EIT as a function of time before (top) and after (bottom)correcting for the degradation.
the instrument is used to select one of the four quadrants. Thin-film aluminum (Al) filters atthe entrance of the instrument suppress the incoming visible and infrared (IR) radiation. Ad-ditional filters at the focal plane and on a filter wheel provide redundancy. The 1024 × 1024CCD detector is passively cooled to about −70 °C. A shutter is used to time the expo-sures. A detailed description of the instrument can be found in Delaboudinière et al. (1995).Since its first light in January 1996, EIT has provided revolutionary views of the EUV Sun(Moses et al., 1997). Its observations have been affected by serious degradation problems,but the degradation process could be understood and corrected for. A detailed analysis ofthe in-flight performances of EIT is given by Defise (1999).
2.3.1. Detector Degradation and In-Flight Correction
The total flux in EIT images rapidly showed strong variations that were obviously uncorre-lated with the solar activity, as shown in Figure 4.
We see an initial rise of the signal followed by a steep decrease and periodic discontinu-ities. The initial rise is attributed to rapid outgassing of the instrument following the openingof its sealed door. There are two causes for the subsequent decrease: absorption by a con-taminant on the detector surface, and radiation-induced degradation of its charge collectionefficiency (CCE). For operational reasons, the partial pressure in the vacuum vessel wasnot low enough at launch so that immediately after launch, water condensed on the rapidlycooling detector. Modeling showed that the observed absorption could be explained by athin layer of water, which is consistent with insufficient pumping at launch (Defise, 1999).Other contaminating compounds might be present as well, of course, but we have no wayof identifying them in-flight, while water is known to be present in the residual atmospherepresent in the vacuum vessel at launch. For stray-light protection, the CCD is isolated from

On-Orbit Degradation
Figure 5 Evolution of EIT’s calibration lamp images during the first two years of the SOHO mission (fromDefise, 1999).
Figure 6 Left: white-light flat field for 8 February 2001. Middle: corresponding EUV flat field deduced froman offpoint of SOHO. Right: scatter plot of EUV vs. visible.
the rest of the telescope by a flange, and the only outgassing path to space are two labyrinthsof low conductance.
The detector was regularly baked out to evaporate the water, but because of the lowconductance to the outside, most of the water simply condensed on the walls of the backend and went back to the CCD when it was cooled again. This cycle is one cause for theoscillating response seen in Figure 4. The second component of detector degradation isillustrated in Figure 5. The four images show the evolution of calibration lamps (a lightbulb illuminating the focal plane with visible light). We see the progressive imprinting of anegative average image of the EUV Sun, with the limb brightening and active-region bandsclearly visible in the last image.
This is due to loss in the CCE of the detector. EUV light creates positive charges at theinterface between the silicon (Si) and the silicon oxide (SiO2) layer that thicken the deadlayer. As consequence, in the regions that are on average the most illuminated, the CCE isdecreased. By baking out the CCD regularly to about 20 °C, the dead layer is thinned and ho-mogenized, thus restoring part of the original sensitivity (Defise et al., 1997). These detectordegradation effects have been understood and empirically modeled using calibration-lampimages. However, the images of Figure 5 cannot be used directly to correct the data, first,because they are white-light images, and second, because the light source does not illumi-nate the detector uniformly. The ratio between a calibration-lamp image and an initial-lampimage taken before the first light with a pristine detector has to be used. This gives a visible-light flat field, which can then be converted into an EUV flat field if one knows the rela-tionship between visible and EUV degradation. To derive this relationship we used severaloff-point maneuvers of the SOHO spacecraft.
The set of displaced images taken during the maneuvers was processed using the algo-rithm of Kuhn and Loranz (1991) to separate the solar image from the flat-field features.Figure 6 shows the white-light flat field derived from calibration lamps for the date of the 8
A. BenMoussa et al.
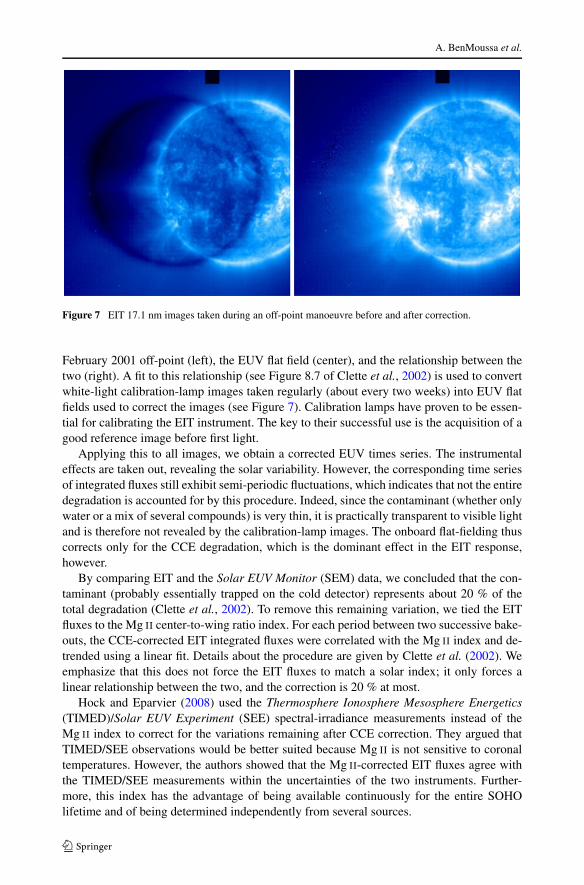
Figure 7 EIT 17.1 nm images taken during an off-point manoeuvre before and after correction.
February 2001 off-point (left), the EUV flat field (center), and the relationship between thetwo (right). A fit to this relationship (see Figure 8.7 of Clette et al., 2002) is used to convertwhite-light calibration-lamp images taken regularly (about every two weeks) into EUV flatfields used to correct the images (see Figure 7). Calibration lamps have proven to be essen-tial for calibrating the EIT instrument. The key to their successful use is the acquisition of agood reference image before first light.
Applying this to all images, we obtain a corrected EUV times series. The instrumentaleffects are taken out, revealing the solar variability. However, the corresponding time seriesof integrated fluxes still exhibit semi-periodic fluctuations, which indicates that not the entiredegradation is accounted for by this procedure. Indeed, since the contaminant (whether onlywater or a mix of several compounds) is very thin, it is practically transparent to visible lightand is therefore not revealed by the calibration-lamp images. The onboard flat-fielding thuscorrects only for the CCE degradation, which is the dominant effect in the EIT response,however.
By comparing EIT and the Solar EUV Monitor (SEM) data, we concluded that the con-taminant (probably essentially trapped on the cold detector) represents about 20 % of thetotal degradation (Clette et al., 2002). To remove this remaining variation, we tied the EITfluxes to the Mg II center-to-wing ratio index. For each period between two successive bake-outs, the CCE-corrected EIT integrated fluxes were correlated with the Mg II index and de-trended using a linear fit. Details about the procedure are given by Clette et al. (2002). Weemphasize that this does not force the EIT fluxes to match a solar index; it only forces alinear relationship between the two, and the correction is 20 % at most.
Hock and Eparvier (2008) used the Thermosphere Ionosphere Mesosphere Energetics(TIMED)/Solar EUV Experiment (SEE) spectral-irradiance measurements instead of theMg II index to correct for the variations remaining after CCE correction. They argued thatTIMED/SEE observations would be better suited because Mg II is not sensitive to coronaltemperatures. However, the authors showed that the Mg II-corrected EIT fluxes agree withthe TIMED/SEE measurements within the uncertainties of the two instruments. Further-more, this index has the advantage of being available continuously for the entire SOHOlifetime and of being determined independently from several sources.
On-Orbit Degradation
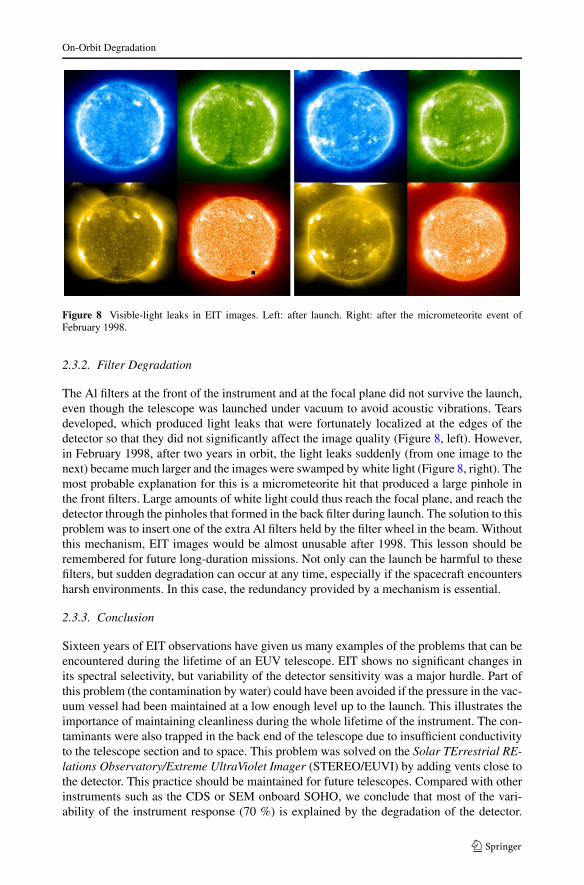
Figure 8 Visible-light leaks in EIT images. Left: after launch. Right: after the micrometeorite event ofFebruary 1998.
2.3.2. Filter Degradation
The Al filters at the front of the instrument and at the focal plane did not survive the launch,even though the telescope was launched under vacuum to avoid acoustic vibrations. Tearsdeveloped, which produced light leaks that were fortunately localized at the edges of thedetector so that they did not significantly affect the image quality (Figure 8, left). However,in February 1998, after two years in orbit, the light leaks suddenly (from one image to thenext) became much larger and the images were swamped by white light (Figure 8, right). Themost probable explanation for this is a micrometeorite hit that produced a large pinhole inthe front filters. Large amounts of white light could thus reach the focal plane, and reach thedetector through the pinholes that formed in the back filter during launch. The solution to thisproblem was to insert one of the extra Al filters held by the filter wheel in the beam. Withoutthis mechanism, EIT images would be almost unusable after 1998. This lesson should beremembered for future long-duration missions. Not only can the launch be harmful to thesefilters, but sudden degradation can occur at any time, especially if the spacecraft encountersharsh environments. In this case, the redundancy provided by a mechanism is essential.
2.3.3. Conclusion
Sixteen years of EIT observations have given us many examples of the problems that can beencountered during the lifetime of an EUV telescope. EIT shows no significant changes inits spectral selectivity, but variability of the detector sensitivity was a major hurdle. Part ofthis problem (the contamination by water) could have been avoided if the pressure in the vac-uum vessel had been maintained at a low enough level up to the launch. This illustrates theimportance of maintaining cleanliness during the whole lifetime of the instrument. The con-taminants were also trapped in the back end of the telescope due to insufficient conductivityto the telescope section and to space. This problem was solved on the Solar TErrestrial RE-lations Observatory/Extreme UltraViolet Imager (STEREO/EUVI) by adding vents close tothe detector. This practice should be maintained for future telescopes. Compared with otherinstruments such as the CDS or SEM onboard SOHO, we conclude that most of the vari-ability of the instrument response (70 %) is explained by the degradation of the detector.

A. BenMoussa et al.
Figure 9 Degradation of the SOHO/CELIAS-SEM 26 – 34 nm band (blue, solid line) as measured by sound-ing-rocket underflights of a NIST-calibrated copy of the SEM (diamonds). The degradation is modeled as thebuild-up of a layer of carbon (red, dotted line). This is an updated version of the degradation trending firstpresented by McMullin et al. (2002).
This behavior is different from that of SEM, even though the two instruments observe incomparable wavelength bands. The degradation observed in SEM is explained in terms of acarbon deposit on the front filter, while on EIT there is no evidence of variation in the EUVresponse of either the filters or the multilayer coatings. This difference may find its sourcein a combination of factors such as different designs, materials, contamination control plans,locations on the spacecraft, etc.
2.4. SOHO/CELIAS-SEM
The Solar and Heliospheric Observatory/Charge, Element, and Isotope Analysis System –Solar EUV Monitor (SOHO/CELIAS-SEM: Judge et al., 1998) is a simple transmission-grating spectrophotometer using an entrance Al filter to restrict the bandpass incident onthe grating, and defining the bandpass of the zero-order signal. Detectors in the first-orderare positioned to measure the 26 – 34 nm region of the solar spectrum, including the He II
emission at 30.4 nm.The SEM showed steady degradation of the first-order signal over the first seven years of
operation, and after that the degradation has remained almost constant, as shown in Figure 9.The degradation has been tracked by a series of sounding-rocket underflights with a copy ofthe SEM instrument that is calibrated at the National Institute of Standards and Technology(NIST) with the Synchrotron Ultraviolet Radiation Facility (SURF) before and after flight.This way, the calibration of the sounding rocket can be applied to the on-orbit SEM, and thedegradation measured.
It is postulated that the degradation seen by SEM is due to the build-up of a contami-nation layer on the front filter of the instrument. As no spectral information is available, ithas been assumed that the major element causing contamination is carbon. Hydrocarbonsfrom spacecraft outgassing, fuel return, etc. can hit the front filter; a certain proportion will

On-Orbit Degradation
“stick” and can become polymerized by the solar UV radiation. As this layer grows, theEUV signal is more strongly attenuated. Figure 9 shows the degradation as measured bythe sounding-rocket underflights and the modeled thickness of carbon required to cause thislevel of attenuation in the 26 – 34 nm band.
2.5. Long-Term Exposure Correction of VIRGO/DIARAD
The Differential Absolute Radiometer (DIARAD: Dewitte, Crommelynck, and Joukoff,2004) is one of the radiometers of the Variability of solar IRradiance and Gravity Oscil-lations (VIRGO: Fröhlich et al., 1995) package on SOHO developed at the Royal Meteo-rological Institute of Belgium. VIRGO/DIARAD has measured the Total Solar Irradiance(TSI) since 1996. The instrument is a dual-channel, side-by-side, self-calibrating absoluteradiometer. Each channel is composed of a detector assembly, a cylindrical black-paintedcavity with its associated precision aperture, a baffling system, a limiting aperture, and ashutter. Both cavities are mounted on a common heat sink. The DIARAD working prin-ciple is based on the compensation of heat in one channel’s cavity while its shutter opensand closes every three minutes (Dewitte, Crommelynck, and Joukoff, 2004). When the shut-ter of the measuring channel is open, part of the solar radiation is absorbed by the cavity.Its induced heat flux is measured by the detector. When the shutter closes, a servo systemcompensates for the deficit of radiative power by dissipating an equivalent electrical power.When measuring with one channel, the other channel is used as a reference and its shut-ter is kept closed. For a detailed description of the instrument, see Crommelynck (1982),Crommelynck and Dewitte (1999), and Mekaoui et al. (2010).
2.5.1. Degradation Monitoring Strategy
Because the instrument is symmetric, each channel can be used as an independent measur-ing device with its own electrical, thermal, geometrical, and optical characteristics. Thesecharacteristics are the main parameters in determining the absolute value of the TSI. Thislast topic is still a matter of debate (Mekaoui et al., 2010; Fröhlich, 2012; Kopp, Harber,and Heuerman, 2011; Kopp and Lean, 2011; Fehlmann et al., 2012). While each channel ofDIARAD is electrically self-calibrating, assuring the stability of the measurements of theabsolute TSI value, the thermo–optical properties are subject to degradation and changesdue to the long-term exposure to solar radiation.
This type of degradation is monitored and corrected for by ground processing. To achievethis, the left channel has measured the TSI every three minutes since 1996. During thesethree minutes, the left shutter is open for only half of the time. As a consequence, the totalinduced aging effect from the start of the measurements in 1996 – assuming its uniquedependence on the exposure time – is caused by around 8.5 years of cumulative exposureto solar radiation. The right channel is operated for only 45 minutes every month. It isexposed for half of the time to solar radiation. Its total exposure amounts to three days fromthe start of the mission. Figure 10 shows the daily mean TSI measurements from the leftchannel (in green) and the 30-minute average of the right-channel measurements (in black,the first 15 minutes are excluded because of a transient effect). In this figure, the right-channel measurements have been adjusted to the left-channel measurements at the beginningof the mission in 1996. In 2012, the difference between the two channel measurements isaround 1.2 W m−2 because of the left-channel degradation.

A. BenMoussa et al.
Figure 10 Temporal variation ofthe TSI measurements fromVIRGO/DIARAD. Greensymbols: daily mean TSImeasurements from the leftchannel; black curve: the25-minutes average of the TSImeasurements made each monthwith the right channel; redsymbols: the daily meanaging-corrected TSImeasurements.
Figure 11 DIARAD-rightminus DIARAD-left TSImeasurements. The offset isremoved at the beginning of themission. The black curve is thecomputed aging correction froma variable nine-point runningmean over the right – leftdifference.
2.5.2. Degradation Correction Implications
The less-exposed channel gives valuable information on the long-term TSI evolution. Fig-ure 10 shows the right channel, indicating that the difference between TSI minima in 2009and 1996 is 0.15 ± 0.17 W m−2. This suggests that no significant increase is measured be-tween the Solar Cycle 23 minima. Alternatively, these measurements can be used to correctthe nominal (left-channel) for its aging.
For each monthly measurement with the right channel, left-channel measurements aremade before and after. These measurements are then interpolated and compared with theright-channel measurements (simultaneous measurements with the right and the left channelare not possible). To reduce the uncertainty, it is important to compare the same means. In-deed, the right-channel measurement is a 25-minute average and so should the left-channelmeasurements be before interpolation. Figure 11 shows the difference between the right-channel measurements and the interpolated left-channel measurements. A fitted curve isused to smooth the difference. The values of this curve are then added to the left-channelmeasurements to take into account its degradation. This exposure-dependent aging is the
On-Orbit Degradation
only correction applied by the team of the Royal Meteorological Institute who developedthe instrument. Additional corrections are applied by the VIRGO PI-team. These exposure-independent corrections are based on the comparison with other radiometers (Fröhlich,2003). These results are still a matter of debate and have yet to be reproduced on the ground.
3. Degradation of the Hinode/EIS Detectors after Five Years in Orbit
The Hinode satellite was launched in September 2006 and is still operational. Hinode is aJapanese satellite with payloads funded by JAXA–ISAS, NASA, ESA, and UKSA (previ-ously STFC). Hinode is in a Sun-synchronous low-Earth orbit (altitude ≈ 600 km), whichallows for continuous observing of the Sun. There are three solar telescopes onboard Hin-ode: the Solar Optical Telescope (SOT: Tsuneta et al., 2008), the X-Ray Telescope (XRT:Golub et al., 2007), and the Extreme-UV Imaging Spectrometer (EIS: Culhane et al., 2007).
The Extreme-UV Imaging Spectrometer (EIS) has a large effective area in two EUVspectral bands; 17 – 21 nm and 25 – 29 nm. There are two CCDs, one for each wavelengthrange. The CCDs are e2v device type CCD 42-20, which have an array size of 2048×1024pixels, a pixel size of 13.5×13.5 µm2, are thinned for back-illumination, and employ multi-pinned phase (MPP) technology in asymmetric inverting-mode operation (AIMO), whichallows for low dark-current levels without excessive cooling (see Culhane et al., 2007 forthe EIS instrument article).
The in-orbit operating temperature range of the CCDs is ≈ −36 ◦C to −46 ◦C; thevariation is due to the perihelion and aphelion of the orbit. The assembly and pre-launchcalibration of EIS were performed at RAL (UK). The components of EIS (entrance filters,primary mirror, slit/slot mechanism, shutter, grating, and CCDs) are housed in a carbon-composite structure. Post-launch, a pixel shift of eight to nine pixels in the spectral directionwas observed when compared with the pre-launch calibration. The shift was attributed tothe thermal stabilization and out-gassing of the instrument, and a correction was made inthe software to accommodate the shift. Regular calibration studies are run weekly, monthly,or quarterly, depending on the types of study, which include dark exposures, Light Emit-ting Diodes (LEDs) flat-fields, synoptic, quartz-crystal microbalance (QCM), and full CCDspectral scans.
3.1. Hot and Warm Pixels
The hot and warm pixels are defects in the CCDs, where the rates of charge leakage arehigher because of defects in the Si. A few exist in the as-manufactured device, and radiationdamage accumulated over time adds to these. In the EIS orbit, the radiation effects aredominated by passages through the South Atlantic Anomaly (SAA). The hot and warmpixels are seen as spikes in the data that need to be calibrated out, e.g. using eis_prep (an IDLroutine available in the EIS Solarsoft distribution). The positions of the warm and hot pixelsare mapped and the information provided to eis_prep. The distinction between hot and warmpixels is somewhat arbitrary. Pre-launch, hot pixels were defined as pixels where the room-temperature dark current rate 25 000 electron per pixel per second, for consistency with thecriterion used by e2v in device screening and characterization. In orbit, it has been foundthat radiation damage also causes pixels with lower charge-generation rates, but which arestill above the CCD noise level, and so have to be taken account of. These are termed warmpixels, and the criterion used is that the dark signal is >5σ above the mean for a 100-seconddark exposure. The hot and warm pixels generally follow the usual exponential temperature

A. BenMoussa et al.
Figure 12 Number of warm pixels for the EIS CCDs. The (upper) black curve is the number of warm pixelsand the (lower) blue curve is the corresponding CCD temperature.
dependence of dark current in silicon, which means that cooling is effective in reducing theimpact on the data. For EIS, the CCD temperature is higher than the pre-launch predictionof below −50 ◦C, so the hot and warm pixels are greater in number. The XRT instrument onHinode has the same type of CCDs as EIS, but they operate at a much colder temperature (≈−80 ◦C) and therefore have no problem with warm pixels. The increase in hot pixels followsan approximately linear trend over time. As of April 2012, the number of hot pixels per eachCCD quadrant was ≈ 7800, which is equivalent to 1.5 % of the imaging area. The rate ofincrease of the warm pixels changes significantly and is temperature dependent because ofthe dark-current variation with temperature (annual variations in the CCD temperature aredue to aphelion and perihelion), as shown in Figure 12.
As of March 2012, the average number of warm pixels for each CCD quadrant was≈ 108 thousand (which is ≈ 21 % of the imaging area). The warm pixels are currently ina decreasing phase (the CCD temperature is decreasing). The number of warm pixels inDecember of each year (hottest point) is increasing by ≈ 16 thousand per year. Based onthis estimate, the number of warm pixels will be
• ≈ 136 thousand (26 % of the imaging area) in December 2012,• ≈ 152 thousand (29 % of the imaging area) in December 2013.
When a 30 % warm pixel level is reached, the spectral-line-fit parameters will be affected(private communication, P. Young, 2012). When the number of warm pixels (per CCD quad-rant) reaches 157 286, the 30 % level will have been reached. The highest number recordedso far was 120 312 on 5 January 2012 (on the short-wavelength CCD).
3.2. Flat Field and EIS Sensitivity
The sensitivity levels for the EIS CCDs are monitored by using the data from LED flat-fieldimages. The LEDs are blue, λpeak ≈ 430 nm, which approximately matches the absorptiondepth for the EUV photons. The flat fields show that the intensity levels have not changedsignificantly since launch (Figure 13), which indicates that the CCDs are not contaminated.

On-Orbit Degradation
Figure 13 Flat-field intensity levels for the EIS CCDs using EIS LEDs (averaged over a 450×450 pixelarea). The (upper) black curve is the intensity level and the (lower) blue curve is the corresponding CCDtemperature.
Figure 14 EIS sensitivity rateusing He II observations(courtesy J. Mariska, NRL).
A synoptic observation of a patch of quiet-Sun is made every week. The record of He II
observations shows that the EIS sensitivity decay rate is slowing (Figure 14).The best-fit expression is now an exponential plus a constant. It is not clear yet whether
some of the flattening is due to solar-cycle effects. Figures 13 and 14 indicate that the sen-sitivity decay is due to contamination/degradation of the optical elements rather than theCCDs. The sensitivity changes are factored into the EIS analysis software (eis_prep).
The QCM (located at the entrance aperture) readings for EIS have been taken at weeklyintervals since launch and provide an indication of the contamination levels of the criticalinstrument surfaces. The QCM data have shown a slight increase from year to year, whichis to be expected. The QCM data from 2010 to 2011 saw a lower increase than in previous
A. BenMoussa et al.
years. This agrees with the sensitivity measurements, which show that the decay rate isslowing (i.e. less contamination).
3.3. CCD Annealing
The plan so far has been to refrain from performing a CCD anneal or bake-out (heatingthe CCDs to around +35 ◦C) for as long as possible, as it presents a small risk to the in-strument (heaters require a high-power mode). Discussions at the recent EIS team meeting(April 2012) concluded with an annealing estimated for December 2013, which will be afterseven years in orbit. Initially it was planned to perform a bake-out when the optical perfor-mance degraded, but the flat-field intensity levels suggest that there is no contamination onthe CCDs (Figure 13), and therefore a bake-out will not improve the optical performance.The current driver for an anneal is the number of warm pixels, and not contamination. Thewarm pixels will compromise the science when a 30 % level is reached. The warm pixels arealso impacting the EIS data compression; the effect being that the EIS telemetry allocation isreached because estimates are wrong (data compression degradation). The data-compressionfactors for EIS have been reduced by 10 % (five years into the mission). Until now, this re-duction is only for the hot season (October to April), when warm pixels are increasing. Datacompression factors will be returned to nominal in the cooler season (April to October),when warm pixels are decreasing. It is hoped that following bake-out, the data-compressionperformance will revert to the post-launch level. The EIS operations team will have to exper-iment with anneal temperatures (+ 35 to +45 ◦C) and durations to maximize the recoveryprospects of the hot and warm pixels.
3.4. Conclusion
The EIS instrument behavior is “nominal” for a Low-Earth Orbit (LEO) space mission of itsage. The CCDs are sustaining radiation damage as expected, although the amount of darkcurrent per damaged pixel is higher than originally predicted because of the higher operatingtemperature (planned to be around −60 ◦C, achieved at around −45 ◦C). The warm pixelswill impact the science operations once their level reaches 30 % of the imaging area. Atpresent, they are mapped and removed via the EIS processing software. It is hoped that abake-out (≈ +35 ◦C) will recover most of the warm pixels. Bake-out is currently plannedfor the end of 2013. The data-compression performance was affected when the warm pixelsreached a 25 % level (five years into the mission). EIS compression factors are now reducedby 10 % during the hot season. The optical performance degradation is better than expected(compared with similar missions and duration in orbit) – it is expected that 1/e will bereached in seven years.
4. Long-Term Stability of the Photometric Response of the STEREO/HI-1
The twin Solar TErrestrial RElations Observatory (STEREO) spacecraft, which werelaunched in October 2006, are in heliocentric orbits at approximately 1 AU, with each space-craft separating from the Earth by 22.5◦ per year. STEREO-A is leading the Earth in its orbit,whilst STEREO-B is trailing the Earth.
The Heliospheric Imager (HI: Eyles et al., 2009) instruments form part of the Sun–EarthConnection Coronal and Heliospheric Investigation (SECCHI: Howard et al., 2008) suiteof remote-sensing instruments onboard each of the STEREO spacecraft. They are primarily
On-Orbit Degradation
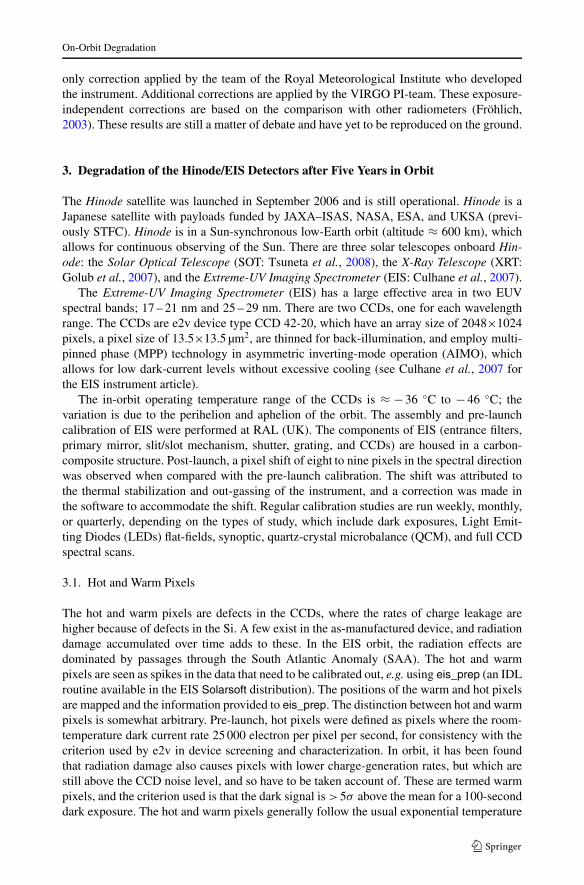
Figure 15 Measured versuspredicted intensities (in DN s−1)for a large number of stars in theHI-1A (top) and HI-1B (bottom)initial photometric calibrations.Updated from Bewsher et al.(2010).
designed to observe coronal mass ejections (CMEs) as they propagate from the solar neigh-borhood to Earth-like distances and beyond. Each HI instrument consists of two visible-lightcameras [HI-1 and HI-2] with field-of-view (FOV) diameters of 20◦ and 70◦, respectively,whose optical axes are aligned with the ecliptic plane in orientations that provide an overallcoverage of 4 – 88.7◦ solar elongation. The HI-1 and HI-2 telescopes consist of CCD cam-eras with fairly conventional transmission optics that are “buried” within complex bafflesystems to provide the necessary high levels of solar stray-light rejection for imaging thefaint emission from CMEs. The spectral band passes are 630 – 730 nm and 400 – 1000 nmfor HI-1 and HI-2, respectively. The CCDs are passively cooled to below −70 ◦C.
4.1. Initial Photometric Calibration
The initial photometric calibration of the HI-1 telescopes (Bewsher et al., 2010) was basedon data from the start of STEREO mission operations up to December 2008. The intensitiesof stars with R magnitudes ≤12 and within 100 pixels radius from the center of the FOVwere measured using aperture photometry. The stars and their spectral types were identifiedfrom the NOMAD catalog (Zacharias et al., 2004). Predicted intensities were calculatedby folding standard stellar spectra S(λ) (Pickles, 1998) through an optimized model of theinstrument-response function. The model of the instrument response was optimized using allavailable pre-flight calibration data, CCD and optics manufacturer response specifications,etc.
A. BenMoussa et al.
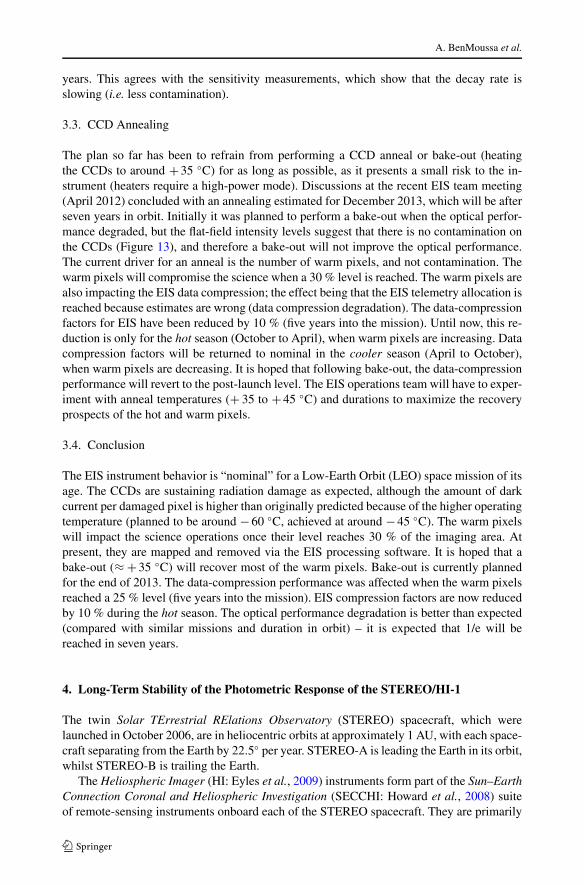
Table 2 The photometriccalibration factor [μ] and thenumber of stars used todetermine μ.
Orbit 1 Orbit 2 Orbit 3 Orbit 4 Orbit 5 Overall
HI-1A 0.926 0.933 0.927 0.930 0.935 0.930
No. stars 430 418 433 424 428 2141
HI-1B 0.998 0.987 0.989 0.993 0.981 0.989
No. stars 387 384 455 417 368 2029
Figure 15 shows the measured versus predicted intensities for large populations of stars.Apart from a few outliers at high intensities (due to detector saturation effects), the stars lieclose to a fitted straight line of the slope μ, i.e. Cmeasured = μCpredicted.
The photometric calibration factor [μ] represents an overall normalization error in theinstrument response, the value μ = 1 represents a perfect calibration. The values obtainedfor μ were 0.93 and 0.99 for HI-1A and B, respectively, with the total number of stars fittedbeing 903 and 541. No significant differences in μ were found according to spectral type,which confirms the validity of the instrument spectral response model.
4.2. Photometric Response Stability
To evaluate the photometric response stability, the above analysis was performed separatelyfor each of the complete orbits of the STEREO spacecraft. The derived values for μ areshown in Table 2. The values for orbits 1 – 4 (relative to the background star field) are takenfrom Bewsher, Brown, and Eyles (2012), and the values for orbit 5 and the overall value ofμ were newly derived for this article. As previously, μ was determined using stars within100 pixels radius from the center of the FOV (Bewsher, Brown, and Eyles, 2012). Completeorbits were used to avoid any possible systematic effects due to different star populationsbeing used in each case.
It is clear from Table 2 that there are no systematic changes in the photometric responseof either instrument at a level of 1 % or better. The analysis was also repeated for variousselected regions of the FOV, and the response was again found to be stable to 1 % or better,although some variations at a level of 2 – 3 % in the value of μ for different regions of theFOV were found, indicating some small systematic errors in the HI-1 flat-field corrections(Bewsher, Brown, and Eyles, 2012).
4.3. Conclusions
We have shown that from the start of mission science operations until the end of the fifthorbit of the two spacecraft relative to the background star field (5 December 2011 and 18 July2012 for STEREO A and B, respectively), the photometric response of the HI-1 cameras hasremained stable to 1 % or better. This is significantly better than the long-term stability of thewhite-light coronagraphs onboard the SOHO mission, where Thernisien et al. (2006) founda decrease of sensitivity of the Large Angle and Spectrometric Coronagraph (LASCO)-C3 instrument by 3.5 % over eight years of operation, whilst Llebaria, Lamy, and Danjurd(2006) reported a degradation of the LASCO-C2 instrument by 0.7 % per year. Whilst white-light instruments are not as sensitive to degradation as UV instruments, the excellent stabilityof the HI instruments vindicates the extensive precautions taken during their design anddevelopment.
On-Orbit Degradation
5. SOLSPEC: A Spectrometer with Onboard Control of Aging
SOLar SPECtrum (SOLSPEC) is a spectrometer, that flew several times on the Space Shut-tle, and its twin instrument was placed on the European Retrievable Carrier (EURECA)platform for ten months. The Shuttle flight has gathered data to build the Atmospheric Labo-ratory for Applications and Science (ATLAS) 1 and 3 spectra (Thuillier et al., 2009), whichcomprised the Upper Atmospheric Research Satellite (UARS) / Solar Ultraviolet SpectralIrradiance Monitor (SUSIM) and Solar Stellar Irradiance Comparison Experiment (SOL-STICE) data from Lyman α (121.6 nm) to 200 nm, and ATLAS-Shuttle Solar Backscat-ter Ultraviolet (SSBUV), SUSIM, and SOLSPEC from 200 to 400 nm, ATLAS-SOLSPECfrom 400 to 850 nm, and EURECA- SOlar SPectrum (SOSP) from 800 to 2400 nm. The AT-LAS spectra are calibrated into the absolute radiometric scale of the black-body radiator ofthe Observatory of Heidelberg, NIST standards spectral irradiance (tungsten and deuteriumlamps). The SOLSPEC instrument has been upgraded for operations onboard the Interna-tional Space Station (ISS) by implementing several changes given the lessons learned fromthe previous missions and by adding several new components to provide an instrument ableto operate for several years in the space environment. SOLSPEC has now been in opera-tion onboard the ISS since February 2008. To cover the 165 – 3080 nm range, three doublespectrometers are used that are equipped with concave holographic gratings made by Jobin–Yvon. By rotating the six gratings mounted on the same mechanical axis, the range 165 –3080 nm is scanned in ten minutes with a mechanical precision corresponding to 0.01 to0.1 nm, from the UV to the IR channels. To reduce the flat-field effect, diffusers are placedbetween the entrance pre-slit and spectrometer first slit. As the ISS environment could notalways be clean in terms of contamination, and as the diffusers could degrade by EUV solarradiation, two wheels carrying a hole and two quartz plates each can be placed alternativelyin front of the entrance pre-slit. These plates allow protection of the entrance slits from thedeposition of contaminants, which can be ultimately polymerized by the solar EUV. In thatcase, the quartz-plate transmission decreases; however, it can be measured in-flight by us-ing the ratio of solar observations with and without the quartz plate in front of the entranceslit. One plate is mainly used for each observation. Using the Sun, its transmission is com-pared with the infrequently used quartz-plate transmission. For each spectrometer, a wheelis equipped with second-order and/or neutral filters. The latter are used to reduce the signalgiven by the instrument responsivity and the solar-irradiance variation with wavelength.
5.1. Pre-Flight Absolute Calibration
SOLSPEC has been calibrated at the PTB using a black-body radiator. One of these black-body sources (BB3200pg) represents the primary standard for the realization of the spectralirradiance scale (Sperfeld et al., 1998). Taking into account the distance between the black-body source and the SOLSPEC entrance slit, the size of the entrance slit, the black-bodyaperture, and the black-body temperature, the spectral irradiance is calculated for any givenwavelength using the Planck law. The black-body cavity temperature is around 3000 K andit is known to within 0.44 K. Because the black-body emission is calculated and its ratioto the count number is recorded by SOLSPEC, one can convert the solar signal to absoluteirradiance. Below 200 nm, the black-body source does not generate a strong enough signal,and hence deuterium (D2) lamps provided by the PTB were used. During the calibrationcampaign, several spectra using the internal lamps were recorded as a reference in the rel-ative scale. For the whole spectral range, the accuracy of SOLSPEC stays within 3 %. TheSOLSPEC instrument is described in detail by Thuillier et al. (2009).

A. BenMoussa et al.
Figure 16 Transmissiondegradation of the quartz plateused for the UV–VIS solarspectrum measurements. Thetransmission is measured bycomparing the signal with andwithout the quartz plate.
5.2. Onboard Calibration Means and Instrument Degradation in Space
D2 and tungsten-ribbon lamps are used for checking the instrument stability with time. Thelight from these sources is carried by using optical fibres, mirrors, and lenses. The relation-ship between the mechanical position of the gratings and wavelength is measured by usinga hollow-cathode (HC) lamp filled with argon (Ar), which delivers lines in the UV, visible,and near-IR. These lines also allow measuring the instrument slit function and the dispersionlaw (relationship between the grating position and wavelength).
Degradation in visible and IR domains is of about a few percent, and can be corrected forby measuring the transmission of the quartz plates and by using the internal ribbon tungstenlamps. As expected, the degradation in the UV is significant.
Figure 16 shows the transmission loss of the most frequently used quartz plate. Theinstrument responsivity change is derived from comparing the transmission of the secondquartz plate (infrequently used), direct quartz-plate transmission measurements, and D2
lamp data. After the D2 lamp power-supply failure, we used the HC lamp lines, which areintensity-based, according to the following principle:
• In the laboratory as well as in orbit, we have verified that the lines emitted by the HC lamphave a covariance intensity change in time. In other words, the ratio of line intensity attwo different wavelengths is constant, i.e. independent of the line intensity, which slowlydecreases probably because of a gas leakage.
• Because the aging is corrected for (as explained above), the HC-lamp line intensity canbe corrected for in the visible (or IR) spectrometer, and the percentage of the correctionis in particular applied to the UV lines, which in turn provides data to correct the UVspectrometer responsivity.
5.3. Conclusion
The SOLSPEC design has been validated by the SpaceLab I, ATLAS 1, 2, and 3, and theEURECA missions. However, the duration of these missions were about one week exceptfor EURECA, which lasted ten months. For a mission aiming to operate for several years,it was necessary to design an instrument with its own capability to provide data for agingcorrections given its location in space.

On-Orbit Degradation
6. Solar Instruments Onboard PROBA2
The Project for On Board Autonomy (PROBA) satellites are part of ESA’s In orbit Technol-ogy Demonstration Programme, i.e. missions dedicated to the demonstration of innovativetechnologies through small satellites. On 2 November 2009, PROBA2 was launched intoa Sun-synchronous polar orbit, which allows quasi-permanent solar observation. Two solarobservation experiments, the Sun Watcher with Active Pixels and Image Processing (SWAP:Seaton et al., 2012; Halain et al., 2012) and the Large-Yield RAdiometer (LYRA: Hochedezet al., 2006) on PROBA2 are test platforms for new technologies.
The absolute radiometric response of the two instruments, through collaboration betweenthe Max-Planck-Institut für Sonnensystemforschung (MPS) and the PTB, has been estab-lished before flight at the primary radiometric source standard: the synchrotron radiationbeamline of PTB at the Berlin Storage Ring for Synchrotron Radiation II (BESSY II).
6.1. Characterization of SWAP Degradation
SWAP is a single-band EUV telescope that observes the solar corona in a passband centeredon 17.4 nm and with a 54×54 arcmin FOV, and has a novel off-axis Ritchey–Chretien de-sign with two mirrors with multilayer coatings for EUV reflectivity and a complementarymetal-oxide-semiconductor (CMOS) active pixel sensor (APS). A scintillator coating (P43)converts EUV photons into visible photons to which the detector is sensitive. Spectral se-lection is achieved by the combination of multilayer coatings and two Al-foil filters, one ofwhich is located at the entrance aperture and the other in front of the focal-plane assembly.SWAP has operated essentially continuously since shortly after PROBA2’s injection into itspolar Sun-synchronous orbit in November 2009 at an approximate altitude of 725 km. Ad-ditionally, since SWAP does not have a door or shutter, its optical and electronic systems arecontinuously exposed to EUV input from the corona. We characterize SWAP’s degradationin three ways: first, we compare the total response of the instrument to well-calibrated spec-tral measurements from the Extreme Ultraviolet Variability Experiment (EVE: Woods et al.,2012; Didkovsky et al., 2012) onboard the Solar Dynamics Observatory (SDO) spacecraft;second, we measure the number of improperly performing pixels in SWAP’s 1024×1024pixel CMOS detector; and finally, we roughly measure the evolution of SWAP’s flat-fieldusing a set of onboard LEDs. More detailed information on the ground-based calibrationfrom PTB/BESSY II is discussed by Seaton et al. (2012), and the in-flight calibration byHalain et al. (2012).
6.1.1. Spectral Response
Since it is not possible to obtain in-orbit EUV images of a standard and well-calibratedsource, degradation in the SWAP response function must be measured indirectly. To dothis, we compared the mean SWAP response per pixel for solar images obtained regularlythroughout the mission to corresponding spectra from EVE. To achieve this comparison,EVE spectra were first converted from units of total flux per wavelength to photon flux,then modulated by the laboratory-measured SWAP response function, and integrated acrossSWAP’s entire bandpass. This procedure yields a single value with units of DN s−1 pixel−1
that we compared to the mean instrumental response in images obtained at the same time asthe corresponding spectrum.
We then compared the evolution of these two values over time to assess the rate of degra-dation of SWAP’s overall response over the course of the mission. A multiplicative factor

A. BenMoussa et al.
Figure 17 Comparison of SWAP measured intensity (blue-dashed) and SDO/EVE computed intensity(black-solid). The top panel shows the variation of intensity with time due to changes in solar irradiancenear 17.4 nm, the lower panel shows the ratio of the two values over time. Adapted from Halain et al. (2012).
of 1.11 was applied to the EVE-based curve before our analysis. The need for this factoris probably the result of a combination of uncorrected degradation of EVE in orbit and er-ror in measuring the SWAP response in the laboratory; the factor to be used was measuredempirically and might be the result of many different contributions. Figure 17 shows thiscomparison; although the two curves are closely correlated, driven by the variation in coro-nal irradiance near 17.4 nm, they diverge at the end of 2011, the reason for which is stillunclear.
6.1.2. Detector Degradation
A potentially more significant problem for SWAP is the breakdown of electronic compo-nents, especially those associated with its CMOS–APS detector, which is the first of itskind used for an EUV solar telescope. A complete discussion of SWAP’s detector and itson-ground performance testing was given by De Groof et al. (2008). Unlike CCD detec-tors, which have been used in nearly all solar-imaging missions for decades, each pixel in aCMOS–APS detector has its own analog (amplifier) readout electronics, so a failure of theseelectronics can render only individual pixels inoperable. We monitored the detector perfor-mance primarily by tracking the number of hot pixels removed by the de-spiking routine inSWAP’s image-calibration software. This value is strongly influenced by the evolution ofdetector temperature, therefore to separate changes in detector performance from the ther-mal evolution of SWAP, we modeled the temperature dependence of hot pixels using anempirically determined polynomial model and normalized the evolution of spikes in timeusing this model. Figure 18 shows both the normalized and non-normalized curves for a pe-riod of about 700 days after the end of PROBA2’s commissioning period. In the normalizedplot, the number of spikes clearly increases linearly in time at a rate of about 13 spikes per

On-Orbit Degradation
Figure 18 Spikes detected in SWAP images versus time. The top panel shows the rate of increase in de-tections with the effects of temperature variation removed. The lower panel shows the variation includingtemperature effects. The dotted curve in both panels shows the effect of a linear increase in spikes with arate of 13 spikes per day. In the lower panel this has been adjusted to reflect temperature variation as well,showing that the linear increase is indeed a good match for actual detector behavior. Adapted from Halainet al. (2012).
day−1 or about 4800 spikes per year−1. This corresponds to a loss of only about 0.45 % ofall detector pixels per year. We note that this linear increase in pixel damage is consistentwith the results of ground-based radiation exposure tests described in the detector datasheetproduced by Cypress (formerly FillFactory), the detector producer. The large jump aroundday 300 (Figure 18 lower panel) is due to a refinement in SWAP calibration procedures.The two dips in the number of spikes near December and January 2010 and December 2011are the result of PROBA2’s reduced operating temperature during the spacecraft’s eclipseseason.
6.1.3. Image Quality Degradation
The final type of degradation that can affect SWAP is the degradation of intrinsic imagequality due to losses of efficiency in the optical components as a result of EUV “burn-in” or deposition of contaminants on optical surfaces. This type of degradation is the mostdifficult to measure, since, as is the case for all space-based EUV telescopes, there is nostandard EUV source available with which to measure SWAP’s flat-field while in flight.However, this type of degradation was the principal cause of quality loss in images fromEIT on SOHO (Clette et al., 2002), which makes it worthwhile to study its role in SWAPdegradation to the extent that we can do so. Although producing a true gain calibrationfor SWAP is very difficult, SWAP carries two visible LEDs that can help to reveal strongvariations in image quality. For this analysis we compared the ratios of LED brightness atthe beginning of PROBA2’s mission with more recent observations of the LEDs. Since theLEDs are located close to SWAP’s focal plane assembly (FPA), we cannot characterize any

A. BenMoussa et al.
changes in filter or mirror performance with this measurement. However, any significantchanges in the performance of the optical path would probably be detected in our analysisof SWAP’s spectral response. Nonetheless, it is worth pointing out that this analysis appliesonly to the FPA components and LEDs themselves. We compared LED images obtained aspart of a bi-weekly calibration campaign performed throughout the mission to study changesin image quality over time. By computing the pixel-by-pixel ratio of LED images from thebeginning of the mission to LED images from the end of the mission, we can determinewhether any spatially coherent degradation has occurred. Comparing images from April2012 with LED images from the early-mission commissioning phase revealed a small, ring-shaped decrease in detector response in nominal SWAP images that is roughly coincidentwith the location of the solar limb where the brightest coronal emission occurs. This suggeststhat there has been some degree of burn-in over the course of the mission. However, thedecrease was only a few DN per pixel, which corresponds to a net decrease in instrumentalresponse of less than 0.1 % of the total signal in well-exposed images. Since this level is farbelow instrumental noise levels and, as a result of image compression, is in fact undetectablein nominal science images, we conclude that this type of degradation is not a significantconcern for SWAP. Additional discussion of the use of LED images to diagnose SWAPdegradation, including a figure that shows this effect, is given by Halain et al. (2012).
6.1.4. Conclusion
SWAP has a dual role; it is both a scientific instrument and a test platform for new technol-ogy. While many such space-based EUV instruments have experienced significant degrada-tion during the initial years in orbit, SWAP has shown itself to be remarkably robust againstdegradation of any kind. This analysis suggests SWAP has only experienced one significanttype of degradation: failures in the detector electronics, which have occurred at a rate of lessthan 5000 out of approximately 106 pixels (less than 0.5 %) every year. The lessons learnedfrom SWAP’s simple, efficient, and robust design are especially applicable to instrumentsintended primarily for space-weather monitoring such as the proposed EUV Solar Imagerfor Operations (ESIO) instrument. Such instruments, which often are expected to operatewith limited resources, must be long-lived and dependable and accordingly must be highlyrobust against adverse conditions in the space environment to which they will be exposed.
6.2. LYRA Degradation after Two Years in Orbit
The Large-Yield RAdiometer (LYRA) observes the Sun in four spectral bands that rangefrom UV to soft X-ray. It consists of three units that are redundant but not technically iden-tical. While each unit consists of the same four spectral channels that cover a wide emis-sion temperature range, these channels are realized by different filter–detector combinations.Three types of detectors were used: conventional Si photodiode detectors (AXUV type fromIRD) and two types of diamond detectors, which have the advantage of being radiation resis-tant and insensitive to visible light (BenMoussa et al., 2006). Another advantage of LYRAis its high observation cadence, up to 100 Hz. LYRA uses two calibration LEDs per detectorto individually monitor the possible detector degradation over the mission lifetime.
LYRA channel 1 (Lyman α) covers a narrow band around 120 – 123 nm, plus, unfortu-nately, a major contamination caused by longer wavelengths. LYRA channel 2 (Herzberg)covers the interval 190 – 222 nm in the Herzberg continuum. LYRA channel 3 (aluminum)covers the 17 – 70 nm Al-filter range including the strong He II 30.4 nm line and soft X-raycontribution below 5 nm. LYRA channel 4 (zirconium) covers the 6 – 20 nm Zr-filter range
On-Orbit Degradation
with the highest solar variability and soft X-ray contribution below 2 nm. For a detaileddescription of the mission, see Hochedez et al. (2006).
Since PROBA2 is a combined science and technology mission, the goal was not only toprovide scientific data for studying solar flares, space weather, and aeronomy, but also toobserve the performance of new technologies in space. Thus, the observation of the instru-ment’s degradation and its causes is an important part of the mission goal.
6.2.1. Calibration
The spectral response of the twelve possible filter–detector combinations was tested beforelaunch with a standard source (PTB/BESSY II); for details see BenMoussa et al. (2009a).The various nominal spectral intervals were defined accordingly, such that they cover at least95 % of the response. This does not apply for the Lyman α channel, since the unwantedlonger-wavelength contributions to this channel depend on the detector technology.
LYRA has been continuously observing the Sun, basically with its unit 2, for more thantwo years. The data presented on the PROBA2 website (proba2.sidc.be) include daily plots,three-day plots, monthly overviews, flare lists, and a comparison with the soft X-ray ofNOAA’s Geostationary Operational Environmental Satellites (GOES) satellites. LYRA dataare available in daily FITS files; users can chose between uncalibrated and calibrated timeseries in full temporal resolution and calibrated data averaged in one-minute intervals.
6.2.2. Degradation
LYRA unit 2 consists entirely of new diamond detectors to be tested in space. It is thereforeselected to be the “nominal” unit and has been used, almost without interruption, since 6January 2010, the day that LYRA first opened its covers. Unit 1 and unit 3 are only openedand used sporadically for limited campaigns and for calibration purposes. Consequently,unit 2 degraded quite fast, especially in its longer-wavelength channels; see Figure 19.
LYRA’s original spectral response, as measured in the laboratory, can only be comparedin a reasonable way with other space instruments when data of the first-light day are used,i.e. before heavy degradation set in. It was therefore decided to calibrate LYRA with thehelp of a combined solar spectrum observed on 6 January 2010 by SOLSTICE onboardthe Solar Radiation and Climate (SORCE) and the Solar EUV Experiment (SEE) on theTIMED mission. The calibration was then extended by adding the estimated loss by tem-poral degradation. This method has the advantage of leaving the flare components withinthe shorter-wavelength channels untouched, since it is observed that these signals do not de-grade. In addition, the shorter-wavelength channels react more to long-term solar variability;therefore this variability has been adjusted with the help of ch3-4 (i.e. unit 3, channel 4), thezirconium channel of unit 3, which is assumed to be non-degrading.
By mid-March 2012, unit 3 had been open to the Sun for approximately 375 hours. Itcould thus be compared with the first 375 hours of open unit 2, which was reached around5 February 2010, within the commissioning phase. The result is shown in Figure 20 andTable 3.
The loss percentage for the short-wavelength channels is calculated assuming that thesolar irradiance had dropped by 2 % within the period covered by unit 2, and that it hadincreased by 55 % in the period covered by unit 3; this is observed by LYRA ch3-4 [i.e. unit3–channel 4]. It is furthermore assumed that the solar variation as reflected in ch2-3, ch2-4,ch3-3, and ch3-4 is linearly dependent, and that ch3-4 is not degraded.

A. BenMoussa et al.
Figure 19 Temporaldegradation and estimation offuture trends for LYRA unit 2.
Table 3 Relative signal losses (to the output signal on 6 January 2010: first light) in the four LYRA channelsof unit 2 and unit 3, each after 375 hours of open covers (dark currents subtracted). To remove the solarvariation contribution in the shorter wavelengths (*), ch2-3, ch2-4, and ch3-3 were adjusted relative to ch3-4,which is assumed to be non-degrading.
LYRA-unit2 Degradation [%] LYRA-unit3 Degradation [%]
ch2-1 58.3 ch3-1 28.3
ch2-2 32.5 ch3-2 30.9
ch2-3 28.7* ch3-3 45.2*
ch2-4 10* ch3-4 0*
The loss in ch3-1, a channel that has significant contributions from visible and IR radia-tions (Si detector), appears to be lower than in ch2-1, which only has a significant contribu-tion from UV, apart from the Lyman α line. Ch3-3, after removal of the solar variation, ini-tially appears to degrade as fast as the longer-wavelength channels, while channel 4 appearsto degrade more slowly than the others. Meanwhile, it is observed by regular calibrationcampaigns – using the LEDs with covers closed – that the photodetectors made of diamonddo not show any degradation, while the Si AXUV detectors show a slight increase of theirdark current.
As can be seen in the unit-3 part of Figure 20, the degradation slows down after sixtyhours, which corresponds to campaigns around the end of 2010, i.e. after approximately oneyear of operations.
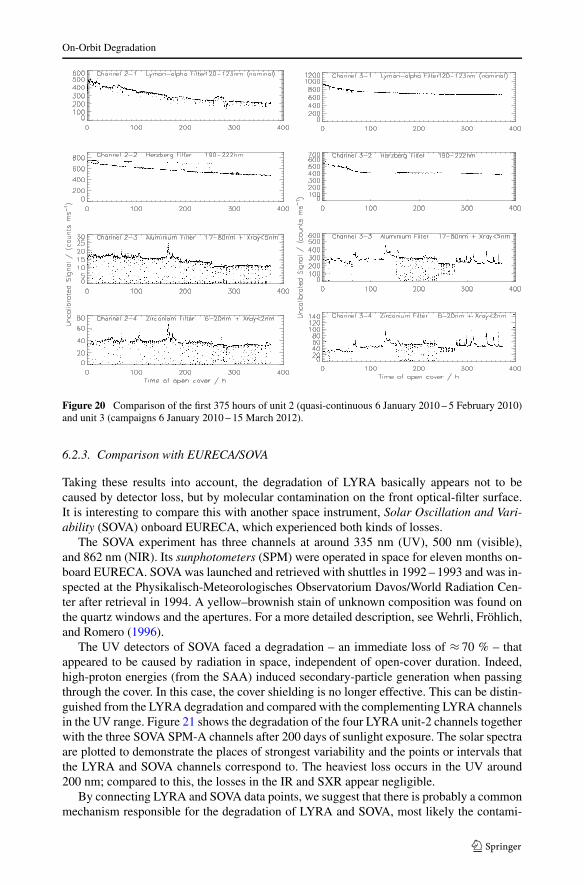
On-Orbit Degradation
Figure 20 Comparison of the first 375 hours of unit 2 (quasi-continuous 6 January 2010 – 5 February 2010)and unit 3 (campaigns 6 January 2010 – 15 March 2012).
6.2.3. Comparison with EURECA/SOVA
Taking these results into account, the degradation of LYRA basically appears not to becaused by detector loss, but by molecular contamination on the front optical-filter surface.It is interesting to compare this with another space instrument, Solar Oscillation and Vari-ability (SOVA) onboard EURECA, which experienced both kinds of losses.
The SOVA experiment has three channels at around 335 nm (UV), 500 nm (visible),and 862 nm (NIR). Its sunphotometers (SPM) were operated in space for eleven months on-board EURECA. SOVA was launched and retrieved with shuttles in 1992 – 1993 and was in-spected at the Physikalisch-Meteorologisches Observatorium Davos/World Radiation Cen-ter after retrieval in 1994. A yellow–brownish stain of unknown composition was found onthe quartz windows and the apertures. For a more detailed description, see Wehrli, Fröhlich,and Romero (1996).
The UV detectors of SOVA faced a degradation – an immediate loss of ≈ 70 % – thatappeared to be caused by radiation in space, independent of open-cover duration. Indeed,high-proton energies (from the SAA) induced secondary-particle generation when passingthrough the cover. In this case, the cover shielding is no longer effective. This can be distin-guished from the LYRA degradation and compared with the complementing LYRA channelsin the UV range. Figure 21 shows the degradation of the four LYRA unit-2 channels togetherwith the three SOVA SPM-A channels after 200 days of sunlight exposure. The solar spectraare plotted to demonstrate the places of strongest variability and the points or intervals thatthe LYRA and SOVA channels correspond to. The heaviest loss occurs in the UV around200 nm; compared to this, the losses in the IR and SXR appear negligible.
By connecting LYRA and SOVA data points, we suggest that there is probably a commonmechanism responsible for the degradation of LYRA and SOVA, most likely the contami-
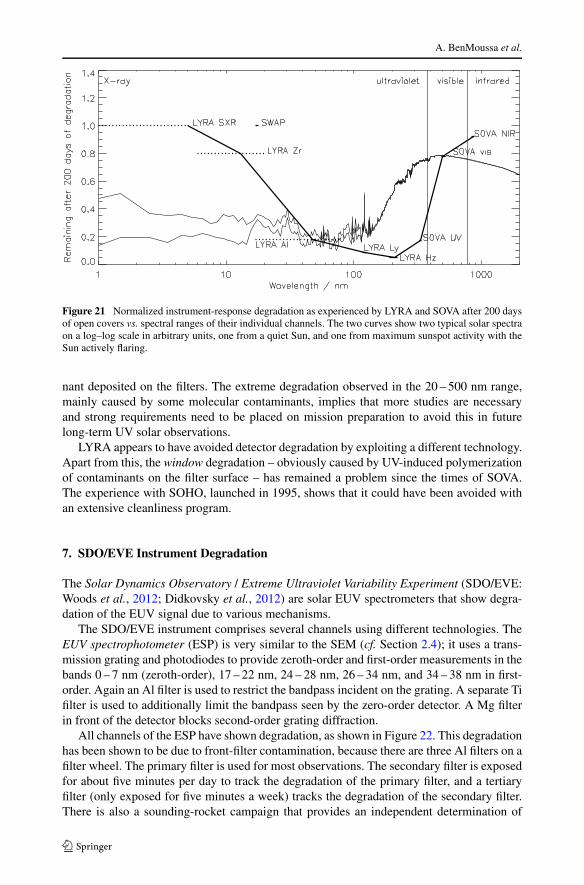
A. BenMoussa et al.
Figure 21 Normalized instrument-response degradation as experienced by LYRA and SOVA after 200 daysof open covers vs. spectral ranges of their individual channels. The two curves show two typical solar spectraon a log–log scale in arbitrary units, one from a quiet Sun, and one from maximum sunspot activity with theSun actively flaring.
nant deposited on the filters. The extreme degradation observed in the 20 – 500 nm range,mainly caused by some molecular contaminants, implies that more studies are necessaryand strong requirements need to be placed on mission preparation to avoid this in futurelong-term UV solar observations.
LYRA appears to have avoided detector degradation by exploiting a different technology.Apart from this, the window degradation – obviously caused by UV-induced polymerizationof contaminants on the filter surface – has remained a problem since the times of SOVA.The experience with SOHO, launched in 1995, shows that it could have been avoided withan extensive cleanliness program.
7. SDO/EVE Instrument Degradation
The Solar Dynamics Observatory / Extreme Ultraviolet Variability Experiment (SDO/EVE:Woods et al., 2012; Didkovsky et al., 2012) are solar EUV spectrometers that show degra-dation of the EUV signal due to various mechanisms.
The SDO/EVE instrument comprises several channels using different technologies. TheEUV spectrophotometer (ESP) is very similar to the SEM (cf. Section 2.4); it uses a trans-mission grating and photodiodes to provide zeroth-order and first-order measurements in thebands 0 – 7 nm (zeroth-order), 17 – 22 nm, 24 – 28 nm, 26 – 34 nm, and 34 – 38 nm in first-order. Again an Al filter is used to restrict the bandpass incident on the grating. A separate Tifilter is used to additionally limit the bandpass seen by the zero-order detector. A Mg filterin front of the detector blocks second-order grating diffraction.
All channels of the ESP have shown degradation, as shown in Figure 22. This degradationhas been shown to be due to front-filter contamination, because there are three Al filters on afilter wheel. The primary filter is used for most observations. The secondary filter is exposedfor about five minutes per day to track the degradation of the primary filter, and a tertiaryfilter (only exposed for five minutes a week) tracks the degradation of the secondary filter.There is also a sounding-rocket campaign that provides an independent determination of
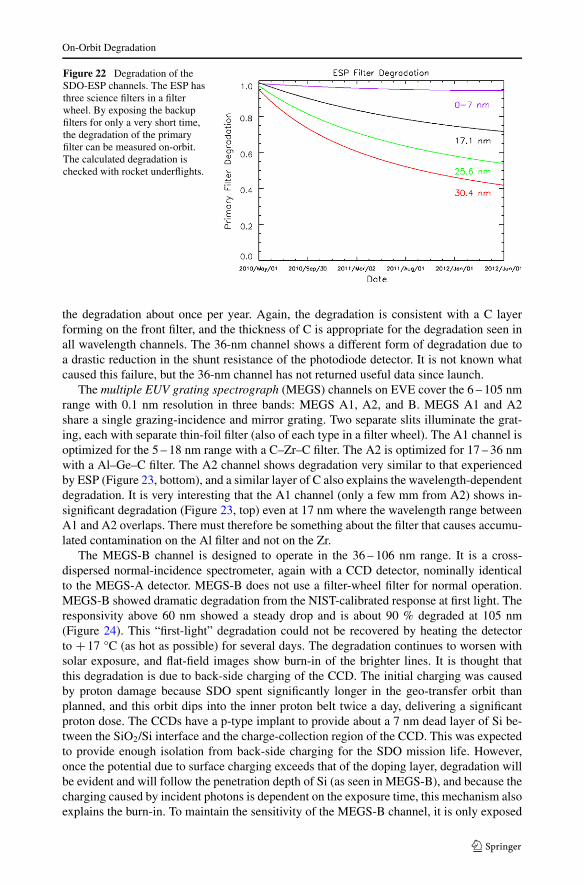
On-Orbit Degradation
Figure 22 Degradation of theSDO-ESP channels. The ESP hasthree science filters in a filterwheel. By exposing the backupfilters for only a very short time,the degradation of the primaryfilter can be measured on-orbit.The calculated degradation ischecked with rocket underflights.
the degradation about once per year. Again, the degradation is consistent with a C layerforming on the front filter, and the thickness of C is appropriate for the degradation seen inall wavelength channels. The 36-nm channel shows a different form of degradation due toa drastic reduction in the shunt resistance of the photodiode detector. It is not known whatcaused this failure, but the 36-nm channel has not returned useful data since launch.
The multiple EUV grating spectrograph (MEGS) channels on EVE cover the 6 – 105 nmrange with 0.1 nm resolution in three bands: MEGS A1, A2, and B. MEGS A1 and A2share a single grazing-incidence and mirror grating. Two separate slits illuminate the grat-ing, each with separate thin-foil filter (also of each type in a filter wheel). The A1 channel isoptimized for the 5 – 18 nm range with a C–Zr–C filter. The A2 is optimized for 17 – 36 nmwith a Al–Ge–C filter. The A2 channel shows degradation very similar to that experiencedby ESP (Figure 23, bottom), and a similar layer of C also explains the wavelength-dependentdegradation. It is very interesting that the A1 channel (only a few mm from A2) shows in-significant degradation (Figure 23, top) even at 17 nm where the wavelength range betweenA1 and A2 overlaps. There must therefore be something about the filter that causes accumu-lated contamination on the Al filter and not on the Zr.
The MEGS-B channel is designed to operate in the 36 – 106 nm range. It is a cross-dispersed normal-incidence spectrometer, again with a CCD detector, nominally identicalto the MEGS-A detector. MEGS-B does not use a filter-wheel filter for normal operation.MEGS-B showed dramatic degradation from the NIST-calibrated response at first light. Theresponsivity above 60 nm showed a steady drop and is about 90 % degraded at 105 nm(Figure 24). This “first-light” degradation could not be recovered by heating the detectorto +17 °C (as hot as possible) for several days. The degradation continues to worsen withsolar exposure, and flat-field images show burn-in of the brighter lines. It is thought thatthis degradation is due to back-side charging of the CCD. The initial charging was causedby proton damage because SDO spent significantly longer in the geo-transfer orbit thanplanned, and this orbit dips into the inner proton belt twice a day, delivering a significantproton dose. The CCDs have a p-type implant to provide about a 7 nm dead layer of Si be-tween the SiO2/Si interface and the charge-collection region of the CCD. This was expectedto provide enough isolation from back-side charging for the SDO mission life. However,once the potential due to surface charging exceeds that of the doping layer, degradation willbe evident and will follow the penetration depth of Si (as seen in MEGS-B), and because thecharging caused by incident photons is dependent on the exposure time, this mechanism alsoexplains the burn-in. To maintain the sensitivity of the MEGS-B channel, it is only exposed
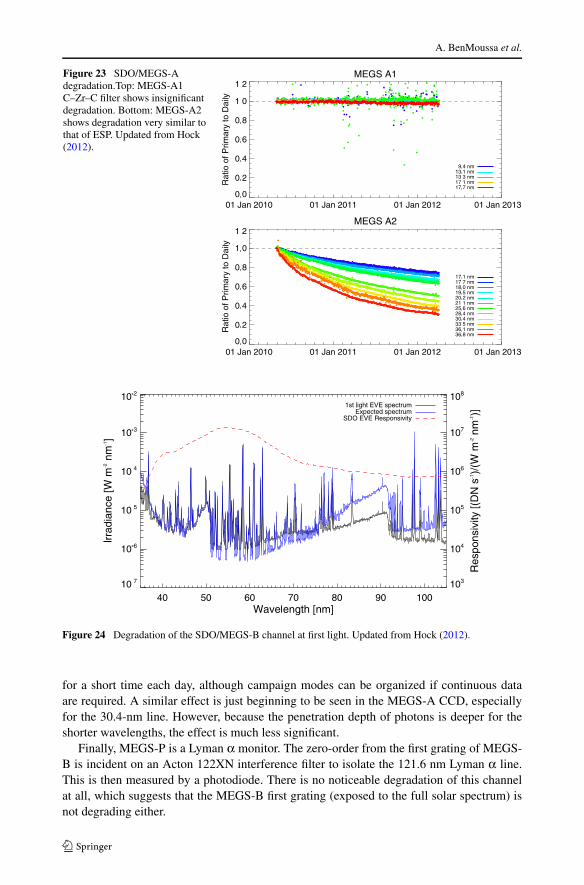
A. BenMoussa et al.
Figure 23 SDO/MEGS-Adegradation.Top: MEGS-A1C–Zr–C filter shows insignificantdegradation. Bottom: MEGS-A2shows degradation very similar tothat of ESP. Updated from Hock(2012).
Figure 24 Degradation of the SDO/MEGS-B channel at first light. Updated from Hock (2012).
for a short time each day, although campaign modes can be organized if continuous dataare required. A similar effect is just beginning to be seen in the MEGS-A CCD, especiallyfor the 30.4-nm line. However, because the penetration depth of photons is deeper for theshorter wavelengths, the effect is much less significant.
Finally, MEGS-P is a Lyman α monitor. The zero-order from the first grating of MEGS-B is incident on an Acton 122XN interference filter to isolate the 121.6 nm Lyman α line.This is then measured by a photodiode. There is no noticeable degradation of this channelat all, which suggests that the MEGS-B first grating (exposed to the full solar spectrum) isnot degrading either.

On-Orbit Degradation
8. Solar Instruments Onboard Picard
Picard is a scientific microsatellite (140 kilograms) that was launched on 15 June 2010. Pi-card is devoted to solar-variability observation through imagery and radiometric measure-ments, with the aim of providing data for solar-physics investigations, and for the assessmentof the influence of solar variability on the Earth’s climate variability. The PREcision MOn-itoring Sensor (PREMOS: Schmutz et al., 2009) and SOlar Diameter Imager and SurfaceMapper (SODISM: Meftah et al., 2010), whose evolution is described in this article, areradiometers used to measure the solar irradiance and an imaging telescope to determine thesolar diameter and asphericity, respectively.
8.1. Operational Modes and Degradation of PREMOS
PREMOS onboard the French satellite Picard comprises two experiments: one experiment ismeasuring the Total Solar Irradiance (TSI) with absolute radiometers, the other observes so-lar spectral irradiance at six different wavelengths with filter radiometers (given in Table 4).We report below on the second experiment. The optical and near-IR filters are identical tothose in the Picard/SODISM instrument and the 215-nm filter, while the 210-nm filter waschosen to match the Herzberg channel implemented on the PROBA2/LYRA instrument. ThePREMOS filter radiometer therefore covers an important part of the spectral range that in-fluences the chemical composition of the terrestrial atmosphere. The operational routinesbegan on 6 September 2010, and PREMOS filter radiometers have provided continuousdata since, even during the eclipse season. Using a total of twelve channels divided intothree instruments of four channels, a redundancy strategy has been established to estimatesensitivity loss due to exposure time to sunlight.
One channel (Head A) is operated continuously (six measurements per minute with anintegration time of 9.9 seconds for the normal mode), while its back-up channel (Head C) isexposed only once per day for three minutes. Finally, the Head B channel is a self-consistentsystem with duplicate channels; the first pair is exposed every fourth orbit for one minute,while the second pair is exposed once per week for about two minutes.
As displayed in Figure 25, Head A has experienced a pronounced degradation since ithas lost more than 99 % of the signal for the UV channels and about 35 % for the visiblechannel, while more than 86 % of the signal remains for the near-IR channel. We assume thatthis degradation is induced by the polymerization of contaminants on top of filters under thesolar UV exposure. We are currently investigating why the degradation is not a decreasingfunction for the visible and near-IR channels. Head C has been exposed for only 40 hourssince the beginning of the mission. For the UV channels (Head C), we estimate the lossof sensitivity to be about 10 % and 5 %, respectively. It is much more difficult, however,to estimate the degradation of the visible and near IR channels. The operational channelsof Head B have been exposed to the Sun for approximately sixty hours, while the back-upchannels have been exposed for less than four hours. We are currently using the channels ofHead B to model the degradation for all UV channels.
8.2. Aging of the Picard Payload Thermal Control: Impact on SODISM
SODISM is an 11-centimeter Ritchey–Chretien imaging telescope developed by the FrenchCentre National de la Recherche Scientifique (CNRS). SODISM measures the solar diam-eter and limb shape and performs helioseismic observations to probe the solar interior. Thesolar diameter is measured at three wavelengths in the photospheric continuum, i.e. 535,

A. BenMoussa et al.
Figure 25 Normalized time series for all channels of Head A since the beginning of the Picard mission.
Table 4 Wavelengthcharacteristics of the PREMOSfilter radiometers.
Channel 1 Channel 2 Channel 3 Channel 4
HEAD A 210 nm 535 nm 782 nm 266 nm
HEAD B 215 nm 607 nm 215 nm 607 nm
HEAD C 210 nm 535 nm 782 nm 266 nm
607, and 782 nm. Images in the Ca II line (393 nm) are used to detect active regions nearthe solar limb that could alter the diameter measurements. These images are also used tomeasure the solar differential rotation and to monitor space weather, together with imagesat 215 nm.
Throughout the mission, thermal control ensures that each instrument or equipment unitis maintained at temperatures consistent with nominal operation. Most of the instrumentsonly operate correctly if maintained at the right temperature and if temperature changes arewithin acceptable limits. Thermal-control surfaces and optics of the payload are exposedto space environmental effects including contamination, atomic oxygen, UV radiation, andvacuum temperature cycling. The elements of SODISM that are regulated and not exposed to

On-Orbit Degradation
Figure 26 Thermal effect on thesolar limb measurement at535.7 nm.
the Sun (e.g. CCD, interference filters, mechanism, structure) remain stable with changes intemperature. In flight, the temperature of the SODISM’s CCD (2028×2048) is very stable,within 0.1 ◦C.
Materials with low solar absorptance are often used for reflective surfaces designed tominimize heat absorption, but UV radiation degrades these materials by exponentially in-creasing the solar absorptivity of exposed surfaces. The contamination on thermal controlsurfaces alters absorptance/emittance ratios and changes the thermal balance, which leads toan increase of the payload temperature. Contamination in optical instruments, on the otherhand, reduces the signal throughput, which in turn reduces the performance even more. ThePicard payload thermal-control system includes several temperature-control techniques,such as reflective covers, coatings, insulation, and heat sinks. Aging of the covers, coat-ings, and insulation was observed and expected to be cumulative with time. The SODISMentrance window and the front of the instrument facing the Sun have a significant tempera-ture increase. A general aging of the thermal-control system is observed as well.
The temperature of the SODISM front face varies greatly during an orbit and its tempera-ture variation strongly depends on latitude and on the day of the year (variation and effect ofincident fluxes). This temperature evolution of the instrument front face principally impactsthe main entrance window and considerably degrades the measurement of the intensity pro-file’s first derivative at the solar limb, and consequently the measurement of the solar limbas illustrated in Figure 26.
Despite the establishment of an active thermal control, there are also environmental ef-fects on the SODISM instrument. We observed that the CCD is strongly affected by theSAA. The SODISM image intensity (normalized to 1 AU) is shown in Figure 27 and evolvesover time with
• intensity oscillation at 535.7 nm, 607.1 nm, and 782.2 nm,• intensity oscillation and significant degradation at 215 nm and 393.37 nm.
These effects might be caused by a combination of contamination and degradation at thedetector surface. To outgas the accumulated contaminant on the CCD surface, a bake-out
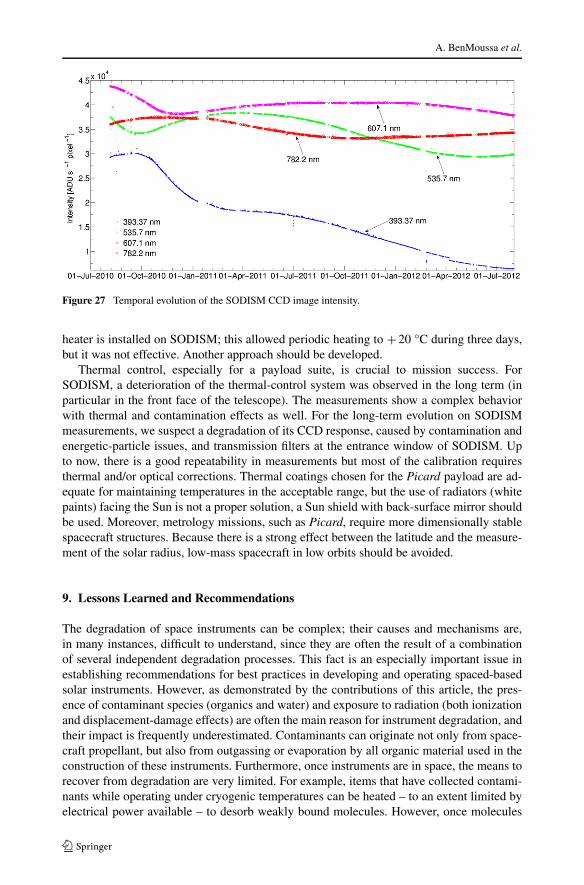
A. BenMoussa et al.
Figure 27 Temporal evolution of the SODISM CCD image intensity.
heater is installed on SODISM; this allowed periodic heating to +20 °C during three days,but it was not effective. Another approach should be developed.
Thermal control, especially for a payload suite, is crucial to mission success. ForSODISM, a deterioration of the thermal-control system was observed in the long term (inparticular in the front face of the telescope). The measurements show a complex behaviorwith thermal and contamination effects as well. For the long-term evolution on SODISMmeasurements, we suspect a degradation of its CCD response, caused by contamination andenergetic-particle issues, and transmission filters at the entrance window of SODISM. Upto now, there is a good repeatability in measurements but most of the calibration requiresthermal and/or optical corrections. Thermal coatings chosen for the Picard payload are ad-equate for maintaining temperatures in the acceptable range, but the use of radiators (whitepaints) facing the Sun is not a proper solution, a Sun shield with back-surface mirror shouldbe used. Moreover, metrology missions, such as Picard, require more dimensionally stablespacecraft structures. Because there is a strong effect between the latitude and the measure-ment of the solar radius, low-mass spacecraft in low orbits should be avoided.
9. Lessons Learned and Recommendations
The degradation of space instruments can be complex; their causes and mechanisms are,in many instances, difficult to understand, since they are often the result of a combinationof several independent degradation processes. This fact is an especially important issue inestablishing recommendations for best practices in developing and operating spaced-basedsolar instruments. However, as demonstrated by the contributions of this article, the pres-ence of contaminant species (organics and water) and exposure to radiation (both ionizationand displacement-damage effects) are often the main reason for instrument degradation, andtheir impact is frequently underestimated. Contaminants can originate not only from space-craft propellant, but also from outgassing or evaporation by all organic material used in theconstruction of these instruments. Furthermore, once instruments are in space, the means torecover from degradation are very limited. For example, items that have collected contami-nants while operating under cryogenic temperatures can be heated – to an extent limited byelectrical power available – to desorb weakly bound molecules. However, once molecules
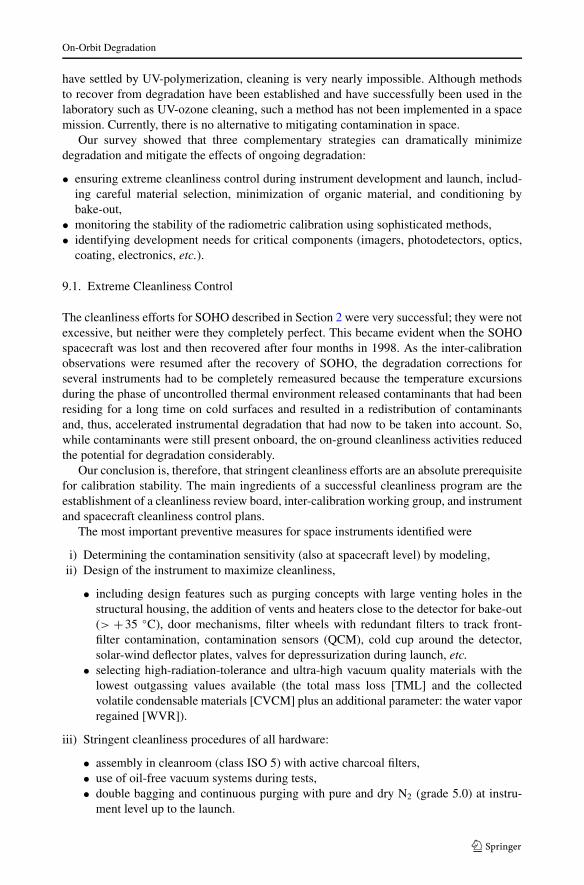
On-Orbit Degradation
have settled by UV-polymerization, cleaning is very nearly impossible. Although methodsto recover from degradation have been established and have successfully been used in thelaboratory such as UV-ozone cleaning, such a method has not been implemented in a spacemission. Currently, there is no alternative to mitigating contamination in space.
Our survey showed that three complementary strategies can dramatically minimizedegradation and mitigate the effects of ongoing degradation:
• ensuring extreme cleanliness control during instrument development and launch, includ-ing careful material selection, minimization of organic material, and conditioning bybake-out,
• monitoring the stability of the radiometric calibration using sophisticated methods,• identifying development needs for critical components (imagers, photodetectors, optics,
coating, electronics, etc.).
9.1. Extreme Cleanliness Control
The cleanliness efforts for SOHO described in Section 2 were very successful; they were notexcessive, but neither were they completely perfect. This became evident when the SOHOspacecraft was lost and then recovered after four months in 1998. As the inter-calibrationobservations were resumed after the recovery of SOHO, the degradation corrections forseveral instruments had to be completely remeasured because the temperature excursionsduring the phase of uncontrolled thermal environment released contaminants that had beenresiding for a long time on cold surfaces and resulted in a redistribution of contaminantsand, thus, accelerated instrumental degradation that had now to be taken into account. So,while contaminants were still present onboard, the on-ground cleanliness activities reducedthe potential for degradation considerably.
Our conclusion is, therefore, that stringent cleanliness efforts are an absolute prerequisitefor calibration stability. The main ingredients of a successful cleanliness program are theestablishment of a cleanliness review board, inter-calibration working group, and instrumentand spacecraft cleanliness control plans.
The most important preventive measures for space instruments identified were
i) Determining the contamination sensitivity (also at spacecraft level) by modeling,ii) Design of the instrument to maximize cleanliness,
• including design features such as purging concepts with large venting holes in thestructural housing, the addition of vents and heaters close to the detector for bake-out(> +35 ◦C), door mechanisms, filter wheels with redundant filters to track front-filter contamination, contamination sensors (QCM), cold cup around the detector,solar-wind deflector plates, valves for depressurization during launch, etc.
• selecting high-radiation-tolerance and ultra-high vacuum quality materials with thelowest outgassing values available (the total mass loss [TML] and the collectedvolatile condensable materials [CVCM] plus an additional parameter: the water vaporregained [WVR]).
iii) Stringent cleanliness procedures of all hardware:
• assembly in cleanroom (class ISO 5) with active charcoal filters,• use of oil-free vacuum systems during tests,• double bagging and continuous purging with pure and dry N2 (grade 5.0) at instru-
ment level up to the launch.

A. BenMoussa et al.
iv) Extensive use of vacuum bake-outs at the component, sub-assembly, and final-assemblylevel:
• baking at the highest temperature (> +100 ◦C) compatible with the material underclean-gas purging,
• bake-out durations determined by mass spectrometer and temperature-controlledQCM monitoring of cleanliness level,
• gas-chromatography/mass spectrometry (GC/MS) analysis for acceptance/rejectionof the components.
It should be added that the ground-support equipment that will be in direct contact with theflight hardware must be submitted to the same rules. As an example, cleanliness of vacuumchambers must be monitored by QCM or residual-gas analyzers.
9.2. Stability of the Instrument Radiometric Calibration
The careful and extensive radiometric calibration of the instruments prior to launch formsthe basis of the success of spaced-based solar instruments. In most cases, opportunities forinstrument-level tests and calibration are strongly limited by pre-launch scheduling con-straints, but this testing is important enough to warrant special consideration. Pre-flightcalibration can be achieved with detectors and transfer radiation-source standards, bothtraceable to a primary standard source found in synchrotron-radiation facilities, while theinstruments themselves can be calibrated at the synchrotron facility or locally, at the in-strument test facility, by transporting a transfer source standard to that facility. The latteroption additionally reduces the possibility of contamination by exposing the instrument toan environment whose cleanliness cannot be sufficiently regulated.
Once a spacecraft is in orbit, the stability of calibration can be monitored by carefullyplanned observations, but absolute calibration is often impossible. Consequently, a carefulinitial calibration and meticulous tracking of the evolution of instrumental calibration areboth very important. Several different methods of calibration may be required to achievethis goal (Schühle et al., 2002). Furthermore, qualified personnel and perhaps external ex-pertise are often useful in interpreting the obtained data, both on the ground and in-flight, toaccurately assess the degradation evolution of a space-based solar instrument.
9.2.1. Onboard Calibration
Onboard-calibration light sources have been essential to the success of many solar pay-loads, and similar devices should always be included in the design of space-based solarinstruments. Multiple calibration light sources (lamps or LEDs) may be carried onboard andshould be operated and exposed regularly to maintain an established calibration status. Itis worth noting that the value of calibration light sources is significantly reduced withoutpre-flight or pre-degradation reference data obtained during the on-ground calibration andin-flight commissioning phases of the mission.
However, for EUV–VUV and X-ray instruments, for which calibration sources in theprimary range of EUV instrumental sensitivity are not available, the onboard visible-lightflat-field that these onboard light sources provide can be used to monitor instrumental degra-dation if the relationship between visible and EUV degradation is known. Although suchlamps were used with great success in the in-flight calibration of EIT, these successes seemto be the exception rather than the rule. Ideally, however, it should be possible to establishthe relationship between visible and EUV degradation, as well as the degradation potential

On-Orbit Degradation
of the light sources themselves, before flight by irradiating engineering devices. Addition-ally, we strongly recommend the use of blue or near-UV LEDs that have photon penetrationdepths similar to or lower than the EUV photons observed by the instrument, and that everyeffort should be made to ensure complete and uniform detector illumination by these lampson future EUV telescopes.
9.2.2. Calibration Updates and Inter-Calibration
Alternatively, it is possible to track instrumental calibration by inter-calibration using ob-servations from occasional rocket underflights using similar instruments that can be care-fully calibrated on the ground both before and after the flight. Another option for establish-ing absolute calibration using in-flight observations are invariant sources – assuming theyare accessible by the instrument – such as observations of celestial standard sources or ofthe Sun-center during quiet periods, or by inter-calibrating identical variable sources us-ing different instruments with a similar corresponding wavelength sensitivity. In the caseof visible-light imaging instruments, observations of the background star field can also beused to monitor long-term degradation, as has been done very successfully in the case ofSTEREO/SECCHI’s HI-1 imager. However, for inter-calibration measurements, off-pointand roll maneuvers of the spacecraft platform may be required to correct for the effects ofspatial and spectral dependent degradation patterns (i.e. flat field and stray light).
9.2.3. Redundancy Concept
Redundancy can be implemented at either component or instrument levels (such as LYRAand PREMOS). Past experience shows that redundancy is useful in recovery from degra-dation and damage from different causes. For example, the degradation of thin-film filterstypically occurs during launch, but impact by debris or micrometeoroids (see, for example,EIT) can cause irreparable damage if redundant parts are not available. For radiometers, theuse of several spare units – the number may depend on the projected lifetime of the mis-sion – with separate door covers is strongly recommended. In addition to protecting againstpotential single-unit failures, observations by less-exposed units with a low duty-cycle –for example, a few minutes per week – can provide valuable information on the long-termevolution of the instrument.
9.3. Identification of Development Needs
Specific design and technological development is particularly important for UV instruments.For the SOHO UV instruments, the optical systems were quite stable during flight (Schühle,2003), but the detectors remained a source of instability (Thompson, 1999). This was duepartly to the temperatures of CCD detectors and partly to the effect of irradiation on the Sidevices, while detectors with multichannel-plate intensifiers suffered from gain depletionduring exposures.
This detector-degradation problem is frequently predicted before launch, but both its im-portance and severity are often underestimated. A list of all proven technologies and theirdegradation levels is beyond the scope of this article, but one especially important recom-mendation concerns the use of back-illuminated detectors, which affects both CCDs andCMOS APS detectors. The commonly used detector interface (Si/SiO2) is very sensitive toradiation damage (both by protons and UV photons) in space, which leads to a decline in de-tector sensitivity over time. However, proper surface passivation of the backside of existing

A. BenMoussa et al.
detectors can reduce the impact of radiation exposure, and intensive pre-flight characteri-zation can help to mitigate the damage that cannot be controlled. It would be worthwhileto explore the use of alternative oxides with greater radiation tolerance (e.g. Al2O3) andnon-oxide passivation layers.
In most cases, CCDs should be kept at the lowest possible operating temperature to re-duce dark current, the effects of radiation damage, and the appearance of hot, warm, and flip-ping pixels. Our analysis suggests that operating temperatures should be lower than −60 ◦Cfor non-inverting mode operation (NIMO) or −40 ◦C for asymmetric inverting mode oper-ation (AIMO) CCDs.
Finally, even while research and development in space technology is widely acknowl-edged as essential for designing future long-lifetime space missions, we recommend inten-sified efforts to develop advanced photon radiation detection systems, in particular thosedescribed below.
9.3.1. Next-Generation CMOS-APS
We expect that many future instruments will make use of highly efficient CMOS-APS de-tectors similar to the one used by SWAP. In fact, the Extreme Ultraviolet Imager (EUI),the Heliospheric Imager (SoloHI), and the Polarimetric and Helioseismic Imager (PHI)onboard the Solar Orbiter mission are all expected to incorporate the next-generation ofCMOS-APS detectors with significantly improved characteristics (see BenMoussa et al.,2013 for the detector prototype development of EUI).
9.3.2. Thoroughly Tested UV Filters
There is a great need for optical elements of all kinds (filters, grazing reflectors, and mirrors)with improved radiation tolerance and spectral purity. This need is demonstrated by therapid degradation of the UV filters on PROBA2 and Picard. For successful future missions,modeling and complete test campaigns for UV and visible filters (including radiation andcontamination simulations tests) are basic requirements.
9.3.3. Radiation-Hardened UV-Sensitive Materials
Radiation hardness against UV photons or protons is another primary concern for upcominglong solar missions that will remain in space for several years. There are promising alterna-tives to the commonly used silicon-based imagers and photodetectors based on wide band-gap materials such as the diamond detectors used in LYRA. Details of these next-generationdetectors are discussed by BenMoussa et al. (2009b). A proof-of-concept AlGaN imager(256 × 256 pixels), sensitive only to UV and operating at room temperature, has been re-cently reported by the Blind to Optical Light Detectors project (BOLD: Malinowski et al.,2011).
9.3.4. Onboard Data Processing
Given the issues that remain in providing high data-flow for nearly all space-based instru-ments, and, in particular, issues with the optimization of data-flow for spacecraft in low-telemetry orbits, future systems must be capable of high-performance onboard computing,which in turn requires high-performance, radiation-hardened, field-programmable gate ar-rays (FPGAs) that can perform automated onboard calibration. For some missions it will benecessary to update detector-calibration maps and perform onboard image correction suchas high-quality cosmic-ray removal in order to prevent unrecoverable distortion caused bylow-quality image compression or a very poor lossless compression ratio.

On-Orbit Degradation
10. Conclusion
The workshop that took place in the Solar Terrestrial Centre of Excellence (STCE) in Brus-sels, Belgium on 3 May 2012 provided an excellent starting point for a dialog betweenexperts and facilitated the exchange of much experience gained during space-based solarmissions. The outcomes of this meeting and discussion, together with the written contribu-tions of the different mission teams, have sparked this article which focused on the mainlessons learned about in-orbit degradation of solar instruments.
Although this article addressed scientists and, perhaps more specifically, engineers in-volved in spaced-based solar-instrument development, all stakeholders of any project shouldbe deeply involved in assessing and monitoring any degradation, and because the conse-quences of degradation can be quite severe, this problem should be taken extremely seri-ously.
There are several approaches to assessing and monitoring the degradation of spaced-based solar instruments that give good results, many of which we have discussed above.A prime conclusion of this work is that there is no single best method, but rather that acombination of methods must be critically selected, taking into account the applicabilityof the methods given the mission targets and the instrumental design itself. It is thereforeimportant to continue to share regular and open information about what is working and whatis not, so that we can all learn from the community’s shared experiences.
In particular, identifying the lessons learned from past projects is of special value tothe community and instrument teams themselves. Unfortunately, project teams often movequickly from project to project, and identifying the lessons learned rarely seems to be apriority. With this article, we hope to address this problem directly. We have identified thelessons learned by a broad range of instruments and missions that comprise a vast rangeof solar-physics objectives and span nearly two decades of experience. We hope that theselessons can be ingested by new instrument-development teams and, in turn, can prevent cur-rent and future missions from repeating past mistakes. It is the motivation of each individual(scientist and engineers) to learn, share, and change, which is what makes the lesson learnedsuccessful. Prevention is far better and much cheaper than cure.
Acknowledgements The authors acknowledge the support from the Belgian Federal Science Policy Office(BELSPO) through the Solar Terrestrial Centre of Excellence (STCE) program.
References
BenMoussa, A., Hochedez, J.F., Schühle, U., Schmutz, W., Haenen, K., Stockman, Y., Soltani, A., Scholze,F., Kroth, U., Mortet, V., Theissen, A., Laubis, C., Richter, M., Koller, S., Defise, J.-M., Koizumi, S.:2006, Diam. Relat. Mater. 15, 802.
BenMoussa, A., Dammasch, I.E., Hochedez, J.F., Schühle, U., Koller, S., Gillotay, D., Stockman, Y., Scholze,F., Richter, M., Kroth, U., Laubis, C., Dominique, M., Kretzschmar, M., Mekaoui, S., Gissot, S., Theis-sen, A., Giordanengo, B., Bolsée, D., Hermans, C., Gillotay, D., Defise, J.-M., Schmutz, W.: 2009a,Astron. Astrophys. 508, 1085.
BenMoussa, A., Soltani, A., Schühle, U., Haenen, K., Chong, Y.M., Zhang, W.J., Dahal, R., Jiang, H.X.,Bolsée, D., Hermans, C., Richter, M., Kroth, U., Giordanengo, B., Barkad, H.A., Mortet, V., De Jaeger,J.C., Scholze, F., Hochedez, J.F.: 2009b, Diam. Relat. Mater. 18, 860.
BenMoussa, A., Giordanengo, B., Gissot, S., Meynants, G., Wang, X., Wolfs, B., Bogaerts, J., Schühle, U.,Berger, G., Gottwald, A., Laubis, C., Kroth, U., Scholze, F.: 2013, IEEE Trans. Electron Devices, inpress.
Bewsher, D., Brown, D.S., Eyles, C.J., Kellett, B.J., White, G.J., Swinyard, B.: 2010, Solar Phys. 264, 433.ADS:2010SoPh..264..433B, doi:10.1007/s11207-010-9582-8.
A. BenMoussa et al.
Bewsher, D., Brown, D.S., Eyles, C.J.: 2012, Solar Phys. 276, 491. ADS:2012SoPh..276..491B, doi:10.1007/s11207-011-9874-7.
Brekke, P., Thompson, W.T., Woods, T.N., Eparvier, F.G.: 2000, Astrophys. J. 536, 959.Clette, F., Hochedez, J.-F., Newmark, J.S., Moses, J.D., Auchère, F., Defise, J.-M., Delaboudinière, J.-P.:
2002, In: Pauluhn, A., Huber, M.C.E., von Steiger, R. (eds.) The Radiometric Calibration of SOHO,ISSI SR-002, ESA, Nordwijk, 121.
Crommelynck, D.A.: 1982, In: Hall, J.B. Jr. (ed.) Fundamentals of Absolute Pyroheliometry and ObjectiveCharacterization, Earth Radiation Science Seminars CP-2239, NASA, Lougley 53.
Crommelynck, D.A., Dewitte, S.: 1999, Adv. Space Res. 24, 195.Culhane, J.L., Harra, L.K., James, A.M., Al-Janabi, K., Bradley, L.J., Chaudry, R.A., Rees, K., Tandy, J.A.,
Thomas, P., Whillock, M.C.R., Winter, B., Doschek, G.A., Korendyke, C.M., Brown, C.M., Myers, S.,Mariska, J., Seely, J., Lang, J., Kent, B.J., Shaughnessy, B.M., Young, P.R., Simnett, G.M., Castelli,C.M., Mahmoud, S., Mapson-Menard, H., Probyn, B.J., Thomas, R.J., Davila, J., Dere, K., Windt, D.,Shea, J., Hagood, R., Moye, R., Hara, H., Watanabe, T., Matsuzaki, K., Kosugi, T., Hansteen, V., Wik-stol, O.: 2007, Solar Phys. 243, 19. ADS:2007SoPh..243...19C, doi:10.1007/s01007-007-0293-1.
Defise, J.-M.: 1999, PhD thesis, Univ. de Liège.Defise, J.-M., Clette, F., Moses, J.D., Hochedez, J.-F.E.: 1997, Proc. SPIE 3114, 598.De Groof, A., Berghmans, D., Nicula, B., Halain, J.-P., Defise, J.-M., Thibert, T., Schühle, U.: 2008, Solar
Phys. 249, 147. ADS:2008SoPh..249..147G, doi:10.1007/s11207-008-9175-y.Delaboudinière, J.P., Artzner, G.E., Brunaud, J., Gabriel, A.H., Hochedez, J.F., Millier, F., et al.: 1995, Solar
Phys. 162, 291. ADS:1995SoPh..162..291D, doi:10.1007/BF00733432.Del Zanna, G., Andretta, V.: 2011, Astron. Astrophys. 528, A139.Del Zanna, G., Bromage, B.J.I., Landi, E., Landini, M.: 2001, Astron. Astrophys. 379, 708.Del Zanna, G., Andretta, V., Chamberlin, P.C., Woods, T.N., Thompson, W.T.: 2010, Astron. Astrophys. 518,
A49.Dewitte, S., Crommelynck, D., Joukoff, A.: 2004, J. Geophys. Res. 109, 2102.Didkovsky, L., Judge, D., Wieman, S., Woods, T., Jones, A.: 2012, Solar Phys. 275, 145.Eyles, C.J., Harrison, R.A., Davis, C.J., Waltham, N.R., Shaughnessy, B.M., Mapson-Menard, H.C.A.,
Bewsher, D., Crothers, S.R., Davies, J.A., Simnett, G.M., Howard, R.A., Moses, J.D., Newmark,J.S., Socker, D.G., Halain, J.-P., Defise, J.-M., Mazy, E., Rochus, P.: 2009, Solar Phys. 254, 387.ADS:2009SoPh..254..387E, doi:10.1007/s11207-008-9299-0.
Fehlmann, A., Kopp, G., Schmutz, W., Winkler, R., Finsterle, W., Fox, N.: 2012, Metrologia 49, 34.Fleck, B., Domingo, V., Poland, A.: 1995, Solar Phys. 162.Fröhlich, C.: 2003, Metrologia 40, 60.Fröhlich, C.: 2012, Surv. Geophys. 33, 453.Fröhlich, C., Romero, J., Roth, H., Wehrli, C., Andersen, B.N., Appourchaux, T., Domingo, V., Telljo-
hann, U., Berthomieu, G., Delache, P., Provost, J., Toutain, T., Crommelynck, D.A., Chevalier, A.,Fichot, A., Dappen, W., Gough, D., Hoeksema, T., Jimenez, A., Gomez, M.F., Herreros, J.M., Cortés,T.R., Jones, A.R., Pap, J.M., Willson, R.C.: 1995, Solar Phys. 162, 101. ADS:1995SoPh..162..101F,doi:10.1007/BF00733428.
Golub, L., Deluca, E., Austin, G., Bookbinder, J., Caldwell, D., Cheimets, P., et al.: 2007, Solar Phys. 243,63. ADS:2007SoPh..243...63G, doi:10.1007/s11207-007-0182-1.
Gottwald, A., Kroth, U., Richter, M., Schöppe, H., Ulm, G.: 2010, Meas. Sci. Technol. 21, 125101.Halain, J.-P., Berghmans, D., Seaton, D.B., Nicula, B., De Groof, A., Mierla, M., Mazzoli, A., Defise, J.-M.,
Rochus, P.L.: 2012, Solar Phys. doi:10.1007/s11207-012-0183-6.Harrison, R.A., Sawyer, E.C., Carter, M.K., Cruise, A.M., Cutler, R.M., Fludra, A., Hayes, R.W.,
Kent, B.J., Lang, J., Parker, D.J., et al.: 1995, Solar Phys. 162, 233. ADS:1995SoPh..162..233H,doi:10.1007/BF00733431.
Hochedez, J.-F., Schmutz, W., Stockman, Y., Schühle, U., BenMoussa, A., Koller, S., Haenen, K., Bergh-mans, D., Defise, J.-M., Halain, J.-P., Theissen, A., Delouille, V., Slemzin, V., Gillotay, D., Fussen, D.,Dominique, M., Vanhellemont, F., McMullin, D., Kretzschmar, M., Mitrofanov, A., Nicula, B., Wauters,L., Roth, H., Rozanov, E., Ruedi, I., Wehrli, C., Soltani, A., Amano, H., Van der Linden, R., Zhukov, A.,Clette, F., Koizumi, S., Mortet, V., Remes, Z., Petersen, R., Nesladek, M., D’Olieslaeger, M., Roggen,J., Rochus, P.: 2006, Adv. Space Res. 37, 303.
Hock, R.A.: 2012, Ph.D., University of Colorado, Boulder.Hock, R.A., Eparvier, F.G.: 2008, Solar Phys. 250, 207. ADS:2008SoPh..250..207H, doi:10.1007/
s11207-008-9203-y.Hollandt, J., Schühle, U., Paustian, W., Curdt, W., Kühne, M., Wende, B., Wilhelm, K.: 1996, Appl. Opt. 35,
5125.Howard, R.A., Moses, J.D., Vourlidas, A., Newmark, J.S., Socker, D.G., Plunkett, S.P., Korendyke, C.M.,
Cook, J.W., Hurley, A., Davila, J.M., Thompson, W.T., St Cyr, O.C., Mentzell, E., Mehalick, K., Lemen,

On-Orbit Degradation
J.R., Wuelser, J.P., Duncan, D.W., Tarbell, T.D., Wolfson, C.J., Moore, A., Harrison, R.A., Waltham,N.R., Lang, J., Davis, C.J., Eyles, C.J., Mapson-Menard, H., Simnett, G.M., Halain, J.P., Defise, J.M.,Mazy, E., Rochus, P., Mercier, R., Ravet, M.F., Delmotte, F., Auchere, F., Delaboudiniere, J.P., Bothmer,V., Deutsch, W., Wang, D., Rich, N., Cooper, S., Stephens, V., Maahs, G., Baugh, R., McMullin, D.,Carter, T.: 2008, Space Sci. Rev. 136, 67.
Judge, D.L., McMullin, D.R., Ogawa, H.S., Hovestadt, D., Klecker, B., Hilchenbach, M., Mobius, E., Can-field, L.R., Vest, R.E., Watts, R., Tarrio, C., Kuhne, M., Wurz, P.: 1998, Solar Phys. 177, 161 – 173.ADS:1998SoPh..177..161J, doi:10.1023/A:1004929011427.
Klein, K., Brandt, G., Fliegauf, R., Hoehl, A., Müller, R., Thornagel, R., Ulm, G., Abo-Bakr, M., Feikes, J.,v. Hartrott, M., Holldack, K., Wüstefeld, G.: 2008, Phys. Rev. Spec. Top., Accel. Beams 11, 110701.
Kopp, G., Lean, J.L.: 2011, Geophys. Res. Lett. 38, 1706.Kopp, G., Harber, D., Heuerman, K.: 2011 In: AGU Fall Meeting Abstracts, A910.Kuhn, J.R., Loranz, D.: 1991, Pub. Astron. Soc. Pac. 103, 1097.Kuin, N.P.M., Del Zanna, G.: 2007, Solar Phys. 242, 187. ADS:2007SoPh..242..187K, doi:10.1007/
s11207-007-0306-7.Lang, J., Kent, B.J., Breeveld, A.A., Breeveld, E.R., Bromage, B.J.I., Hollandt, J., et al.: 2000, J. Opt. A, Pure
Appl. Opt. 2, 88.Lang, J., Thompson, W.T., Pike, C.D., Kent, B.J., Foley, C.R.: 2002, In: Pauluhn, A., Huber, M.C.E., von
Steiger, R. (eds.) The Radiometric Calibration of SOHO, ISSI SR-002, ESA, Nordwijk, 105.Lemaire, P.: 2002, In: Pauluhn, A., Huber, M.C.E., von Steiger, R. (eds.) The Radiometric Calibration of
SOHO, ISSI SR-002, ESA, Nordwijk, 265.Livingston, W., Wallace, L., White, O.R., Giampapa, M.S.: 2007, Astrophys. J. 657, 1137.Livingston, W., White, O.R., Wallace, L., Harvey, J.: 2010, Mem. Soc. Astron. Ital. 81, 643.Llebaria, A., Lamy, P., Danjurd, J.-F.: 2006, Icarus 182, 281.Malinowski, P.E., Duboz, J.-Y., De Moor, P., John, J., Minoglou, K., Srivastava, P., Semond, F., Frayssinet,
E., Giordanengo, B., BenMoussa, A., Kroth, U., Gottwald, A., Laubis, C., Mertens, R., Van Hoof, C.:2011, IEEE Electron Device Lett. 32, 1561.
McMullin, D.R., Judge, D.L., Hilchenbach, M., Ipavich, F., Bochsler, P., Wurz, P., Burgi, A., Thompson,W.T., Newmark, J.S.: 2002, In: Pauluhn, A., Huber, M.C.E., von Steiger, R. (eds.) The RadiometricCalibration of SOHO, ISSI SR-002, ESA, Nordwijk, 135.
Meftah, M., Meissonnier, M., Irbah, A., Abbaki, S., Assus, P., Bertran, E., Dubois, J.P., Ducourt, E., Dufour,C., Marcovici, J.P., Poiet, G., Vieau, A.J., Thuillier, G.: 2010, Proc. SPIE 773, 773145.
Mekaoui, S., Dewitte, S., Conscience, C., Chevalier, A.: 2010, Adv. Space Res. 45, 1393.Moses, D., Clette, F., Delaboudinière, J.-P., Artzner, G.E., Bougnet, M., Brunaud, J., Carabetian, C., Gabriel,
A.H., Hochedez, J.F., Millier, F., Song, X.Y., Au, B., Dere, K.P., Howard, R.A., Kreplin, R., Michels,D.J., Defise, J.M., Jamar, C., Rochus, P., Chauvineau, J.P., Marioge, J.P., Catura, R.C., Lemen, J.R.,Shing, L., Stern, R.A., Gurman, J.B., Neupert, W.M., Newmark, J., Thompson, B., Maucherat, A.,Portier-Fozzani, F., Berghmans, D., Cugnon, P., van Dessel, E.L., Gabryl, J.R.: 1997, Solar Phys. 175,571. ADS:1997SoPh..175..571M, doi:10.1023/A:1004902913117.
Pauluhn, A., Solanki, S.K.: 2003, Astron. Astrophys. 407, 359.Pauluhn, A., Huber, M.C.E., von Steiger, R. (eds.): 2002, The Radiometric Calibration of SOHO, ISSI SR-
002, ESA, Nordwijk.Pauluhn, A., Rüedi, I., Solanki, S.K., Schühle, U., Wilhelm, K., Lang, J., Thompson, W.T., Hollandt, J.: 2001,
Appl. Opt. 40, 6292.Pickles, A.J.: 1998, Pub. Astron. Soc. Pac. 110, 863.Schmutz, W., Fehlmann, A., Hüsen, G., Meindl, P., Winkler, R., Thuillier, G., Blattner, P., Buisson, F.,
Egorova, T., Finsterle, W., Fox, N., Gröbner, J., Hochedez, J.-F., Koller, S., Meftah, M., Meisonnier,M., Nyeki, S., Pfiffner, D., Roth, H., Rozanov, E., Spescha, M., Wehrli, C., Werner, L., Wyss, J.U.:2009, Metrologia 46, S202.
Schühle, U.: 1993, In: Silver, E.H., Kahn, S.M. (eds.) UV and X-Ray Spectroscopy of Laboratory and Astro-physical Plasmas, Cambridge University Press, Cambridge, 373.
Schühle, U.: 2003, In: Keil, S.L., Avakyan, S.V. (eds.) Innovative Telescopes and Instrumentation for SolarAstrophysics, Proc. SPIE 4853, 88.
Schühle, U., Wilhelm, K., Hollandt, J., Paustian, W., Kühne, M.: 1994, In: Proc. of the International Workshopon VUV and X-Ray Radiometry for Space Based Instruments, PTB Berlin, 69.
Schühle, U., Brekke, P., Curdt, W., Hollandt, J., Lemaire, P., Wilhelm, K.: 1998, Appl. Opt. 37, 2646.Schühle, U., Thomas, R., Kent, B., Clette, F., Defise, J.-M., Delaboudinière, J.-P., Fröhlich, C., Gardner, L.,
Kohl, J., Hochedez, J.-F., Moses, J.D.: 2002, In: Pauluhn, A., Huber, M.C.E., von Steiger, R. (eds.) TheRadiometric Calibration of SOHO, ISSI SR-002, ESA, Nordwijk, 289.
Seaton, D.B., Berghmans, D., Nicula, B., Halain, J.-P., De Groof, A., Thibert, T., Bloomfield, D.S.,Raftery, C.L., Gallagher, P.T., Auchère, F., Defise, J.-M., D’Huys, R., Lecat, J.-H., Mazy, E.,
A. BenMoussa et al.
Rochus, P., Rossi, L., Schühle, U., Slemzin, V., Yalim, M.S., Zender, J.: 2012, Solar Phys.doi:10.1007/s11207-012-0114-6.
Sperfeld, P., Metzdorf, J., Harrison, N.J., Fox, N.P., Khlevnoy, B.B., Khromchenko, V.B., Mekhontsev, S.N.,Shapoval, V.I., Zelener, M.F., Sapritsky, V.I.: 1998, Metrologia 35, 419.
Thernisien, A.F., Morrill, J.S., Howard, R.A., Wang, D.: 2006, Solar Phys. 233, 155.ADS:2006SoPh..233..155T, doi:10.1007/s11207-006-2047-4.
Thompson, W.T.: 1999, Proc. SPIE 3764, 196.Thompson, W.T.: 2000, Opt. Eng. 39, 2651.Thompson, W.T.: 2006, In: Lacoste, H. (ed.) SOHO-17. 10 Years of SOHO and Beyond SP-617, ESA, Nord-
wijk.Thuillier, G., Foujols, T., Bolsée, D., Gillotay, D., Hersé, M., Peetermans, W., Decuyper, W., Man-
del, H., Sperfeld, P., Pape, S., Taubert, D.R., Hartmann, J.: 2009, Solar Phys. 257, 185.ADS:2009SoPh..257..185T, doi:10.1007/s11207-009-9361-6.
Tsuneta, S., Ichimoto, K., Katsukawa, Y., Nagata, S., Otsubo, M., Shimizu, T., et al.: 2008, Solar Phys. 249,167.
Wang, T., Thomas, R.J., Brosius, J.W., Young, P.R., Rabin, D.M., Davila, J.M., Del Zanna, G.: 2011, Astro-phys. J. 197, 32.
Wehrli, C., Fröhlich, C., Romero, J.: 1996, Metrologia 32, 653.Wilhelm, K., Curdt, W., Marsch, E., Schühle, U., Lemaire, P., Gabriel, A., et al.: 1995, Solar Phys. 162, 189.
ADS:1995SoPh..162..189W, doi:10.1007/BF00733430.Woods, T.N., Eparvier, F.G., Hock, R., Jones, A.R., Woodraska, D., Judge, D., Didkovsky, L., Lean, J.,
Mariska, J., Warren, H., McMullin, D., Chamberlin, P., Berthiaume, G., Bailey, S., Fuller-Rowell,T., Sojka, J., Tobiska, W.K., Viereck, R.: 2012, Solar Phys. 275, 115. ADS:2012SoPh..275..115W,doi:10.1007/s11207-009-9487-6.
Zacharias, N., Monet, D.G., Levine, S.E., Urban, S.E., Gaume, R., Wycoff, G.L.: 2004, Bull. Am. Astron. Soc.36, 1418.