paresh parekh, unicade inc. - aceee
TRANSCRIPT

Fluid Flow Systems AnalysisTo Save Energy
Paresh S. Parekh, Unicade Inc.
ABSTRACT
Industrial processes use rotating equipment (e.g.; pump, fan, blower, centrifugalcompressor, positive displacement compressor) and pipe (or duct) to·move fluid from point Ato B, with many processes using electric motors as the prime mover.
Most of the systems in the industry are over-designed to meet a peak load demandwhich might occur over a small fraction of the time or to satisfy a higher pressure demandedby a much smaller user in the same process.. The system over-design will result in a selectionof larger but inefficient rotating equipment and electric motor system. Some of the typicaldesign examples that result in higher energy usage are given below.... A rotating equipment serving multiple end-users with varied process needs.4) Under-designed system components such as a smaller pipe diameter, a longer pipe run,
and/or a smaller control valve taking excessive pressure drop.e A multi-pass heat exchanger to obtain closer temperature approach and an exchanger with
a smaller suIface area to reduce the capital cost. The process, however, is penalized with ahigher pressure drop and a higher annual operating cost.
(3 A routine practice in the process industry to design process control valves that consume asmuch as 30% of the system pressure drop or 10 psi mininlum at normal fluid flow.
e A centrifugal p or fan not operating on its best efficiency point (BEP) of the curve.A careful life cycle cost and economic evaluation must be undertaken to ensure that
the process audit, reengineering and equipment selections are not impacting the industrialprocess goals, but result in a least optimal cost over the life of the project.
The paper will define, discuss, and present various ''process systems" in chemical,hydrocarbon and pulp & paper industries. It will discuss the interactive impact of the changesin the mechanical system configuration and the changes in the process variables to betterredesign the system and reduce the cost of operation. It will also present a check list of energyconservation measures ("ECM") or opportunities$ Such ECMs will be related to hydraulics,system components, process modifications, and system efficiency.. Two or three case studieswill be presented focusing on various conservation measures that improve electrical operatingefficiency of a distillation column system.. An incremental cost and payback analysis will bepresented to assist the investment in process optimization and energy savings' measures.
Defining the Fluid Flow Systems
typical fluid flow system consists of a mechanical system and a process system. Aocess ow gram (PFD) defines the heat and material balance for that fluid flow system,
and a ing and Instrumentation Diagram (P&ID) defines the mechanical and designconfiguration of the same system.. For example, a mechanical system of a compressed air
605

system may consist of various end-users of compressed air, delivery or distribution system(piping, valves, fittings, controls, etc.), compressor (centrifugal or positive displacement), itsassociated equipment (aftercooler, receiver, dryer, filter, etc.), and a driver (electric motor).
The process system will consist of air pressure and temperature at end-users, quantityand quality of air requirement, physical properties (molecular weight, polytropic exponent),ambient air temperature and air pressure, moisture in the suction air, etc. The energyconsumption is impacted by the design of mechanical and process systems as well as the end...user load profile and hours of operation. It is very important to understand the technicalequations used in the calculations of flow rate at various standard temperature and pressure(STP) options, inlet air density, outlet air density, compressor capacity, adiabatic or polytropichead, discharge temperature, break horsepower, and compression ratio. A further discussionof a recent article on compressed air can be found in Energy Engineering, (Volume 95, No.6,1998) and therefore, another case study from a petrochemical industry will be presented in thenext section.
Design Practice and Baseline Model
A design engineering firm nonnally evaluates the three operating scenarios at best;namely, the normal flow, the maximum flow, and the turndown flow. The pipe, fittings, andpumps are selected using the maximum flow rate, but control valves are sized to operateunder the all three flow conditions.. This may result in control valve pressure drop at thenonnal flow rate to be as much as 30...40% of the system pressure drop or 10-15 psi minimum.The electric motor is usually a next larger size than the one estimated at maximum flow ratecondition" In addition, a single pump is generally designed to serve many users. The sum ofall load is the pump flow capacity. The total dynamic head of the pump is, however,controlled by one user which either requires a higher delivery pressure or is far away (such astank fann) with an undersized pipe line and/or the user has a high static head requirement. Inany case, that flow loop becomes the controlling head for the pump selection. A control valve
other circuits or loops will consume the additional pressure drop.. An engineer can startpreparing an off-line model of the system and develop a baseline or current operation modelonce the process boundaries are drawn and set points (related to pressure, flow, level or evenfluid composition) are established. A spread sheet or a computer software program can assistin the baseline model development. The friction losses due to pipe, fittings, and valves arecalculated. An estimation or field measurement of pressure drop in overhead condenser, heatexchanger, filter, etc.. is madeo Once the system model is verified, then various "what if' casestudies are conductecL The goal is to develop an optimal model of a fluid flow system thatmeets the production targets as well as minimizes the energy usage under various operatingscenarios.. Most chemical plants and refineries operate 24 hours a day, 7 days a week, yeararound with minimum planned downtime.. The fonowing section outlines a case study problemstatement for fluid flow systems analysis and its analysis of energy savings' options"
606
Case Study Problem Statement
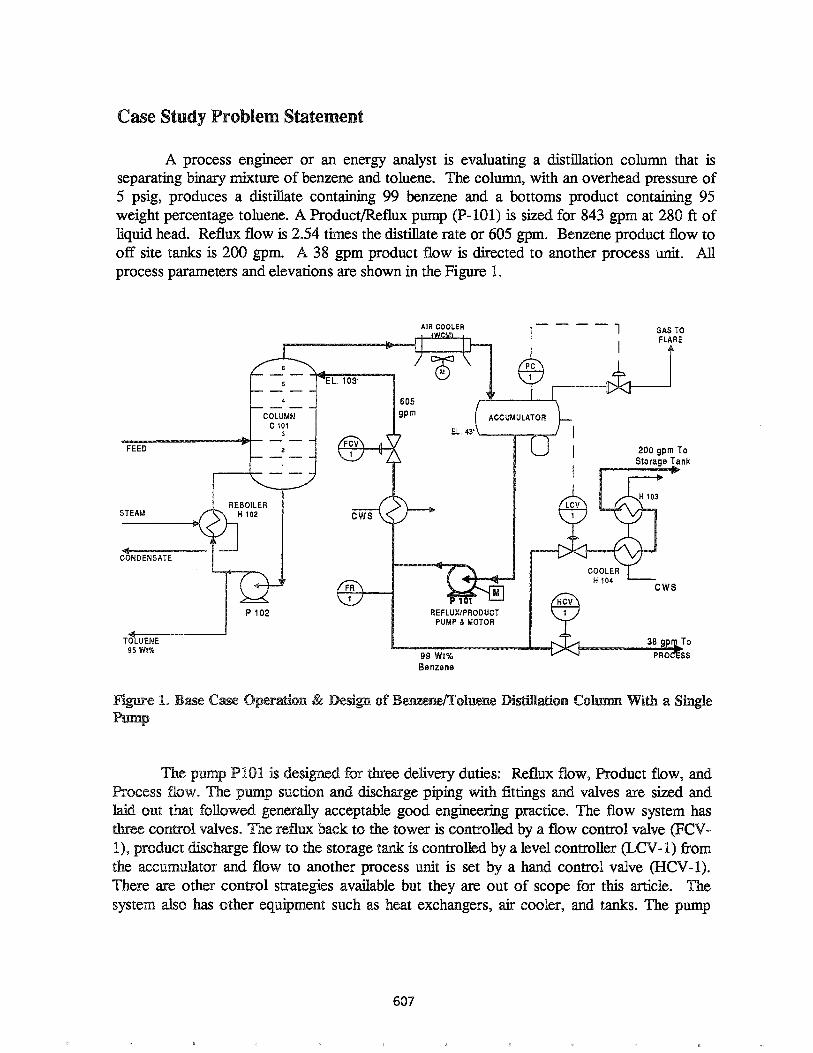
A process engineer or an energy analyst is evaluating a distillation column that isseparating binary mixture of benzene and toluene. The column, with an overhead pressure of5 psig, produces a distillate containing 99 benzene and a bottoms product containing 95weight percentage toluene. A Product/Reflux pump (P-IOl) is sized for 843 gpm at 280 ft ofliquid head. Reflux flow is 2.54 times the distillate rate or 605 gpm. Benzene product flow tooff site tanks is 200 gpm. A 38 gpm product flow is directed to another process unit. Allprocess parameters and elevations are shown in the Figure 1.
GAS TOFLARE
CWS
PRO S8
38 gp To
200 gpm ToStorage Tank
REFLUX/PRODUCTPUMP & MOTOR
99 Wt%Benzene
FR
COLUMNC 101
3
P 102
REBOILERH 102
FEED
TO UENE95Wt%
STEAM
CONDENSATE
EL. 103'
Ona1r~'t'i6'lItn & sign of Benzene/Toluene Distillation Column With a Single
pump PlOl is designed for three delivery duties: Reflux flow, Product flow, andProcess flow.. The pump suction and discharge piping with fittings and valves are sized andlaid out that followed generally acceptable good engineering practice. The flow system hasthree control valves$ The reflux back to the tower is controlled by a flow control valve (Fev...1), product discharge flow to the storage tank is controlled by a level controller (LeV-I) fromthe accumulator and flow to another process unit is set by a hand control valve (HeV-I)..There are other control strategies available but they are out of scope for this article. Thesystem also has other equipment such as heat exchangers, air cooler, and tanks.. The pump
607

PIOI is a Goulds mode13x4-13 LTX, 3196 with a 75 hp electric motor. The certified pumpcurve information is available in the maintenance engineering file and is used in the analysis toplot systems curve and characteristic curves at different operating scenarios.
The following above grade physical elevations and the delivery pressures (Table 1)were noted on the P&IDs and verified in the field.
Table 1. Base Case Elevation and Delivery Pressure
Reflux line to top of columnPump centerlineAccumulator liquid levelStorage tank normal levelProcess unit
Elevation above Grade, Ft.1033
432313
very Pressure, psia20.17124NA1525
The goal is to evaluate and optimize the process design, and to reduce the energyusage0 The analysis will create more than one case study. Each case study will have one ormore changes in Process System as well as Mechanical System. Interactive effect of more thanone ECM will have to be factored in the energy usage.. For this analysis, we will assume thatsteady state flow requirements will not be changed.. We will primarily focus on splitting thepump P-IOI duty into two parallel pumps, one dedicated to reflux flow only and anotherpump for product and process discharge flow.. e will also evaluate implementation of avariable frequency drive (VFD) replacing flow control valve, and re-plot the pumpcharacteristic curve, system curve and estimate energy savings.. Appropriate changes to thecontrol valve pressure drop will be made to meet the process design requirements. OtherECMs can be larger pipe sizes, rerouting of lines to reduce length, but those changes can beexpensive and may not result good implementable projects.. A check list of possible ECMsis presented in a later section..
Ba Case Model
It is important to model the base case accurately to establish which flow circuit (enduser) out of three flow circuits controls the pump selection. The pump flow is sum of all threeend-user flow requirement, t the pump head is determined from the worst case end-userdemand, which, this case is the reflux flow circuit from the Pump 101 back to the top ofcolumn.. The flow control valve pressure drop at normal flow is 30 psi The two other flowcircuits will have the same pump discharge pressure, but the control valves (Lev-1 and HeV1) ~ be sized to consume that additional head.. At normal flow rates, the level control valve
e flow circuit to tank W have a pressure drop of 64 psi and the hand control valve in theflow circuit to another process unit will have a pressure drop of 94 psi.
608
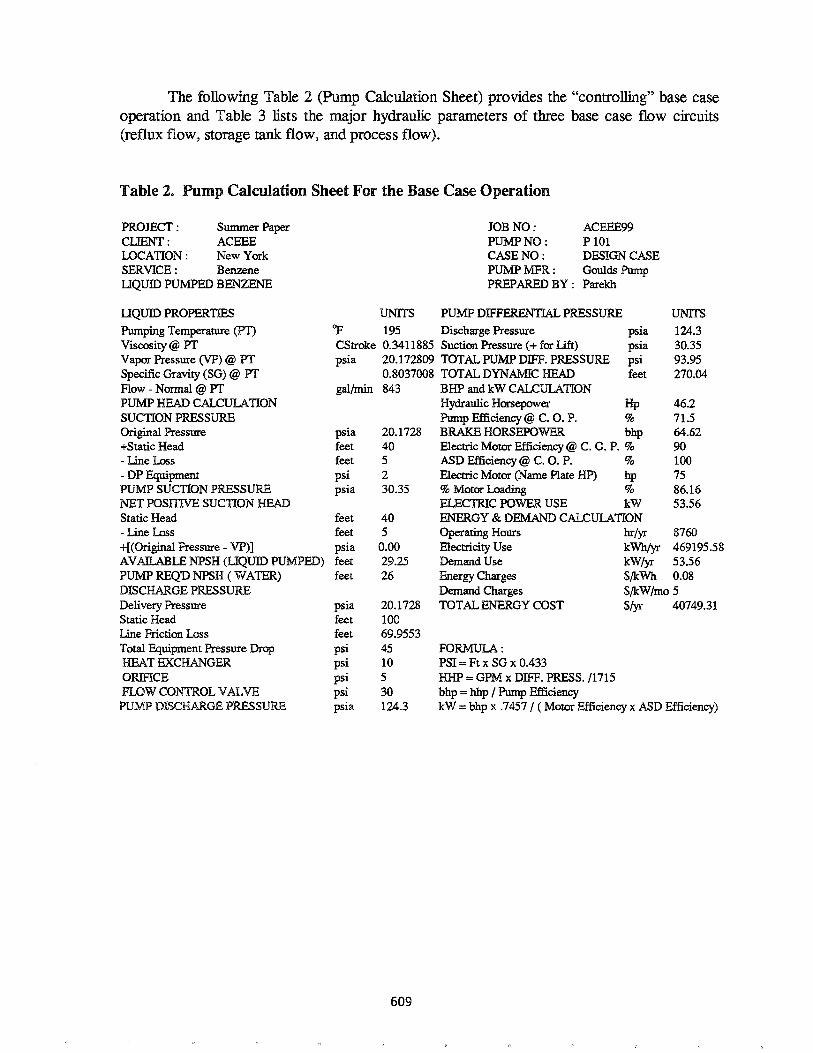
The following Table 2 (Pump Calculation Sheet) provides the "controlling" base caseoperation and Table 3 lists the major hydraulic parameters of three base case flow circuits(reflux flow, storage tank flow, and process flow).
Table 2. Pump Calculation Sheet For the Base Case Operation
gal/min 843 BHP and kW CALCULATIONHydraulic Horsepower Hp 46.2Pump Efficiency@ C. O. P. % 71.5
psia 20.1728 BRAKE HORSEPOWER bhp 64.62feet 40 Electric Motor Efficiency @ C. o. P. % 90feet 5 ASD Efficiency @ C. o. P. % 100psi 2 Elec1ric Motor (Name Plate HP) hp 75psia 30.35 % Motor Loading % 86.16
ELECTRIC POWER USE kW 53.56feet 40 ENERGY & DEMAND CALCULATIONfeet 5 Operating Hours hr/yr 8760psia 0.00 Elec1ricity Use kWh/yr 469195.58feet 29.25 Demand Use kW/yr 53.56feet 26 Energy Charges $/kWh 0.08
Demand Charges $/kW/mo 5psia 20.1728 TOTAL ENERGY COST $/yr 40749.31feet 100feet 69.9553psi 45 FORMULA:psi 10 PSI = Ft x SO x 0.433psi 5 HHP = GPM x DIFF. PRESS./1715psi 30 bhp = hhp / Pump Efficiencypsia 124.3 kW = bhp x .7457 / (Motor Efficiency x ASD Efficiency)
JOB NO : ACEEE99PUMP NO : P 101CASE NO : DESIGN CASEPUMP MFR : Goulds PumpPREPARED BY : Parekh
PROJECT: Summer PaperCLIENT : ACEEELOCATION: New YorkSERVICE: BenzeneUQUID PUMPED BENZENE
liQUID PROPERTIESPumping Temperature (PI)Viscosity @ PTVapor Pressure (VP) @ PTSpecific Gravity (SG) @ PTFlow - Nanna! @ PI'PUMP HEAD CALCULATIONSUCTION PRESSUREOriginal Pressure+Static Head- Line Loss- DP EquipmentPUMP SUCTION PRESSURENET POSmvE SUCTION HEADStatic Head-LineLoss+[(Original Pressure - VP)]AVATI..ABLE NPSH (liQUID PUMPED)PUMP REQ'D NPSH (WATER)DISCHARGE PRESSUREDelivery PressureStatic HeadLine Friction LossTotal Equipment Pressure DropHEAT EXCHANGERORIFICEFLOW CONTROL VALVB
PUMP DISCHARGE PRESSURE
UNITS PUMP DIFFERENTIAL PRESSURE<>P 195 Discharge PressureCStroke 0.3411885 Suction Pressure (+ for Lift)psia 20.172809 TOTALPUMPDIFF. PRESSURE
0.8037008 TOTAL DYNAMIC HEAD
609
psiapsiapsifeet
UNITS124.330.3593.95270.04

Table 3. Hydraulic Parameters of Base Case Single Pump Service
Reflux Product ProcessCircuit 1 Circuit 2 Circuit 3
Pump Flow - Nonnal @ PT 843 843 843Circuit Flow - Nanna! @ PT gpm 605 200 38PUMP SUCTION PRESSURE psia 30.35 30.35 30.35DISCHARGE PRESSUREDelivery Pressure psia 20.1728 15 25Static Head feet 100 20 10Line Friction Loss feet 69.9 43.5 6.64Total Equipment Pressure Drop psi 45 87.5 94
Heat Exchanger 1 psi 10 10 NAHeat Exchanger 2 psi NA 15 NAOrifice psi 5 NA NAControl Valve psi 30 62.5 94
PUMP DISCHARGE PRESSURE psia 124.3 124.3 124.3Total Pump Diff. Pressure psi 93.95 93.95 93.95Total Dynamic Head feet 270.04 270.04 270.04Pump Efficiency % 71.5 71.5 71.5Break Horsepower bhp 64.62 64.62 64.62E GY USE (Annual) kWh 469,195 469,195 469,195
Systems Analysis To Save Energy
It is important to understand and model the existing operation using either a spreadsheet or a computer software program specifically designed for the fluid flow systems analysis..This should be followed by the analysis of one or many processes and mechanical componentvariables to evaluate the impact on power usage by these changes. A brief check list of energyconservation measures is given below that can be applied to pump, fan, blower, andcompressor systems" We will evaluate some of the measures in the following sections..
Pressure Drop
@ Reduce piping system pressure loss by increasing the line size and rerouting the pipes~
4& Optimize process equipment pressure loss in the flow lines.@ or eliminate control valve pressure loss..
610

System Efficiency
@ Operate rotating equipment at or close to its best efficiency point.e Split a single system into more than one to achieve higher aggregate O&M efficiency.• Downsize the pump (or trim impeller or modify compressor wheels) and motors. This is
only an end-result of the system improvement or optimization.41)) Modify a process control scheme, including loading/unloading and spillback controls on
positive displacement compressors, and location of throttling control.e Install variable frequency drives (VFD) - investigate needs and implications carefully. The
variable frequency drive is not always the best solution!• Improve the operating efficiency by implementing an energy recovery strategy.. For
example, recover heat of compression to heat a building or replace a low pressure steamheating.
ED Replace the standard efficiency motors by the premium efficiency motors.
Process Modifications
* Lower the delivery pressure (without impacting process requirement) at user(s).@ Lower the pressure profile of the system.• Incorporate an advanced process control scheme and algorithm to eliminate operator
intervention~
• Reroute or resequence the process streams..® Reduce the compressor inlet temperatures• Regenerate or replace catalyst (same for in-line filters) to eliminate an excessive pressure
drops due to carbon build-up.® Reduce or eliminate the minimum flow by-pass recirculation flow..
Energy Conservation Measures
e will investigate three ECMs detail and evaluate their impact on energy savings~
Please note that there will be many other measures (singular or combination) that can beinvestigated. The goal, however, must be to pick the most cost effective measures foranalysis.. These measures will have a greater chance for implementation& The followingmeasures are analyzed further..
1.. ECM 1: Divide the pump P-IOI hydraulic duty into two separate pumps operating inparallel..E 2: After implementing the ECM 1, investigate a variable speed drive to replace theflow control valve in the reflux line.E 3: Increase the reflux line size from 4" to 5"" This ECM 3 is inclusive of the ECM1 and ECM 2..
611

Two Pumps in Parallel (ECM 1)
The following Figure 2 shows how the benzene/toluene distillation system will beserved by two pumps. All other mechanical and process parameters will remain the same asthe base case.
GAS TOFLARE
200 gpm To
TANK
REFLUXPUMP & MOTOR
605gpm
L. 103'6
5
COLUMNC101
3
P 102
FEED
c15NDENSATE
STEAM
'Ii LUENE 38 gp To
PROC SS
Figure Two Pumps in Parallel
The Table 4 on the next page summarizes the key variables of the base case and ECM1 case, and estimates a 13.6% energy saving. The energy saving is due to a reduced pressuredrop LeV-! and HeV-l control valves.. The alternate pump P-101 is a Goulds model 3196MTX, size 3x4-10 process pump" It has a slightly better mechanical efficiency (72.8%) thant base case pump.. The new product pump (P-I03) has a 63% pump efficiency at the nonnalflow rate of 238 gpm at 135 ft of head" In all case studies, a 90% elecnical motor efficiency isused. It should noted that upgrading a standard efficiency motor to premium efficiencymotor would only gain 2-4% in operating efficiency.. However, upgrading and selecting aright pump would significantly increase the operating efficiency by as much as 5 to 10%. Anenergy engineer should focus on fluid flow systems components (e.g., motor, pump, VFD,pipe, control valves, etc.) that could improve system efficiency dramatically while keeping thecost down"
The controlling hydraulic case for the pump P-I03 is product flow to the storage tanktwo coolers in the series.. As you will notice, an additional electrical energy saving can be
achieved by reconfiguring two coolers from series to parallel operation (eliminates 10 psipressure loss) and increasing the line size to the storage tank (reduces-6 psi)"
612

Table 4. Hydraulic Parameters of Two Pumps in Parallel (ECM 1)
Base Split Pump ECM 1Case Reflux Product
Pump Flow - Normal @ PT 843 605 238Circuit Flow - Normal @ PT gpm 843 605 238PillvIP SUCTION PRESSURE psia 30~35 30.35 30.35DISCHARGE PRESSUREDelivery Pressure psia 20.1728 20.1728 15Static Head feet 100 100 20Line Friction Loss feet 69.9 69.9 43~5
Total Equipment Pressure Drop psi 45 45 40Heat Exchanger 1 psi 10 10 10Heat Exchanger 2 psi NA NA 15Orifice psi 5 5 NAControl Valve psi 30 30 15
PillvIP DISCHARGE PRESSURE psia 124.3 124.3 77.11Total Pump Diff Pressure pSI 93.95 93.95 46.76Total Dynamic Head feet 270.04 270.04 134.39Pump Efficiency % 71.5 72.8 63Break Horsepower bhp 64.62 45.55 10.3ENERGY USE (Annual) kWh 74,816Energy Savings Over Base Case kWh 63,673Percent Energy Savings % 13@57%
variable speed drive for the reflux flow (ECM 2)
It is assumed that the control system response time permits a replacement of thecurrent flow control valve by a variable speed drive~ The VFD will control the reflux flow thatis either set column overhead temperature, pressure or composition. During the nonnaloperation, the system will see duction in system pressure profile equivalent to controlvalve pressure drop (30 psi). Figure 3 plots system curve and pumps curves at normal speedas well as at variable speed..
It should be noted that during turndown. and reduced reflux flow rates., the savings willbe even greater with a VFD. For example, at reduced reflux ratio of2.0 (versus base case of2..65), the reflux flow will decrease to 476 gpIlL This will result in reduced discharge pipefrictional losses to 43.31 feet from 69.9 feet (LlP ce floW2). The flow control valve will pinchclose to absorb the additional pipe pressure loss and higher head generated by the pump curveat the lower flow.. In this specific case, the system gains discharge line friction loss of 26.59feet (=69.9-43.31), the exchanger frictional loss drops from 10 psi to 6.. 19 psi, and the orificepressure drop is now 3,,1 psi from base case 5 psi. The pump head (without a VFD) would be
613

99.56 psi or 286.15 feet of liquid. The flow control valve, FeV-1, now has a pressure drop of52 psi, an increase of 22 psi over the base case operation. A VFD, with a 96% efficiency,would save 15.62 kW or 49% savings over the case ifno VFD was used but only the refluxflow was reduced from 605 gpm to 476 gpm. This case is not further presented due to spacelimitations.
~RotarySCfe'vll
Size & TJIIPt:: 3X4-10 3190 IiITXJc:lb NUIIIllIer: ACEElBI9~r~.r:8.7 iIIdIes
F1I 11' ~Fan Curves centrifugal Reciproc...
Compress... Compress...Curves Curves
tEPumpCuNeS
a~ElectricUtility
CustomFluid
Properties
~61Pipe
'''' _riiB::lIIIRr:~ P/cIIImlPCliul:~EEE
PIIIIDP 1I11l111d:ter: P 101 ASt.~NIIlfMll!!r:AS01
rtiJ' " II rILFan Centrifugal Redproc... RotaryCompress... Compress. . Screw
m t old Compress...(g§iP ldl
Economic performan... ~.~. ••••••••••••••••••••••••&81Evaluation Charts
r;aVECM
JTPump
736. ..1'-------- ---..---. ------.-..--..------..---.-.--..----.---.------~--- ..-_____r
GX)
8)
70 #.
a'00 Ii
'0
-5)ffic.§
- 400.
#1.0 -I------·---d'--.---~--,----_·-·--'--.·---;__
,...---""~-.--~==:;;=~~--·------·-·--·--·---···.-----~··_·-·-·-·_··-----:-1·: IW:20.o.
161.3 314.6 .f11.Q 029.2 ms.6 Q43.8 1101.1 16.4 1416.7 151a
Row RMe, geIknin
688.8
00i'l.4 --l-.--..---~-----.-- ..------_..-.--.------..---...----.--------1-
515~ -l----·-----·-~
lj;~"'l! 308. -1-------1-
i::E:
Figure 3~ Pump Curves and System Curves (ECM 2) Using C--MAX software
Increase eflux line size (ECM 3)
base case pipe friction losses from pump P 101 to the top of the column is 69.9feet.. The discharge pipe consists of two 4" diameter schedule 40 pipe segments with a 120feet straight length & number of fittings. The friction losses are calculated using "noncompressible flow noulli's equation (Reference: Crane TP 410 manual & C...MAXsoftware). At normal benzene flow of 605 gpm, the 4" <I> pipe has a fluid velocity of 15 feetper second.. Increasing this pipe to 5" et> schedule 40 pipe would decrease the velocity to 9.. 70fps and reduce the frictional losses to 1998 ft, saving additional energy. The Table 5 tabulatesthe hydraulic and energy savings parameters for ECM 2 and ECM 3.
614

Table 50 Hydraulic and Energy Savings Parameters for ECM 2 and ECM 3
Base ECM 1 &2 ECM 1,2, & 3
Case Reflux Product Reflux Product
Pump Flow .. Normal @ PT 843 605 238 605 238
Circuit Flow .. Normal @ PT gpm 843 605 238 605 238
PUMP SUCTION PRESSURE psia 30.35 30.35 30.35 30.35 30.35
DISCHARGE PRESSURE
Delivery Pressure psia 20.1728 20.1728 20.1728 15
Static Head feet 100 100 100 20
Line Friction Loss feet 69.9 69.9 19.8 43.5
Total Equipment Pressure Drop psi 45 15 15 40
Heat Exchanger 1 psi 10 10 10 10Heat Exchanger 2 psi NA NA NA 15
Orifice psi 5 5 5 NAControl Valve psi 30 1. 1 15
PUMP DISCHARGE PRESSURE psia 124.3 95.31 77.86 77.11
Total Pump DifI: Pressure psi 93.95 64.96 47.51 46.76
Total Dynamic Head feet 270.04 186.7 136.55 134.39
Pump Efficiency % 71.5 72.8 72.8 63
Break Horsepower bhp 64.62 31.49 23.03 10.3
ENERGY USE (Annual) kWh 469,195
Energy Savings Over Base Case kWh
Percent Ener Savin s %
The Table 6 summarizes the energy savings realized by conducting a systems analysisof the fluid flow systeme An incremental cost and payback analysis in the Table 7 clearlyindicate the attractiveness of these ECMs. An electricity cost of 8 centslkWh and a demandcharge of$ 5/kW/month are used in the calculations.
Table Summary Energy Savings
BaEne
e Energy Use (Single Pump) kWh/yr
Savings Contribution469,195
Incremental Savings Cumulative SavingsMeasure Ok 9/0
ECMl Two Pumps kWh/yr 63,673 13.57% 63,673 13.57%
ECM2 VFD on Reflux Pump kWh/yr 85,671 18.26% 149,344 31.83%
ECM3 Larger Discharge Pipe kWh/yr 66,297 14.13% 215,641 45.96%
Total ofECM 1, 2, & 3 kWh/yr 215,641 45096°~
615
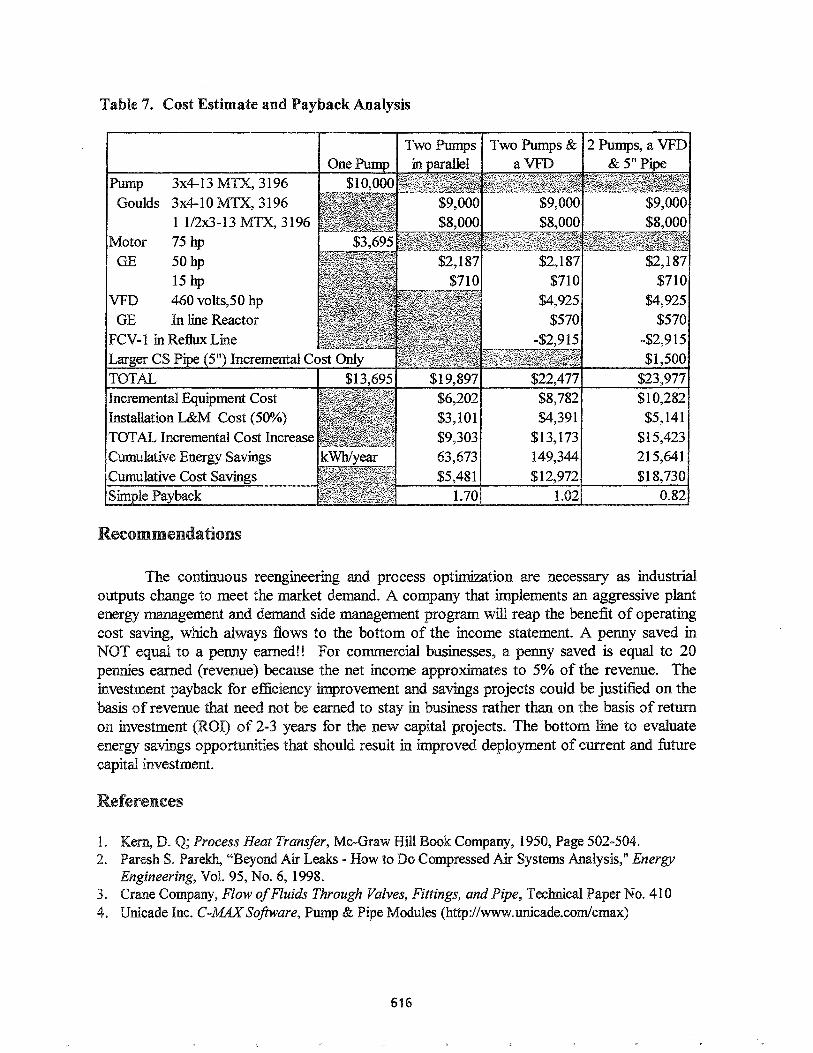
Table 7~ Cost Estimate and Payback Analysis
Pump 3x4-13 MTX, 3196Goulds 3x4-IO MTX, 3196
1 1/2x3-13 MTX, 3196
Motor 75 hp
GE 50hp15 hp
VFD 460 volts,50 hpGE In line Reactor
FeV-I in Reflux Line
Larger CS Pipe (5") Incremental Cost Only
TOTAL $13,695
Incremental Equipment Cost
Installation L&M Cost (50%)
TOTAL Incremental Cost Increase
C~u~we&~~Swm~ kWWy~
.Cumulative Cost Savings
Simple Payback
Recommendations
$19,897$6,202
$3,101
$9,303
63,673$5,481
1.70
$22,477
$8,782$4,391
$13,173149,344
$12,972
1.02
of'~
$2~187
$710$4,925
$570-$2,915
$1,500$23,977$10,282
$5,141$15,423215,641
$18,730
0.82
The continuous reengineering and process optimization are necessary as industrialoutputs change to meet the market demand. A company that implements an aggressive plantenergy management and demand side management program will reap the benefit of operatingcost saving, which always flows to the bottom of the income statement. A penny saved inNOT equal to a penny earned!! For commercial businesses, a penny saved is equal to 20pennies earned (revenue) because the net income approximates to 5% of the revenue 0 Theinvestment payback for efficiency improvement and savings projects could be justified on thebasis of revenue that need not be earned to stay in business rather than on the basis of returnon investment (ROI) of 2-3 years for the new capital projects.. The bottom line to evaluateenergy savings opportunities that should result in improved deployment of current and futurecapital investmento
References
10 Q; Process Heat Transfer, Mc-Graw Hill Book Company, 1950, Page 502-504020 Paresh rekh, "Beyond Air Leaks ... How to Do Compressed Air Systems Analysis," Energy
Engineering, Vol. 95, Noo 6, 1998030 Crane Company, Flow ofFluids Through Valves, Fittings, and Pipe, Technical Paper Noo 410
Unicade Inc. C-MAXSoftware, Pump & Pipe Modules (http://wwweunicade.com/cmax)
616