parcview data analysis & visualization tool/media/resources/... · parcview, including on...
TRANSCRIPT

www.capstonetechnology.com 4300 SE 1st Street, Vancouver, WA, 98684 888-634-7346 Ext4
Innovative solutions for peak plant performance.
Data from virtually any data system can be viewed in PARCview homogeneously, enabling users to display and correlate data from independent systems acrossyour enterprise.
Redily available data and powerful displays will improve decision making by:
Removing barriers to accessing information for all users
Empowering users with information-rich displays
Enabling quick resolution of difficult, multi-variable problems
Modern, user-friendly, feature rich analytical and troubleshooting tools.
Lab, MES, Maintenance, Custom, Batch, Environmental
Alarm Events
Historians, MPC, & Vibration
Enterprise
Rollups
Capstone Data Interfaces
PARCview
Visualization LayerMonitoring, Analysis, & Visualization
Data PortalFederated OPCHDA Data Portal, Universal Tag Browser, & Data Cleansing
Data SeriesCapstone Data Interfaces
Data Analysis & Visualization Tool
PARCview is a real-time data analysis and visualization tool developed by the end user, for the end user. Quickly transform critical data into useful information for timely decision making and root cause analysis.
www.capstonetechnology.com 4300 SE 1st Street, Vancouver, WA, 98684 888-634-7346 Ext 4
Key Features
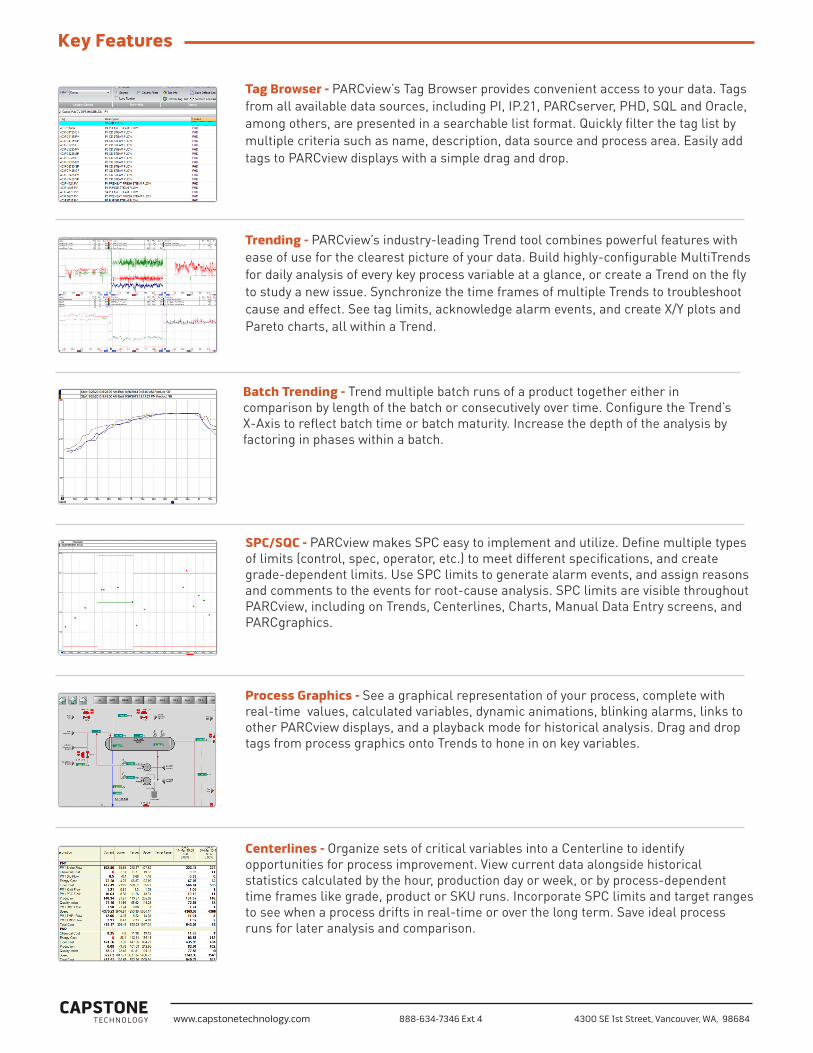
Tag Browser - PARCview’s Tag Browser provides convenient access to your data. Tags from all available data sources, including PI, IP.21, PARCserver, PHD, SQL and Oracle, among others, are presented in a searchable list format. Quickly filter the tag list by multiple criteria such as name, description, data source and process area. Easily add tags to PARCview displays with a simple drag and drop.
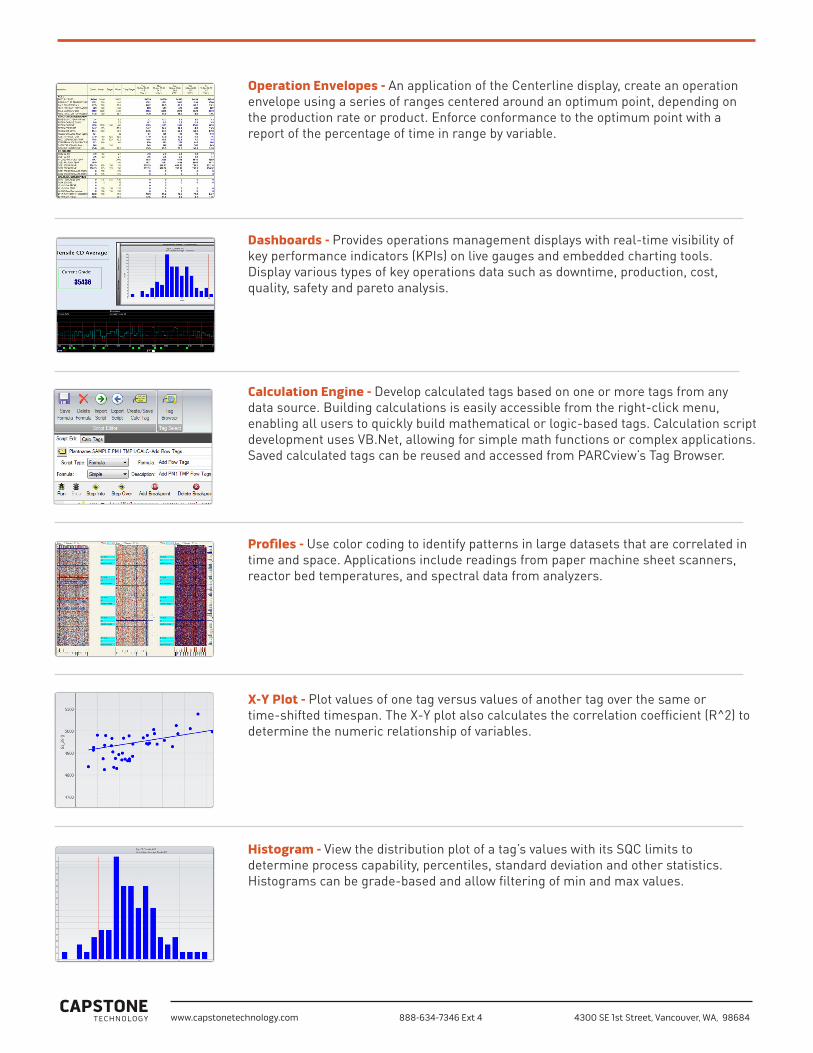
Trending - PARCview’s industry-leading Trend tool combines powerful features with ease of use for the clearest picture of your data. Build highly-configurable MultiTrends for daily analysis of every key process variable at a glance, or create a Trend on the fly to study a new issue. Synchronize the time frames of multiple Trends to troubleshoot cause and effect. See tag limits, acknowledge alarm events, and create X/Y plots and Pareto charts, all within a Trend.
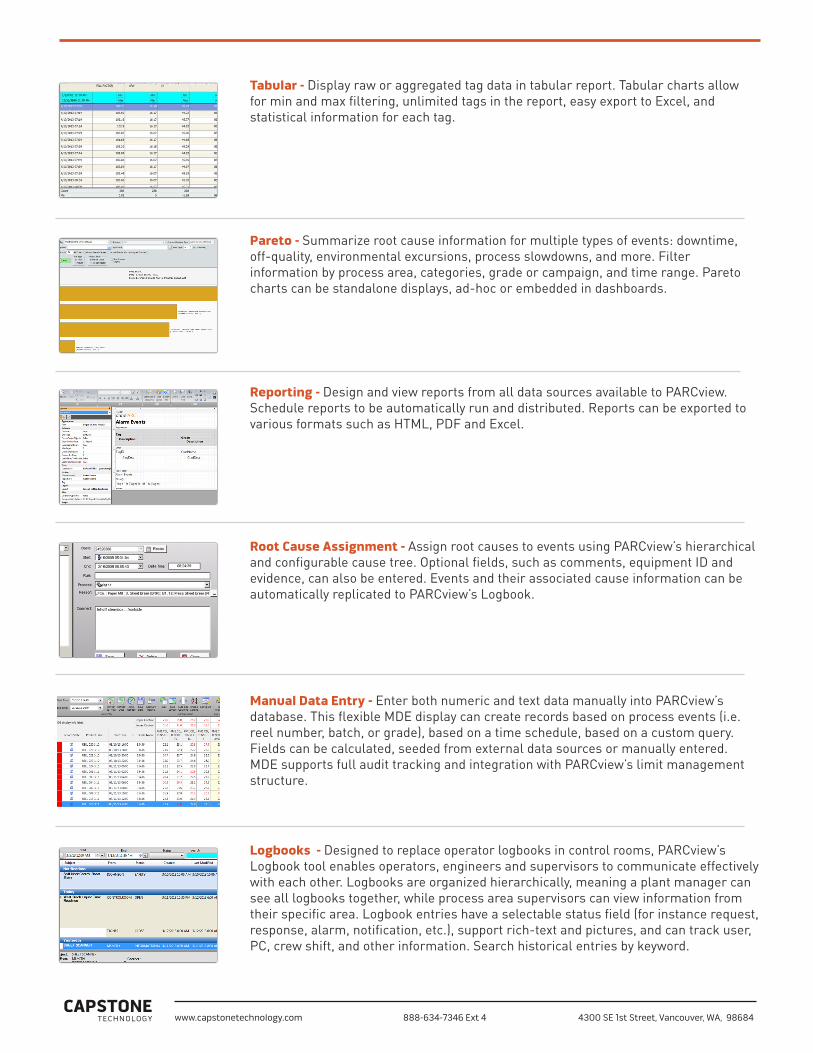
Batch Trending - Trend multiple batch runs of a product together either in comparison by length of the batch or consecutively over time. Configure the Trend’s X-Axis to reflect batch time or batch maturity. Increase the depth of the analysis by factoring in phases within a batch.
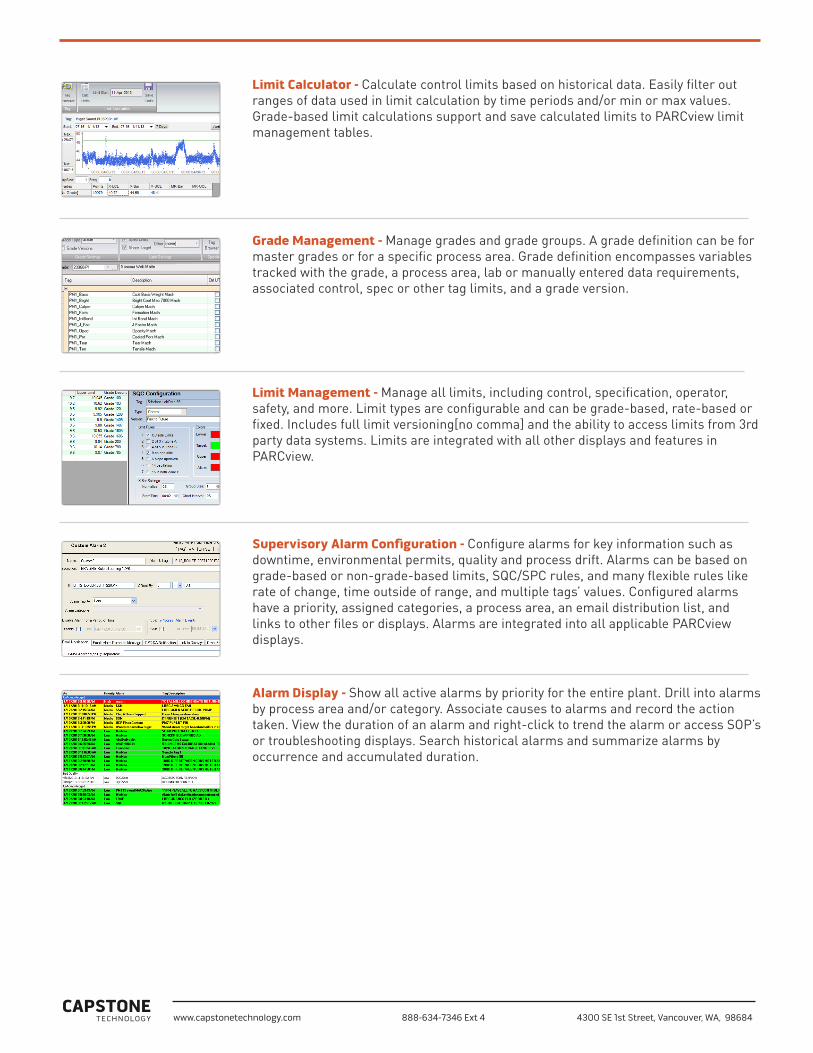
SPC/SQC - PARCview makes SPC easy to implement and utilize. Define multiple types of limits (control, spec, operator, etc.) to meet different specifications, and create grade-dependent limits. Use SPC limits to generate alarm events, and assign reasons and comments to the events for root-cause analysis. SPC limits are visible throughout PARCview, including on Trends, Centerlines, Charts, Manual Data Entry screens, and PARCgraphics.
Process Graphics - See a graphical representation of your process, complete with real-time values, calculated variables, dynamic animations, blinking alarms, links to other PARCview displays, and a playback mode for historical analysis. Drag and drop tags from process graphics onto Trends to hone in on key variables.
Centerlines - Organize sets of critical variables into a Centerline to identify opportunities for process improvement. View current data alongside historical statistics calculated by the hour, production day or week, or by process-dependent time frames like grade, product or SKU runs. Incorporate SPC limits and target ranges to see when a process drifts in real-time or over the long term. Save ideal process runs for later analysis and comparison.
www.capstonetechnology.com 4300 SE 1st Street, Vancouver, WA, 98684 888-634-7346 Ext 4
Operation Envelopes - An application of the Centerline display, create an operation envelope using a series of ranges centered around an optimum point, depending on the production rate or product. Enforce conformance to the optimum point with a report of the percentage of time in range by variable.
Dashboards - Provides operations management displays with real-time visibility of key performance indicators (KPIs) on live gauges and embedded charting tools. Display various types of key operations data such as downtime, production, cost, quality, safety and pareto analysis.
Calculation Engine - Develop calculated tags based on one or more tags from any data source. Building calculations is easily accessible from the right-click menu, enabling all users to quickly build mathematical or logic-based tags. Calculation script development uses VB.Net, allowing for simple math functions or complex applications. Saved calculated tags can be reused and accessed from PARCview’s Tag Browser.
Profiles - Use color coding to identify patterns in large datasets that are correlated in time and space. Applications include readings from paper machine sheet scanners, reactor bed temperatures, and spectral data from analyzers.
X-Y Plot - Plot values of one tag versus values of another tag over the same or time-shifted timespan. The X-Y plot also calculates the correlation coefficient (R^2) to determine the numeric relationship of variables.
Histogram - View the distribution plot of a tag’s values with its SQC limits to determine process capability, percentiles, standard deviation and other statistics. Histograms can be grade-based and allow filtering of min and max values.
Tabular - Display raw or aggregated tag data in tabular report. Tabular charts allow for min and max filtering, unlimited tags in the report, easy export to Excel, and statistical information for each tag.
www.capstonetechnology.com 4300 SE 1st Street, Vancouver, WA, 98684 888-634-7346 Ext 4
Pareto - Summarize root cause information for multiple types of events: downtime, off-quality, environmental excursions, process slowdowns, and more. Filter information by process area, categories, grade or campaign, and time range. Pareto charts can be standalone displays, ad-hoc or embedded in dashboards.
Reporting - Design and view reports from all data sources available to PARCview. Schedule reports to be automatically run and distributed. Reports can be exported to various formats such as HTML, PDF and Excel.
Root Cause Assignment - Assign root causes to events using PARCview’s hierarchical and configurable cause tree. Optional fields, such as comments, equipment ID and evidence, can also be entered. Events and their associated cause information can be automatically replicated to PARCview’s Logbook.
Manual Data Entry - Enter both numeric and text data manually into PARCview’s database. This flexible MDE display can create records based on process events (i.e. reel number, batch, or grade), based on a time schedule, based on a custom query. Fields can be calculated, seeded from external data sources or manually entered. MDE supports full audit tracking and integration with PARCview’s limit management structure.
Logbooks - Designed to replace operator logbooks in control rooms, PARCview’s Logbook tool enables operators, engineers and supervisors to communicate effectively with each other. Logbooks are organized hierarchically, meaning a plant manager can see all logbooks together, while process area supervisors can view information from their specific area. Logbook entries have a selectable status field (for instance request, response, alarm, notification, etc.), support rich-text and pictures, and can track user, PC, crew shift, and other information. Search historical entries by keyword.
Limit Management - Manage all limits, including control, specification, operator, safety, and more. Limit types are configurable and can be grade-based, rate-based or fixed. Includes full limit versioning[no comma] and the ability to access limits from 3rd party data systems. Limits are integrated with all other displays and features in PARCview.
www.capstonetechnology.com 4300 SE 1st Street, Vancouver, WA, 98684 888-634-7346 Ext 4
Supervisory Alarm Configuration - Configure alarms for key information such as downtime, environmental permits, quality and process drift. Alarms can be based on grade-based or non-grade-based limits, SQC/SPC rules, and many flexible rules like rate of change, time outside of range, and multiple tags’ values. Configured alarms have a priority, assigned categories, a process area, an email distribution list, and links to other files or displays. Alarms are integrated into all applicable PARCview displays.
Alarm Display - Show all active alarms by priority for the entire plant. Drill into alarms by process area and/or category. Associate causes to alarms and record the action taken. View the duration of an alarm and right-click to trend the alarm or access SOP’s or troubleshooting displays. Search historical alarms and summarize alarms by occurrence and accumulated duration.
Limit Calculator - Calculate control limits based on historical data. Easily filter out ranges of data used in limit calculation by time periods and/or min or max values. Grade-based limit calculations support and save calculated limits to PARCview limit management tables.
Grade Management - Manage grades and grade groups. A grade definition can be for master grades or for a specific process area. Grade definition encompasses variables tracked with the grade, a process area, lab or manually entered data requirements, associated control, spec or other tag limits, and a grade version.