paradox of food - cangress.orgcangress.org/wp-content/uploads/2018/01/the-paradox-of-food-in... ·...
TRANSCRIPT
PARADOX OF FOOD
THE
IN SKID ROW
LOS ANGELES COMMUNITY ACTION NETWORK
2017 COMMUNITY
FOOD ASSESSMENT

Is there too much food or too little food in Skid Row?
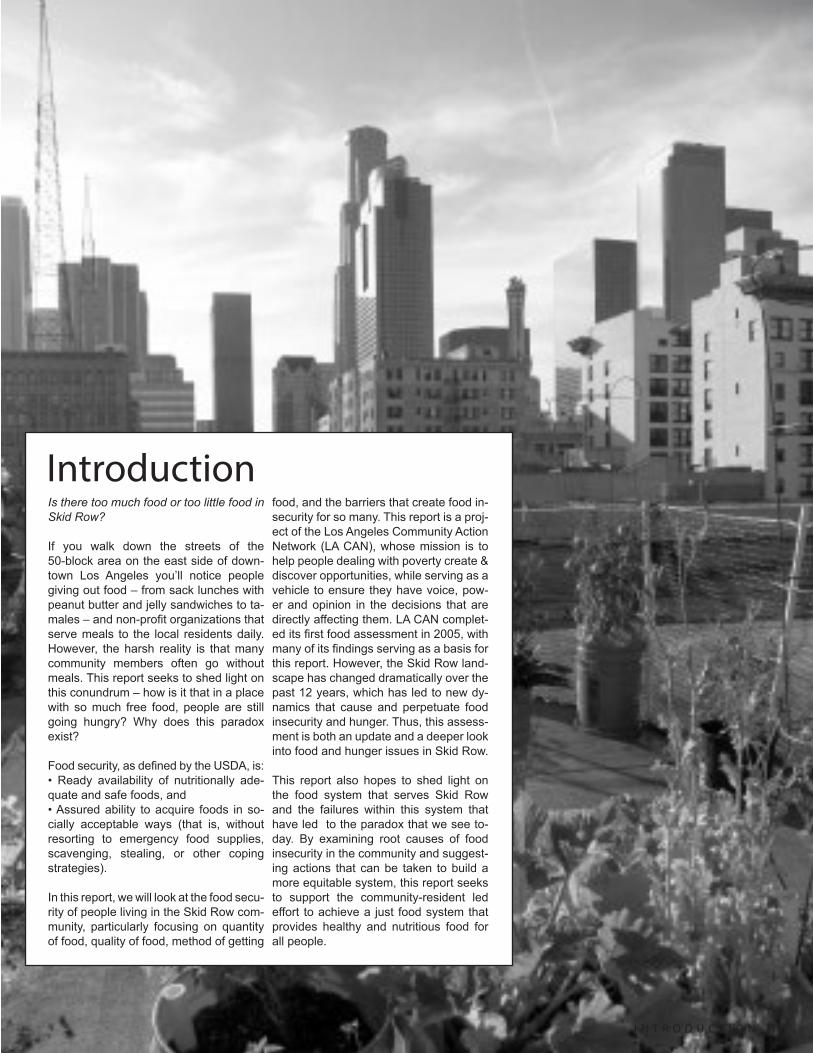
If you walk down the streets of the 50-block area on the east side of down-town Los Angeles you’ll notice people giving out food – from sack lunches with peanut butter and jelly sandwiches to ta-males – and non-profit organizations that serve meals to the local residents daily. However, the harsh reality is that many community members often go without meals. This report seeks to shed light on this conundrum – how is it that in a place with so much free food, people are still going hungry? Why does this paradox exist?
Food security, as defined by the USDA, is:• Ready availability of nutritionally ade-quate and safe foods, and • Assured ability to acquire foods in so-cially acceptable ways (that is, without resorting to emergency food supplies, scavenging, stealing, or other coping strategies).
In this report, we will look at the food secu-rity of people living in the Skid Row com-munity, particularly focusing on quantity of food, quality of food, method of getting
food, and the barriers that create food in-security for so many. This report is a proj-ect of the Los Angeles Community Action Network (LA CAN), whose mission is to help people dealing with poverty create & discover opportunities, while serving as a vehicle to ensure they have voice, pow-er and opinion in the decisions that are directly affecting them. LA CAN complet-ed its first food assessment in 2005, with many of its findings serving as a basis for this report. However, the Skid Row land-scape has changed dramatically over the past 12 years, which has led to new dy-namics that cause and perpetuate food insecurity and hunger. Thus, this assess-ment is both an update and a deeper look into food and hunger issues in Skid Row.
This report also hopes to shed light on the food system that serves Skid Row and the failures within this system that have led to the paradox that we see to-day. By examining root causes of food insecurity in the community and suggest-ing actions that can be taken to build a more equitable system, this report seeks to support the community-resident led effort to achieve a just food system that provides healthy and nutritious food for all people.
Introduction
1I N T R O D U C T I O N
Table of ContentsI N T R O D U C T I O N
M E T H O D O L O G Y
C O M M U N I T Y P R O F I L E
F O O D O U T L E T S O V E R V I E W
F O O D I N S E C U R I T Y & A C C E S S
B A R R I E R S T O F O O D A C C E S S
I N C O M E + F O O D
H O U S I N G + F O O D
H E A L T H + F O O D
D I S C R I M I N A T I O N + F O O D
S H O R T - T E R M R E C O M M E N D A T I O N S
L O N G - T E R M V I S I O N
1
3
4
6
8
10
12
14
16
18
20
21
2

To document and examine the food sys-tem of Skid Row, LA CAN conducted a Community Food Assessment (CFA). CFA is a research methodology born out of the Community Food Security Move-ment in the early 2000s, which sought to ensure that “all community residents obtain a safe, culturally acceptable, nutri-tionally adequate diet through a sustain-able food system that maximizes commu-nity self-reliance and social justice.”1
A CFA is a collaborative participatory process that systematically examines a broad range of community food issues and assets, with the goal of contributing recommendations and actions that will make the community more food secure. CFA’s are a unique needs assessment approach for several reasons:
This methodology complements LA CAN’s community organizing model. In addition to producing information that will inform advocacy and organizing, the re-search is structured as a power-building process for the community members who are at the core of the assessment team. The assessment is based on a commu-nity-based participatory research model, which centers the people who are affected by the issues examined and understands research as an opportunity to organize participants into change agents.3 Thus, even after the conclusion of the research portion of the assessment, members are more equipped to continue towards ac-tions that engender sustainable change.
Members of Team Food, LA CAN’s healthy food access and garden commit-tee, had a role in every step of the pro-cess, from brainstorming areas of focus, to data collection, to vetting the data col-lected. An example of this approach in action was a Healthy Food Fair that took place both as an outreach opportunity for Team Food and as a data collection op-
portunity for surveys. This idea was born out of a Team Food meeting. Each team food member brought their unique skillset to staffing the event, whether it was com-munity outreach, administering surveys, or holding a juicing demonstration.
There were three overarching phases to the assessment:
1. SURVEY - The survey phase of the as-sessment had two parts – a survey mea-suring community members’ experiences with food, and mapping of the food outlets in Skid Row. In total we collected 266 in-depth surveys. The survey was adminis-tered over the course of two months, with outreach throughout the community to prevent a skewed sample. Surveys were administered by Team Food members, LA CAN staff, and other volunteers. Map-ping was conducted by LA CAN staff and community members by walking through each block in the bounds of Skid Row and filling out a short form for each food out-let. The data was compiled and visualized using Google Maps.
2. STORIES - To add a narrative dimen-sion to the assessment and delve deeper into issues revealed in the survey phase, we collected food journals and interviewed 18 community members about their ex-periences with getting food in semi-struc-tured interviews that ranged from 20 min-utes to 1 hour. Participants completed a food journal that documented everything they ate for a week and where they got the food. Participants were compensated with a $25 Subway gift card and a one-month subscription to LA CAN’s pop-up organic produce market.
3. SOLUTIONS - To come up with next steps, recommendations, and actions from the findings of this assessment, focus groups were held with a combina-tion of Team Food members, LA CAN members, and Food Journal participants. One focus group specifically looked at the impact of housing status on food security, brainstorming ways to improve food acccess for community members of each housing type. The other focus group looked at the relationship between health conditions/disabilities and food access. Findings were presented at LA CAN’s general membership meeting where feedback and recommendations
Methodology
What is a Community Food Assessment?
LA CAN’s version:
AT A GLANCE
1. SurveyWe collected 266 surveys and mapped out food outlets in Skid Row to get a picture of
what’s going on with food in our community.
We collected food journals and interviewed community members,
delving deeper into people’s stories and experiences to get to
the root of what is going on.
2. Stories
3. SolutionsWith Team Food and LA CAN
members, we brainstormed how we can take action to get better food access for our community.
A CFA is a collaborative participatory process that
systematically examines a broad range of community food issues
and assets, with the goal of contributing to recommendations
and action that will make the community more food secure.
were solicited. Notes from these meet-ings in addition to the data from the first two phases were used to compile the final recommendation section.
Survey data was quantitatively analyzed using Microsoft Excel. Qualitative data was analyzed from the food journals collected, interviews, and fill-in survey responses were used to interpret quan-titative findings and suggest explanations for the results of the quantitative portion. Data analysis and report writing was completed primarily by the coordinator of this project with the input of other LA CAN
3M E T H O D O L O G Y
1. Community participation and own-ership is central to the assessment. 2. CFAs emphasize both community assets and deficits. 3. CFAs take an integrative, sys-tems-based approach, bringing to-gether a wide array of fields including community economic development, anti-hunger, social justice, local and sustainable agriculture, public health, nutrition, and environmentalism.2

Community ProfileWhere is Skid Row, who lives in the area and who is included in this study?The geographic boundaries of Skid Row has historically been between E 3rd St and E 8th St, and Hill Street and Ala-meda, but has been forcibly confined to the areas between E 3rd St and E 7th St and Main Street and Central Ave, a roughly a 50-block area of about 0.4 square mile. Predominantly zoned as a commercial area, the community is pri-marily comprised of large warehouses, but there are also single-room occupancy hotels and unhoused residents who may sleep on the streets, in vehicles or in shel-ters, including transitional or emergency housing programs.4
Historically, the city of Los Angeles has taken on a “containment policy” that sought to keep those without houses and extremely low-income people in this .4 square mile area. While some see this policy as one that concentrates social services in the area and therefore more accessible to those who need them, this containment has led to decades of ne-glect that further the ghettoization of the area.5 Instead of having a healthy, thriv-ing, self-determining community with suf-ficient public health and food infrastruc-ture, the community has strugled due to decades of failed public policies and an unsustainable reliance on charitable ser-vices. This is the origin of the broken food system that this assessment examines.
As downtown continues to gentrify, nu-merous extremely low-income housing units are being destroyed in favor of market-rate lofts that cater to a much wealthier population. These units have been converted from Hill Street to Spring Streets, and there is a movement to rid the last of these units on Main Street. However, against the forces of gentrifi-cation, there has also been movement to preserve these low-income housing units, with many private hotels being acquired and operated by non-profit housing de-velopers.
Nationwide, there has also been a move-ment to criminalize homeless people, which refers to the creation and enforce-ment of policies that unfairly target those without homes, deeming their day-to-day actions as ones that result in citation or incarceration. Acts such as sleeping on the street and even passing out food to
others, have become criminal activities. This phenomenon is seen across the nation in areas where the number of un-housed people is high. Los Angeles is certainly not immune from these policies. In fact, the city can be described as a shameful leader in this area, with 32 laws that target and disproportionately impact unhoused people -- the most of any city in California.6
The more recent phenomena of gentrifi-cation and criminalization of homeless-ness and extremely low-income people combined with historic disinvestment in this part of the community have had huge ramifications on residents’ ability to obtain food, which is a central issue this report.
DEMOGRAPHICSWhile Skid Row community members are stereotyped to be transient, a majority of the people living in the area are per-manently housed in the many residential hotels or have otherwise been longstand-ing residents of the community. Demo-graphic information fluctuates depending on when the data is collected, but these rough estimates are still illuminating.
In a report released by the LA Chamber of Commerce in 2008, the population of Skid Row was estimated to be between 8,000 to 11,000 people, with house res-idents primarily staying in approximately 6,500 in single-room-occupancy units. The are also roughtly 1,300 shelter/emer-gency housing beds - with the remaining populating living on the street, in tents, or in vehicles.7 The 2013 American Commu-nity Survey recorded 8,096, with a male to female ratio of just over more than two to one. Skid Row has a density twice the average Los Angeles density, with more than 20,000 people per square mile. The
average age is approximately 49 years old, which is an older average than the overall city average. The median rent reported in the ACS is $365 per month.8 In the Homeless Count conducted by the Los Angeles Homeless Services Au-thority in 2016, there were 1,914 people living in shelters in Skid Row, and 1,777 unhoused people not living in shelters, with a total of 3,691 people experiencing homelessness.9
WHO’S IN OUR STUDY?In our survey sample, the median age of 54 years with a gender breakdown of 63.2% men, 36.0% women, and 0.8% transgender; a race composition that is 58.2% Black, 16.9% Latino, 9.64% whites, 8.8% Mixed, and 6.4% Other. The income range was from 0 to $3,400 a month, with an average income reported of $448 per month. 11% reported wages or other income, 2.7% CalWorks, 18.8% General Relief (GR), 22.22% Supplemen-tal Security Income (SSI), 10.3% Social Security, 39% Calfresh (or food stamps), and 17.6% reported no income of any kind or declined to report any income.
61.4% of those surveyed were consid-ered unhoused, with 64.7% of this group being “on the streets” and 35.3% living at a temporary facility such as an emergen-cy shelter or transitional housing. 35.3% of those surveyed lived in permanent housing and 3.2% reported other forms of housing, such as being in a mental health, drug treatment, or senior citizen facility. 9.4% of the surveyed lived in a household with children, with the average household size being 1.53 persons. 75.1% self-re-ported a disability, with 14.2% reporting a mental disability only, 31.0% reporting a physical disability only, and 29.9% re-porting having both mental and physical disabilities.
While these statistics paint a rough pic-ture of this community, it is also important to examine the structures, such as institu-tions that serve and sell food, and forces like gentrification at play that uphold and steer the food system in Skid Row.
4
Instead of having a healthy, thriving, self-determining community with sufficient
public health and food infrastructure, the community has struggled due to decades
of failed public policies and an unsutianable reliance on
charitable services.
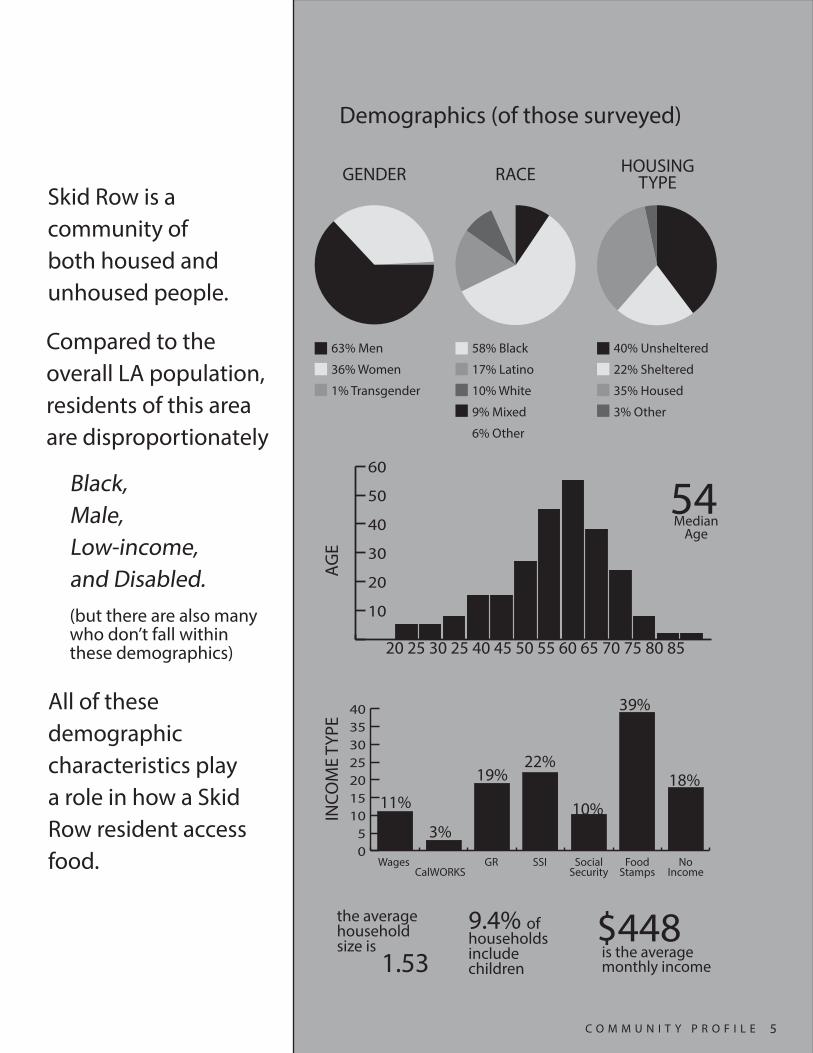
Skid Row is a community of both housed and unhoused people.
All of these demographic characteristics play a role in how a Skid Row resident access food.
Compared to the overall LA population, residents of this area are disproportionately
(but there are also many who don’t fall within these demographics)
Black,Male,Low-income,and Disabled.
5C O M M U N I T Y P R O F I L E
9.4% of households include children
the average household size is
1.53 is the average monthly income
$448
AGE
10
20
30
40
50
60
20 25 30 25 40 45 50 55 60 65 70 75 80 85
54Median
Age
INCO
ME
TYPE 35
40 39%
05
1015202530
11%
3%
19%22%
10%
18%
WagesCalWORKS
SSI Social Security
Food Stamps
NoIncome
GR
Demographics (of those surveyed)
RACE
58% Black
17% Latino
10% White
9% Mixed
6% Other
HOUSING TYPE
40% Unsheltered
22% Sheltered
35% Housed
3% Other
GENDER
63% Men
36% Women
1% Transgender
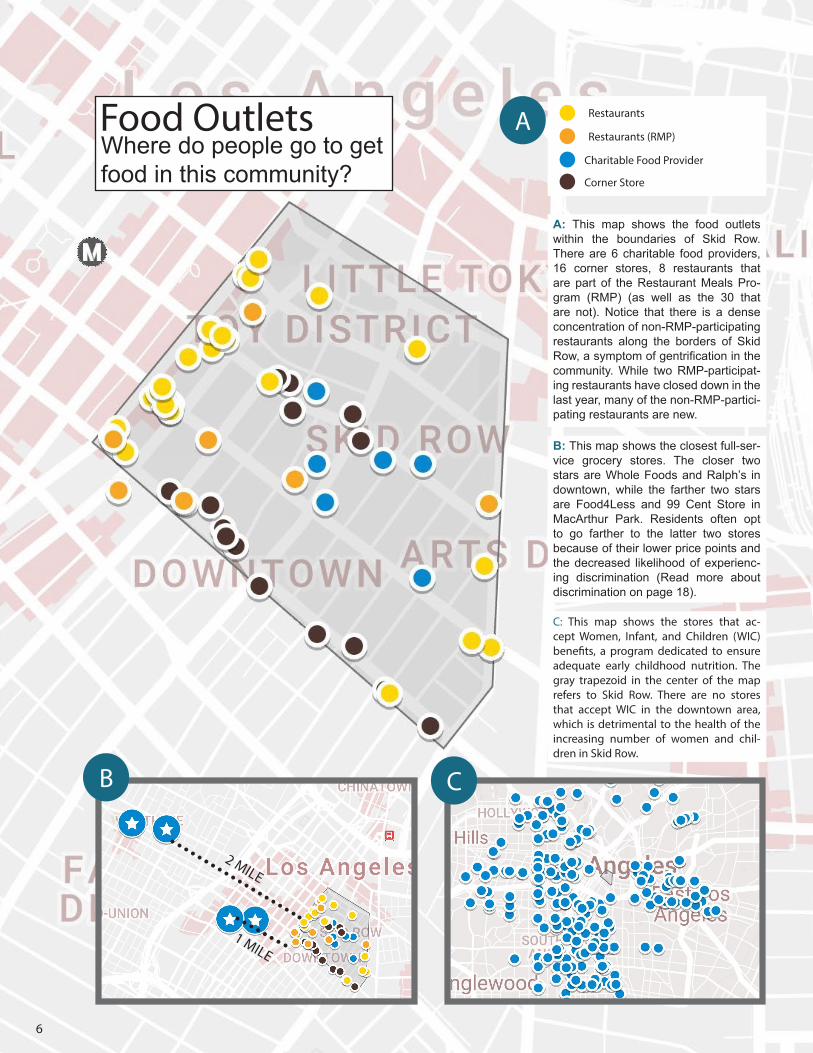
Food OutletsWhere do people go to get food in this community?
6
1 MILE
2 MILE
B
C
Charitable Food Provider
Restaurants
Corner Store
Restaurants (RMP)
A
A: This map shows the food outlets within the boundaries of Skid Row. There are 6 charitable food providers, 16 corner stores, 8 restaurants that are part of the Restaurant Meals Pro-gram (RMP) (as well as the 30 that are not). Notice that there is a dense concentration of non-RMP-participating restaurants along the borders of Skid Row, a symptom of gentrification in the community. While two RMP-participat-ing restaurants have closed down in the last year, many of the non-RMP-partici-pating restaurants are new.
B: This map shows the closest full-ser-vice grocery stores. The closer two stars are Whole Foods and Ralph’s in downtown, while the farther two stars are Food4Less and 99 Cent Store in MacArthur Park. Residents often opt to go farther to the latter two stores because of their lower price points and the decreased likelihood of experienc-ing discrimination (Read more about discrimination on page 18).
C: This map shows the stores that ac-cept Women, Infant, and Children (WIC) benefits, a program dedicated to ensure adequate early childhood nutrition. The gray trapezoid in the center of the map refers to Skid Row. There are no stores that accept WIC in the downtown area, which is detrimental to the health of the increasing number of women and chil-dren in Skid Row.

There are three main types of food outlets that residents in the community access -- food providers, grocery and produce out-lets, and purchased meals.
Within food providers, there are two types: (1) institutional charitable food providers and (2) street giveaways/pro-viders. The former include places such as the Hippie Kitchen and Midnight Mission. They are distinct because they have set feeding times and bureaucracy that sur-round feeding time. Some require church service attendance before getting food. Others require participation in one of the institution’s programs to receive meals. Few have no requirements at all. Follow-ing the traditional “soup kitchen” model, the quality of food differs greatly between institutions and even between meals. Street giveaways, on the other hand, are not institutionalized, often taking the form of people handing out food from the back of a van. Most the time, this form of feeding is sporadic, though they are of-ten concentrated on the weekends, and some are run regularly. The types of food given out also vary greatly, but a major-ity of the time, food is pre-packaged or otherwise easily given out, such as piz-za, hot dogs, sandwiches, chips, canned goods or tamales.
Within grocery and produce outlets, there are several different types -- cor-
ner stores, full-service grocery stores, farmers markets, food pantries, and vending machines. Within the bounds of Skid Row, you can find corner and liquor stores littered throughout the communi-ty. There are 16 corner stores in the 0.4 mile sq radius. These stores typically carry pre-packaged foods such as chips, canned goods, and soda and are lacking in fresh fruits and vegetables. Some of these stores also have pre-made meals such as wrapped sandwiches or micro-waveable “TV dinners.”
Most people with the choice would go to a full-service grocery located outside the bounds of Skid Row -- most notably 99 cent only store or Food 4 Less. These stores offer much wider selection at a price point is lower than that of the cor-ner store. There are also farmers markets that operate every day of the week in the downtown area, but they vary in their target audience. Farmers markets are a space in which Skid Row residents, typ-ically people with very low-income, and new Downtown residents, typically peo-ple with much higher income, mix. While some farmers markets embrace low-in-come customers openly, even offering Market Match programs that double the amount of dollars spent on fresh pro-duce for people who purchase with food stamps, others are more exclusive, hav-ing high price points and mostly prepared
foods that cannot be purchased with food stamps. There is also limited food pantry access, with only one regular food pantry operated by the Fred Jordan Mission, and an additional food bank partnership that distributes food throughout residential hotels operated by non-profit developers. Lastly, the most accessible form of gro-cery outlets is from vending machines, located at virtually every single-room-oc-cupancy hotel. These are often stocked with chips, pastries, and soda that are easy, grab-and-go foods. Overall, the most consistent food options are high in sodium and sugar, which negativley im-pacts the health of residents and contrib-utes to food insecurity.
Skid Row residents also have some ac-cess to purchasing hot meals. While many restaurants are popping up on the western edge of Skid Row past Main St, they often exclude residents due to price points and security practices. Only 8 of 38 restaurants accept food stamps for those in the Restaurant Meals Program. Resi-dents also cite a dependency on other fast food and ethnic restaurants, as their price points are often lower. Lastly, many residents obtain food from street vendors, who bring prepared foods such as tama-les, fried chicken, and cut fruit, into the community.
7F O O D O U T L E T S
NU
TRIT
ION
CHO
ICE
DIS
TAN
CEH
OU
RSPR
ICE
FOOD PROVIDERS
Free
Close
None
Limited Meal Times
Varies/Low
Varies/Low
Low High High Low Low Low Varies Low
Institutional StreetGiveaways
Corner Stores
Full-ServiceStore
Farmers Markets
FoodPantry
Vending Machines
Fast Food
Other Restaurants
Street Vendors
Free
Close
None
Irregular
Varies
Close
Limited
Flexible Flexible
Varies
Varies
Varies
Once per week
Free
Varies
None
Usually once per
weekAlways
Low
Very Close
Limited
Low
Close
Some
Flexible Flexible Irregular
Varies
Varies
Some
Low
Close
Limited
Varies
Far
Full Choice
PURCHASED MEALSGROCERY & PRODUCE OUTLETS
Are people eating?How are people eating?
Household food security means access by all members at all times to enough food for an active, healthy life. Food security minimally includes the ready availability of nutritionally adequate and safe foods, and assured ability to acquire acceptable foods in socially acceptable ways (with-out resorting to emergency food supplies, scavenging, stealing, or other coping strategies).
In our surveys, we measured food se-curity through a survey based on the Household Food Insecurity Access Scale developed by USAID10, asking these 6 questions:
In the past month, did you (or anyone in your household)
Respondents marked Never, Rarely, Sometimes, or Often. Each of these states were assigned a number value (0, 1, 2, or 3 respectively), and a Food Inse-curity Score (FIS) was totaled from sur-vey responses.
We a found a mean score of 10.4 among all 266 people surveyed, which show high food insecurity. A food secure person would have a maximum score of 2, per-haps indicating anxiety over food. In the histogram showing the frequencies of the different scores on the following page, it is evident that very few people have even a score of less than 5. In fact, only 7.9% of respondents were considered food se-cure. 74% of surveyed went a whole day and night without eating at least once in the past month, the most severe condition
of food insecurity asked about in the sur-vey. 18% of those surveyed said that this was a condition they faced often, which was defined on the survey as more than 10 times a month. With such high food insecurity scores, the only conclusion is that people are not getting enough to eat.
To capture how people were getting their foods, we asked people to indicate how often they utilized a particular method for getting food in the past week (Never, Rarely, Sometimes, Often).
The six methods the survey covered were • home-cooked meal • pre-packaged food • hot meal from restaurant • meal from charitable food provider • street giveaways • from bins and dumpsters
Similar to calculating food insecurity scores, the frequency statement the re-spondent indicated was assigned a nu-merical value which was averaged across those surveyed to see how people eat.
Contrary to the popular image of a Skid Row resident constantly waiting in lines for free foods, there is remarkable hetero-geneity in how people eat. Aggregating the survey responses, there is a depen-dency on multiple forms of getting food. While the average score of frequency of use is relatively similar among all forms of food options, there are clear differenc-es between the distribution of responses within each option. For home-cooked meals, most people marked that they never used this option in the past week (32.2%), but there are also many people who use this option sometimes (29.0%) or often (21.8%). This could point to how many in this community are unable to eat home-cooked meals because they are unhoused, but when people have the right facilities, they will cook. For eating pre-packaged foods and eating at char-itable food providers, we see a graded relationship with people most frequently marking “often” for these food options. This relationship also makes sense in context of accessibility of these options -- these two options are reliable and
physically proximate, but unfortunately, the food consumed at these outlets are seldom nutritionally adequate. We also see this graded relationship for street giveaways and restaurants, however we see a drop-off of people who marked of-ten for these option. These could point to potential barriers to relying on these types of food. Restaurants are by far the most costly option, even if residents solely relied on “cheap” fast foods. Cost may be a reason why people refrain from using this option often. Street giveaways are unpredictable, which may account for why we see a drop-off in the “Often” col-umn. This suggests street giveaways are a supplement to many people’s diets, but cannot be the essential core of it as they are sporadic. Lastly, it is important to note that though the vast majority of people never ate foods from bins and dumpsters (74.1%), 25.9% still reported using this option, with 3.5% of people saying they do this often.
While many who were interviewed cited getting free food from a charitable food provider, none stated that they preferred this option – oftentimes it is a last resort or a supplement in times of great need, such as when one has run out of food stamps. Some mentioned even preferring to pan-handle, though still considered a humili-ating act, rather than eat at a charitable food provider because they want some autonomy over the food they consume. When people have to plan their day around being able to get food, it greatly precludes them from being able to focus on other aspects of their life -- e.g. getting health care that is needed, getting em-ployment, even getting their public ben-efits. As such, in order to really solve the problem of food insecurity in Skid Row, it is not sufficient to just only continue to bring more free food. We need to create a new system that prioritizes nutrition and food choice, and only then will this com-munity be food secure.
Read on the following page how these dynamics play out on an individual lev-el through food journal profiles of three community members.
&
1. worry that you would not have enough food? 2. have to eat a limited variety of foods due to lack of resources? 3. have to eat foods that you really did not want to eat because of a lack of resources? 4. have to eat a smaller meal than you felt you needed because there was not enough food?5. skip a meal because of lack of resources? 6. go a whole day and night without eating anything because there was not enough food?
8

Ms. S, who prepares home-cooked meals from fresh produce
Ms. S is an example of someone who eats a regular 3 meals a day, most of which are foods she cooks at in her shared cooking facility in a Single Room Occu-pancy (SRO) unit. She is an example of someone who, when presented with the right resources and opportunities, is able to thrive and eat well despite being on a food stamps budget. She purchases fruits and vegetables weekly from the LA CAN pop-up market while purchasing every-thing else, such as bread, meats, dairy products, from Food 4 Less. However, she still cites a couple challenges to get-ting food. Because of health conditions, she has to be mindful about what she eats. She must carefully plan what she buys and how much, while also consider-ing budget and time constraints of going to the grocery store. She also skips meals because the shared kitchen facility in her building is occupied when she needs to use it. Lastly, she discusses how it is easy
to run out of food stamps, particularly be-cause she also takes care of a grandchild from whom she provides meals multiple days a week.
Mr. X, who depends on mainly pre-pack-aged foods and food providers
Mr. X is notably dependent on charitable food providers. He typically gets 2 meals a day from the two missions closest to his SRO. He lives in a privately operated hotel that does not provide food storage or cooking facilities and also leaves him severely rent burdened, paying around two-third of his Supplemental Security In-come to paying rent. To supplement the charitable food providers, he often buys packaged food from corner stores (e.g. chips, soda, pastries) or prepared foods from street vendors (tamales, popcorn). Notably, he cited skipping meals because he had to go outside the Skid Row area for appointments he had, typically ap-pointments related to public benefits and healthcare, and thus cannot eat at the
missions. He also exhibits binge eating practices (e.g. drinking 4 coca-colas at once), which may be a result of the irreg-ularity of meals and experiencing hunger. Mr. X owns a blender in which he blends different foods to add variety to meals and to incorporate fruits and vegetables into his diet.
Ms. C, an unhoused woman with a sporadic eating pattern
Ms. C has been an unhoused resident of Skid Row for over 10 years. She rarely gets more than two meals a day, often only getting one meal a day, but always starts her day with a cup of coffee. In the week that she kept the food journal, she never utilized a free food provider, but did eat food from street giveaways for four meals. She cites an irregular eating pattern, with a diet consisting mainly of snacks like chips and soda, sandwiches, and burgers, all of which she buys from corner stores and restaurants in this community.
9F O O D I N S E C U R I T Y & A C C E S S
calculated food insecurity scores
num
resp
onde
nts
00 01 02 03 04 05 06 07 08 09 10 11 12 13 14 15 16 17 18
10.4average
30
25
20
15
10
5
FOOD INSECURITY SCORESFig. 1Left: Figure 1 is a histogram of the food insecu-rity scores calculated for each individual survey, showing an average score of 10.4, while a food secure individual should have a score of 2 or less. Note that the sample is skewed right and one of the peaks of the histogram occurs at the highest food insecurity score of 18, showing that many suffer extreme food insecurity.
Below: The larger bar graph on the left in Figure 2 shows the average frequency of use of meth-ods of obtaining food asked about in the survey. The smaller bar graphs to the right show the cor-responding breakdown of Never (N), Rarely (R), Sometimes (S), and Often (O) responses for each method associated by the numerical markers.
FREQUENCY OF USE OF DIFFERENT WAYS TO OBTAIN FOOD
1
2
3
4
5
6
Fig. 2
Home-cooked
Meal
Pre-Packaged
Food
Purchased Meal
CharitableFood
Provider
StreetGiveaway
Bins orDumpster
2.0
1.5
1.0
0.5
aver
age
scor
e
1
2
3
4
5
6
Rarely
N R S O N R S O
Sometimes
N R S O N R S O
N R S O N R S O
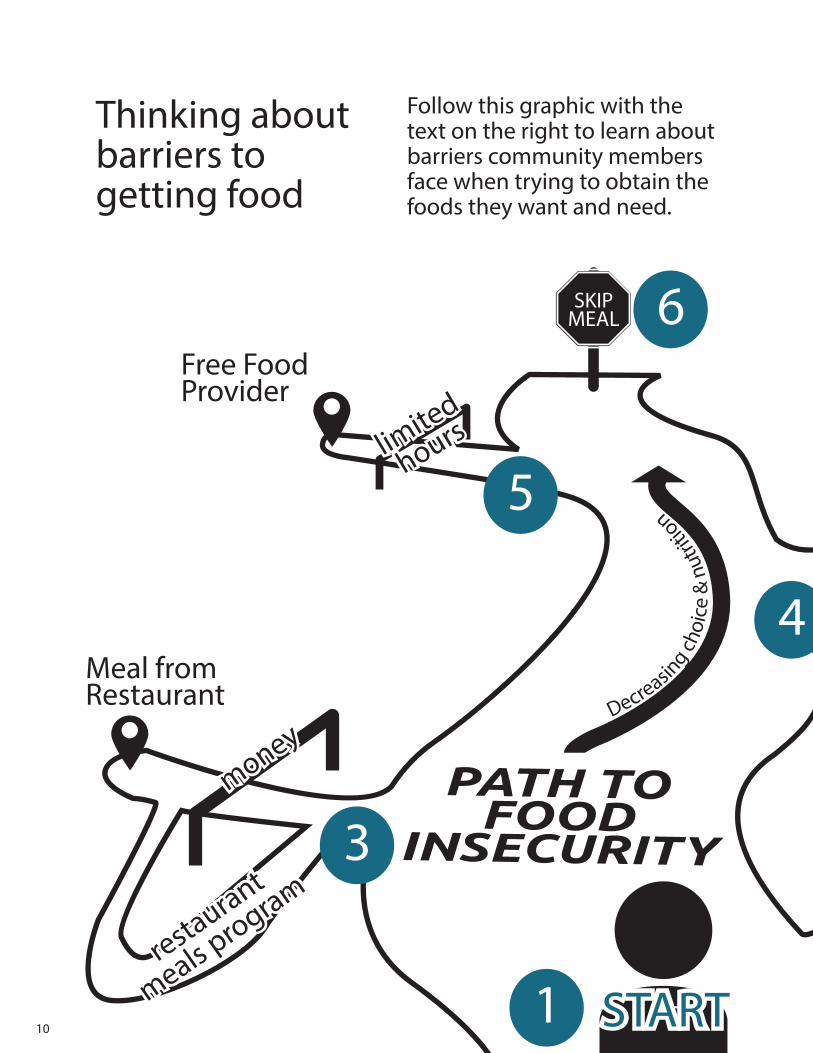
Thinking aboutbarriers togetting food
Follow this graphic with the text on the right to learn about barriers community members face when trying to obtain the foods they want and need.
10
Meal from Restaurant
Free Food Provider
START
money
restaurant
meals program
limited
hours
SKIPMEAL
Decreasing ch
oice
& n
utrit
ion
1
3
4
5
6
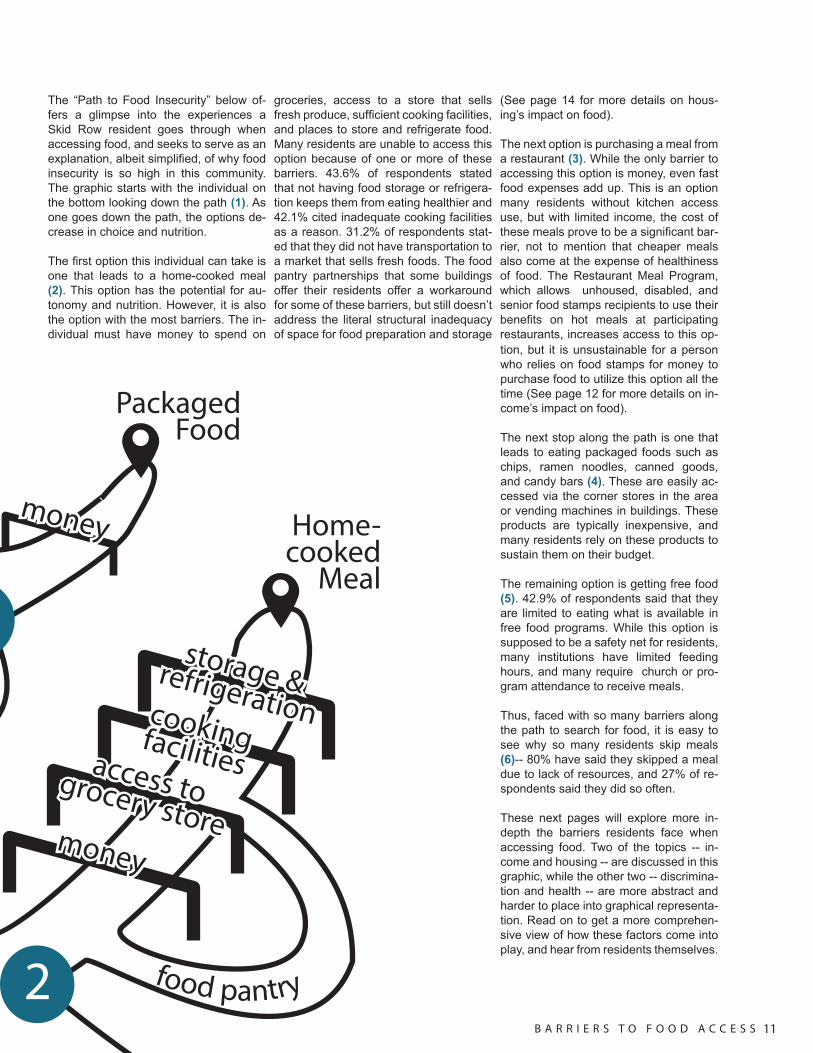
The “Path to Food Insecurity” below of-fers a glimpse into the experiences a Skid Row resident goes through when accessing food, and seeks to serve as an explanation, albeit simplified, of why food insecurity is so high in this community. The graphic starts with the individual on the bottom looking down the path (1). As one goes down the path, the options de-crease in choice and nutrition.
The first option this individual can take is one that leads to a home-cooked meal (2). This option has the potential for au-tonomy and nutrition. However, it is also the option with the most barriers. The in-dividual must have money to spend on
groceries, access to a store that sells fresh produce, sufficient cooking facilities, and places to store and refrigerate food. Many residents are unable to access this option because of one or more of these barriers. 43.6% of respondents stated that not having food storage or refrigera-tion keeps them from eating healthier and 42.1% cited inadequate cooking facilities as a reason. 31.2% of respondents stat-ed that they did not have transportation to a market that sells fresh foods. The food pantry partnerships that some buildings offer their residents offer a workaround for some of these barriers, but still doesn’t address the literal structural inadequacy of space for food preparation and storage
(See page 14 for more details on hous-ing’s impact on food).
The next option is purchasing a meal from a restaurant (3). While the only barrier to accessing this option is money, even fast food expenses add up. This is an option many residents without kitchen access use, but with limited income, the cost of these meals prove to be a significant bar-rier, not to mention that cheaper meals also come at the expense of healthiness of food. The Restaurant Meal Program, which allows unhoused, disabled, and senior food stamps recipients to use their benefits on hot meals at participating restaurants, increases access to this op-tion, but it is unsustainable for a person who relies on food stamps for money to purchase food to utilize this option all the time (See page 12 for more details on in-come’s impact on food).
The next stop along the path is one that leads to eating packaged foods such as chips, ramen noodles, canned goods, and candy bars (4). These are easily ac-cessed via the corner stores in the area or vending machines in buildings. These products are typically inexpensive, and many residents rely on these products to sustain them on their budget.
The remaining option is getting free food (5). 42.9% of respondents said that they are limited to eating what is available in free food programs. While this option is supposed to be a safety net for residents, many institutions have limited feeding hours, and many require church or pro-gram attendance to receive meals.
Thus, faced with so many barriers along the path to search for food, it is easy to see why so many residents skip meals (6)-- 80% have said they skipped a meal due to lack of resources, and 27% of re-spondents said they did so often.
These next pages will explore more in-depth the barriers residents face when accessing food. Two of the topics -- in-come and housing -- are discussed in this graphic, while the other two -- discrimina-tion and health -- are more abstract and harder to place into graphical representa-tion. Read on to get a more comprehen-sive view of how these factors come into play, and hear from residents themselves.
11B A R R I E R S T O F O O D A C C E S S
Home-cooked
Meal
money
money
storage &refrigerationcookingfacilitiesaccess togrocery store
Packaged Food
food pantry
2
4

&Income
Food
FOOD STAMPS39% of participants receive food stamps. Of those who are not receiving food stamps, 42.2% receive SSI and are thus barred from receiving food stamps in the state of California, while 6.2% cited an income too high to qualify. The other 52% say that the paperwork is too com-plicated, it is not worth the benefits, cited employment requirements as a barrier, or stated other reasons or declined to state a reason. In the fill-in survey re-sponses, common reasons given for food stamps non-participation were having been recently released from incarcera-tion, recently unemployed, and barriers/confusion from the social services office. Furthermore, 41.2% stated that they be-lieved it was true that those with drug-re-lated felonies were banned from receiv-ing food stamps in California, while 32% stated they did not know. Though the ban had been lifted in 2015, these results show that there still exists misinformation in the community that may prevent people eligible for food stamps from receiving the assistance. This data shows that there is still a large gap in food stamp enrollment that needs to be corrected.
Of those on food stamps, 77% are part of the restaurant meal program which allow food stamp recipients to use their EBT card at select partner restaurants. This provision was introduced in LA County in 2005 in recognition of seniors, disabled, and homeless people having significant
barriers to cooking, and thus needing to be able to purchase already prepared foods.11 From our survey, on average, a RMP participant uses 57% of their month-ly allotment on hot meals.
The maximum food stamps allotment per month is $194. Assuming a person needs 3 meals a day, this rate allows a per-son $2.03 to spend on each meal. This allotment rate is calculated by the US-DA’s Thrifty Food Plan, which assumes that food stamp recipients buy grocer-ies in bulk at bargain rates, and asks food stamp recipients to cook all of their meals.12 However, this is simply a reality that many residents of the area cannot access.
During interviews, those living in per-manent housing with adequate cooking facilities and food storage space who also had access to a full-service grocery store expressed that they felt the food stamps allotment was enough. However, a vast majority of community members lack access to at least one of the above conditions, and thus, many feel like food stamps often run out before the end of the month, causing individuals to eat small, unsatisfying meals or go hungry to stretch EBT dollars. Also, the insufficient allot-ment incentivizes food stamp recipients to eat less healthy foods, which are of-ten more filling at a lower cost -- such as soda, chips, candy bars, and ramen noo-dles. Also, though everyone interviewed
who used or have used the RMP program stated they enjoyed the increased flexi-bility of being able to purchase prepared foods, which does include some healthier options such as Subway. This program cannot be a permanent solution because no one can get enough prepared foods on only $194 a month.
An unhoused resident suggests a revi-sion to the allotment calculation system, saying, “Well, increase the EBT monthly, not by much, cause each month I’m only short maybe by a week and a half or so [...] There needs to be some sort of sys-tematic thing where if you are homeless and have no facility, that needs to be one of the things on the forms, that you can get more. Because if I had a place like I had before, it might be a bit more difficult but I’d be able to like [stretch my money out]. You’d be able to be compensated depending on where you’re at and not a set bar for everyone.”
Others cite reasons beyond housing sta-tus and type for why the food stamps al-lotment is insufficient, such as having to feed multiple people that are not included in the food stamps budget due to non-tra-ditional/temporary household structures. For example, one participant said, “Half the time, [the food stamps amount] is not even enough cause my husband, his son is staying with us from Friday to Sunday. He pick him up, take him to school. He’s nine years old. He’s like--he eat more than
Food Stamps Enrollment Restaurant Meal Program
39% received food stamps
6% had too high of income42% had SSI and are barred from receiving food stamps
52% cited other reasons,
of food stamp users surveyed are able to use their food stamps for hot meals.
of their monthly allotment to buy hot meals.
The RMP program is essential to the diets of many unhoused people.
on average, these RMP participants use
Of those who didn’t...
Over three-quarter of respondents reported having some income. How do we make sure people get enough food with fixed incomes?
77%
57%
12
such as the paperwork is too complicated, it is not worth the benefits, cited employment requirements as a barrier, or stated other reasons or declined to state a reason.
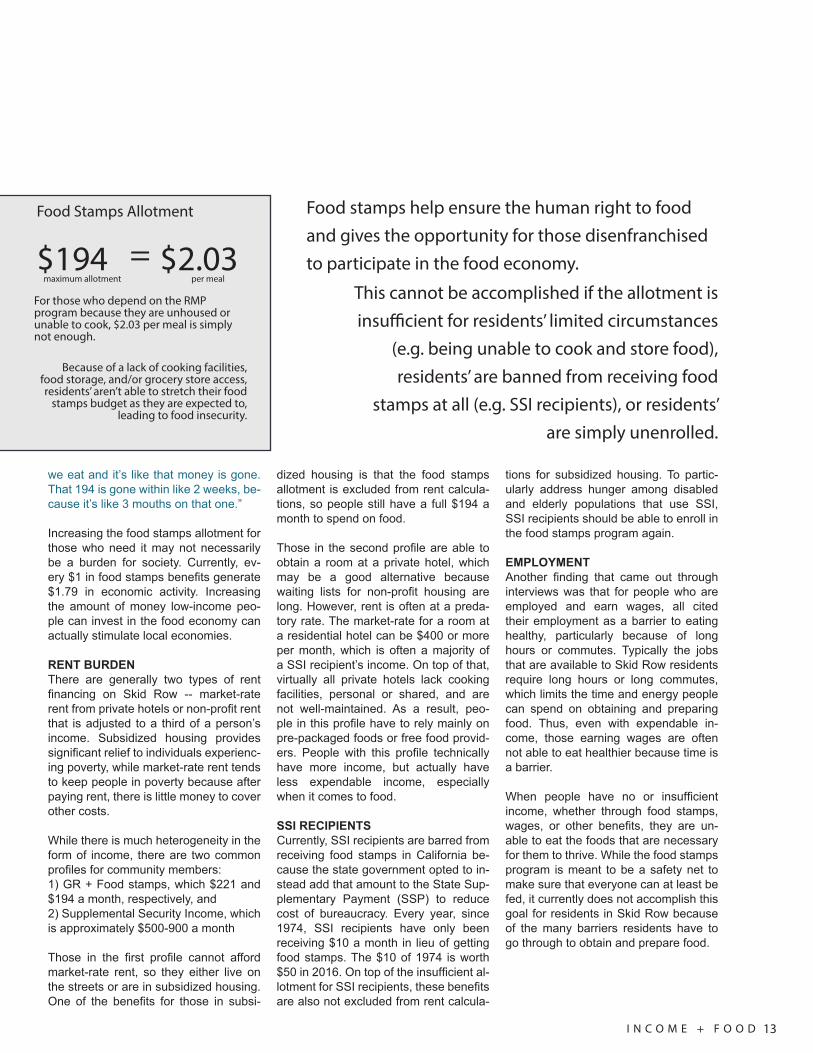
Food Stamps Allotment
For those who depend on the RMP program because they are unhoused or unable to cook, $2.03 per meal is simply not enough.
Because of a lack of cooking facilities, food storage, and/or grocery store access, residents’ aren’t able to stretch their food
stamps budget as they are expected to, leading to food insecurity.
$194 $2.03=maximum allotment per meal
we eat and it’s like that money is gone. That 194 is gone within like 2 weeks, be-cause it’s like 3 mouths on that one.”
Increasing the food stamps allotment for those who need it may not necessarily be a burden for society. Currently, ev-ery $1 in food stamps benefits generate $1.79 in economic activity. Increasing the amount of money low-income peo-ple can invest in the food economy can actually stimulate local economies.
RENT BURDENThere are generally two types of rent financing on Skid Row -- market-rate rent from private hotels or non-profit rent that is adjusted to a third of a person’s income. Subsidized housing provides significant relief to individuals experienc-ing poverty, while market-rate rent tends to keep people in poverty because after paying rent, there is little money to cover other costs.
While there is much heterogeneity in the form of income, there are two common profiles for community members: 1) GR + Food stamps, which $221 and $194 a month, respectively, and2) Supplemental Security Income, which is approximately $500-900 a month
Those in the first profile cannot afford market-rate rent, so they either live on the streets or are in subsidized housing. One of the benefits for those in subsi-
dized housing is that the food stamps allotment is excluded from rent calcula-tions, so people still have a full $194 a month to spend on food.
Those in the second profile are able to obtain a room at a private hotel, which may be a good alternative because waiting lists for non-profit housing are long. However, rent is often at a preda-tory rate. The market-rate for a room at a residential hotel can be $400 or more per month, which is often a majority of a SSI recipient’s income. On top of that, virtually all private hotels lack cooking facilities, personal or shared, and are not well-maintained. As a result, peo-ple in this profile have to rely mainly on pre-packaged foods or free food provid-ers. People with this profile technically have more income, but actually have less expendable income, especially when it comes to food.
SSI RECIPIENTSCurrently, SSI recipients are barred from receiving food stamps in California be-cause the state government opted to in-stead add that amount to the State Sup-plementary Payment (SSP) to reduce cost of bureaucracy. Every year, since 1974, SSI recipients have only been receiving $10 a month in lieu of getting food stamps. The $10 of 1974 is worth $50 in 2016. On top of the insufficient al-lotment for SSI recipients, these benefits are also not excluded from rent calcula-
tions for subsidized housing. To partic-ularly address hunger among disabled and elderly populations that use SSI, SSI recipients should be able to enroll in the food stamps program again.
EMPLOYMENTAnother finding that came out through interviews was that for people who are employed and earn wages, all cited their employment as a barrier to eating healthy, particularly because of long hours or commutes. Typically the jobs that are available to Skid Row residents require long hours or long commutes, which limits the time and energy people can spend on obtaining and preparing food. Thus, even with expendable in-come, those earning wages are often not able to eat healthier because time is a barrier.
When people have no or insufficient income, whether through food stamps, wages, or other benefits, they are un-able to eat the foods that are necessary for them to thrive. While the food stamps program is meant to be a safety net to make sure that everyone can at least be fed, it currently does not accomplish this goal for residents in Skid Row because of the many barriers residents have to go through to obtain and prepare food.
Food stamps help ensure the human right to food and gives the opportunity for those disenfranchised to participate in the food economy.
This cannot be accomplished if the allotment is insufficient for residents’ limited circumstances
(e.g. being unable to cook and store food), residents’ are banned from receiving food
stamps at all (e.g. SSI recipients), or residents’ are simply unenrolled.
13I N C O M E + F O O D

Food Insecurity Score by Housing Type
More than anything, housing secures food access. Having no housing or living in housing that doesn’t have cooking fa-cilities and food storage limits people’s ability to prepare foods. Instead, they can only have prepared foods, which se-verely limits food choice and food quality. Looking at a bivariate analysis of Food Insecurity Scores (discussed on page 8), we can see a graded relationship in housing type and FIS, with those “on the streets” having the highest score of 12.4, those living in temporary housing with a score of 9.9, and those in housing with a score of 8.1. While certainly it shows that housing will positively impact a Skid Row resident, it must also be emphasized that the food insecurity score of the housed resident is still quite high -- a score of 8.1 when a food secure person should have a score of 0 to 2. Furthermore, it is alarm-ing that the FIS score of sheltered resi-dents are still high, when most shelters provide their residents with three meals a day. Interviews with food journal partic-ipants as well as focus group data in the following sections help illuminate why this happens.
GEOGRAPHY & LOCATION OF STORESGeographically, the closest full-service grocery store is Whole Foods, which of-ten has a high price point, a barrier for those with fixed incomes. The next clos-est grocery store, a Ralph’s, is a mile
from Skid Row. However, most residents shop at the 99 cent only store or the Food 4 Less, both over 2 miles away in the MacArthur Park area. Though food jour-nal participants cite the bus system as a reliable way to get to the store, several also expressed annoyance over the com-mute:
“But yea, location—location is fine, you just gotta go on 9th street [to get to Food 4 Less], but for me, it’d be more so, be-cause I don’t have a car, to have a bas-ket and I’m injured, so that makes it a bit more difficult for me, so I can’t carry all that stuff, but with the food stamps they give you paper bags, and not plastic bags, so you know and you don’t have cash money, you can’t get plastic bags, you have to take the brown bags.”
Particularly for people with disabilities, this trek to the grocery store can prove to be a barrier to accessing food, even more so when compounded with limited food storage and refrigeration that thus necessitates frequent trips to the store. Thus, many residents are limited to the corner stores close to where they live that offer mostly single-unit products with low nutritional quality at high prices.
FOOD STORAGE & REFRIGERATIONAmong the different single-room-occu-pancy hotels, there is great variability in
the amount of food storage and refrigera-tion available. Typically, new or renovated units operated by non-profit developers, come with cupboards and full-sized refrig-erators. Others, typically privately-owned units, come with nothing. Many units are in between the two ends of the spectrum, with some degree of cupboards and a mini-fridge.
One of the food journal participants who lives in a privately-owned unit stores his food in the shelves of the dresser that came with his room, and thus is limited to purchasing pre-packaged and less per-ishable food. He discussed how he regu-larly buys milk, and tries to keep it cool by placing it in the sink overnight. However, he is limited to one-pint containers of milk because if he bought anything bigger, it would spoil. With the lack of refrigera-tion, he mainly buys food from the cor-ner stores, because they sell single-unit items, but with high prices. He expressed that he hoped to save for a mini-fridge so he can buy and store fresh foods, but it would take a good while for him to save up, as most of his fixed income from SSI is exhausted from the high rent he pays.
Another participant describes the chal-lenge of having limited refrigeration:
“I can’t put $194 [worth of food] in my re-frigerator, it’s not gonna go, cause like my
&Housing
FoodFood security is higher among housed people, but even housed residents in this area still face food insecurity. Why?
14
14% said they had cupboards
39% said they have somerefrigeration
Food Storage & Refrigeration
29% only had access to a microwave
only 36% had access to a stove or hot plate
54% said they could access some type of facility or equipment
Cooking Facilities
but of these...
18
MaxScore
10.4
AverageScore
12.4
Unsheltered
9.9
Sheltered
8.1
Housed
20
15
10
5
Aver
age
Food
Inse
curit
y Sc
ore

freezer isn’t even that big. Like my freezer is like this big [gesticulates a 2 inch by 1 feet rectangle]... Yea, so like where am I gonna put all of that, where am I gonna put all that food. I can’t – so I have to get what I can, like TV dinners, or little packs of chicken, what I know would fit, and I’m scared to get even more, cause last time I spent $150 on all meats, turnt my ‘friger-ator up so high so the stuff is frozen, but my neighbor blew the socket – we share the same socket – and they didn’t tell me, and I’m thinking my meat is freezed, but that’s $150 worth of meat spoiled. And they couldn’t replace it, so I was out of food. That hurt, so I got to the point where I don’t even want ‘em.”
COOKING FACILITIESCooking facilities also vary between the different buildings. Newer units run by non-profit developers typically have small personal cooktops in each unit, while many units have one or two shared cook-ing facilities for the entire building. Many privately owned units have no cooking facilities at all. Thus, people with no or limited cooking facilities have even less access to food. Even people who have shared cooking facilities commonly cite skipping meals due to inaccessibility to kitchen space.
A resident describes her typical routine preparing food in her hotel with shared cooking facilities:
“Now what I normally do is when I get my produce, I try to wash it right then [down-stairs], I try to chop it right then, and at that point in time, and I try to have like little hacks – I’ll chop up the potatoes if I know I’m gonna make home fries in the morning with bacon and all that, I’ll get that ready, and then put it in the Ziploc bags [to store in the refrigerator in my room upstairs], so when I wake up, boom, I’ll grab it, walk to the kitchen area before everybody gets in there. Usually I’m an earlier riser so I’ll get up, you know an hour extra, going in there to prepare, get out, and let the next person prepare. Lunch time, I might see somebody in there, so I’ll just delay my lunch. And if I don’t forget that I didn’t eat lunch, I’ll just wait until that person is gone or whatever. You know sometimes they are, sometimes they’re not, so I’ll just say forget lunch, come back for din-ner, whatever the case may be, so that’s how I do.”
She cites that it is very typical for the
shared kitchen to be occupied by another tenant, an occurrence that happens “al-most every day.”
Another resident recounts a similar expe-rience when she first moved to her unit, though she says the problem affects her less now.
“Because how I live in the SRO, some-times it strains me to have to come down and cook, and so I’ll starve myself. If I don’t – like when I first moved in here, because I knew I had to go downstairs to cook, I was afraid of living here. I was really afraid, and so, I starved myself for the first three days, and then I finally said, lemme get my ass up, Ima go somewhere and get something to eat and warm it up. And that’s what I did for the first week. And after that it’s like, I’m hungry, I gotta cook, and then I finally went and bought some groceries, and start taking it from there and cooking, but when I first came, I did first sneak in me a little hot plate so I can cook upstairs, but when I found out we couldn’t have it, I got rid of it. You know, but that’s, that hinders part is going downstairs, that’s the worst part about it.”
This resident also references policies against having individual cooking equip-ment in rooms, which are in place to pre-vent fire hazards. However, these policies are inconsistent across buildings. Some buildings allow microwaves in the room while others do not. Some allow plug-in hot plates and only have a prohibition on gas stoves. To increase food security of housed residents, it is important for build-ing managers to reassess their building policies to increase opportunities for indi-viduals to have autonomy over how they prepare foods.
SHELTER FOOD POLICIESIt seems ironic that people living at shel-ters still face insecurity (FIS 9.9), as al-most all shelters provide three meals a day. From the interviews and focus groups, we delved into why this phenom-enon exists.
In the Downtown Women’s Need Assess-ment, 44% of women reported the food in the shelter was not nutritious.13 One of our participants recounts an experience:
“When you don’t have the funding, you’ll have to submit to shelter food, which is consisting of either peanut butter and jel-ly, or you know, stale bread a lot of times,
baloney, other funny meat, processed cheese, so if I can, I don’t eat it if I can avoid it.”
Low quality shelter food is not unique to Skid Row. Several nutrition-focused stud-ies showed that soup kitchens around the country do not provide their users with adequate nutrition.14, 15
Furthermore, some of our focus group participants discuss some shelter policies that prevent people from getting the food they need. For example, shelters gener-ally do not allow residents to bring food of any type into the sleeping area and do not provide storage for food. As a result, if someone buys a meal from a restaurant, they cannot stretch it out over two meals and cannot even keep snacks. Additional-ly, shelters often have short feeding times that limit the mobility of the residents. Of-tentimes, people have to skip meals to go to a doctor’s appointment or an appoint-ment for their public benefits. Participants in this study most frequently complained about inadequate amounts of food for breakfast, and the early hours, which vary across shelter but are all before 6am.
15H O U S I N G + F O O D
Not having cooking facilities severely limits the food choice and access of residents, both housed and unhoused.
Not having adequate food storage and refrigeration means frequent trips to already distant grocery stores and not being able to save money by buying in bulk, thus disincentivizing cooking.
Housing residents certainly improves food security. However, housing needs to adequately fulfill residents’ food needs.

“Physical health conditions such as heart problems or can-cer are more likely to lead to an early death for homeless persons [rather than mental illness or substance, which only have a moderate effect].”
National Health Care for the Homeless Council
The health impact of inadequate food in-take and poor nutrition is well document-ed. Hungry and malnourished people are 2.9 times more likely to be in poor health and have a higher likelihood of chronic conditions. They are also 2.5 times more likely to be obese as a result of poor nu-trition.16 Hunger has an even more pro-found effect on children, with not just severe physical consequences, but also severe developmental and behavioral consequences. On the opposite end of the spectrum, hunger also has a profound impact on seniors. Food insecure adults are at greater risk of developing type II diabetes and more likely to experience mental and behavioral health problems, including higher levels of depression and anxiety. Among the elderly, malnutrition exacerbates diseases, increases dis-ability, decreases resistance to infection, and extends hospital stays.17 Skid Row is home to vulnerable populations at both ends of the spectrum, with a large aging population and an increasing number of children, particularly living in shelters.
As a nation, chronic diet-related diseas-es, such as diabetes, hypertension, de-pression, and heart and lung disease account for 80% of healthcare spending and affects one in two Americans. Sev-en of 10 deaths are a result of these dis-eases.18 Not having adequate nutrition increases the costs for caregivers, and
complications as a result of malnutrition inflate healthcare costs. An estimated $130.5 billion is spent on healthcare relat-ed to hunger each year, with $16.1 billion of that amount accounted for by hospital-ization, $29.2 billion accounted for by de-pression, another $19.7 billion related to suicide, and $38.9 billion being spent on poor health as a result of hunger that is easily prevented by providing people with long-term, stable access to healthy, nutri-tious food. For every $1 spent on feeding food insecure person, approximately $50 is saved in Medicaid expenses. In fact, it is less expensive to feed someone a nu-tritionally adequate diet for an entire year than to cover costs of hospitalization and emergency procedures for one day.19
In addition to seniors and children, Skid Row is also home to many people who are disproportionately affected by disabil-ity and disease, many of whom are un-housed as well. Unhoused people have a significantly high usage of the emer-gency medical system, which have very high costs for not very much benefit.20 While there is a general recognition of the cost-saving effects of getting unhoused people insured and getting regular nec-essary health care, there needs to be in-creased recognition that adequately feed-ing those who are food insecure also has similarly cost-saving effects.
In our study, 62 % of people had at least one diet-related health condition, which may be an underreported number since many of these go undiagnosed. The top four conditions cited were high blood pressure (39%), high cholesterol (19%), diabetes (15%), and anemia (12%). 16% of survey respondents marked three or more of these conditions. 75 % of respon-dents also marked that they had at least one form of disability, with 14% marking a mental disability only, 31% a physical dis-ability only, and 30% having both a phys-ical and mental disability. The most com-mon fill-in responses are bipolar, PTSD, schizophrenia, anxiety, depression, back problems, leg problems, and mobility is-sues. Particularly for impoverished people, there is a significant negative feedback loop between hunger/malnutrition and disabilities/health conditions. The topic of not getting enough food also came up repeatedly throughout the food journals and interviews. For those with disabilities, it is often hard to travel far to get fresh produce or even prepare foods. As a re-sult, many are stuck eating pre-packaged foods, food giveaways, or meals from restaurants, which are all nutritionally suboptimal options. Those with pre-ex-isting health conditions such as anemia or diabetes know that they have to watch their diet, but are unable to do so. As a
&Health
FoodHaving access to the right foods is essential to a healthy life. How does one’s food insecurity affect a resident’s health and vice versa?
16
32% one
two
16% three or
more
38%None
62%had at least one diet-related health condition
None25%
14% mental
only
31% physical
only30% both
75%had at
least one form of
disability
39%19%15%12%
High Blood PressureHigh CholestrolDiabetesAnemia
ObesityHeart DiseaseOsteoporosisStroke
12%7%6%6%
13%
Of those surveyed...
There is a high rate of people with diet-related health conditions and disabilities in this community.

It’s a downward
spiral.
Disability or Health
Condition
Hunger & Malnutrition
result, the overall health of the individual worsens, which further inhibits the indi-vidual from accessing food.
Many participants cite instances in which they have gotten sick from free food. One unhoused woman who depends on eat-ing food from street giveaways said, “Like the holidays, I kinda, believe it or not, as much as I want a holiday meal, I have a hard time eating holiday meals, you know what I’m saying, because they spoil too quick, and you know it. Dressings and all that – everything I love. I know they get spoiled and you get sick and all that. You know, I’m glad there’s more sandwiches and pizza, you know, I’m kinda scared of the Christmas din-ners, I mean I’ll eat one, but I won’t eat all throughout the day, I might get a plate, and I’ll eat it, but then it’s not the same, you know. I get real scared of food poisioning, with mayonnaise and stuff like that.”
Many with diet-related health con-ditions know that eating particular foods is bad for their health, but have to consume them anyways to avoid being hungry. A participant who is now housed, but had been unhoused previously, said “I’m allergic to turkey – I can’t eat turkey, it’ll make me sick. Like if I don’t have noth-ing to eat and there’s no way for me to get nothing to eat, and that’s all they have, I will eat it. And there was a time, like when I didn’t have no food, and it’s been a cou-ple of days, yea, I’ll eat it. I’ll be sick for a couple of days, but I’d rather be sick than have – not have nothing to eat.”
Anecdotally, while visiting one of the stores for the food outlet mapping, a stor-eowner recounts that Pepto-bismol al-
ways sells out on Mondays or Tuesdays, after the weekend, where many people from outside communities bring their own foods to give out. While this may be a hy-perbole, it points to a general conscious-ness that people eat the foods at the ex-pense of their health.
One unhoused participant summed up her experience with food giveaways say-ing, “You gotta pray over everything, you know what I’m saying, as far as in the neighborhood, somebody would pull out
candy out their car, I wouldn’t do it, you know, ‘cause you tell the kids not to take anything from strangers, but you know, you can’t be [picky here].”
Many also notice that the donated food is not fresh, and often expired:
“Cause a lot of the mission food, I no-tice the donation food that they get, their dates don’t be right. (Like expired?) right, like that’s what they do, like when the grocery stores give out the, you know in-stead of throwing food out, they give it to the mission, and I don’t think that’s right either. Because I notice in the food bank, I notice when we do food bank, we got
a couple a, most the time, we get a lotta like yogurt, and they like from September 2016, and I be like September?! Do you know which date it is?! It’s December n----, like what the – like really, they give us all these old foods, like really?! One thing I would make it where there was enough food for everybody to go around, and the food was always up to date. Like you couldn’t give it out unless it was.
Even for people who use money to pur-chase meals, there still is a lack of healthy
options. “It’s ridiculous – you know the peo-ple’s already poor, and some of them are homeless, and if they don’t have the means to cook foods a lot of times, they have to just get what you do have. But I can say that the food that they have at that Green Apple market there – the hot food is not expensive – but it’s crappy food! It’s crap! It’s really just not healthy, it’s not good, they don’t care.” In a similar fashion as the “Housing
First” model used to combat homeless-ness21, there must be a “Healthy Food First” consciousness here in Skid Row to break out of that negative feedback loop of hunger and poor health that keep peo-ple in the cycle of poverty. Eating healthy and right should not be a luxury reserved for those with housing, those with high in-comes, or only those who live in a particu-lar area. In order for us to address equity, we must prioritize getting healthy food for everybody first.
17H E A L T H + F O O D
Ensuring food security is a form of preventive medicine, which has
significant cost-saving effects. For every $1 spent on feeding a person, $50 can be
saved in Medicaid costs.
Food outlets that limit food choice are particularly
detrimental to people with disabilities and
diet-related health condition.
The most accessible food outlets, in terms of
cost and distance, are the ones that are the least nutritious. Some
free foods are even unsafe to eat.
Having the choice to get the right foods should not be a luxury, but a human right.
DiscriminationFood
Particularly as gentrification intensifies and unhoused and housed low-income people continue to be criminalized, ex-periencing discrimination while obtain-ing food is only increasing for Skid Row residents. During gentrification, places that sell food become even more con-tested. Part of the process of gentrifica-tion involves raising the perceived value of the area, which is often accomplished by opening “desirable” food places from which original residents are excluded. As “Historic Core” continues to expand from the west, Little Tokyo expands from the north, and Arts District from the east, there will only be inceasing criminaliza-tion and discrimination against long-term residents when they are accessing food outlets.
While this may sound like a theoretical discussion, this is a daily reality for Skid Row residents that shone through in this assessment. One participant discusses why she would rather go farther for food than to shop at the Ralph’s that’s the clos-est to Skid Row in downtown, citing both racial and class discrimination:
“Even though Ralph’s is like around the corner, it’s a high class Ralph’s, you un-derstand what I’m saying, it’s more like USC, preppy. I can go in there but I better look a certain kinda way. See, so some-body that go up in there that lookin’ dirty nasty -- they can go in there but they gon-na be harassed in some kinda way. That’s what I would think. Versus if they went to an Inglewood Ralph’s--even though that’s high class too--there’s certain places you’d go to.”
Another participant discusses the feeling of being unwelcomed in a community she has lived in for over 10 years:
“You know, [new downtown] just popped up, and I don’t feel comfortable with it anyway, you know. They threw up galler-ies and dog kennels first. They stake their flag and now they got what they want, you know what I’m saying. I’m not trying to break in or anything. I’d rather go some-where else, eat at the same [restaurants], rather than go there. I got here first, but you know, I know downtown.”
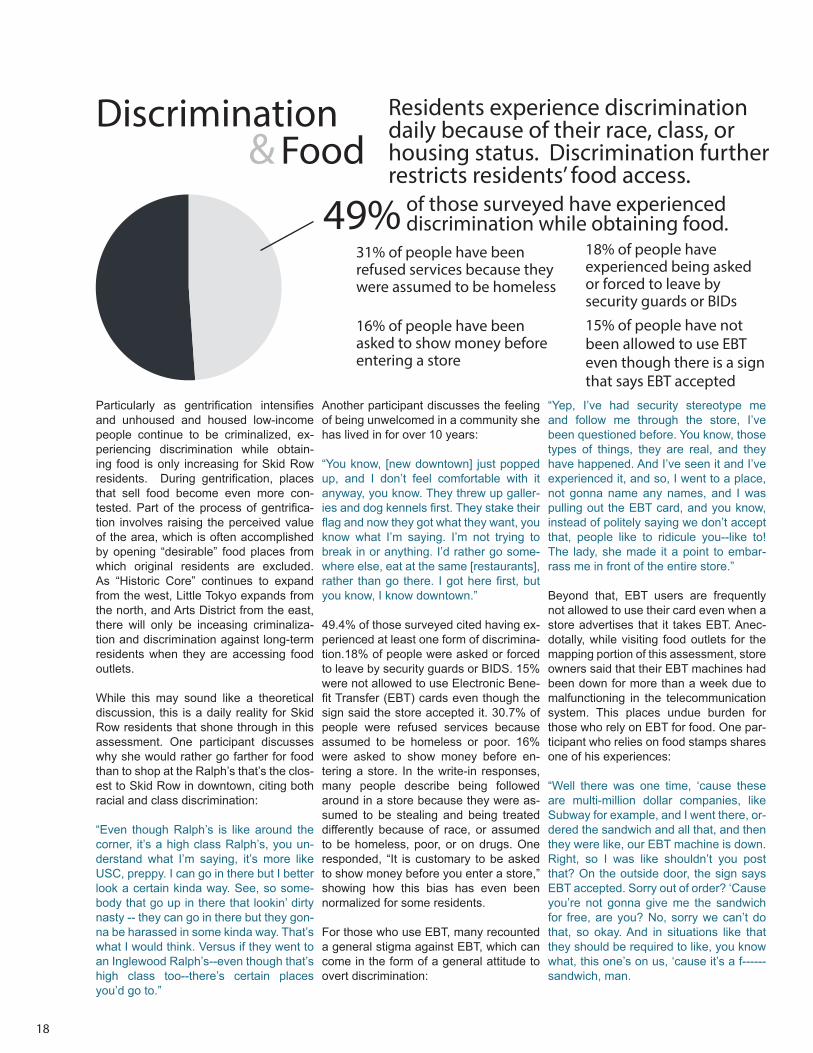
49.4% of those surveyed cited having ex-perienced at least one form of discrimina-tion.18% of people were asked or forced to leave by security guards or BIDS. 15% were not allowed to use Electronic Bene-fit Transfer (EBT) cards even though the sign said the store accepted it. 30.7% of people were refused services because assumed to be homeless or poor. 16% were asked to show money before en-tering a store. In the write-in responses, many people describe being followed around in a store because they were as-sumed to be stealing and being treated differently because of race, or assumed to be homeless, poor, or on drugs. One responded, “It is customary to be asked to show money before you enter a store,” showing how this bias has even been normalized for some residents.
For those who use EBT, many recounted a general stigma against EBT, which can come in the form of a general attitude to overt discrimination:
“Yep, I’ve had security stereotype me and follow me through the store, I’ve been questioned before. You know, those types of things, they are real, and they have happened. And I’ve seen it and I’ve experienced it, and so, I went to a place, not gonna name any names, and I was pulling out the EBT card, and you know, instead of politely saying we don’t accept that, people like to ridicule you--like to! The lady, she made it a point to embar-rass me in front of the entire store.”
Beyond that, EBT users are frequently not allowed to use their card even when a store advertises that it takes EBT. Anec-dotally, while visiting food outlets for the mapping portion of this assessment, store owners said that their EBT machines had been down for more than a week due to malfunctioning in the telecommunication system. This places undue burden for those who rely on EBT for food. One par-ticipant who relies on food stamps shares one of his experiences:
“Well there was one time, ‘cause these are multi-million dollar companies, like Subway for example, and I went there, or-dered the sandwich and all that, and then they were like, our EBT machine is down. Right, so I was like shouldn’t you post that? On the outside door, the sign says EBT accepted. Sorry out of order? ‘Cause you’re not gonna give me the sandwich for free, are you? No, sorry we can’t do that, so okay. And in situations like that they should be required to like, you know what, this one’s on us, ‘cause it’s a f------ sandwich, man.
&
18% of people have experienced being asked or forced to leave by security guards or BIDs
15% of people have not been allowed to use EBT even though there is a sign that says EBT accepted
31% of people have been refused services because they were assumed to be homeless
16% of people have been asked to show money before entering a store
18
Residents experience discrimination daily because of their race, class, or housing status. Discrimination further restricts residents’ food access.
49% of those surveyed have experienced discrimination while obtaining food.

Many participants particularly honed in on discrimination faced at the corner stores that many community members have to rely on. One participant described how police particularly monitor these stores and use them as an opportunity to harass and question residents. Another recounts an experience in which a storeowner at-tempted to scam him:
“There’s a lotta incidents, but there’s one time I went to the Green Apple, and I bought a bag of ‘tato chips and a soda, I gave ‘em 20 dollars, okay, and I just got a dollar and a quarter back, and I said ‘Ex-cuse me sir, I gave you 20 dollars,’ and he said ‘No, you didn’t.’ I said, ‘I’ma tell you one last time, im not gonna tell you again, I gave you 20 dollars,’ and the guy behind me says [to the shopkeeper] ‘You know you didn’t, I don’t know why you saying, I just saw him gave it to you,’ so ‘cause of that he gave me the proper change […] I ain’t the one you pull this on, so why I’m bringing this up is that you get labeled all the time. They think you dumb or stupid, or you on drugs, so that could have an factor on where you buy your food, cause some will walk out feeling that way and don’t wanna come back no more.”
Less overtly, corner stores also employ exploitative practices in their pricing. Many corner stores do not label prices on their food, while state law mandates that all stores selling groceries label at least 85% of their food. Without proper labeling, consumers are not able to properly com-pare prices, opening up a channel of ex-ploitation for storeowners to name what-ever prices they choose when customers bring products to the counter. In general, there is a consensus that these stores are able to charge exorbitant prices while having poor customer service because community members are dependent on these stores due to the disinvestment of the food system in this community.
One participant recounts a specific exam-ple: “We’re in the poorest section, people who are challenged. And they know, and I believe, this is just my opinion, that most people are on General Relief, so they have this EBT card, so it’s easy to charge them more […] A carton of milk almost 3 dollars. You can go to 99 Cent Store and get it for 99 cents […] Ralphs – Ralph’s is cheaper than these stores! I mean, ri-diculous. The stuff that’s cheap – it’s stuff that’s not really good, like good for you,
like you got Cheetos, you know, they used to get 4 for a dollar (laughs), those types of things.”
One participant attempts to explain these exploitative practices:
“There’s a restaurant here [in Skid Row], but everything in there is expensive, and they don’t take EBT for it, so why you charging me 2 dollars for a hot link […] so that’s not for Skid Row, it’s not for the people. […] So I think there’s certain types of things that are really helping the community versus taking things from them, and keeps taking from them, and that’s why they keep complaining about, we don’t have this, we don’t have this, we
don’t have that. Because why – because this place isn’t—it’s supposed to be built for them but people see the catch of a dollar, and this is what you get.”
While it is hard to tease out the specific impact of discrimination on food access, there is overwhelming evidence that the racial and class bias woven into everyday life for Skid Row residents has an effect on how people prepare and obtain food. Not only do community members face the consequences of institutional oppression and disinvestment, their everyday inter-actions with food providers, who often act on biases against community members, are also tinged with discrimination.
19D I S C R I M I N A T I O N + F O O D
“So I think there’s certain types of things that are really helping the community versus taking things from them, and keeps taking from them, and that’s why they keep complaining about, we don’t have this, we don’t have this, we don’t have that. Because why – because this place isn’t—it’s supposed to be built for them but people see the catch of a dollar, and this is what you get.”
historicdisinvestment
overtdiscrimination
gentrification &
criminalization of the poor/
homeless
food security

Short-term Recommendations
20
- Expand transportation options, such as shuttle vans, to help residents get to and from full service grocery stores, which are at least a mile away from Skid Row.
- Organize buildings to order produce in bulk and have produce delivered at a dis-counted rate, building on efforts tenants have already initiated.
- Expand and open a new Farmers Mar-kets with the Market Match program, which doubles the amount an EBT user can spend buying fruits and vegetables, in the Skid Row area, Specifically, in-crease the amount of fresh produce that is carried and increase frequency with which the markets are held.
- Compile and publish a report on the current status of food storage and cook-ing facilities on their current properties to identify buildings with highest needs
- Create centralized complaint process for repairs so that the speediness of repairs is not dependent on manager.- Explore options of opening up kitchens that are underutilized for those without kitchen facilities.
- Reassess and streamline building pol-icies that prohibit residents’ from having cooking equipment in their own rooms.
- Create complaint process for food bank distribution in buildings to combat unfair practices that inequitably distribute do-nated food.
INCREASE ACCESS TO FULL-SERVICE GRO-CERY STORES AND FARMERS MARKETS WITH FRESH
1. WORK WITH NON-PROFIT HOUSING DEVELOPERS TO IMPROVE HOUSED RESIDENTS’ FOOD ACCESS BY ENSURING ADEQUATE STORAGE, WORKING COOKING EQUIPMENT, AND WELL-RUN FOOD
3.
- Create space for those in shelter and transitional housing facilities to cook and store their own food.
- Find ways to incentivize meals that are higher in nutritional value.- Expand feeding hours, and set aside meals for shelter residents who are un-able to be present during meal times.
- Expand food pantry programs and add fresh fruits and vegetables to food bag.
- Create centralized information of hours of operation for all food providers in the area.
ENSURE HEALTHY FOOD IS BEING SERVED AT SHELTERS AND CHARITABLE FOOD PROVIDERS AND INCREASE FLEXIBILITY OF HOURS AT THESE
4.
- Increase outreach for food stamp enroll-ment in Skid Row.
- Increase public education that those with drug-related felonies are now eligible to receive food stamps.
- Adjust and increase food stamps allot-ment to account for those without access to kitchen access as an extension to the Restaurant Meals Program.
Proactively sign up those who will soon be released form incarceration for public benefits including food stamps.
- Reverse the ban for those who receive SSI to receive food stamp benefits or ad-equately adjust the State Supplementary Payment amount, and allow for a food budget deduction when calculating sub-sidized rent for SSI recipients.
CREATE POLICIES THAT ENSURE RESIDENT FOOD SECURITY, SUCH AS EXPANDING FOOD STAMPS ENROLLMENT AND ALLOTMENT
5.
- Mandate corner stores to have clearly marked prices, which are required on 85% of all items in a store by California State Law, and hold stores that are non-compli-ant accountable to consequences.
- Incentivize corner store conversion pro-gram by working with government initia-tives, such as the ones through the LA Food Policy Council, in a community par-ticipatory process to also address current prerception of corner stores.
- Combat discriminatory practices by increasing awareness of complaint pro-cesses and ensuring responses from the appropriate agency if discrimination is faced in corner stores, whether it be being unable to use the EBT machine to addressing stores that scam customers.
BRING HEALTHY FOODS TO CORNER STORES AND COMBAT CURRENT PREDATORY PRACTICES THROUGHACCOUNTABILITY
2.
- Open up restaurants that provide low-cost, nutritious meals who take EBT.
- Obtain free equipment from Department of Public Works and other political figures such as microwaves, hot plates, refriger-ators for those who need it.
OBTAIN AFFORDABLE PREPARED MEALS AND FREE OR LOW-COST EQUIPMENT FOR REFRIGERATION AND COOKING
6.
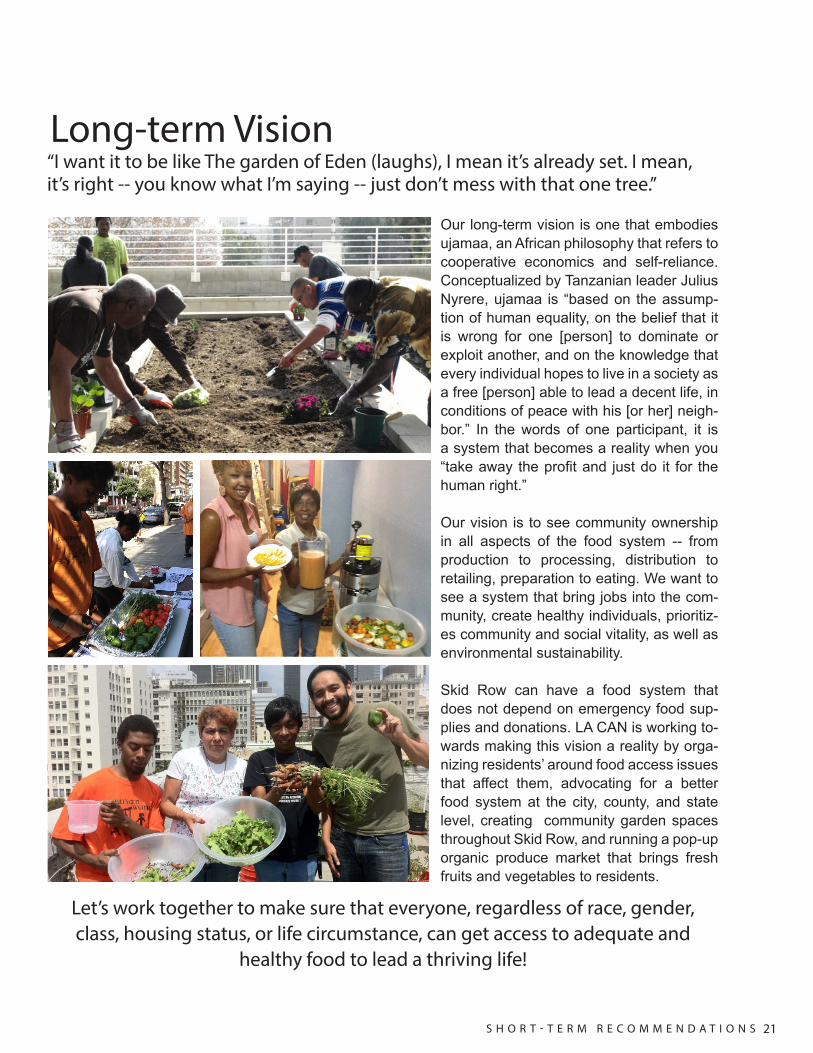
21S H O R T - T E R M R E C O M M E N D A T I O N S
Our long-term vision is one that embodies ujamaa, an African philosophy that refers to cooperative economics and self-reliance. Conceptualized by Tanzanian leader Julius Nyrere, ujamaa is “based on the assump-tion of human equality, on the belief that it is wrong for one [person] to dominate or exploit another, and on the knowledge that every individual hopes to live in a society as a free [person] able to lead a decent life, in conditions of peace with his [or her] neigh-bor.” In the words of one participant, it is a system that becomes a reality when you “take away the profit and just do it for the human right.”
Our vision is to see community ownership in all aspects of the food system -- from production to processing, distribution to retailing, preparation to eating. We want to see a system that bring jobs into the com-munity, create healthy individuals, prioritiz-es community and social vitality, as well as environmental sustainability.
Skid Row can have a food system that does not depend on emergency food sup-plies and donations. LA CAN is working to-wards making this vision a reality by orga-nizing residents’ around food access issues that affect them, advocating for a better food system at the city, county, and state level, creating community garden spaces throughout Skid Row, and running a pop-up organic produce market that brings fresh fruits and vegetables to residents.
Long-term Vision“I want it to be like The garden of Eden (laughs), I mean it’s already set. I mean, it’s right -- you know what I’m saying -- just don’t mess with that one tree.”
Let’s work together to make sure that everyone, regardless of race, gender, class, housing status, or life circumstance, can get access to adequate and
healthy food to lead a thriving life!

22
Works Cited1.
2. 3.
4.
5.
6.
7.
8. 9.
10.
11.
12.
13.
14.
15.
16.
17. 18. 19.20.
Pg 3 - Pothukuchi, K., & Siedenburg, K. (Eds.). (2002). What’s cooking in your food system?: A guide to community food assessment. Community Food Security Coalition.Pg 3 - IbidPg 3 - Viswanathan, Meera, et al. “Community‐based partici-patory research: Assessing the evidence: Summary.” (2004).Pg 4 - LA Chamber of Commerce. Los Angeles’ Skid Row. CA: LA Chamber of Commerce, 2008. Print.Pg 4 - Connell, Rich. “SKID ROW : ‘Containment Strategy’ of Aiding Residents, Easing Impact on Business District Is Slow and Frustrating.” Los Angeles Times. Los Angeles Times, 05 Aug. 1985. Web. 24 Feb. 2017. Pg 4 - Fisher, Marina, et al. “California’s New Vagrancy Laws: The Growing Enactment and Enforcement of Anti-Homeless Laws in the Golden State.” (2015).Pg 4 - A Chamber of Commerce. Los Angeles’ Skid Row. CA: LA Chamber of Commerce, 2008. Print.Pg 4 - American Community Survey 2013Pg 4 - Los Angeles Homeless Services Authorities Home-less Count 2016Pg 8 - Coates, J., A. Swindale, and P. Bilinsky. “Household Food Insecurity Access Scale (HFIAS) for Measurement of Household Food Access: Indicator Guide (v. 2). 2006.” Washington, DC: Food and Nutrition Technical Assistance Project, Academy for Educational Development.Pg 12 - County of Los Angeles Department of Social Ser-vices. Restaurant Meals Program. LA DPSS. http://dpss.la-county.gov/wps/portal/dpss/main/programs-and-services/restaurant-meals/Pg 12 - Carlson, Andrea, et al. Thrifty food plan, 2006. No. 42899. United States Department of Agriculture, Center for Nutrition Policy and Promotion, 2007.Pg 15 - Downtown’s Women’s Action Coalition (DWAC). “Downtown Women’s Needs Assessment.” (2016).Pg 15 - Richards, Rickelle, and Chery Smith. “The impact of homeless shelters on food access and choice among home-less families in Minnesota.” Journal of nutrition education and behavior 38.2 (2006): 96-105.Sisson, Lisa G., and Deborah A. Lown. “Do soup kitchen meals contribute to suboptimal nutrient intake & obesity in the homeless population?.” Journal of Hunger & Environ-mental Nutrition 6.3 (2011): 312-323.Pg 16 - Alliance to End Hunger. Hunger as a Health Is-sue. http://www.alliancetoendhunger.org/wp-content/uploads/2014/04/3-Hunger-is-a-Health-Issue.pdf. 2 May 2014.Pg 16 - IbidPg 16 - IbidPg 16 - IbidPg 16 - Kushel, Margot B., et al. “Emergency department use among the homeless and marginally housed: results from a community-based study.” American Journal of Public Health 92.5 (2002): 778-784.Pg 16 - Padgett, Deborah K., Leyla Gulcur, and Sam Tsember-is. “Housing first services for people who are homeless with co-occurring serious mental illness and substance abuse.” Research on social work practice 16.1 (2006): 74-83.
This report was made possible by the work of Team Food within Los Ange-les Community Action Network (LA CAN). Members that participated in the research process, from design-ing research questions to data col-lection, include George “Pancake” Herod, Kenneth Charles Owens, Casaundra Smith, Matt Horns, Steve Hutchinson, Kei Utsumi, Michelle Autry, and Ena Fenderson, among many other residents of Skid Row. Staff and interns who participated in this project include Eric Ares, Ariana Alcaraz, Steve Diaz, Sean Gregory, and Jer’rey January.
This project was coordinated by Ray Chen, an Emerson National Hunger Fellow placed at LA CAN through a fellowship program hosted by the Congressional Hunger Center.
ACKNOWLEDGMENTS

