paper title: thermal transport properties of grey cast .../67531/metadc674364/m2/1/high... · paper...
TRANSCRIPT

PAPER TITLE: Thermal Transport Properties of Grey Cast Irons SAE 962126
AUTHORS:
1. Rena L. Hecht
2. Ralph B. Dinwiddie
3. Wallace D. Porter
4. Hsin Wang
COMPANY:
Ford Research Laboratory Ford Motor Company
High Temperature Materials Laboratory Oak Ridge National Laboratory
High Temperature Materials Laboratory Oak Ridge National Laboratory
High Temperature Materials Laboratory Oak Ridge National Laboratory
7he submitted manuscript has been authored by a contractor of the U.S. OvemmeM under contract NO. D E - A C O ~ ~ R ~ & W . A~mingly. the US. Government retains a nonexclustw. royaity-free license io publish or reproduce the published form of this contribution. or y o w ornets to do SO. for U.S. Government purposes.
DISCLAIMER
This report was prepared as an account of work sponsored by an agency of the United States Government. Neither the United States Government nor any agency thereof, nor any of their employees, makes any warranty, express or implied, or assumes any legal liability or responsi- bility for the accuracy, completeness, or usefulness of any information, apparatus, product, or process disclosed, or represents that its use would not infringe privately owned rights. Refer- ence herein to any specific commercial product, process, or service by trade name, trademark, manufacturer, or otherwise does not necessarily constitute or imply its endorsement, recom- mendation, or favoring by the United States Government or any agency thereof. The views and opinions of authors expressed herein do not necessarily state or reflect those of the United States Government or any agency thereof.

DXSCLAIMER
Portions of this document may be illegible in electronic image products. Images are produced from the best available original document.
. .

ABSTRACT
Thermal diffusivity and thermal conductivity of grey cast iron have been measured as a function of graphite flake morphology, chemical composition and position in a finished brake rotor. Cast iron samples used for this investigation were cut from "step block" castings designed to produce iron with different graphite flake morphologies resulting from different cooling rates. Samples were also machined from prototype alloys and from production brake rotors representing a variation in foundry practice. Thermal diffisivity was measured at room and elevated temperatures via the flash technique. Heat capacity of selected samples was measured with differentia1 scanning calorimetry, and these results were used to calculate the thermal conductivity. Microstructure of the various cast iron samples was quantified by standard metallography and image analysis techniques, and the chemical compositions were determined by optical emission spectroscopy.
INTRODUCTION
One reson grey cast iron has been the primary material for brake rotors and drums is due to its excellent thermal transport ability. A rotor must be able to dissipate the fiictional heat generated by application of the brake pads. It is generally assumed that the heat transfer ability of a brake rotor can be improved by design of cooling channels and geometry or by improving the material's thermal diffusivity. Thermal diasivity is an important physical property for brakes because it describes the rate of heat propagation during transient state processes; diffbsivity can also be used to
Research partially sponsored by the Assistant Secretary for Energy Efiiciency and Renewable Energy, Office of Transportation TechnoIogies, as part of the High Temperature Materials Laboratory User Program, Oak Ridge National Laboratory, managed by Lockheed Martin Energy Research Corp. for the US Department of Energy under contract number DE-AC05-960R22464.
calculate thermal conductivity. Grey cast iron rotors with improved thermal conductivity have shown increased resistance to heat cracks[l]. If the thermal transport ability of grey cast iron can be increased without sacrificing other design criteria, it appears that brake performance will be enhanced. To increase a material's thermal transport ability it is necessary to know how changes in structure, phases and chemical compositions affect thermal difisivity.
In cast irons, graphite inclusions have a significantly higher thermal conductivity than the matrix. Distribution of the graphite phase has the primary influence on thermal transport. Nodular iron, where graphite is in a spherical form, exhibits significantly lower conductivity than grey iron with its flake graphite; as graphite flakes get longer, difisivity and conductivity increase[2-4]. The phase of the cast iron matrix influences diffisivity a small degree, and ferrite has a greater value than pearlite[3,4].
Most rotors on production passenger cars today are grey cast iron with Type A or B graphite flakes** embedded in a pearlite matrix, but there are distinct variations in chemical composition, flake size and processing between foundries which leads to microstructural differences between rotors. It is also known that because the solidification rate can vary across a cast part, the microstructure is not completely homogeneous and different flake types and sizes may be present in the same rotor.
Di f i iv i ty was measured at room and elevated temperatures for various cast irons to determine whether differences in morphology and composition alter heat transfer. To assess differences due to variations in chemical composition, material was cut from 5 production and 2 p r o t o w ventilated front rotors, labeled here US # 1, US #2, US #3, German, Japanese, Prototype US and Prototype Europe. In order to isolate the effects of graphite flake shape,
0.
The AFS-ASTM A247 designation describes the appearance of graphite flakes in grey iron: Type A is a uniform distribution, random orientation, Type B is a rosette grouping, random orientation, Type C is a superimposed flake size, random orientation, Type D graphite is interdendritic segregation, random orientation, and Type E is an interdendritic segregation, preferred orientation.

test specimens were'made from a single "step block" casting designed to have different cooling rates and hence graphite flake mo*hologies in each step. Numerous diffusivity measurements were also done at positions around two
.production rotors to see if significant variation occurred within the same casting. This collection of heat transport data will provide more exact materials properties for finite element heat transfer modeling of brake rotors.
EXPERIMENTAL
Room temperature thermal diffisivity was measured by the flash techniquef51 using a xenon flash system. This method consists of subjecting one face of a sample of known thickness to an intense, brief heat pulse and measuring the time for it to propagate to the opposite face of the sample. The diffusivity, a, is calculated From the time that it took the rear surface to achieve 1 I2 of its maximum temperature rise,
where C is a dimensionless parameter, D is the specimen thickness, and t,, is the half rise time of the rear surface temperature. The xenon flash software determines the value of C using Koski's parameter estimation technique(6) applied to Clark and Taylor analysis[7]. Clark and Taylor's analysis includes the effect of radiation heat losses.
measured and weighed to determine its density and thickness, and coated with carbon to maximize the energy absorption. (Specimens are disk-shaped, nominally 12.7 mm in diameter and 3.18 mm thick.) Five diffmivity measurements of each specimen were made; the standard deviation from the average value was typically 2-3%. Between 3 and 5 specimens were tested for each alloy.
The elevated temperature thermal diasivity was measured on a system equipped with a moveable Nd:glass laser, a cryogenically cooled InSb IR detector, and four fumaces[8]. For these tests, a low temperature aluminum block furnace was used to achieve the test temperatures, 200" - 500' C. Oxidation of the cast iron samples was minimized by flowing ultra high purity argon through the furnace. Each specimen was measured three times at each temperature. The Koski parameter estimation technique applied to Cowan's analysis[9] was used to determine the value of C in Eqn. (1) and to generate the diffusivity results.
Before testing for diffisivity, each specimen was
Thermal conductivity, K, can be calculated from
where p is the density and C, is the specific heat capacity. In order to calculate the thermal conductivity at room and elevated temperatures, specific heat capacity was measured via differential scanning calorimetry (DSC). A ratio technique was used that employed a sapphire standard reference material; all DSC runs were conducted at a heating rate of 20 "C/minute. Eqn. 2 was used to calculate the thermal conductivity for all the difbivity specimens. The coefficient of linear thermal expansion was used to estimate density as a function of temperature.
In order to quantify the graphite flake morphology, diffusivity specimens were mounted and prepared by standard metallography. Image analysis done with an optical microscope and Image Pro Plus software quantified the structure, size and shape of the graphite flakes as well as phase percents of the matrix. Chemical composition of each cast iron alloy was determined by optical emission spectroscopy and combustometric analysis.
RESULTS and DISCUSSION
Room temperature thennal diffusivities and calculated thermal conductivities for the rotors are listed in Table 1. The chemical composition in weight % of the cast iron alloys appears in Table 2. Figure 1 shows the positive linear dependence of thermal difisivity with increasing carbon equivalent (CE), where CE = % C + I13( % Si + % P), up to approximately 4.4CE. This increase is expected since graphite has a difisivity value higher than iron and increasing the % C or CE is the most direct way to improve the graphitization in grey iron. Amongst the commercial rotors, there is a 25% increase in diffusivity with a 0.4% increase in CE. The linear trend seen in pan of Fig. 1 extends beyond the CE of the rotors studied here to include 3 - 4.5% CE, as reported in Ref. [ 11.
Table 1. Room Temperature Thermal Transport Values
Rotors - Japanese
German
u s 1
u s 2
u s 3
Prototype Europe Prototype US
Step Block Castinas
Step 1 (3.175 mm)
Step 2 (6.35 mm)
Step 3 (12.70 mm)
Step 4 (25.4 mm)
Step 5 (50.8 mm)
Oiffusivity (Xenon Flash System)
cm'lsec
Average Standard
value deviation
0.1890 0.0046 0.1992 0.0094 0.1563 O.OOO9
0.1720 0.0021
0.1720 0.0022 0.1848 0.0065 0.1873 O.OO40
0.1358 0.0046
0.1669 0.0048 0.1920 0.0067
0.1873 0.0049
0.1825 0.0104
Conductivity (Calculated)
W l m K Average Standard
value deviation
62.39 1.78
65.65 3.00
52.1 2 0.25
57.15 0.66
57.09 0.65
60.77 2.17 61.93 1.14
44.09 1.34
55.16 1.59
63.74 2.32
62.06 1.66
60.28 3.18
In order to assess the effect of the graphite shape on conductivity, "step block" castings were produced out of grey iron to Ford rotor specification. A step block casting is shaped like a staircase, with step heights 3.175,6.35, 12.7, 25.4, and 50.8 mm. Because of the difference in step thickness, each step experiences a different solidification and cooling rate, producing different graphite flake morphologies in material with the same composition.
Thermal Oiffusivity of Grey Cast Iron Brake Discs
0.22 , I
0.12 1 J 4.1 4.2 4.3 4.4 4.5 4.6
Carbon Equivalent, W
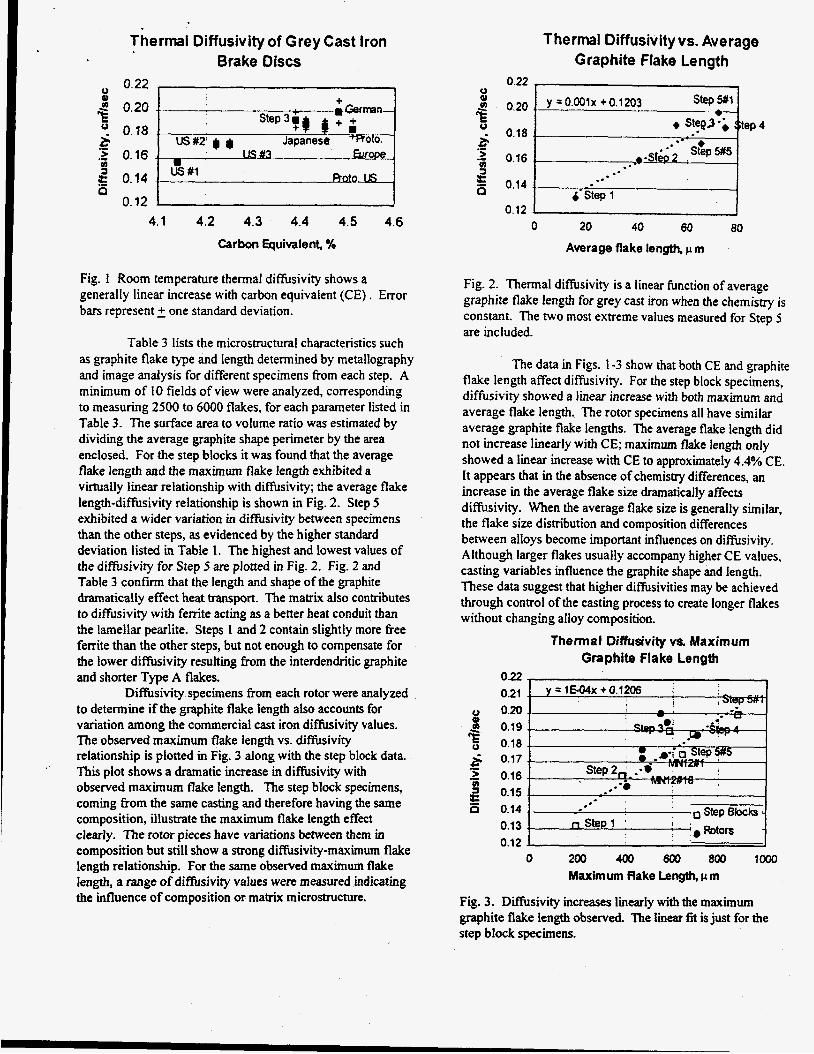
Fig. I Room temperature thermal diffisivity shows a generally linear increase with carbon equivalent (CE) . Error bars represent 2 one standard deviation.
Table 3 lists the microstructural characteristics such as graphite flake type and length determined by metallography and image analysis for different specimens fiom each step. A minimum of 10 fields of view were analyzed, corresponding to measuring 2500 to 6000 flakes, for each parameter listed in Table 3. The surface area to volume ratio was estimated by dividing the average graphite shape perimeter by the area enclosed. For the step blocks it was found that the average flake length and the maximum flake length exhibited a virtually linear relationship with diffisivity; the average flake length-diffusivity relationship is shown in Fig. 2. Step 5 exhibited a wider variation in diffisivity between specimens than the other steps, as evidenced by the higher standard deviation listed in Table 1. The highest and lowest values of the diffusivity for Step 5 are plotted in Fig. 2. Fig. 2 and Table 3 confirm that the length and shape of the graphite dramatically effect heat transport. The matrix also contributes to diffusivity with femte acting as a better heat conduit than the lamellar pearlite. Steps 1 and 2 contain slightly more free ferrite than the other steps, but not enough to compensate for the lower difhivity resulting from the interdendritic graphite and shorter Type A flakes.
Diffksivity specimens fiom each rotor were analyzed to determine if the graphite flake length aIso accounts for variation among the commercial cast iron diffisivity values. The observed maximum flake length vs. difisivity relationship is plotted in Fig. 3 along with the step block data. This plot shows a dramatic increase in diffisivity with observed maximum flake length. The step block specimens, coming fkom the same casting and therefore having the same composition, illustrate the maximum flake length effect clearly. The rotor pieces have variations between them in composition but still show a strong diffbsivity-maximum flake length relationship. For the same observed maximum flake length, a range of difisivity values were measured indicating the influence of composition or matrix microstructure.
'
Thermal Oiffusivity vs. Average Graphite Flake Length
0 22 0 0
4 O.*O
- 5 0.18
3 0.16
0.14
0
ua 1
0
0 20 40 60 80
Average flake length, p m
Fig. 2. Thermal diffisivity is a linear function of average graphite flake length for grey cast iron when the chemistry is constant. The two most extreme values measured for Step 5 are included.
The data in Figs. 1-3 show that both CE and graphite flake length affect diffisivity. For the step block specimens, difisivity showed a linear increase with both maximum and average flake length. The rotor specimens all have similar average graphite flake lengths. The average flake length did not increase linearly with CE; maximum flake length only showed a linear increase with CE to approximately 4.4% CE. It appears that in the absence of chemishy differences, an increase in the average flake size dramatically affects diffusivity. When the average flake size is generally similar, the flake size distribution and composition differences between alloys become important influences on diffusivity. Although larger flakes usually accompany higher CE values, casting variables influence the graphite shape and length. These data suggest that higher difisivities may be achieved through control of the casting process to create longer flakes without changing alloy composition.
Thermal Diffusivity vs. Maximum Graphite Flake Length
0.22 0.21
0 0.20 0.19 f 0.18
6 0.17
2 0.16
3 0.15 E 0.14
0.13
0.12
Q,
.- UJ
200 400 600 800 lo00
Maximum flake Length, CI m 0
Fig. 3. Diffisivity increases linearly with the maximum graphite flake length observed. The l inear fit is just for the step block specimens.

Table.2. Chemical Composition (Weight %)
0.80 0.43 0.22 0.19 0.19
0.19
Carbon Manganese Phosphorus Sulfur Silicon Copper Nickel Chromium Vanadium Molybdenum Titanium Iron
4.9% D,A 3-4 3.8% A 2 1 .O% A 2 2.7% A 1 0.4% A 1
0.4% A 2
Carbon Equivalent
3.2 6.4 12.7 25.4 50.8
Japanese German US#l US#2 US#3
15.8 195.4 40.7 382.7 75.4 586.2 89.5 685.4 102.7 880.9
3.69 3.79 3.51 3.45 3.43 0.56 0.74 0.88 0.65 0.71 0.03 0.05 0.01 0.02 0.03 0.10 0.09 0.10 0.08 0.13 2.14 2.01 1.87 2.30 2.43 0.05 0.19 0.95 0.10 0.28 0.03 0.10 0.01 0.08 0.12 0.05 0.12 0.24 0.30 0.31
co.01 0.02 co.01 co.01 0.01 0.01 0.12 cO.01 0.03 0.04 0.01 0.02 0.02 0.02 0.03
Base Base Base Base Base
German 3 46.7 547 Japanese 1 70.7 710 Proto. Europe 2 47.8 575 Proto. Europe 4 37.9 469 us #l 3 51.4 403 us #2 3 46.2 469 us #3 1 53.2 564 us #3 18 43.8 495
4.41
0.39 trace A, B 2 0.34 trace A 1 0.39 trace A 3 2 0.42 trace A, B 2 0.32 trace A 2 0.38 trace A 2 0.33 trace A 2 0.45 trace A 2
4.48 4.14 4.22 4.25
Prototype Europe US
3.70 3.79 0.59 0.51 0.03 0.04 0.10 0.16 2.16 1.90 0.08 1.20 0.08 0.07 0.25 0.14 0.01 0.01 0.54 0.22 0.02 0.01
Base Base
4.51 4.44
Table 3. Microstructural Characteristics of Grey Cast Iron Diffusivity Specimens
Step Blocks
3.64 0.68 0.05 0.01 2.20 0.10 0.01 0.31
<0.01
qo.01 0.01
Base
Average Maximum Step ## Thickness Flake Length Flake Length
(mm) (Pm) (Pm)
I I I
5' I 50.8 1 86.2 I 643.4
4.39
Step 5 exhibited variation; this data is from specimen #5 which had diffusivity 12% lower than specimen #l (listed in previous line).

Elevated temperature diffusivity was measured by a laser flash system at 200" to 500" C for Steps 1-4 and several of the cait iron rotors. The specific heat capacity of these materials was also measured from 100" to 1000" C. The variation in specific heat over the range 100 "C to 500 "C for the different cast iron samples was virtually the same even though their compositions varied from 3.43 to 3.79% C (or 4.1 1% CE to 4.51% CE). The results compare well with specific heat estimated from published values for Fe, C, Si, and Mn. as seen in Fig. 4. Specific heats and densities were used to calculate thermal conductivity as a function of temperature. Diffusivity and conductivity decrease with temperature as shown in Fig. 5 for the rotor samples. In other words, the materials' ability to remove heat decreases as its temperature increases. Fig. 5 shows that the variation in heat transport ability between different cast irons is less significant at elevated temperatures. Fig. 6 shows thermal conductivity as a hnction of temperature for the step blocks. From this figure it is clear that the interdendritic Type D graphite in Step 1 exhibits reduced heat transfer compared to Type A flakes, and this deficiency is maintained at elevated temperatures.
Specific Heat v s Temperature
+ Handbook Estimate I
0 !E s" a (I)
0.70
0.65
0.60
0.55
0.50
0.45
0.40 1 I -100 100 300 500
Temperature, a C
Fig. 4. Specific heat measured on several cast iron alloys compares well with values calculated by a mass-weighted average of the specific heats of Fe, C, Mn and Si. (Elemental specific heats fiom the CRC Handbook of Chemistry and Physics.)
The results &om Figs. 5 and 6 agree reasonably well with the limited number of values reported in the literature for grey cast irons of similar composition and microstructure[ 1- 31. As shown in Fig. S(a) these results fall within the range of difisivity values reported for "coarse flake" grey iron with 3.91 - 4.20 CE at 200 "C in Ref. 3. The room temperature thermal conductivities determined here exceed values listed in handbooks, such as 46 Wfrn K and 30 Wfm K for grey iron[ 10,1 I]. In Fig. 7 the conductivities generated here are plotted with literature values for which CE was also reported. The handbook value" of 30 W/mK is for a grey iron with 3.45% CE, a composition significantly different from the rotors', yet still "grey cast iron." The cast irons described in Ref. 1 exhibited reduced conductivities compared to the
values determined here, as seen in Fig. 7, although the slope of conductivity vs. CE is similar. The chemical composition was listed for the grey irons in Ref. 1, but no information on graphite morphology or microsnucture was included. Also plotted on Fig. 7 are the conductivity values of !he step blocks; it appears that graphite flakelength accounts for the offset between the two sets of data. This drastic variation in reported data demonstrates how sensitive conductivity (and diffusivity) are to composition and microstructure in grey cast iron. It also demonstrates the importance of identifying the grey iron alloy being used before selecting thermophysical property data for modeling.
Thermal Diffusivity v s Temperature
0.20
0.18 u
0.16 2 5 0.14 i &
II)
-5 0.12 .-
I 0.08 . X i3
P - I $ 0.10 . t
100 200 300 400 500 0
Temperature, 'C
Thermal Conductivity v s Temperature
0 3 45 .I
6 4 0 .
R
r l a W C
X 8 35 1 T 0 loo 200 300 400 500
Temperature, a C
Fig. 5 . (a) Elevated temperature thermal difikivity results and (b) thermal conductivity calculations show that at higher temperatures the difference between heat transport values for the different alloys diminishes. Maximum and minimum diffusivity values at 200 OC reported in Ref. 3 are included in (a).

Thermal Conductivity vs. Temperature
. 76 65 --------.
6 0 . 8 Step 2
Step 3
6 45 ' - ~ ~ Step 4 > *= 40 .. m
W
___- s ;;:* .-
0 u + + 2 3 5 . 30 .,
0 25 20
H - v
0 100 200 300 400 500
Temperature, O C
Fig. 6. Thermal conductivity is plotted as a function of temperature for the step block castings. Step I , containing interdendritic graphite (Type D), maintains its lower conductivity as compared to Type A flake graphite even at elevated temperature.
Thermal Conductivity of Grey Cast Irons
I 3.0 3.5 4.0 4.5 5.0
Carbon Equivalent, %
Fig. 7. Room temperature thermal conductivity values &om this work compared to literature values demonstrate that carbon equivalent and graphite flake sizes impact conductivity.
In order to see if the intra-casting variations in graphite flake morphology resulted in inhomogeneity in thermal transport, room temperature thermal diffusivity was measured on specimens cut from 16 positions on one rotor, and several positions on other rotors. Previous work showed an 8% increase in diffisivity between the outer edge and center of an inboard plate; this difference was attributed to the presence of Type D graphite at the plate edge[ 121. The production rotors examined here did not show the same plate center-to-edge variation. The 16 measured diffisivities only varied 5 3.5% from their average value; some of these values are shown in Fig. 8 along with the maximum, minimum and average. As seen in Fig. 8, the variation due to position does not exceed the variability in the measurement. Systematic variation in diffisivity due to position is not apparent in these results.
Thermal Diffusivity va Position on Rotor
0190 - 0.185
0 g 0.IM .. + - I I+ II I. *- II . I . I . II - I I
+ I
+ + + rn m I . + I .- +
ul 2 0.165 ,. II -+ - I I I - I j-. I t I. I+ I I I
5 0.155 .
g 0.160 .
0.150 ~ J Outboard plate hboard plate hboard plate Hat Center Center Outer edge
Fig. 8. Thermal diffisivity did not vary systematically with position around a production rotor. Shown here are IO of the I6 measurements performed on a US #3 rotor with error bars representing 2 one standard deviation. Dashed lines indicate maximum and minimum difisivities measured; solid line is the average value for the rotor.
CONCLUSIONS
It was shown that thermal diffisivity is influenced by subtle changes in chemical composition of grey cast iron, and that a roughly linear relationship exists between room temperature diffisivity and carbon equivalent (CE) within the grey cast iron carbon level range. For a given CE, microstructures that are not 100% Type A graphite flake, particularly Type D graphite, exhibit reduced thermal diffisivity. Average flake length for Type A graphite flakes shows a strong correlation with thermal difisivity when chemistry is constant; the longer the flakes, on average, the greater the diffisivity. For 8 range in composition, maximum flake length proved to be a better indicator of diffusivity. As temperature increases up to 500" C, diffusivity and conductivity decrease in grey cast irons. At elevated temperatures, the difference in diffisivity observed between alloys decreased, and the materials had similar values at 500" C. It was also noted that within a production part the diffusivity variation was not systematic with location in the casting. It is expected that data reported here will be useful in modeling of thermal transport in brake hardware and in improving material diffusivity values. It is also conduded that thermal benefits may be achieved by producing grey cast iron rotors with Type A graphite flakes as long as possible for the alloy composition.
REFERENCES
1. Jibo, Y., Mibe, T., Akiyama, K., Matsui, H., Yoshida, M., Ozawa, A., "Development of High Thermal Conductivity Cast Iron for Brake Disk Rotors," SAE 9oooO2, pp. 22-28, SA€ International, 1990.
2. Palmer, K. B., "A Critical Review of The Thermal and Electrical Conductivities of Ductile Cast Iron and Several Grey Cast Irons by J.H. Brophy and M. J. Sinnott," British

.. '
5 Cast Iron Research Association Journal. Report No. 540, v. 8. pp. 266-272, 1960. . ' <
3. Omerod, J., Taylor, R. E., Edwards, R.J., "Thermal Diffusivity of Cast Irons," Metals Technology, April, pp. 109- 113, 1978.
4. Fitzgeorge, D. and Pope, J. A., " The Thermal and Elastic Properties of Eight Cast irons," Transactions of the North East Coast Institution of Engineers and Shipbuilders, v. 75, pp. 284-330, 1959.
5. Parker, W. J., Jenkins, R. J., Butler, C. P., and Abbott, G. L., "Flash Method of Determining Thermal Diffusivity, Heat Capacity, and Thermal Conductivity," Journal of Applied Physics, v. 32, no. 9, pp. 1679-1684, 1961.
6. Koski, J. A., "Improved Data Reduction Methods for Laser Pulse Diffisivity Determination with the Use of Minicomputers," Proceedings of the 8th Symposium of Thermophysical Properties, Vol. 11, pp. 94-103, 1981.
7. Clark, L. M. and Taylor, R. E., "Radiation Loss in the Flash Method for Thermal Diffusivity," Journal of Applied Physics, v.46, no.2,pp. 714-719, 1975.
8. Wang, H., Dinwiddie, R B., and Gaal, P. S., "Multiple Station Thermal Difisivity Instrument," Thermal Conductivity 23, Eds. K. E. Wilkes, R. B. Dinwiddie and R S. Graves, Technomic Publishing Co., Lancasrer, PA, pp. 119- 127,1996.
9. Cowan, R D., "Pulse Method of Measuring Thermal Diffisivity at High Temperatures," Journal of Applied Physics, v. 34, no. 4, pp. 926-927, 1963.
10. Metals Handbook 9th Ed., Vol. 1, Properties of Iron and Steel, ASM, 1978, p. 3 1.
1 1. Thermal Conductivity, Thermophysical Properties of Matter, The TPRC Data Series, Vol. 1, IFVPlenum, 1970, p. 1128.
12. R. Dinwiddie and R Hecht, unpublished results.