paper open access application of 5s and visual management
TRANSCRIPT

IOP Conference Series Materials Science and Engineering
PAPER bull OPEN ACCESS
Application of 5S and Visual Management toImprove Shipment Preparation of Finished GoodsTo cite this article L K Yik and J F Chin 2019 IOP Conf Ser Mater Sci Eng 530 012039
View the article online for updates and enhancements
Recent citationsJulio Silva et al-
This content was downloaded from IP address 6521228167 on 04102021 at 0301
Content from this work may be used under the terms of the Creative Commons Attribution 30 licence Any further distributionof this work must maintain attribution to the author(s) and the title of the work journal citation and DOI
Published under licence by IOP Publishing Ltd
ICRAIEM 2018
IOP Conf Series Materials Science and Engineering 530 (2019) 012039
IOP Publishing
doi1010881757-899X5301012039
1
Application of 5S and Visual Management to Improve
Shipment Preparation of Finished Goods
L K Yik and J F Chin
School of Mechanical Engineering Engineering Campus Universiti Sains Malaysia
14300 Nibong Tebal Pulau Pinang Malaysia
Corresponding author chinjengfengusmmy
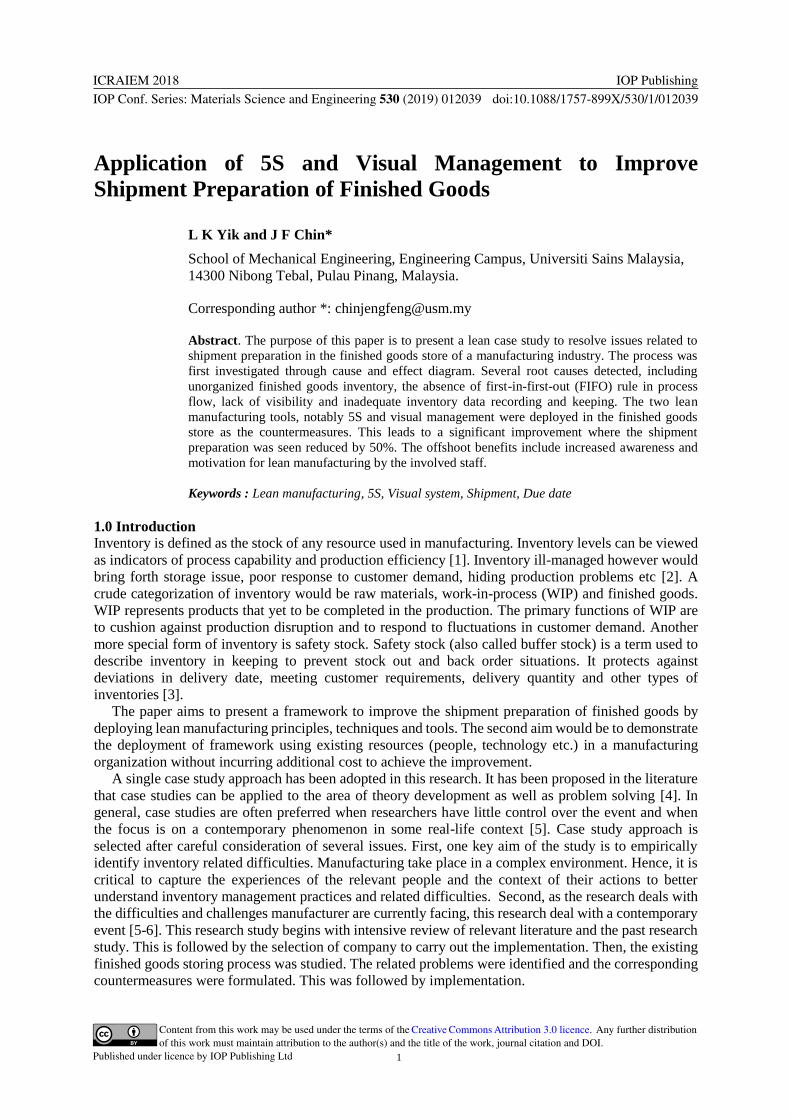
Abstract The purpose of this paper is to present a lean case study to resolve issues related to
shipment preparation in the finished goods store of a manufacturing industry The process was
first investigated through cause and effect diagram Several root causes detected including
unorganized finished goods inventory the absence of first-in-first-out (FIFO) rule in process
flow lack of visibility and inadequate inventory data recording and keeping The two lean
manufacturing tools notably 5S and visual management were deployed in the finished goods
store as the countermeasures This leads to a significant improvement where the shipment
preparation was seen reduced by 50 The offshoot benefits include increased awareness and
motivation for lean manufacturing by the involved staff
Keywords Lean manufacturing 5S Visual system Shipment Due date
10 Introduction
Inventory is defined as the stock of any resource used in manufacturing Inventory levels can be viewed
as indicators of process capability and production efficiency [1] Inventory ill-managed however would
bring forth storage issue poor response to customer demand hiding production problems etc [2] A
crude categorization of inventory would be raw materials work-in-process (WIP) and finished goods
WIP represents products that yet to be completed in the production The primary functions of WIP are
to cushion against production disruption and to respond to fluctuations in customer demand Another
more special form of inventory is safety stock Safety stock (also called buffer stock) is a term used to
describe inventory in keeping to prevent stock out and back order situations It protects against
deviations in delivery date meeting customer requirements delivery quantity and other types of
inventories [3]
The paper aims to present a framework to improve the shipment preparation of finished goods by
deploying lean manufacturing principles techniques and tools The second aim would be to demonstrate
the deployment of framework using existing resources (people technology etc) in a manufacturing
organization without incurring additional cost to achieve the improvement
A single case study approach has been adopted in this research It has been proposed in the literature
that case studies can be applied to the area of theory development as well as problem solving [4] In
general case studies are often preferred when researchers have little control over the event and when
the focus is on a contemporary phenomenon in some real-life context [5] Case study approach is
selected after careful consideration of several issues First one key aim of the study is to empirically
identify inventory related difficulties Manufacturing take place in a complex environment Hence it is
critical to capture the experiences of the relevant people and the context of their actions to better
understand inventory management practices and related difficulties Second as the research deals with
the difficulties and challenges manufacturer are currently facing this research deal with a contemporary
event [5-6] This research study begins with intensive review of relevant literature and the past research
study This is followed by the selection of company to carry out the implementation Then the existing
finished goods storing process was studied The related problems were identified and the corresponding
countermeasures were formulated This was followed by implementation
ICRAIEM 2018
IOP Conf Series Materials Science and Engineering 530 (2019) 012039
IOP Publishing
doi1010881757-899X5301012039
2
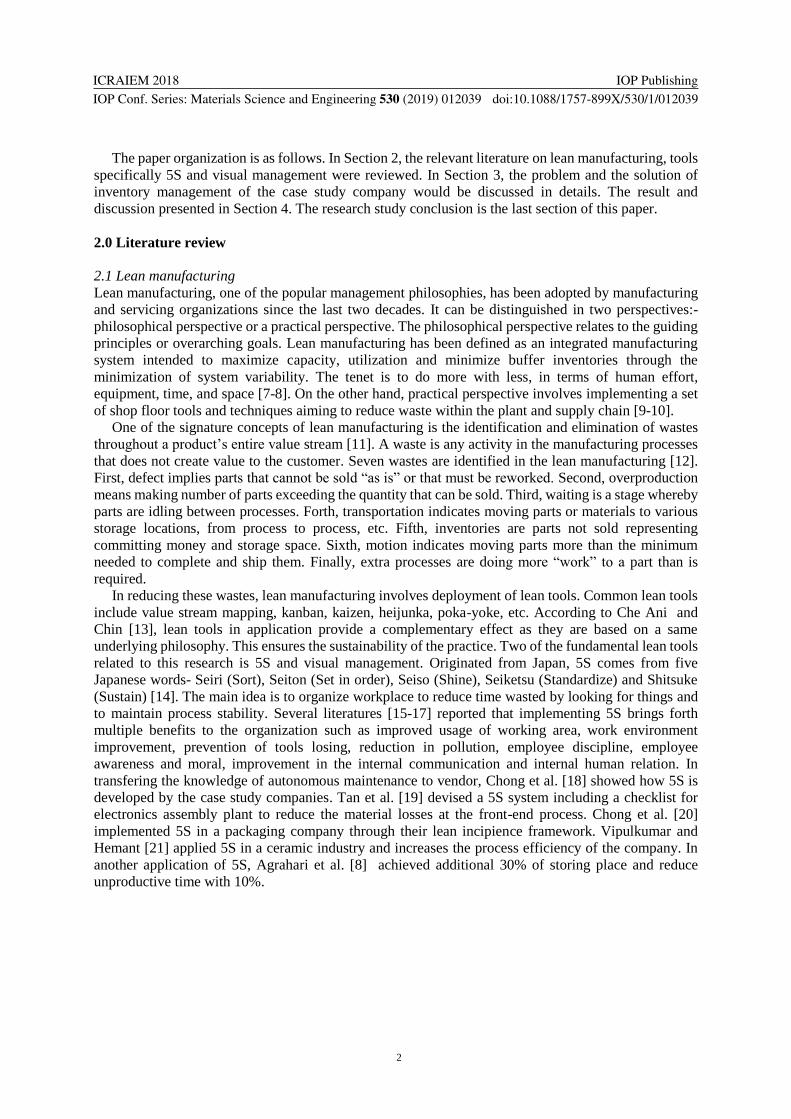
The paper organization is as follows In Section 2 the relevant literature on lean manufacturing tools
specifically 5S and visual management were reviewed In Section 3 the problem and the solution of
inventory management of the case study company would be discussed in details The result and
discussion presented in Section 4 The research study conclusion is the last section of this paper
20 Literature review
21 Lean manufacturing
Lean manufacturing one of the popular management philosophies has been adopted by manufacturing
and servicing organizations since the last two decades It can be distinguished in two perspectives-
philosophical perspective or a practical perspective The philosophical perspective relates to the guiding
principles or overarching goals Lean manufacturing has been defined as an integrated manufacturing
system intended to maximize capacity utilization and minimize buffer inventories through the
minimization of system variability The tenet is to do more with less in terms of human effort
equipment time and space [7-8] On the other hand practical perspective involves implementing a set
of shop floor tools and techniques aiming to reduce waste within the plant and supply chain [9-10]
One of the signature concepts of lean manufacturing is the identification and elimination of wastes
throughout a productrsquos entire value stream [11] A waste is any activity in the manufacturing processes
that does not create value to the customer Seven wastes are identified in the lean manufacturing [12]
First defect implies parts that cannot be sold ldquoas isrdquo or that must be reworked Second overproduction
means making number of parts exceeding the quantity that can be sold Third waiting is a stage whereby
parts are idling between processes Forth transportation indicates moving parts or materials to various
storage locations from process to process etc Fifth inventories are parts not sold representing
committing money and storage space Sixth motion indicates moving parts more than the minimum
needed to complete and ship them Finally extra processes are doing more ldquoworkrdquo to a part than is
required
In reducing these wastes lean manufacturing involves deployment of lean tools Common lean tools
include value stream mapping kanban kaizen heijunka poka-yoke etc According to Che Ani and
Chin [13] lean tools in application provide a complementary effect as they are based on a same
underlying philosophy This ensures the sustainability of the practice Two of the fundamental lean tools
related to this research is 5S and visual management Originated from Japan 5S comes from five
Japanese words- Seiri (Sort) Seiton (Set in order) Seiso (Shine) Seiketsu (Standardize) and Shitsuke
(Sustain) [14] The main idea is to organize workplace to reduce time wasted by looking for things and
to maintain process stability Several literatures [15-17] reported that implementing 5S brings forth
multiple benefits to the organization such as improved usage of working area work environment
improvement prevention of tools losing reduction in pollution employee discipline employee
awareness and moral improvement in the internal communication and internal human relation In
transfering the knowledge of autonomous maintenance to vendor Chong et al [18] showed how 5S is
developed by the case study companies Tan et al [19] devised a 5S system including a checklist for
electronics assembly plant to reduce the material losses at the front-end process Chong et al [20]
implemented 5S in a packaging company through their lean incipience framework Vipulkumar and
Hemant [21] applied 5S in a ceramic industry and increases the process efficiency of the company In
another application of 5S Agrahari et al [8] achieved additional 30 of storing place and reduce
unproductive time with 10
ICRAIEM 2018
IOP Conf Series Materials Science and Engineering 530 (2019) 012039
IOP Publishing
doi1010881757-899X5301012039
3
Table1 Terms and feature of 5S [22] Japanese
Term
Equivalent ldquoSrdquo term
(5S)
Equivalent ldquoCrdquo
term (5C) Features
Seiri Sort Clear Search useful and useless items
Separate both items amp Classify
them
Critical items should be kept for
use nearby
Seiton Systematize or Set
in order
Configure Arrange useful items properly
Discard useless items
Give color according to their use
Seiso Sweep or Shine Clean and Check Clean and polish all working
palces
Remove trash or dirt properly
Seiketsu Standardize Confirmity Maintain cleanliness
TestedInspected randomly
Convert into high standard
Shitsuke Self-Discipline Custom and
Practice Motivate employee towards work
Generate self discipline
Another common lean tool is visual management Visual management is defined as a set of
techniques to create visual communication visual control and ultimately a visual workplace Visual
management also defines performance improvement in any type of organization using strong graphic
visualization techniques [23] Tezel et al [24] identified nine functions of visual management ie
transparency discipline continuous improvement job facilitation on-the-job training creating shared
ownership management by facts simplification and unification In this sense visual management
facilitates employee autonomy serves to eliminate waste fosters continuous improvement allows for
quick response amp recovery leads to information sharing exposes abnormalities and maintains gains
For an example a visual board installed at the workplace displays performance of production
attendance quality concern etc Goh et al [25] developed a visual board to regulate the flow and WIP
between processes between manufacturing cells This reveals key production statuses in a glance [26]
30 Case study
A manufacturer of ferrite was selected in this research The case study company is a make-to-order
(MTO) manufacturer of ferrite core product The company produces four types of products namely
product R product C product T and product D The monthly order volume is 100 tons to 120 tons The
percentage of the each product type is 65 20 10 and 5 respectively Product R was selected
because it significantly impacts performance of the company
31 Improvement framework
The existing shipment preparation process was analyzed and described as below Informal interviews
personal observations and archival documents (finished goods despatched note stock card etc) were the
sources of data PDCA cycle was used to systematically improve shipment preparation process The four
underlying phases are P(Plan) D(Do) C(Check) and A(Act) In ldquoPlanrdquo phase the improvement
framework starts with forming a multidisciplinary team It was leaded by a project manager with team
members including three storekeepers one store clerk one selection and packing supervisor and one
internship student Next the improvement goal was defined The existing process and material flow
ICRAIEM 2018
IOP Conf Series Materials Science and Engineering 530 (2019) 012039
IOP Publishing
doi1010881757-899X5301012039
4
were analysed by using tools such as process mapping value stream mapping etc The root cause is
determined through applying cause and effect diagram Suitable countermeasures to resolve the root
cause are proposed and the details of the improvement steps are formulated In the ldquoDordquo phase the
proposed countermeasure is implemented by using various strategies and tactics in order to achieve the
project objectives The project team members would be trained through on-job-training (OJT) approach
The OJT is the practical training and the training was carried at the real life environment rather than
theory explanation in the classroom In the ldquoCheckrdquo phase the performance of the implementation is
evaluated in order to seek the further refinement The ldquoActrdquo phase is the area where the improvement
cycle would be repeated in case the goal is not attained The project would be closed if the goal is
attained
ICRAIEM 2018
IOP Conf Series Materials Science and Engineering 530 (2019) 012039
IOP Publishing
doi1010881757-899X5301012039
5
START
FORMING PROJECT TEAM
STUDY EXISTING PROCESS AND
SYSTEM
IDENTIFY THE DRAWBACKS OF
THE EXISTING SYSTEM
DEFINE PROJECT GOAL
ROOT CAUSE ANALYSIS AND
COUNTERMEASURE
DEVELOPMENT
IMPLEMENT COUNTERMEASURE
DEVELOP STANDARD AND ON-
JOB TRAINING
MEASURE PERFORMANCE AND
GOAL ATTAINMENT
GOAL ATTAIN
END
No require refinement
or new countermeasure
PL
AN
DO
CH
EC
KA
CT
Yes
Figure 1 Shipment preparation process improvement framework
ICRAIEM 2018
IOP Conf Series Materials Science and Engineering 530 (2019) 012039
IOP Publishing
doi1010881757-899X5301012039
6
32 Plan stage
The shipment preparation process started with the storekeeper receiving shipment advice from the sale
department The storekeeper checked the stock card and finished goods despatch note file to verify the
product quantity in the store against demand stated in the shipment advice The storekeeper then brought
the finished goods despatch note to the storage area to retrieve the product lots for shipment The product
lots would then be placed and arranged onto plastic pallets Then the storekeeper recorded the products
lot number and quantity (kpcs) into the shipment traceability form After recording the product lots
would be transferred to a wooden crate The lot was then placed at a temporary storage area to wait for
delivery The completed shipment traceability form was kept in the associated folder The storekeeper
spent 65 days to complete the shipment based on completion rate three wooden crates per day Twenty
wooden crates were needed for each Friday weekly shipment Shipment postponement to the following
Monday happened incidental to insufficient pack to store quantity This affects three forth of the
shipments
The existing shipment preparation process was broken down into sub activities of value-added (VA)
and non-value added (NVA) Non-value added activities could be eliminated or replaced with more
efficient methods The existing shipment preparation process of a wooden crate (288 cartons) consists
of twelve activities contributing to 358 hours The details of these activities are described in Figure 2
Cause and effect diagram was developed Several causes related to method were unorganized
inventory lack of visibility and inadequate inventory data recording and keeping A cause related to
man was failed to follow first-in-fist-out (FIFO) The product lots received from upstream (selection and
packing) was stored at the area without clear location and indication This entailed the storekeeper to
spend on average 40 min to search and retrieve product during shipment preparation The third cause
was lack of visibility The inventory details were kept in the finished goods despatch note file and stock
file The storekeeper compared the stock file record to determine the product quantity available with the
finished goods despatch note After that the details were filled into shipment traceability form The forth
cause was inadequate inventory data recording and keeping The store clerk spent significant amount of
time to perform double entry works She keyed in the product lots quantity (kpcs) into the Excel
spreadsheet and the stock file separately The data required for shipment preparation process effectively
which was required data like lot number of the carton box The storekeeper needed to obtain the lot
number from finished goods despatch note
ICRAIEM 2018
IOP Conf Series Materials Science and Engineering 530 (2019) 012039
IOP Publishing
doi1010881757-899X5301012039
7
Figure 2 Current shipment preparation process flow chart
PROCESS FLOW CHART ANALYST PAGE
Shipment Preparation process
flow chartKY Liew 1 of 1
10 NVA
20 NVA
30 NVA
40 VA
20 VA
10 VA
15 NVA
5 NVA
45 VA
15 VA
5 VA
0 VA
Min 215
Hour 358
VANVA
Activity
12) Waiting for shipment
3) Verify lot numbers number of cartons and quantities
(Kpcs) in the finished goods despatch note
4) Look for physical cartons of product in the identified
storage location
5) Gether the relevant cartons of product and place it
on the wooden pallet
6) Transfer the wooden pallet of cartons in front the
wooden crate
7) Record the lot number number cartons and
quantities (Kpcs) into the shipment traceability form by
1st storekeeper
8) Verify the shipment traceability form record against
physical cartons of product by 2nd storekeeper
9) Fill the cartons of product into the wooden crate
10) Close the wooden crate (hammer and nail) while
completed fill in process and stick identification label
11) Transfer the wooden crate to the awaiting shipment
area
Details of method
1) Verify quantity requested in shipment advice
2) Check against stock card quantities and FIFO then
record information into the shipment advice
Time
Spend
(min)
(Current
State)
Op
era
tio
n
Mo
vem
en
t
Insp
ectio
n
Dela
y
Sto
rag
e
ICRAIEM 2018
IOP Conf Series Materials Science and Engineering 530 (2019) 012039
IOP Publishing
doi1010881757-899X5301012039
8
Long shipment
preparation time
MACHINE
MATERIAL
MAN
METHOD
Inventory unorganized
Inadequate data recording
Lack of visibility
Not compliance with FIFO rule
Figure 3 Cause and effect diagram of long shipment preparation time
Several countermeasures are developed in corresponding to the root causes defined previously As
aforementioned the key concepts to drive the development are 5S and visual management They are
shown in Table 2
Table 2 Countermeasure development
Root Cause Description 5S
Tools
Visual
Management
Tools
Countermeasure
Inventory
Unorganized
The fresh
product lots
and the old
product lots
were placed
together at the
store area
without status
indicator
Seiri
Seiton
Seiso
Yellow
outline Redesign the
finished goods
store layout
Re-layout the
products location
in the finished
goods store
controlling the left
over product from
the previous years
Incompliance
to FIFO rule
No clear
indication of
the product
lots received
from the
upstream
(selection and
packing)
Seiketsu
Shitsuke
Red sticker Indicating the
product lots with
red sticker written
STORE DATE
after completed
packing process
Lack of
visibility
Product lots
placed at the
storage area
without clear
information of
each carton
product
Seiketsu
Shitsuke
Stock list Prepare a store list
for each location to
indicate the details
like lot number
and number of
carton
Inadequate
data recording
Use inefficient
method to data
collection and
storage cause
Seiri
Seiton
Seiso
Excel
spreadsheet Convert the
hardcopy of
finished goods
despatch note into
ICRAIEM 2018
IOP Conf Series Materials Science and Engineering 530 (2019) 012039
IOP Publishing
doi1010881757-899X5301012039
9
redundant
work and can
provide
information
effectively
softcopy of Excel
spreadsheet The
softcopy contents
all information
required for
shipment
preparation which
include product
code lot number
quantity net
weight production
date and location
33 Do stage
331 Implementing countermeasure for lack of visibility The existing finished goods store was re-laid
out as shown in Figure 4 The storage column was designed according to the size of the pallet (4ft (L)
x 15ft (W)) and ten pallets of product lots can be placed in each storage column The column was
identified by a location indicator with alphabet in ascending order from A to Z and associate with
customer name A stock list displayer (made of clear folder and metal plate) was installed in front of the
storage column to keep the stock list The information in the stock list includes customer name product
code lot number number of carton and quantity in kilo-piece (kpcs) The storekeeper could refer to the
stock list at ease to find the location of the product lots to be retrieved
Figure 4 Improved layout of finished goods store
STORAGE
AREA
Awaiting QA Buy off area
Location
Indicator
4 Columns
10 pallets
A
B Customer 2
7 Columns
10 pallets
1 Columns
10 pallets
1 Column
10 pallets
CRATING
AREA
RECEIVING
AREA
TO AWAITING
SHIPMENT
AREA
Customer 1
ICRAIEM 2018
IOP Conf Series Materials Science and Engineering 530 (2019) 012039
IOP Publishing
doi1010881757-899X5301012039
10
332 Implementing countermeasure for unorganized inventory unorganized As aforementioned
inventory was now to be arranged on predetermined columns Furthermore each pallet of products
would carry an individual stock list holding the information about the product lots and the assigned
storage column Clear directive was given to the storekeeper to abide to the new layout and inventory
storing arrangement
333 Implementing countermeasure for incompliance to FIFO rule The product lot was labelled with a
red sticker written with store date after completed packing process to facilitate storekeeper to comply
with FIFO
Figure 5 Store Date sticker on a carton
334 Implementing countermeasure for inadequate inventory data recording Excel spreadsheet (Figure
6) replaced the manual recording of finished goods in hardcopy despatch note The spreadsheet contains
the information of products lot numbers quantities net weights production date and location The
spreadsheet search function aids storekeeper to identify product lot location
Figure 6 Excel Spreadsheet of finished goods despatch note
ICRAIEM 2018
IOP Conf Series Materials Science and Engineering 530 (2019) 012039
IOP Publishing
doi1010881757-899X5301012039
11
34 Check phase
341 On job training On-job training (OJT) was introduced to the finished goods store personnel It
was done when the project manager accompanied the store personnel to carry out the improvement
activities Any concern raised during implementation and training would be resolved immediately if
possible This motivated store personnel and built trust and hence provided the impetus for future
improvement
35 Act phase
After implementing the countermeasures the time spent for shipment preparation reduced to 183 hours
per wooden crate Also activities were reduced to eight from the previous twelve Data entry process
was shrunk to 2 hours No further modification is required as the system has been running smoothly as
designed over the next two months
Figure 7 Future state shipment preparation process flow chart
40 Conclusion and future work
Through the project the shipment preparation process was significantly improved by using the
developed framework This provided sufficient time for storekeeper to carry out stock-taking daily The
workload of the store clerk was also streamlined by the removal of the work redundancy in recording
PDCA ensures systematic running of the project Two primary tools deployed in the framework are 5S
and visual management Evidently 5S allows system inefficiencies to be categorized and addressed
separately As the shipment preparation process is manual the installation of visual management
provides instant vital information in task execution This also stabilises the process when the variability
was reduced The framework also promotes human touch and team spirit as problem solving was
PROCESS FLOW CHART ANALYST PAGE
Shipment Preparation process
flow chartKY Liew 1 of 1
30
10
10
5
45
5
5
0
Min 110
Hour 183
Sto
rage
Time
Spend
(min)
(Future
State)
3) Gether the relevant cartons of product and place it
on the wooden plate
4) Transfer the wooden pallet of cartons in front the
wooden crate
2) Look for physical cartons of product in the identified
storage location
Details of method
1) Retrive data from the Excel finished goods despatch
note and generate shipment traceability form with lot
number number of cartons and quantity (kpcs) based
on shipment advice request
Ope
ratio
n
Mov
emen
t
Insp
ectio
n
5) Fill the cartons of product into the wooden crate
6) Close the wooden crate (Nail gun) while completed
fill in process and stick identification label
7) Transfer the wooden crate to the awaiting shipment
area
8) Waiting for shipment
Del
ay
ICRAIEM 2018
IOP Conf Series Materials Science and Engineering 530 (2019) 012039
IOP Publishing
doi1010881757-899X5301012039
12
demonstrated as a shared effort The future improvement of task is using barcode system to manage the
flow of the product lots in the finished goods store
Acknowledgement
This work was supported by Research University Grant (RUI) Universiti Sains Malaysia [grant number
8014069]
References
[1] Lieberman M B and Demeester L 1999 Inventory reduction and Productivity growth Linkages
in the Japanese automotive industry Management Science Vol 45 No 4
[2] Ziukov S 2015 A literature review on models of inventory management under uncertainty ISSN
2029-8234 Verslo Sistemos ir Ekonomika Business System and Economics Vol 5 (1)
[3] Radasanu A C 2016 Inventory management service level and safety stock Journal of Public
Administration Finance and Law
[4] Eisenhardt K M 1989 Building theories from case study research Academy of Management 710
Review 14 (4) 532ndash550
[5] Yin R K 1994 Case study research design and methods 2nd ed Thousand Oaks CA Sage
Publications
[6] Cavaye A L M 1996 Case study research a multi-faceted research approach for IS Information
Systems Journal 6 (3) 227ndash242
[7] Womack J and Jones D 1996 Lean Thinking Banish Waste and Create Wealth in your
Corporation Simon $ Schuster New York NY
[8] Agrahari R S Dangle P A and Chandratre K V 2015 Implementation of 5S methodology in the
small scale industry A case study International Journal of Scientific amp Technology
Research 4(4) pp 180-187
[9] Shah R and Ward P T 2007 ldquoDefining and developing measures of lean productionrdquo Journal of
Operations Management Vol 25 No 4 pp 785-805
[10] Vienazindiene M and Ciarniene R 2013 Lean Manufacturing Implementation And Progress
Measurement ISSN 2029-9338 Economic and Management2013 18 (2)
[11] Rathje M S Boyle T A and Deflorin P 2009 Lean take two reflections from the second attempt at
Lean implementation Business Horizons 52 79-88
[12] Hines P and Rich N 1997 The Seven Value Stream Mapping Tools International Journal of
Operations amp Production Management 17 46-64
[13] Che Ani M N and Chin J F 2016 Self-reinforcing mechanisms for cellularisation a longitudinal
case study International Journal of Production Research 54(3) 696-711
[14] Bayo-Moriones A et al2010 5S use in manufacturing plants contextual factors and impact on
operating performance International Journal of Quality amp Reliability Management Vol 27
Iss2 pp 217-230
[15] Ghodrati A and Zulkifli N 2013 The impact of 5S implementation on industrial organizationsrsquo
performance ISSN 2319-801X International Journal of Business and Management
Invention Vol 2 Issue 3 pp 43-49
[16] Purohit S R and Shantha V 2015 Implementation of 5S methodology in a manufacturing industry
ISSN 2229-5518 International Journal of Scientific amp Engineering Research Vol 6 Issue 8
[17] Kobarne A R 2016 Implementation of lsquo5Srsquo technique in a manufacturing organization A case
study ISSN 2278-8808 Scholarly Research Journal For Interdisciplinary Studies Vol 323
Mar-April 2016
[18] Chong M Y Chin J F and Hamzah H S 2012 Transfer of total productive maintenance to supply
chain Total Quality Management amp Business Excellence 23 467-488
[19] Tan P Y Chin J F Prakash J and Loh W P 2012 Reducing Electronic Component Losses in Lean
Electronics Assembly with Six Sigma Approach International Journal of Lean Six Sigma
ICRAIEM 2018
IOP Conf Series Materials Science and Engineering 530 (2019) 012039
IOP Publishing
doi1010881757-899X5301012039
13
Vol 3 Iss 3 pp 206 ndash 230
[20] Chong M Y Chin J F Loh W P 2013 Lean incipience spiral model for small and medium
enterprises International Journal of Industrial Engineering 20
[21] Vipulkumar C P and Hemant T 2014 A case study 5s implementation in ceramic manufacturing
company ISSN 2277-5056 Bonfring International Journal of Industrial Engineering and
Management Science Vol 4 No 3 pp 132-138
[22] Sidhu B S Kumar V and Bajaj A 2015 The ldquo5Srdquo Strategy by using PDCA Cycle for Continuous
Improvement of the Manufacturing Processes in Agriculture Industry International Journal
of Research in Industrial Engineering Vol 2 pp 10-23
[23] Liff Stewart and Pamela A P 2004 Seeing is believing how the new art of visual management
can boost performance throughout your organization AMACOM Div American Mgmt Assn
[24] Tezel B A Koskela L J and Tzortzopoulos P 2009 The functions of visual management
International Research Symposium Salford UK
[25] Goh W J Chin J F Kamaruddin S Muhammad N A 2014 A Visual Board to Facilitate Production
Flow Regulation at Sequential Processes International Journal of Industrial Engineering
and Management 1-9
[26] Brien M O 2014 6S and visual management LBSPartners Nexus innovation centre Tierney
building University of Limerick Limerick Ireland
Content from this work may be used under the terms of the Creative Commons Attribution 30 licence Any further distributionof this work must maintain attribution to the author(s) and the title of the work journal citation and DOI
Published under licence by IOP Publishing Ltd
ICRAIEM 2018
IOP Conf Series Materials Science and Engineering 530 (2019) 012039
IOP Publishing
doi1010881757-899X5301012039
1
Application of 5S and Visual Management to Improve
Shipment Preparation of Finished Goods
L K Yik and J F Chin
School of Mechanical Engineering Engineering Campus Universiti Sains Malaysia
14300 Nibong Tebal Pulau Pinang Malaysia
Corresponding author chinjengfengusmmy
Abstract The purpose of this paper is to present a lean case study to resolve issues related to
shipment preparation in the finished goods store of a manufacturing industry The process was
first investigated through cause and effect diagram Several root causes detected including
unorganized finished goods inventory the absence of first-in-first-out (FIFO) rule in process
flow lack of visibility and inadequate inventory data recording and keeping The two lean
manufacturing tools notably 5S and visual management were deployed in the finished goods
store as the countermeasures This leads to a significant improvement where the shipment
preparation was seen reduced by 50 The offshoot benefits include increased awareness and
motivation for lean manufacturing by the involved staff
Keywords Lean manufacturing 5S Visual system Shipment Due date
10 Introduction
Inventory is defined as the stock of any resource used in manufacturing Inventory levels can be viewed
as indicators of process capability and production efficiency [1] Inventory ill-managed however would
bring forth storage issue poor response to customer demand hiding production problems etc [2] A
crude categorization of inventory would be raw materials work-in-process (WIP) and finished goods
WIP represents products that yet to be completed in the production The primary functions of WIP are
to cushion against production disruption and to respond to fluctuations in customer demand Another
more special form of inventory is safety stock Safety stock (also called buffer stock) is a term used to
describe inventory in keeping to prevent stock out and back order situations It protects against
deviations in delivery date meeting customer requirements delivery quantity and other types of
inventories [3]
The paper aims to present a framework to improve the shipment preparation of finished goods by
deploying lean manufacturing principles techniques and tools The second aim would be to demonstrate
the deployment of framework using existing resources (people technology etc) in a manufacturing
organization without incurring additional cost to achieve the improvement
A single case study approach has been adopted in this research It has been proposed in the literature
that case studies can be applied to the area of theory development as well as problem solving [4] In
general case studies are often preferred when researchers have little control over the event and when
the focus is on a contemporary phenomenon in some real-life context [5] Case study approach is
selected after careful consideration of several issues First one key aim of the study is to empirically
identify inventory related difficulties Manufacturing take place in a complex environment Hence it is
critical to capture the experiences of the relevant people and the context of their actions to better
understand inventory management practices and related difficulties Second as the research deals with
the difficulties and challenges manufacturer are currently facing this research deal with a contemporary
event [5-6] This research study begins with intensive review of relevant literature and the past research
study This is followed by the selection of company to carry out the implementation Then the existing
finished goods storing process was studied The related problems were identified and the corresponding
countermeasures were formulated This was followed by implementation
ICRAIEM 2018
IOP Conf Series Materials Science and Engineering 530 (2019) 012039
IOP Publishing
doi1010881757-899X5301012039
2
The paper organization is as follows In Section 2 the relevant literature on lean manufacturing tools
specifically 5S and visual management were reviewed In Section 3 the problem and the solution of
inventory management of the case study company would be discussed in details The result and
discussion presented in Section 4 The research study conclusion is the last section of this paper
20 Literature review
21 Lean manufacturing
Lean manufacturing one of the popular management philosophies has been adopted by manufacturing
and servicing organizations since the last two decades It can be distinguished in two perspectives-
philosophical perspective or a practical perspective The philosophical perspective relates to the guiding
principles or overarching goals Lean manufacturing has been defined as an integrated manufacturing
system intended to maximize capacity utilization and minimize buffer inventories through the
minimization of system variability The tenet is to do more with less in terms of human effort
equipment time and space [7-8] On the other hand practical perspective involves implementing a set
of shop floor tools and techniques aiming to reduce waste within the plant and supply chain [9-10]
One of the signature concepts of lean manufacturing is the identification and elimination of wastes
throughout a productrsquos entire value stream [11] A waste is any activity in the manufacturing processes
that does not create value to the customer Seven wastes are identified in the lean manufacturing [12]
First defect implies parts that cannot be sold ldquoas isrdquo or that must be reworked Second overproduction
means making number of parts exceeding the quantity that can be sold Third waiting is a stage whereby
parts are idling between processes Forth transportation indicates moving parts or materials to various
storage locations from process to process etc Fifth inventories are parts not sold representing
committing money and storage space Sixth motion indicates moving parts more than the minimum
needed to complete and ship them Finally extra processes are doing more ldquoworkrdquo to a part than is
required
In reducing these wastes lean manufacturing involves deployment of lean tools Common lean tools
include value stream mapping kanban kaizen heijunka poka-yoke etc According to Che Ani and
Chin [13] lean tools in application provide a complementary effect as they are based on a same
underlying philosophy This ensures the sustainability of the practice Two of the fundamental lean tools
related to this research is 5S and visual management Originated from Japan 5S comes from five
Japanese words- Seiri (Sort) Seiton (Set in order) Seiso (Shine) Seiketsu (Standardize) and Shitsuke
(Sustain) [14] The main idea is to organize workplace to reduce time wasted by looking for things and
to maintain process stability Several literatures [15-17] reported that implementing 5S brings forth
multiple benefits to the organization such as improved usage of working area work environment
improvement prevention of tools losing reduction in pollution employee discipline employee
awareness and moral improvement in the internal communication and internal human relation In
transfering the knowledge of autonomous maintenance to vendor Chong et al [18] showed how 5S is
developed by the case study companies Tan et al [19] devised a 5S system including a checklist for
electronics assembly plant to reduce the material losses at the front-end process Chong et al [20]
implemented 5S in a packaging company through their lean incipience framework Vipulkumar and
Hemant [21] applied 5S in a ceramic industry and increases the process efficiency of the company In
another application of 5S Agrahari et al [8] achieved additional 30 of storing place and reduce
unproductive time with 10
ICRAIEM 2018
IOP Conf Series Materials Science and Engineering 530 (2019) 012039
IOP Publishing
doi1010881757-899X5301012039
3
Table1 Terms and feature of 5S [22] Japanese
Term
Equivalent ldquoSrdquo term
(5S)
Equivalent ldquoCrdquo
term (5C) Features
Seiri Sort Clear Search useful and useless items
Separate both items amp Classify
them
Critical items should be kept for
use nearby
Seiton Systematize or Set
in order
Configure Arrange useful items properly
Discard useless items
Give color according to their use
Seiso Sweep or Shine Clean and Check Clean and polish all working
palces
Remove trash or dirt properly
Seiketsu Standardize Confirmity Maintain cleanliness
TestedInspected randomly
Convert into high standard
Shitsuke Self-Discipline Custom and
Practice Motivate employee towards work
Generate self discipline
Another common lean tool is visual management Visual management is defined as a set of
techniques to create visual communication visual control and ultimately a visual workplace Visual
management also defines performance improvement in any type of organization using strong graphic
visualization techniques [23] Tezel et al [24] identified nine functions of visual management ie
transparency discipline continuous improvement job facilitation on-the-job training creating shared
ownership management by facts simplification and unification In this sense visual management
facilitates employee autonomy serves to eliminate waste fosters continuous improvement allows for
quick response amp recovery leads to information sharing exposes abnormalities and maintains gains
For an example a visual board installed at the workplace displays performance of production
attendance quality concern etc Goh et al [25] developed a visual board to regulate the flow and WIP
between processes between manufacturing cells This reveals key production statuses in a glance [26]
30 Case study
A manufacturer of ferrite was selected in this research The case study company is a make-to-order
(MTO) manufacturer of ferrite core product The company produces four types of products namely
product R product C product T and product D The monthly order volume is 100 tons to 120 tons The
percentage of the each product type is 65 20 10 and 5 respectively Product R was selected
because it significantly impacts performance of the company
31 Improvement framework
The existing shipment preparation process was analyzed and described as below Informal interviews
personal observations and archival documents (finished goods despatched note stock card etc) were the
sources of data PDCA cycle was used to systematically improve shipment preparation process The four
underlying phases are P(Plan) D(Do) C(Check) and A(Act) In ldquoPlanrdquo phase the improvement
framework starts with forming a multidisciplinary team It was leaded by a project manager with team
members including three storekeepers one store clerk one selection and packing supervisor and one
internship student Next the improvement goal was defined The existing process and material flow
ICRAIEM 2018
IOP Conf Series Materials Science and Engineering 530 (2019) 012039
IOP Publishing
doi1010881757-899X5301012039
4
were analysed by using tools such as process mapping value stream mapping etc The root cause is
determined through applying cause and effect diagram Suitable countermeasures to resolve the root
cause are proposed and the details of the improvement steps are formulated In the ldquoDordquo phase the
proposed countermeasure is implemented by using various strategies and tactics in order to achieve the
project objectives The project team members would be trained through on-job-training (OJT) approach
The OJT is the practical training and the training was carried at the real life environment rather than
theory explanation in the classroom In the ldquoCheckrdquo phase the performance of the implementation is
evaluated in order to seek the further refinement The ldquoActrdquo phase is the area where the improvement
cycle would be repeated in case the goal is not attained The project would be closed if the goal is
attained
ICRAIEM 2018
IOP Conf Series Materials Science and Engineering 530 (2019) 012039
IOP Publishing
doi1010881757-899X5301012039
5
START
FORMING PROJECT TEAM
STUDY EXISTING PROCESS AND
SYSTEM
IDENTIFY THE DRAWBACKS OF
THE EXISTING SYSTEM
DEFINE PROJECT GOAL
ROOT CAUSE ANALYSIS AND
COUNTERMEASURE
DEVELOPMENT
IMPLEMENT COUNTERMEASURE
DEVELOP STANDARD AND ON-
JOB TRAINING
MEASURE PERFORMANCE AND
GOAL ATTAINMENT
GOAL ATTAIN
END
No require refinement
or new countermeasure
PL
AN
DO
CH
EC
KA
CT
Yes
Figure 1 Shipment preparation process improvement framework
ICRAIEM 2018
IOP Conf Series Materials Science and Engineering 530 (2019) 012039
IOP Publishing
doi1010881757-899X5301012039
6
32 Plan stage
The shipment preparation process started with the storekeeper receiving shipment advice from the sale
department The storekeeper checked the stock card and finished goods despatch note file to verify the
product quantity in the store against demand stated in the shipment advice The storekeeper then brought
the finished goods despatch note to the storage area to retrieve the product lots for shipment The product
lots would then be placed and arranged onto plastic pallets Then the storekeeper recorded the products
lot number and quantity (kpcs) into the shipment traceability form After recording the product lots
would be transferred to a wooden crate The lot was then placed at a temporary storage area to wait for
delivery The completed shipment traceability form was kept in the associated folder The storekeeper
spent 65 days to complete the shipment based on completion rate three wooden crates per day Twenty
wooden crates were needed for each Friday weekly shipment Shipment postponement to the following
Monday happened incidental to insufficient pack to store quantity This affects three forth of the
shipments
The existing shipment preparation process was broken down into sub activities of value-added (VA)
and non-value added (NVA) Non-value added activities could be eliminated or replaced with more
efficient methods The existing shipment preparation process of a wooden crate (288 cartons) consists
of twelve activities contributing to 358 hours The details of these activities are described in Figure 2
Cause and effect diagram was developed Several causes related to method were unorganized
inventory lack of visibility and inadequate inventory data recording and keeping A cause related to
man was failed to follow first-in-fist-out (FIFO) The product lots received from upstream (selection and
packing) was stored at the area without clear location and indication This entailed the storekeeper to
spend on average 40 min to search and retrieve product during shipment preparation The third cause
was lack of visibility The inventory details were kept in the finished goods despatch note file and stock
file The storekeeper compared the stock file record to determine the product quantity available with the
finished goods despatch note After that the details were filled into shipment traceability form The forth
cause was inadequate inventory data recording and keeping The store clerk spent significant amount of
time to perform double entry works She keyed in the product lots quantity (kpcs) into the Excel
spreadsheet and the stock file separately The data required for shipment preparation process effectively
which was required data like lot number of the carton box The storekeeper needed to obtain the lot
number from finished goods despatch note
ICRAIEM 2018
IOP Conf Series Materials Science and Engineering 530 (2019) 012039
IOP Publishing
doi1010881757-899X5301012039
7
Figure 2 Current shipment preparation process flow chart
PROCESS FLOW CHART ANALYST PAGE
Shipment Preparation process
flow chartKY Liew 1 of 1
10 NVA
20 NVA
30 NVA
40 VA
20 VA
10 VA
15 NVA
5 NVA
45 VA
15 VA
5 VA
0 VA
Min 215
Hour 358
VANVA
Activity
12) Waiting for shipment
3) Verify lot numbers number of cartons and quantities
(Kpcs) in the finished goods despatch note
4) Look for physical cartons of product in the identified
storage location
5) Gether the relevant cartons of product and place it
on the wooden pallet
6) Transfer the wooden pallet of cartons in front the
wooden crate
7) Record the lot number number cartons and
quantities (Kpcs) into the shipment traceability form by
1st storekeeper
8) Verify the shipment traceability form record against
physical cartons of product by 2nd storekeeper
9) Fill the cartons of product into the wooden crate
10) Close the wooden crate (hammer and nail) while
completed fill in process and stick identification label
11) Transfer the wooden crate to the awaiting shipment
area
Details of method
1) Verify quantity requested in shipment advice
2) Check against stock card quantities and FIFO then
record information into the shipment advice
Time
Spend
(min)
(Current
State)
Op
era
tio
n
Mo
vem
en
t
Insp
ectio
n
Dela
y
Sto
rag
e
ICRAIEM 2018
IOP Conf Series Materials Science and Engineering 530 (2019) 012039
IOP Publishing
doi1010881757-899X5301012039
8
Long shipment
preparation time
MACHINE
MATERIAL
MAN
METHOD
Inventory unorganized
Inadequate data recording
Lack of visibility
Not compliance with FIFO rule
Figure 3 Cause and effect diagram of long shipment preparation time
Several countermeasures are developed in corresponding to the root causes defined previously As
aforementioned the key concepts to drive the development are 5S and visual management They are
shown in Table 2
Table 2 Countermeasure development
Root Cause Description 5S
Tools
Visual
Management
Tools
Countermeasure
Inventory
Unorganized
The fresh
product lots
and the old
product lots
were placed
together at the
store area
without status
indicator
Seiri
Seiton
Seiso
Yellow
outline Redesign the
finished goods
store layout
Re-layout the
products location
in the finished
goods store
controlling the left
over product from
the previous years
Incompliance
to FIFO rule
No clear
indication of
the product
lots received
from the
upstream
(selection and
packing)
Seiketsu
Shitsuke
Red sticker Indicating the
product lots with
red sticker written
STORE DATE
after completed
packing process
Lack of
visibility
Product lots
placed at the
storage area
without clear
information of
each carton
product
Seiketsu
Shitsuke
Stock list Prepare a store list
for each location to
indicate the details
like lot number
and number of
carton
Inadequate
data recording
Use inefficient
method to data
collection and
storage cause
Seiri
Seiton
Seiso
Excel
spreadsheet Convert the
hardcopy of
finished goods
despatch note into
ICRAIEM 2018
IOP Conf Series Materials Science and Engineering 530 (2019) 012039
IOP Publishing
doi1010881757-899X5301012039
9
redundant
work and can
provide
information
effectively
softcopy of Excel
spreadsheet The
softcopy contents
all information
required for
shipment
preparation which
include product
code lot number
quantity net
weight production
date and location
33 Do stage
331 Implementing countermeasure for lack of visibility The existing finished goods store was re-laid
out as shown in Figure 4 The storage column was designed according to the size of the pallet (4ft (L)
x 15ft (W)) and ten pallets of product lots can be placed in each storage column The column was
identified by a location indicator with alphabet in ascending order from A to Z and associate with
customer name A stock list displayer (made of clear folder and metal plate) was installed in front of the
storage column to keep the stock list The information in the stock list includes customer name product
code lot number number of carton and quantity in kilo-piece (kpcs) The storekeeper could refer to the
stock list at ease to find the location of the product lots to be retrieved
Figure 4 Improved layout of finished goods store
STORAGE
AREA
Awaiting QA Buy off area
Location
Indicator
4 Columns
10 pallets
A
B Customer 2
7 Columns
10 pallets
1 Columns
10 pallets
1 Column
10 pallets
CRATING
AREA
RECEIVING
AREA
TO AWAITING
SHIPMENT
AREA
Customer 1
ICRAIEM 2018
IOP Conf Series Materials Science and Engineering 530 (2019) 012039
IOP Publishing
doi1010881757-899X5301012039
10
332 Implementing countermeasure for unorganized inventory unorganized As aforementioned
inventory was now to be arranged on predetermined columns Furthermore each pallet of products
would carry an individual stock list holding the information about the product lots and the assigned
storage column Clear directive was given to the storekeeper to abide to the new layout and inventory
storing arrangement
333 Implementing countermeasure for incompliance to FIFO rule The product lot was labelled with a
red sticker written with store date after completed packing process to facilitate storekeeper to comply
with FIFO
Figure 5 Store Date sticker on a carton
334 Implementing countermeasure for inadequate inventory data recording Excel spreadsheet (Figure
6) replaced the manual recording of finished goods in hardcopy despatch note The spreadsheet contains
the information of products lot numbers quantities net weights production date and location The
spreadsheet search function aids storekeeper to identify product lot location
Figure 6 Excel Spreadsheet of finished goods despatch note
ICRAIEM 2018
IOP Conf Series Materials Science and Engineering 530 (2019) 012039
IOP Publishing
doi1010881757-899X5301012039
11
34 Check phase
341 On job training On-job training (OJT) was introduced to the finished goods store personnel It
was done when the project manager accompanied the store personnel to carry out the improvement
activities Any concern raised during implementation and training would be resolved immediately if
possible This motivated store personnel and built trust and hence provided the impetus for future
improvement
35 Act phase
After implementing the countermeasures the time spent for shipment preparation reduced to 183 hours
per wooden crate Also activities were reduced to eight from the previous twelve Data entry process
was shrunk to 2 hours No further modification is required as the system has been running smoothly as
designed over the next two months
Figure 7 Future state shipment preparation process flow chart
40 Conclusion and future work
Through the project the shipment preparation process was significantly improved by using the
developed framework This provided sufficient time for storekeeper to carry out stock-taking daily The
workload of the store clerk was also streamlined by the removal of the work redundancy in recording
PDCA ensures systematic running of the project Two primary tools deployed in the framework are 5S
and visual management Evidently 5S allows system inefficiencies to be categorized and addressed
separately As the shipment preparation process is manual the installation of visual management
provides instant vital information in task execution This also stabilises the process when the variability
was reduced The framework also promotes human touch and team spirit as problem solving was
PROCESS FLOW CHART ANALYST PAGE
Shipment Preparation process
flow chartKY Liew 1 of 1
30
10
10
5
45
5
5
0
Min 110
Hour 183
Sto
rage
Time
Spend
(min)
(Future
State)
3) Gether the relevant cartons of product and place it
on the wooden plate
4) Transfer the wooden pallet of cartons in front the
wooden crate
2) Look for physical cartons of product in the identified
storage location
Details of method
1) Retrive data from the Excel finished goods despatch
note and generate shipment traceability form with lot
number number of cartons and quantity (kpcs) based
on shipment advice request
Ope
ratio
n
Mov
emen
t
Insp
ectio
n
5) Fill the cartons of product into the wooden crate
6) Close the wooden crate (Nail gun) while completed
fill in process and stick identification label
7) Transfer the wooden crate to the awaiting shipment
area
8) Waiting for shipment
Del
ay
ICRAIEM 2018
IOP Conf Series Materials Science and Engineering 530 (2019) 012039
IOP Publishing
doi1010881757-899X5301012039
12
demonstrated as a shared effort The future improvement of task is using barcode system to manage the
flow of the product lots in the finished goods store
Acknowledgement
This work was supported by Research University Grant (RUI) Universiti Sains Malaysia [grant number
8014069]
References
[1] Lieberman M B and Demeester L 1999 Inventory reduction and Productivity growth Linkages
in the Japanese automotive industry Management Science Vol 45 No 4
[2] Ziukov S 2015 A literature review on models of inventory management under uncertainty ISSN
2029-8234 Verslo Sistemos ir Ekonomika Business System and Economics Vol 5 (1)
[3] Radasanu A C 2016 Inventory management service level and safety stock Journal of Public
Administration Finance and Law
[4] Eisenhardt K M 1989 Building theories from case study research Academy of Management 710
Review 14 (4) 532ndash550
[5] Yin R K 1994 Case study research design and methods 2nd ed Thousand Oaks CA Sage
Publications
[6] Cavaye A L M 1996 Case study research a multi-faceted research approach for IS Information
Systems Journal 6 (3) 227ndash242
[7] Womack J and Jones D 1996 Lean Thinking Banish Waste and Create Wealth in your
Corporation Simon $ Schuster New York NY
[8] Agrahari R S Dangle P A and Chandratre K V 2015 Implementation of 5S methodology in the
small scale industry A case study International Journal of Scientific amp Technology
Research 4(4) pp 180-187
[9] Shah R and Ward P T 2007 ldquoDefining and developing measures of lean productionrdquo Journal of
Operations Management Vol 25 No 4 pp 785-805
[10] Vienazindiene M and Ciarniene R 2013 Lean Manufacturing Implementation And Progress
Measurement ISSN 2029-9338 Economic and Management2013 18 (2)
[11] Rathje M S Boyle T A and Deflorin P 2009 Lean take two reflections from the second attempt at
Lean implementation Business Horizons 52 79-88
[12] Hines P and Rich N 1997 The Seven Value Stream Mapping Tools International Journal of
Operations amp Production Management 17 46-64
[13] Che Ani M N and Chin J F 2016 Self-reinforcing mechanisms for cellularisation a longitudinal
case study International Journal of Production Research 54(3) 696-711
[14] Bayo-Moriones A et al2010 5S use in manufacturing plants contextual factors and impact on
operating performance International Journal of Quality amp Reliability Management Vol 27
Iss2 pp 217-230
[15] Ghodrati A and Zulkifli N 2013 The impact of 5S implementation on industrial organizationsrsquo
performance ISSN 2319-801X International Journal of Business and Management
Invention Vol 2 Issue 3 pp 43-49
[16] Purohit S R and Shantha V 2015 Implementation of 5S methodology in a manufacturing industry
ISSN 2229-5518 International Journal of Scientific amp Engineering Research Vol 6 Issue 8
[17] Kobarne A R 2016 Implementation of lsquo5Srsquo technique in a manufacturing organization A case
study ISSN 2278-8808 Scholarly Research Journal For Interdisciplinary Studies Vol 323
Mar-April 2016
[18] Chong M Y Chin J F and Hamzah H S 2012 Transfer of total productive maintenance to supply
chain Total Quality Management amp Business Excellence 23 467-488
[19] Tan P Y Chin J F Prakash J and Loh W P 2012 Reducing Electronic Component Losses in Lean
Electronics Assembly with Six Sigma Approach International Journal of Lean Six Sigma
ICRAIEM 2018
IOP Conf Series Materials Science and Engineering 530 (2019) 012039
IOP Publishing
doi1010881757-899X5301012039
13
Vol 3 Iss 3 pp 206 ndash 230
[20] Chong M Y Chin J F Loh W P 2013 Lean incipience spiral model for small and medium
enterprises International Journal of Industrial Engineering 20
[21] Vipulkumar C P and Hemant T 2014 A case study 5s implementation in ceramic manufacturing
company ISSN 2277-5056 Bonfring International Journal of Industrial Engineering and
Management Science Vol 4 No 3 pp 132-138
[22] Sidhu B S Kumar V and Bajaj A 2015 The ldquo5Srdquo Strategy by using PDCA Cycle for Continuous
Improvement of the Manufacturing Processes in Agriculture Industry International Journal
of Research in Industrial Engineering Vol 2 pp 10-23
[23] Liff Stewart and Pamela A P 2004 Seeing is believing how the new art of visual management
can boost performance throughout your organization AMACOM Div American Mgmt Assn
[24] Tezel B A Koskela L J and Tzortzopoulos P 2009 The functions of visual management
International Research Symposium Salford UK
[25] Goh W J Chin J F Kamaruddin S Muhammad N A 2014 A Visual Board to Facilitate Production
Flow Regulation at Sequential Processes International Journal of Industrial Engineering
and Management 1-9
[26] Brien M O 2014 6S and visual management LBSPartners Nexus innovation centre Tierney
building University of Limerick Limerick Ireland
ICRAIEM 2018
IOP Conf Series Materials Science and Engineering 530 (2019) 012039
IOP Publishing
doi1010881757-899X5301012039
2
The paper organization is as follows In Section 2 the relevant literature on lean manufacturing tools
specifically 5S and visual management were reviewed In Section 3 the problem and the solution of
inventory management of the case study company would be discussed in details The result and
discussion presented in Section 4 The research study conclusion is the last section of this paper
20 Literature review
21 Lean manufacturing
Lean manufacturing one of the popular management philosophies has been adopted by manufacturing
and servicing organizations since the last two decades It can be distinguished in two perspectives-
philosophical perspective or a practical perspective The philosophical perspective relates to the guiding
principles or overarching goals Lean manufacturing has been defined as an integrated manufacturing
system intended to maximize capacity utilization and minimize buffer inventories through the
minimization of system variability The tenet is to do more with less in terms of human effort
equipment time and space [7-8] On the other hand practical perspective involves implementing a set
of shop floor tools and techniques aiming to reduce waste within the plant and supply chain [9-10]
One of the signature concepts of lean manufacturing is the identification and elimination of wastes
throughout a productrsquos entire value stream [11] A waste is any activity in the manufacturing processes
that does not create value to the customer Seven wastes are identified in the lean manufacturing [12]
First defect implies parts that cannot be sold ldquoas isrdquo or that must be reworked Second overproduction
means making number of parts exceeding the quantity that can be sold Third waiting is a stage whereby
parts are idling between processes Forth transportation indicates moving parts or materials to various
storage locations from process to process etc Fifth inventories are parts not sold representing
committing money and storage space Sixth motion indicates moving parts more than the minimum
needed to complete and ship them Finally extra processes are doing more ldquoworkrdquo to a part than is
required
In reducing these wastes lean manufacturing involves deployment of lean tools Common lean tools
include value stream mapping kanban kaizen heijunka poka-yoke etc According to Che Ani and
Chin [13] lean tools in application provide a complementary effect as they are based on a same
underlying philosophy This ensures the sustainability of the practice Two of the fundamental lean tools
related to this research is 5S and visual management Originated from Japan 5S comes from five
Japanese words- Seiri (Sort) Seiton (Set in order) Seiso (Shine) Seiketsu (Standardize) and Shitsuke
(Sustain) [14] The main idea is to organize workplace to reduce time wasted by looking for things and
to maintain process stability Several literatures [15-17] reported that implementing 5S brings forth
multiple benefits to the organization such as improved usage of working area work environment
improvement prevention of tools losing reduction in pollution employee discipline employee
awareness and moral improvement in the internal communication and internal human relation In
transfering the knowledge of autonomous maintenance to vendor Chong et al [18] showed how 5S is
developed by the case study companies Tan et al [19] devised a 5S system including a checklist for
electronics assembly plant to reduce the material losses at the front-end process Chong et al [20]
implemented 5S in a packaging company through their lean incipience framework Vipulkumar and
Hemant [21] applied 5S in a ceramic industry and increases the process efficiency of the company In
another application of 5S Agrahari et al [8] achieved additional 30 of storing place and reduce
unproductive time with 10
ICRAIEM 2018
IOP Conf Series Materials Science and Engineering 530 (2019) 012039
IOP Publishing
doi1010881757-899X5301012039
3
Table1 Terms and feature of 5S [22] Japanese
Term
Equivalent ldquoSrdquo term
(5S)
Equivalent ldquoCrdquo
term (5C) Features
Seiri Sort Clear Search useful and useless items
Separate both items amp Classify
them
Critical items should be kept for
use nearby
Seiton Systematize or Set
in order
Configure Arrange useful items properly
Discard useless items
Give color according to their use
Seiso Sweep or Shine Clean and Check Clean and polish all working
palces
Remove trash or dirt properly
Seiketsu Standardize Confirmity Maintain cleanliness
TestedInspected randomly
Convert into high standard
Shitsuke Self-Discipline Custom and
Practice Motivate employee towards work
Generate self discipline
Another common lean tool is visual management Visual management is defined as a set of
techniques to create visual communication visual control and ultimately a visual workplace Visual
management also defines performance improvement in any type of organization using strong graphic
visualization techniques [23] Tezel et al [24] identified nine functions of visual management ie
transparency discipline continuous improvement job facilitation on-the-job training creating shared
ownership management by facts simplification and unification In this sense visual management
facilitates employee autonomy serves to eliminate waste fosters continuous improvement allows for
quick response amp recovery leads to information sharing exposes abnormalities and maintains gains
For an example a visual board installed at the workplace displays performance of production
attendance quality concern etc Goh et al [25] developed a visual board to regulate the flow and WIP
between processes between manufacturing cells This reveals key production statuses in a glance [26]
30 Case study
A manufacturer of ferrite was selected in this research The case study company is a make-to-order
(MTO) manufacturer of ferrite core product The company produces four types of products namely
product R product C product T and product D The monthly order volume is 100 tons to 120 tons The
percentage of the each product type is 65 20 10 and 5 respectively Product R was selected
because it significantly impacts performance of the company
31 Improvement framework
The existing shipment preparation process was analyzed and described as below Informal interviews
personal observations and archival documents (finished goods despatched note stock card etc) were the
sources of data PDCA cycle was used to systematically improve shipment preparation process The four
underlying phases are P(Plan) D(Do) C(Check) and A(Act) In ldquoPlanrdquo phase the improvement
framework starts with forming a multidisciplinary team It was leaded by a project manager with team
members including three storekeepers one store clerk one selection and packing supervisor and one
internship student Next the improvement goal was defined The existing process and material flow
ICRAIEM 2018
IOP Conf Series Materials Science and Engineering 530 (2019) 012039
IOP Publishing
doi1010881757-899X5301012039
4
were analysed by using tools such as process mapping value stream mapping etc The root cause is
determined through applying cause and effect diagram Suitable countermeasures to resolve the root
cause are proposed and the details of the improvement steps are formulated In the ldquoDordquo phase the
proposed countermeasure is implemented by using various strategies and tactics in order to achieve the
project objectives The project team members would be trained through on-job-training (OJT) approach
The OJT is the practical training and the training was carried at the real life environment rather than
theory explanation in the classroom In the ldquoCheckrdquo phase the performance of the implementation is
evaluated in order to seek the further refinement The ldquoActrdquo phase is the area where the improvement
cycle would be repeated in case the goal is not attained The project would be closed if the goal is
attained
ICRAIEM 2018
IOP Conf Series Materials Science and Engineering 530 (2019) 012039
IOP Publishing
doi1010881757-899X5301012039
5
START
FORMING PROJECT TEAM
STUDY EXISTING PROCESS AND
SYSTEM
IDENTIFY THE DRAWBACKS OF
THE EXISTING SYSTEM
DEFINE PROJECT GOAL
ROOT CAUSE ANALYSIS AND
COUNTERMEASURE
DEVELOPMENT
IMPLEMENT COUNTERMEASURE
DEVELOP STANDARD AND ON-
JOB TRAINING
MEASURE PERFORMANCE AND
GOAL ATTAINMENT
GOAL ATTAIN
END
No require refinement
or new countermeasure
PL
AN
DO
CH
EC
KA
CT
Yes
Figure 1 Shipment preparation process improvement framework
ICRAIEM 2018
IOP Conf Series Materials Science and Engineering 530 (2019) 012039
IOP Publishing
doi1010881757-899X5301012039
6
32 Plan stage
The shipment preparation process started with the storekeeper receiving shipment advice from the sale
department The storekeeper checked the stock card and finished goods despatch note file to verify the
product quantity in the store against demand stated in the shipment advice The storekeeper then brought
the finished goods despatch note to the storage area to retrieve the product lots for shipment The product
lots would then be placed and arranged onto plastic pallets Then the storekeeper recorded the products
lot number and quantity (kpcs) into the shipment traceability form After recording the product lots
would be transferred to a wooden crate The lot was then placed at a temporary storage area to wait for
delivery The completed shipment traceability form was kept in the associated folder The storekeeper
spent 65 days to complete the shipment based on completion rate three wooden crates per day Twenty
wooden crates were needed for each Friday weekly shipment Shipment postponement to the following
Monday happened incidental to insufficient pack to store quantity This affects three forth of the
shipments
The existing shipment preparation process was broken down into sub activities of value-added (VA)
and non-value added (NVA) Non-value added activities could be eliminated or replaced with more
efficient methods The existing shipment preparation process of a wooden crate (288 cartons) consists
of twelve activities contributing to 358 hours The details of these activities are described in Figure 2
Cause and effect diagram was developed Several causes related to method were unorganized
inventory lack of visibility and inadequate inventory data recording and keeping A cause related to
man was failed to follow first-in-fist-out (FIFO) The product lots received from upstream (selection and
packing) was stored at the area without clear location and indication This entailed the storekeeper to
spend on average 40 min to search and retrieve product during shipment preparation The third cause
was lack of visibility The inventory details were kept in the finished goods despatch note file and stock
file The storekeeper compared the stock file record to determine the product quantity available with the
finished goods despatch note After that the details were filled into shipment traceability form The forth
cause was inadequate inventory data recording and keeping The store clerk spent significant amount of
time to perform double entry works She keyed in the product lots quantity (kpcs) into the Excel
spreadsheet and the stock file separately The data required for shipment preparation process effectively
which was required data like lot number of the carton box The storekeeper needed to obtain the lot
number from finished goods despatch note
ICRAIEM 2018
IOP Conf Series Materials Science and Engineering 530 (2019) 012039
IOP Publishing
doi1010881757-899X5301012039
7
Figure 2 Current shipment preparation process flow chart
PROCESS FLOW CHART ANALYST PAGE
Shipment Preparation process
flow chartKY Liew 1 of 1
10 NVA
20 NVA
30 NVA
40 VA
20 VA
10 VA
15 NVA
5 NVA
45 VA
15 VA
5 VA
0 VA
Min 215
Hour 358
VANVA
Activity
12) Waiting for shipment
3) Verify lot numbers number of cartons and quantities
(Kpcs) in the finished goods despatch note
4) Look for physical cartons of product in the identified
storage location
5) Gether the relevant cartons of product and place it
on the wooden pallet
6) Transfer the wooden pallet of cartons in front the
wooden crate
7) Record the lot number number cartons and
quantities (Kpcs) into the shipment traceability form by
1st storekeeper
8) Verify the shipment traceability form record against
physical cartons of product by 2nd storekeeper
9) Fill the cartons of product into the wooden crate
10) Close the wooden crate (hammer and nail) while
completed fill in process and stick identification label
11) Transfer the wooden crate to the awaiting shipment
area
Details of method
1) Verify quantity requested in shipment advice
2) Check against stock card quantities and FIFO then
record information into the shipment advice
Time
Spend
(min)
(Current
State)
Op
era
tio
n
Mo
vem
en
t
Insp
ectio
n
Dela
y
Sto
rag
e
ICRAIEM 2018
IOP Conf Series Materials Science and Engineering 530 (2019) 012039
IOP Publishing
doi1010881757-899X5301012039
8
Long shipment
preparation time
MACHINE
MATERIAL
MAN
METHOD
Inventory unorganized
Inadequate data recording
Lack of visibility
Not compliance with FIFO rule
Figure 3 Cause and effect diagram of long shipment preparation time
Several countermeasures are developed in corresponding to the root causes defined previously As
aforementioned the key concepts to drive the development are 5S and visual management They are
shown in Table 2
Table 2 Countermeasure development
Root Cause Description 5S
Tools
Visual
Management
Tools
Countermeasure
Inventory
Unorganized
The fresh
product lots
and the old
product lots
were placed
together at the
store area
without status
indicator
Seiri
Seiton
Seiso
Yellow
outline Redesign the
finished goods
store layout
Re-layout the
products location
in the finished
goods store
controlling the left
over product from
the previous years
Incompliance
to FIFO rule
No clear
indication of
the product
lots received
from the
upstream
(selection and
packing)
Seiketsu
Shitsuke
Red sticker Indicating the
product lots with
red sticker written
STORE DATE
after completed
packing process
Lack of
visibility
Product lots
placed at the
storage area
without clear
information of
each carton
product
Seiketsu
Shitsuke
Stock list Prepare a store list
for each location to
indicate the details
like lot number
and number of
carton
Inadequate
data recording
Use inefficient
method to data
collection and
storage cause
Seiri
Seiton
Seiso
Excel
spreadsheet Convert the
hardcopy of
finished goods
despatch note into
ICRAIEM 2018
IOP Conf Series Materials Science and Engineering 530 (2019) 012039
IOP Publishing
doi1010881757-899X5301012039
9
redundant
work and can
provide
information
effectively
softcopy of Excel
spreadsheet The
softcopy contents
all information
required for
shipment
preparation which
include product
code lot number
quantity net
weight production
date and location
33 Do stage
331 Implementing countermeasure for lack of visibility The existing finished goods store was re-laid
out as shown in Figure 4 The storage column was designed according to the size of the pallet (4ft (L)
x 15ft (W)) and ten pallets of product lots can be placed in each storage column The column was
identified by a location indicator with alphabet in ascending order from A to Z and associate with
customer name A stock list displayer (made of clear folder and metal plate) was installed in front of the
storage column to keep the stock list The information in the stock list includes customer name product
code lot number number of carton and quantity in kilo-piece (kpcs) The storekeeper could refer to the
stock list at ease to find the location of the product lots to be retrieved
Figure 4 Improved layout of finished goods store
STORAGE
AREA
Awaiting QA Buy off area
Location
Indicator
4 Columns
10 pallets
A
B Customer 2
7 Columns
10 pallets
1 Columns
10 pallets
1 Column
10 pallets
CRATING
AREA
RECEIVING
AREA
TO AWAITING
SHIPMENT
AREA
Customer 1
ICRAIEM 2018
IOP Conf Series Materials Science and Engineering 530 (2019) 012039
IOP Publishing
doi1010881757-899X5301012039
10
332 Implementing countermeasure for unorganized inventory unorganized As aforementioned
inventory was now to be arranged on predetermined columns Furthermore each pallet of products
would carry an individual stock list holding the information about the product lots and the assigned
storage column Clear directive was given to the storekeeper to abide to the new layout and inventory
storing arrangement
333 Implementing countermeasure for incompliance to FIFO rule The product lot was labelled with a
red sticker written with store date after completed packing process to facilitate storekeeper to comply
with FIFO
Figure 5 Store Date sticker on a carton
334 Implementing countermeasure for inadequate inventory data recording Excel spreadsheet (Figure
6) replaced the manual recording of finished goods in hardcopy despatch note The spreadsheet contains
the information of products lot numbers quantities net weights production date and location The
spreadsheet search function aids storekeeper to identify product lot location
Figure 6 Excel Spreadsheet of finished goods despatch note
ICRAIEM 2018
IOP Conf Series Materials Science and Engineering 530 (2019) 012039
IOP Publishing
doi1010881757-899X5301012039
11
34 Check phase
341 On job training On-job training (OJT) was introduced to the finished goods store personnel It
was done when the project manager accompanied the store personnel to carry out the improvement
activities Any concern raised during implementation and training would be resolved immediately if
possible This motivated store personnel and built trust and hence provided the impetus for future
improvement
35 Act phase
After implementing the countermeasures the time spent for shipment preparation reduced to 183 hours
per wooden crate Also activities were reduced to eight from the previous twelve Data entry process
was shrunk to 2 hours No further modification is required as the system has been running smoothly as
designed over the next two months
Figure 7 Future state shipment preparation process flow chart
40 Conclusion and future work
Through the project the shipment preparation process was significantly improved by using the
developed framework This provided sufficient time for storekeeper to carry out stock-taking daily The
workload of the store clerk was also streamlined by the removal of the work redundancy in recording
PDCA ensures systematic running of the project Two primary tools deployed in the framework are 5S
and visual management Evidently 5S allows system inefficiencies to be categorized and addressed
separately As the shipment preparation process is manual the installation of visual management
provides instant vital information in task execution This also stabilises the process when the variability
was reduced The framework also promotes human touch and team spirit as problem solving was
PROCESS FLOW CHART ANALYST PAGE
Shipment Preparation process
flow chartKY Liew 1 of 1
30
10
10
5
45
5
5
0
Min 110
Hour 183
Sto
rage
Time
Spend
(min)
(Future
State)
3) Gether the relevant cartons of product and place it
on the wooden plate
4) Transfer the wooden pallet of cartons in front the
wooden crate
2) Look for physical cartons of product in the identified
storage location
Details of method
1) Retrive data from the Excel finished goods despatch
note and generate shipment traceability form with lot
number number of cartons and quantity (kpcs) based
on shipment advice request
Ope
ratio
n
Mov
emen
t
Insp
ectio
n
5) Fill the cartons of product into the wooden crate
6) Close the wooden crate (Nail gun) while completed
fill in process and stick identification label
7) Transfer the wooden crate to the awaiting shipment
area
8) Waiting for shipment
Del
ay
ICRAIEM 2018
IOP Conf Series Materials Science and Engineering 530 (2019) 012039
IOP Publishing
doi1010881757-899X5301012039
12
demonstrated as a shared effort The future improvement of task is using barcode system to manage the
flow of the product lots in the finished goods store
Acknowledgement
This work was supported by Research University Grant (RUI) Universiti Sains Malaysia [grant number
8014069]
References
[1] Lieberman M B and Demeester L 1999 Inventory reduction and Productivity growth Linkages
in the Japanese automotive industry Management Science Vol 45 No 4
[2] Ziukov S 2015 A literature review on models of inventory management under uncertainty ISSN
2029-8234 Verslo Sistemos ir Ekonomika Business System and Economics Vol 5 (1)
[3] Radasanu A C 2016 Inventory management service level and safety stock Journal of Public
Administration Finance and Law
[4] Eisenhardt K M 1989 Building theories from case study research Academy of Management 710
Review 14 (4) 532ndash550
[5] Yin R K 1994 Case study research design and methods 2nd ed Thousand Oaks CA Sage
Publications
[6] Cavaye A L M 1996 Case study research a multi-faceted research approach for IS Information
Systems Journal 6 (3) 227ndash242
[7] Womack J and Jones D 1996 Lean Thinking Banish Waste and Create Wealth in your
Corporation Simon $ Schuster New York NY
[8] Agrahari R S Dangle P A and Chandratre K V 2015 Implementation of 5S methodology in the
small scale industry A case study International Journal of Scientific amp Technology
Research 4(4) pp 180-187
[9] Shah R and Ward P T 2007 ldquoDefining and developing measures of lean productionrdquo Journal of
Operations Management Vol 25 No 4 pp 785-805
[10] Vienazindiene M and Ciarniene R 2013 Lean Manufacturing Implementation And Progress
Measurement ISSN 2029-9338 Economic and Management2013 18 (2)
[11] Rathje M S Boyle T A and Deflorin P 2009 Lean take two reflections from the second attempt at
Lean implementation Business Horizons 52 79-88
[12] Hines P and Rich N 1997 The Seven Value Stream Mapping Tools International Journal of
Operations amp Production Management 17 46-64
[13] Che Ani M N and Chin J F 2016 Self-reinforcing mechanisms for cellularisation a longitudinal
case study International Journal of Production Research 54(3) 696-711
[14] Bayo-Moriones A et al2010 5S use in manufacturing plants contextual factors and impact on
operating performance International Journal of Quality amp Reliability Management Vol 27
Iss2 pp 217-230
[15] Ghodrati A and Zulkifli N 2013 The impact of 5S implementation on industrial organizationsrsquo
performance ISSN 2319-801X International Journal of Business and Management
Invention Vol 2 Issue 3 pp 43-49
[16] Purohit S R and Shantha V 2015 Implementation of 5S methodology in a manufacturing industry
ISSN 2229-5518 International Journal of Scientific amp Engineering Research Vol 6 Issue 8
[17] Kobarne A R 2016 Implementation of lsquo5Srsquo technique in a manufacturing organization A case
study ISSN 2278-8808 Scholarly Research Journal For Interdisciplinary Studies Vol 323
Mar-April 2016
[18] Chong M Y Chin J F and Hamzah H S 2012 Transfer of total productive maintenance to supply
chain Total Quality Management amp Business Excellence 23 467-488
[19] Tan P Y Chin J F Prakash J and Loh W P 2012 Reducing Electronic Component Losses in Lean
Electronics Assembly with Six Sigma Approach International Journal of Lean Six Sigma
ICRAIEM 2018
IOP Conf Series Materials Science and Engineering 530 (2019) 012039
IOP Publishing
doi1010881757-899X5301012039
13
Vol 3 Iss 3 pp 206 ndash 230
[20] Chong M Y Chin J F Loh W P 2013 Lean incipience spiral model for small and medium
enterprises International Journal of Industrial Engineering 20
[21] Vipulkumar C P and Hemant T 2014 A case study 5s implementation in ceramic manufacturing
company ISSN 2277-5056 Bonfring International Journal of Industrial Engineering and
Management Science Vol 4 No 3 pp 132-138
[22] Sidhu B S Kumar V and Bajaj A 2015 The ldquo5Srdquo Strategy by using PDCA Cycle for Continuous
Improvement of the Manufacturing Processes in Agriculture Industry International Journal
of Research in Industrial Engineering Vol 2 pp 10-23
[23] Liff Stewart and Pamela A P 2004 Seeing is believing how the new art of visual management
can boost performance throughout your organization AMACOM Div American Mgmt Assn
[24] Tezel B A Koskela L J and Tzortzopoulos P 2009 The functions of visual management
International Research Symposium Salford UK
[25] Goh W J Chin J F Kamaruddin S Muhammad N A 2014 A Visual Board to Facilitate Production
Flow Regulation at Sequential Processes International Journal of Industrial Engineering
and Management 1-9
[26] Brien M O 2014 6S and visual management LBSPartners Nexus innovation centre Tierney
building University of Limerick Limerick Ireland

ICRAIEM 2018
IOP Conf Series Materials Science and Engineering 530 (2019) 012039
IOP Publishing
doi1010881757-899X5301012039
5
START
FORMING PROJECT TEAM
STUDY EXISTING PROCESS AND
SYSTEM
IDENTIFY THE DRAWBACKS OF
THE EXISTING SYSTEM
DEFINE PROJECT GOAL
ROOT CAUSE ANALYSIS AND
COUNTERMEASURE
DEVELOPMENT
IMPLEMENT COUNTERMEASURE
DEVELOP STANDARD AND ON-
JOB TRAINING
MEASURE PERFORMANCE AND
GOAL ATTAINMENT
GOAL ATTAIN
END
No require refinement
or new countermeasure
PL
AN
DO
CH
EC
KA
CT
Yes
Figure 1 Shipment preparation process improvement framework
ICRAIEM 2018
IOP Conf Series Materials Science and Engineering 530 (2019) 012039
IOP Publishing
doi1010881757-899X5301012039
6
32 Plan stage
The shipment preparation process started with the storekeeper receiving shipment advice from the sale
department The storekeeper checked the stock card and finished goods despatch note file to verify the
product quantity in the store against demand stated in the shipment advice The storekeeper then brought
the finished goods despatch note to the storage area to retrieve the product lots for shipment The product
lots would then be placed and arranged onto plastic pallets Then the storekeeper recorded the products
lot number and quantity (kpcs) into the shipment traceability form After recording the product lots
would be transferred to a wooden crate The lot was then placed at a temporary storage area to wait for
delivery The completed shipment traceability form was kept in the associated folder The storekeeper
spent 65 days to complete the shipment based on completion rate three wooden crates per day Twenty
wooden crates were needed for each Friday weekly shipment Shipment postponement to the following
Monday happened incidental to insufficient pack to store quantity This affects three forth of the
shipments
The existing shipment preparation process was broken down into sub activities of value-added (VA)
and non-value added (NVA) Non-value added activities could be eliminated or replaced with more
efficient methods The existing shipment preparation process of a wooden crate (288 cartons) consists
of twelve activities contributing to 358 hours The details of these activities are described in Figure 2
Cause and effect diagram was developed Several causes related to method were unorganized
inventory lack of visibility and inadequate inventory data recording and keeping A cause related to
man was failed to follow first-in-fist-out (FIFO) The product lots received from upstream (selection and
packing) was stored at the area without clear location and indication This entailed the storekeeper to
spend on average 40 min to search and retrieve product during shipment preparation The third cause
was lack of visibility The inventory details were kept in the finished goods despatch note file and stock
file The storekeeper compared the stock file record to determine the product quantity available with the
finished goods despatch note After that the details were filled into shipment traceability form The forth
cause was inadequate inventory data recording and keeping The store clerk spent significant amount of
time to perform double entry works She keyed in the product lots quantity (kpcs) into the Excel
spreadsheet and the stock file separately The data required for shipment preparation process effectively
which was required data like lot number of the carton box The storekeeper needed to obtain the lot
number from finished goods despatch note
ICRAIEM 2018
IOP Conf Series Materials Science and Engineering 530 (2019) 012039
IOP Publishing
doi1010881757-899X5301012039
7
Figure 2 Current shipment preparation process flow chart
PROCESS FLOW CHART ANALYST PAGE
Shipment Preparation process
flow chartKY Liew 1 of 1
10 NVA
20 NVA
30 NVA
40 VA
20 VA
10 VA
15 NVA
5 NVA
45 VA
15 VA
5 VA
0 VA
Min 215
Hour 358
VANVA
Activity
12) Waiting for shipment
3) Verify lot numbers number of cartons and quantities
(Kpcs) in the finished goods despatch note
4) Look for physical cartons of product in the identified
storage location
5) Gether the relevant cartons of product and place it
on the wooden pallet
6) Transfer the wooden pallet of cartons in front the
wooden crate
7) Record the lot number number cartons and
quantities (Kpcs) into the shipment traceability form by
1st storekeeper
8) Verify the shipment traceability form record against
physical cartons of product by 2nd storekeeper
9) Fill the cartons of product into the wooden crate
10) Close the wooden crate (hammer and nail) while
completed fill in process and stick identification label
11) Transfer the wooden crate to the awaiting shipment
area
Details of method
1) Verify quantity requested in shipment advice
2) Check against stock card quantities and FIFO then
record information into the shipment advice
Time
Spend
(min)
(Current
State)
Op
era
tio
n
Mo
vem
en
t
Insp
ectio
n
Dela
y
Sto
rag
e
ICRAIEM 2018
IOP Conf Series Materials Science and Engineering 530 (2019) 012039
IOP Publishing
doi1010881757-899X5301012039
8
Long shipment
preparation time
MACHINE
MATERIAL
MAN
METHOD
Inventory unorganized
Inadequate data recording
Lack of visibility
Not compliance with FIFO rule
Figure 3 Cause and effect diagram of long shipment preparation time
Several countermeasures are developed in corresponding to the root causes defined previously As
aforementioned the key concepts to drive the development are 5S and visual management They are
shown in Table 2
Table 2 Countermeasure development
Root Cause Description 5S
Tools
Visual
Management
Tools
Countermeasure
Inventory
Unorganized
The fresh
product lots
and the old
product lots
were placed
together at the
store area
without status
indicator
Seiri
Seiton
Seiso
Yellow
outline Redesign the
finished goods
store layout
Re-layout the
products location
in the finished
goods store
controlling the left
over product from
the previous years
Incompliance
to FIFO rule
No clear
indication of
the product
lots received
from the
upstream
(selection and
packing)
Seiketsu
Shitsuke
Red sticker Indicating the
product lots with
red sticker written
STORE DATE
after completed
packing process
Lack of
visibility
Product lots
placed at the
storage area
without clear
information of
each carton
product
Seiketsu
Shitsuke
Stock list Prepare a store list
for each location to
indicate the details
like lot number
and number of
carton
Inadequate
data recording
Use inefficient
method to data
collection and
storage cause
Seiri
Seiton
Seiso
Excel
spreadsheet Convert the
hardcopy of
finished goods
despatch note into
ICRAIEM 2018
IOP Conf Series Materials Science and Engineering 530 (2019) 012039
IOP Publishing
doi1010881757-899X5301012039
9
redundant
work and can
provide
information
effectively
softcopy of Excel
spreadsheet The
softcopy contents
all information
required for
shipment
preparation which
include product
code lot number
quantity net
weight production
date and location
33 Do stage
331 Implementing countermeasure for lack of visibility The existing finished goods store was re-laid
out as shown in Figure 4 The storage column was designed according to the size of the pallet (4ft (L)
x 15ft (W)) and ten pallets of product lots can be placed in each storage column The column was
identified by a location indicator with alphabet in ascending order from A to Z and associate with
customer name A stock list displayer (made of clear folder and metal plate) was installed in front of the
storage column to keep the stock list The information in the stock list includes customer name product
code lot number number of carton and quantity in kilo-piece (kpcs) The storekeeper could refer to the
stock list at ease to find the location of the product lots to be retrieved
Figure 4 Improved layout of finished goods store
STORAGE
AREA
Awaiting QA Buy off area
Location
Indicator
4 Columns
10 pallets
A
B Customer 2
7 Columns
10 pallets
1 Columns
10 pallets
1 Column
10 pallets
CRATING
AREA
RECEIVING
AREA
TO AWAITING
SHIPMENT
AREA
Customer 1
ICRAIEM 2018
IOP Conf Series Materials Science and Engineering 530 (2019) 012039
IOP Publishing
doi1010881757-899X5301012039
10
332 Implementing countermeasure for unorganized inventory unorganized As aforementioned
inventory was now to be arranged on predetermined columns Furthermore each pallet of products
would carry an individual stock list holding the information about the product lots and the assigned
storage column Clear directive was given to the storekeeper to abide to the new layout and inventory
storing arrangement
333 Implementing countermeasure for incompliance to FIFO rule The product lot was labelled with a
red sticker written with store date after completed packing process to facilitate storekeeper to comply
with FIFO
Figure 5 Store Date sticker on a carton
334 Implementing countermeasure for inadequate inventory data recording Excel spreadsheet (Figure
6) replaced the manual recording of finished goods in hardcopy despatch note The spreadsheet contains
the information of products lot numbers quantities net weights production date and location The
spreadsheet search function aids storekeeper to identify product lot location
Figure 6 Excel Spreadsheet of finished goods despatch note
ICRAIEM 2018
IOP Conf Series Materials Science and Engineering 530 (2019) 012039
IOP Publishing
doi1010881757-899X5301012039
11
34 Check phase
341 On job training On-job training (OJT) was introduced to the finished goods store personnel It
was done when the project manager accompanied the store personnel to carry out the improvement
activities Any concern raised during implementation and training would be resolved immediately if
possible This motivated store personnel and built trust and hence provided the impetus for future
improvement
35 Act phase
After implementing the countermeasures the time spent for shipment preparation reduced to 183 hours
per wooden crate Also activities were reduced to eight from the previous twelve Data entry process
was shrunk to 2 hours No further modification is required as the system has been running smoothly as
designed over the next two months
Figure 7 Future state shipment preparation process flow chart
40 Conclusion and future work
Through the project the shipment preparation process was significantly improved by using the
developed framework This provided sufficient time for storekeeper to carry out stock-taking daily The
workload of the store clerk was also streamlined by the removal of the work redundancy in recording
PDCA ensures systematic running of the project Two primary tools deployed in the framework are 5S
and visual management Evidently 5S allows system inefficiencies to be categorized and addressed
separately As the shipment preparation process is manual the installation of visual management
provides instant vital information in task execution This also stabilises the process when the variability
was reduced The framework also promotes human touch and team spirit as problem solving was
PROCESS FLOW CHART ANALYST PAGE
Shipment Preparation process
flow chartKY Liew 1 of 1
30
10
10
5
45
5
5
0
Min 110
Hour 183
Sto
rage
Time
Spend
(min)
(Future
State)
3) Gether the relevant cartons of product and place it
on the wooden plate
4) Transfer the wooden pallet of cartons in front the
wooden crate
2) Look for physical cartons of product in the identified
storage location
Details of method
1) Retrive data from the Excel finished goods despatch
note and generate shipment traceability form with lot
number number of cartons and quantity (kpcs) based
on shipment advice request
Ope
ratio
n
Mov
emen
t
Insp
ectio
n
5) Fill the cartons of product into the wooden crate
6) Close the wooden crate (Nail gun) while completed
fill in process and stick identification label
7) Transfer the wooden crate to the awaiting shipment
area
8) Waiting for shipment
Del
ay
ICRAIEM 2018
IOP Conf Series Materials Science and Engineering 530 (2019) 012039
IOP Publishing
doi1010881757-899X5301012039
12
demonstrated as a shared effort The future improvement of task is using barcode system to manage the
flow of the product lots in the finished goods store
Acknowledgement
This work was supported by Research University Grant (RUI) Universiti Sains Malaysia [grant number
8014069]
References
[1] Lieberman M B and Demeester L 1999 Inventory reduction and Productivity growth Linkages
in the Japanese automotive industry Management Science Vol 45 No 4
[2] Ziukov S 2015 A literature review on models of inventory management under uncertainty ISSN
2029-8234 Verslo Sistemos ir Ekonomika Business System and Economics Vol 5 (1)
[3] Radasanu A C 2016 Inventory management service level and safety stock Journal of Public
Administration Finance and Law
[4] Eisenhardt K M 1989 Building theories from case study research Academy of Management 710
Review 14 (4) 532ndash550
[5] Yin R K 1994 Case study research design and methods 2nd ed Thousand Oaks CA Sage
Publications
[6] Cavaye A L M 1996 Case study research a multi-faceted research approach for IS Information
Systems Journal 6 (3) 227ndash242
[7] Womack J and Jones D 1996 Lean Thinking Banish Waste and Create Wealth in your
Corporation Simon $ Schuster New York NY
[8] Agrahari R S Dangle P A and Chandratre K V 2015 Implementation of 5S methodology in the
small scale industry A case study International Journal of Scientific amp Technology
Research 4(4) pp 180-187
[9] Shah R and Ward P T 2007 ldquoDefining and developing measures of lean productionrdquo Journal of
Operations Management Vol 25 No 4 pp 785-805
[10] Vienazindiene M and Ciarniene R 2013 Lean Manufacturing Implementation And Progress
Measurement ISSN 2029-9338 Economic and Management2013 18 (2)
[11] Rathje M S Boyle T A and Deflorin P 2009 Lean take two reflections from the second attempt at
Lean implementation Business Horizons 52 79-88
[12] Hines P and Rich N 1997 The Seven Value Stream Mapping Tools International Journal of
Operations amp Production Management 17 46-64
[13] Che Ani M N and Chin J F 2016 Self-reinforcing mechanisms for cellularisation a longitudinal
case study International Journal of Production Research 54(3) 696-711
[14] Bayo-Moriones A et al2010 5S use in manufacturing plants contextual factors and impact on
operating performance International Journal of Quality amp Reliability Management Vol 27
Iss2 pp 217-230
[15] Ghodrati A and Zulkifli N 2013 The impact of 5S implementation on industrial organizationsrsquo
performance ISSN 2319-801X International Journal of Business and Management
Invention Vol 2 Issue 3 pp 43-49
[16] Purohit S R and Shantha V 2015 Implementation of 5S methodology in a manufacturing industry
ISSN 2229-5518 International Journal of Scientific amp Engineering Research Vol 6 Issue 8
[17] Kobarne A R 2016 Implementation of lsquo5Srsquo technique in a manufacturing organization A case
study ISSN 2278-8808 Scholarly Research Journal For Interdisciplinary Studies Vol 323
Mar-April 2016
[18] Chong M Y Chin J F and Hamzah H S 2012 Transfer of total productive maintenance to supply
chain Total Quality Management amp Business Excellence 23 467-488
[19] Tan P Y Chin J F Prakash J and Loh W P 2012 Reducing Electronic Component Losses in Lean
Electronics Assembly with Six Sigma Approach International Journal of Lean Six Sigma
ICRAIEM 2018
IOP Conf Series Materials Science and Engineering 530 (2019) 012039
IOP Publishing
doi1010881757-899X5301012039
13
Vol 3 Iss 3 pp 206 ndash 230
[20] Chong M Y Chin J F Loh W P 2013 Lean incipience spiral model for small and medium
enterprises International Journal of Industrial Engineering 20
[21] Vipulkumar C P and Hemant T 2014 A case study 5s implementation in ceramic manufacturing
company ISSN 2277-5056 Bonfring International Journal of Industrial Engineering and
Management Science Vol 4 No 3 pp 132-138
[22] Sidhu B S Kumar V and Bajaj A 2015 The ldquo5Srdquo Strategy by using PDCA Cycle for Continuous
Improvement of the Manufacturing Processes in Agriculture Industry International Journal
of Research in Industrial Engineering Vol 2 pp 10-23
[23] Liff Stewart and Pamela A P 2004 Seeing is believing how the new art of visual management
can boost performance throughout your organization AMACOM Div American Mgmt Assn
[24] Tezel B A Koskela L J and Tzortzopoulos P 2009 The functions of visual management
International Research Symposium Salford UK
[25] Goh W J Chin J F Kamaruddin S Muhammad N A 2014 A Visual Board to Facilitate Production
Flow Regulation at Sequential Processes International Journal of Industrial Engineering
and Management 1-9
[26] Brien M O 2014 6S and visual management LBSPartners Nexus innovation centre Tierney
building University of Limerick Limerick Ireland
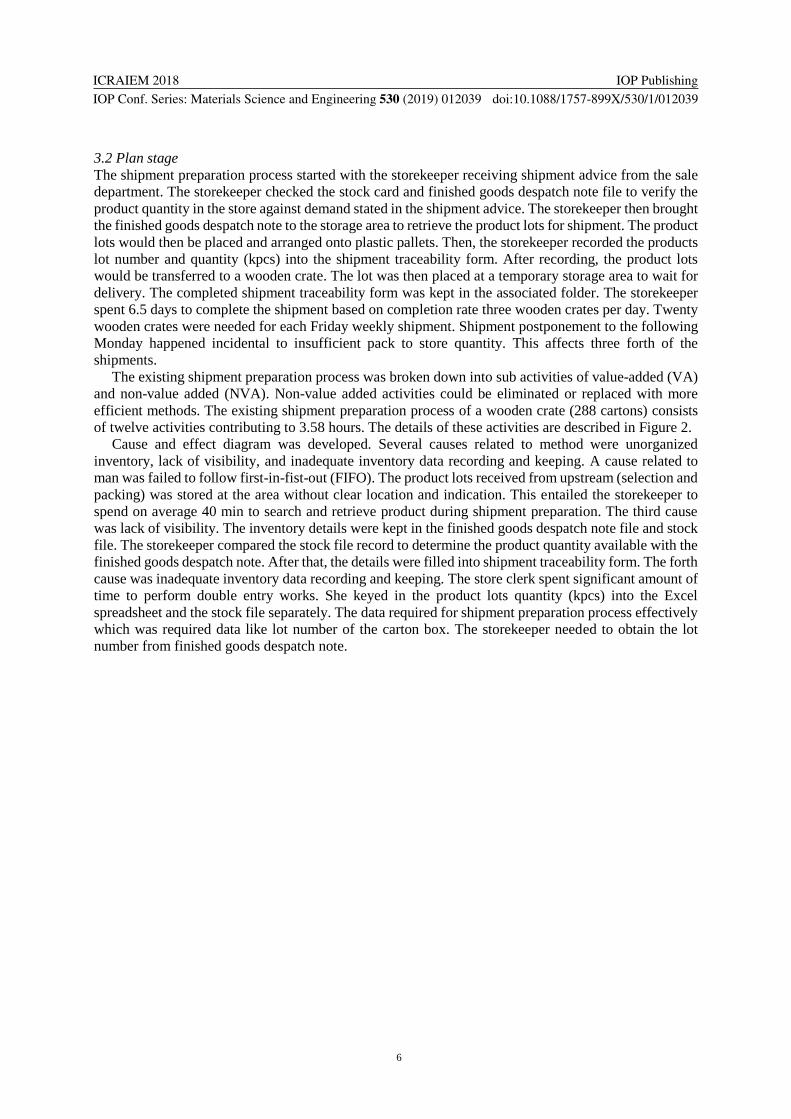
ICRAIEM 2018
IOP Conf Series Materials Science and Engineering 530 (2019) 012039
IOP Publishing
doi1010881757-899X5301012039
10
332 Implementing countermeasure for unorganized inventory unorganized As aforementioned
inventory was now to be arranged on predetermined columns Furthermore each pallet of products
would carry an individual stock list holding the information about the product lots and the assigned
storage column Clear directive was given to the storekeeper to abide to the new layout and inventory
storing arrangement
333 Implementing countermeasure for incompliance to FIFO rule The product lot was labelled with a
red sticker written with store date after completed packing process to facilitate storekeeper to comply
with FIFO
Figure 5 Store Date sticker on a carton
334 Implementing countermeasure for inadequate inventory data recording Excel spreadsheet (Figure
6) replaced the manual recording of finished goods in hardcopy despatch note The spreadsheet contains
the information of products lot numbers quantities net weights production date and location The
spreadsheet search function aids storekeeper to identify product lot location
Figure 6 Excel Spreadsheet of finished goods despatch note
ICRAIEM 2018
IOP Conf Series Materials Science and Engineering 530 (2019) 012039
IOP Publishing
doi1010881757-899X5301012039
11
34 Check phase
341 On job training On-job training (OJT) was introduced to the finished goods store personnel It
was done when the project manager accompanied the store personnel to carry out the improvement
activities Any concern raised during implementation and training would be resolved immediately if
possible This motivated store personnel and built trust and hence provided the impetus for future
improvement
35 Act phase
After implementing the countermeasures the time spent for shipment preparation reduced to 183 hours
per wooden crate Also activities were reduced to eight from the previous twelve Data entry process
was shrunk to 2 hours No further modification is required as the system has been running smoothly as
designed over the next two months
Figure 7 Future state shipment preparation process flow chart
40 Conclusion and future work
Through the project the shipment preparation process was significantly improved by using the
developed framework This provided sufficient time for storekeeper to carry out stock-taking daily The
workload of the store clerk was also streamlined by the removal of the work redundancy in recording
PDCA ensures systematic running of the project Two primary tools deployed in the framework are 5S
and visual management Evidently 5S allows system inefficiencies to be categorized and addressed
separately As the shipment preparation process is manual the installation of visual management
provides instant vital information in task execution This also stabilises the process when the variability
was reduced The framework also promotes human touch and team spirit as problem solving was
PROCESS FLOW CHART ANALYST PAGE
Shipment Preparation process
flow chartKY Liew 1 of 1
30
10
10
5
45
5
5
0
Min 110
Hour 183
Sto
rage
Time
Spend
(min)
(Future
State)
3) Gether the relevant cartons of product and place it
on the wooden plate
4) Transfer the wooden pallet of cartons in front the
wooden crate
2) Look for physical cartons of product in the identified
storage location
Details of method
1) Retrive data from the Excel finished goods despatch
note and generate shipment traceability form with lot
number number of cartons and quantity (kpcs) based
on shipment advice request
Ope
ratio
n
Mov
emen
t
Insp
ectio
n
5) Fill the cartons of product into the wooden crate
6) Close the wooden crate (Nail gun) while completed
fill in process and stick identification label
7) Transfer the wooden crate to the awaiting shipment
area
8) Waiting for shipment
Del
ay
ICRAIEM 2018
IOP Conf Series Materials Science and Engineering 530 (2019) 012039
IOP Publishing
doi1010881757-899X5301012039
12
demonstrated as a shared effort The future improvement of task is using barcode system to manage the
flow of the product lots in the finished goods store
Acknowledgement
This work was supported by Research University Grant (RUI) Universiti Sains Malaysia [grant number
8014069]
References
[1] Lieberman M B and Demeester L 1999 Inventory reduction and Productivity growth Linkages
in the Japanese automotive industry Management Science Vol 45 No 4
[2] Ziukov S 2015 A literature review on models of inventory management under uncertainty ISSN
2029-8234 Verslo Sistemos ir Ekonomika Business System and Economics Vol 5 (1)
[3] Radasanu A C 2016 Inventory management service level and safety stock Journal of Public
Administration Finance and Law
[4] Eisenhardt K M 1989 Building theories from case study research Academy of Management 710
Review 14 (4) 532ndash550
[5] Yin R K 1994 Case study research design and methods 2nd ed Thousand Oaks CA Sage
Publications
[6] Cavaye A L M 1996 Case study research a multi-faceted research approach for IS Information
Systems Journal 6 (3) 227ndash242
[7] Womack J and Jones D 1996 Lean Thinking Banish Waste and Create Wealth in your
Corporation Simon $ Schuster New York NY
[8] Agrahari R S Dangle P A and Chandratre K V 2015 Implementation of 5S methodology in the
small scale industry A case study International Journal of Scientific amp Technology
Research 4(4) pp 180-187
[9] Shah R and Ward P T 2007 ldquoDefining and developing measures of lean productionrdquo Journal of
Operations Management Vol 25 No 4 pp 785-805
[10] Vienazindiene M and Ciarniene R 2013 Lean Manufacturing Implementation And Progress
Measurement ISSN 2029-9338 Economic and Management2013 18 (2)
[11] Rathje M S Boyle T A and Deflorin P 2009 Lean take two reflections from the second attempt at
Lean implementation Business Horizons 52 79-88
[12] Hines P and Rich N 1997 The Seven Value Stream Mapping Tools International Journal of
Operations amp Production Management 17 46-64
[13] Che Ani M N and Chin J F 2016 Self-reinforcing mechanisms for cellularisation a longitudinal
case study International Journal of Production Research 54(3) 696-711
[14] Bayo-Moriones A et al2010 5S use in manufacturing plants contextual factors and impact on
operating performance International Journal of Quality amp Reliability Management Vol 27
Iss2 pp 217-230
[15] Ghodrati A and Zulkifli N 2013 The impact of 5S implementation on industrial organizationsrsquo
performance ISSN 2319-801X International Journal of Business and Management
Invention Vol 2 Issue 3 pp 43-49
[16] Purohit S R and Shantha V 2015 Implementation of 5S methodology in a manufacturing industry
ISSN 2229-5518 International Journal of Scientific amp Engineering Research Vol 6 Issue 8
[17] Kobarne A R 2016 Implementation of lsquo5Srsquo technique in a manufacturing organization A case
study ISSN 2278-8808 Scholarly Research Journal For Interdisciplinary Studies Vol 323
Mar-April 2016
[18] Chong M Y Chin J F and Hamzah H S 2012 Transfer of total productive maintenance to supply
chain Total Quality Management amp Business Excellence 23 467-488
[19] Tan P Y Chin J F Prakash J and Loh W P 2012 Reducing Electronic Component Losses in Lean
Electronics Assembly with Six Sigma Approach International Journal of Lean Six Sigma
ICRAIEM 2018
IOP Conf Series Materials Science and Engineering 530 (2019) 012039
IOP Publishing
doi1010881757-899X5301012039
13
Vol 3 Iss 3 pp 206 ndash 230
[20] Chong M Y Chin J F Loh W P 2013 Lean incipience spiral model for small and medium
enterprises International Journal of Industrial Engineering 20
[21] Vipulkumar C P and Hemant T 2014 A case study 5s implementation in ceramic manufacturing
company ISSN 2277-5056 Bonfring International Journal of Industrial Engineering and
Management Science Vol 4 No 3 pp 132-138
[22] Sidhu B S Kumar V and Bajaj A 2015 The ldquo5Srdquo Strategy by using PDCA Cycle for Continuous
Improvement of the Manufacturing Processes in Agriculture Industry International Journal
of Research in Industrial Engineering Vol 2 pp 10-23
[23] Liff Stewart and Pamela A P 2004 Seeing is believing how the new art of visual management
can boost performance throughout your organization AMACOM Div American Mgmt Assn
[24] Tezel B A Koskela L J and Tzortzopoulos P 2009 The functions of visual management
International Research Symposium Salford UK
[25] Goh W J Chin J F Kamaruddin S Muhammad N A 2014 A Visual Board to Facilitate Production
Flow Regulation at Sequential Processes International Journal of Industrial Engineering
and Management 1-9
[26] Brien M O 2014 6S and visual management LBSPartners Nexus innovation centre Tierney
building University of Limerick Limerick Ireland

ICRAIEM 2018
IOP Conf Series Materials Science and Engineering 530 (2019) 012039
IOP Publishing
doi1010881757-899X5301012039
12
demonstrated as a shared effort The future improvement of task is using barcode system to manage the
flow of the product lots in the finished goods store
Acknowledgement
This work was supported by Research University Grant (RUI) Universiti Sains Malaysia [grant number
8014069]
References
[1] Lieberman M B and Demeester L 1999 Inventory reduction and Productivity growth Linkages
in the Japanese automotive industry Management Science Vol 45 No 4
[2] Ziukov S 2015 A literature review on models of inventory management under uncertainty ISSN
2029-8234 Verslo Sistemos ir Ekonomika Business System and Economics Vol 5 (1)
[3] Radasanu A C 2016 Inventory management service level and safety stock Journal of Public
Administration Finance and Law
[4] Eisenhardt K M 1989 Building theories from case study research Academy of Management 710
Review 14 (4) 532ndash550
[5] Yin R K 1994 Case study research design and methods 2nd ed Thousand Oaks CA Sage
Publications
[6] Cavaye A L M 1996 Case study research a multi-faceted research approach for IS Information
Systems Journal 6 (3) 227ndash242
[7] Womack J and Jones D 1996 Lean Thinking Banish Waste and Create Wealth in your
Corporation Simon $ Schuster New York NY
[8] Agrahari R S Dangle P A and Chandratre K V 2015 Implementation of 5S methodology in the
small scale industry A case study International Journal of Scientific amp Technology
Research 4(4) pp 180-187
[9] Shah R and Ward P T 2007 ldquoDefining and developing measures of lean productionrdquo Journal of
Operations Management Vol 25 No 4 pp 785-805
[10] Vienazindiene M and Ciarniene R 2013 Lean Manufacturing Implementation And Progress
Measurement ISSN 2029-9338 Economic and Management2013 18 (2)
[11] Rathje M S Boyle T A and Deflorin P 2009 Lean take two reflections from the second attempt at
Lean implementation Business Horizons 52 79-88
[12] Hines P and Rich N 1997 The Seven Value Stream Mapping Tools International Journal of
Operations amp Production Management 17 46-64
[13] Che Ani M N and Chin J F 2016 Self-reinforcing mechanisms for cellularisation a longitudinal
case study International Journal of Production Research 54(3) 696-711
[14] Bayo-Moriones A et al2010 5S use in manufacturing plants contextual factors and impact on
operating performance International Journal of Quality amp Reliability Management Vol 27
Iss2 pp 217-230
[15] Ghodrati A and Zulkifli N 2013 The impact of 5S implementation on industrial organizationsrsquo
performance ISSN 2319-801X International Journal of Business and Management
Invention Vol 2 Issue 3 pp 43-49
[16] Purohit S R and Shantha V 2015 Implementation of 5S methodology in a manufacturing industry
ISSN 2229-5518 International Journal of Scientific amp Engineering Research Vol 6 Issue 8
[17] Kobarne A R 2016 Implementation of lsquo5Srsquo technique in a manufacturing organization A case
study ISSN 2278-8808 Scholarly Research Journal For Interdisciplinary Studies Vol 323
Mar-April 2016
[18] Chong M Y Chin J F and Hamzah H S 2012 Transfer of total productive maintenance to supply
chain Total Quality Management amp Business Excellence 23 467-488
[19] Tan P Y Chin J F Prakash J and Loh W P 2012 Reducing Electronic Component Losses in Lean
Electronics Assembly with Six Sigma Approach International Journal of Lean Six Sigma
ICRAIEM 2018
IOP Conf Series Materials Science and Engineering 530 (2019) 012039
IOP Publishing
doi1010881757-899X5301012039
13
Vol 3 Iss 3 pp 206 ndash 230
[20] Chong M Y Chin J F Loh W P 2013 Lean incipience spiral model for small and medium
enterprises International Journal of Industrial Engineering 20
[21] Vipulkumar C P and Hemant T 2014 A case study 5s implementation in ceramic manufacturing
company ISSN 2277-5056 Bonfring International Journal of Industrial Engineering and
Management Science Vol 4 No 3 pp 132-138
[22] Sidhu B S Kumar V and Bajaj A 2015 The ldquo5Srdquo Strategy by using PDCA Cycle for Continuous
Improvement of the Manufacturing Processes in Agriculture Industry International Journal
of Research in Industrial Engineering Vol 2 pp 10-23
[23] Liff Stewart and Pamela A P 2004 Seeing is believing how the new art of visual management
can boost performance throughout your organization AMACOM Div American Mgmt Assn
[24] Tezel B A Koskela L J and Tzortzopoulos P 2009 The functions of visual management
International Research Symposium Salford UK
[25] Goh W J Chin J F Kamaruddin S Muhammad N A 2014 A Visual Board to Facilitate Production
Flow Regulation at Sequential Processes International Journal of Industrial Engineering
and Management 1-9
[26] Brien M O 2014 6S and visual management LBSPartners Nexus innovation centre Tierney
building University of Limerick Limerick Ireland