paper 1308-2014 automating the creation of complex …paper 1308-2014 1 automating the creation of...
TRANSCRIPT

Paper 1308-2014
1
Automating the Creation of Complex PowerPoints
Julie VanBuskirk, MPH Baylor Health Care System
Abstract:
The creation of production reports for our organization has historically been a labor-intensive
process. Each month our team produced around 650 SAS® graphs and 30 tables which were then copied
and pasted into 16 custom PowerPoint presentations, each between 20 and 30 pages. To reduce the
number of manual steps, we converted to using stored processes and the SAS® Add-In for Microsoft
Office to run SAS® stored processes. SAS stored processes generate the graphs and tables while SAS
Add-In for Microsoft Office refreshes the document with updated graphs already sized and positioned
on the slides just as we need them. With this new process we are realizing the dream of reducing the
amount of time spent on a single monthly production process.
This paper will discuss the steps to creating a complex PowerPoint presentation that is simply
refreshed rather than created new each month. I will discuss converting the original code to stored
processes using SAS® Enterprise Guide®, options and style statements that are required to continue to
use a custom style sheet, and how to create the PowerPoint presentation with an assortment of output
types including horizontal bar charts, control charts, and tables. I will also discuss some of the challenges
and solutions specific to stored process and SAS Add-In for Microsoft Office that we encountered during
this conversion process.
The Basic Stored Process
The first step to creating a refreshable PowerPoint is to start with working SAS code. To work through
this process, I have created a simple piece of code that modifies a SAS help dataset for use in graphics
code that creates a multi series run chart. This code has been provided in the appendix to allow you to
work through the example. Start by placing that code in a program within Enterprise Guide.
Select File -> New -> Stored process to create the stored process. This can also
be done from the actual program in SAS Enterprise Guide under the create
button. However, creating a stored process directly from code creates a link
between the program and stored process. Once those pieces are linked each
time you make a change you will be prompted to select the server or local code
and asked if changes should be copied from
one to the other.
Now you will see the ‘create stored process’ interface. The first page
allows you to define the name and location of your stored process as
well as any description, keywords, or responsibilities that need to be
associated with that code. I will rename my stored process to
Test_for_SCSUG and leave the location as /My Folder. Then click Next.

Paper 1308-2014
2
The second page opens a blank space for the SAS code to be placed.
There are several choices to get your code into the stored process
from simple copy/paste to using the stored process buttons. We will
click the button ‘replace with code from’ and select ‘this project’.
This will bring up a selection box populated with all of the items that
you have open within that SAS Enterprise Guide project. Select the
program containing the test code that you copied in and click Open.
This automatically pulls all of that code into the stored process code
space.
The next step is identifying the method of stored process storage
and where to execute the stored process. The choice of server type
is depends on a number of factors. The stored process server uses a
shared server ID to run the stored processes and will allow for
multiple users. This allows for faster run times, however since this
ID is shared by all users security could be an issue. On the other
hand, the workspace server uses the individual client identity which
restricts access based on individual permissions. Choosing this
option will reduce any potential security risks, but will increase the
startup time since it opens a new server process. For this exercise,
we will choose the stored process server only. The final selection is a location and means of execution
for the stored process. Since this is a test process, I will select allow execution on selected application
server only and store source code in metadata. Select store source code on application server and
define a repository for that code if you would like to create a backup file containing the stored process
code. Finally, leave both stream and package options checked and SAS will determine the best method
to return results. Stream allows SAS to return the results as they are generated, while package tells SAS
to wait until all results are complete before returning them.
For this example we will skip pages 4 and 5 of the stored process
wizard, there is no need for prompting or input data sources with
this code. The final page provides a summary of the stored process
you created; there is a check box to show the full SAS code for
review. Click on the box to run stored process when finished and
the finish to complete the process.

Paper 1308-2014
3
Once the stored process runs the following graph is created (your
graph may appear differently if you have SAS Enterprise Guide set
up with a different default style). Now that I have working output I
can work on updating the style to match our corporate image.
Using a custom style with Stored process
The default style that stored process creates is functional, but not pretty. At our organization,
we have developed a style template to create a unified style for all reports. To use this custom template
with graphics code in a stored process several statements must be added.
Let’s start with the %STPBEGIN and %STPEND macros. These are automatically added to your stored
process by Enterprise Guide and sandwich your code unless you specifically call them within the code.
The %STPBEGIN macro begins opens ODS for reporting and %STPEND closes it. These macros use a
standard set of reserved macro variables to define the stored process options. To update options
associated with the stored process, these reserved macro values have to be overwritten before ODS is
initiated. Begin by wrapping the entire original code with the %STPBEGIN and %STPEND macro calls,
next include the %GLOBAL statement at the top of the stored process with the reserved macro variables
that need to be changed. Then a %LET statement must be used to reset the style name to the style, and
a libname and ODS PATH statement must be used to provide direction to the location of the style sheet.
/* --- Reset reserved macro variables --- */
%Global _odsstyle ;
/*Reset the macro var to my style sheet*/
%Let _odsstyle = BestCareFY12;
/*Define where to find the style template*/
libname test "\\my template storage location";
ods path(prepend) test.template(read);
%STPBEGIN;
Original code from the stored process.
%STPEND;
Most stored process examples use the _stylesheet= option and a CSS style in order to
create output with a customized style. This will work for some output, however for the
graph elements to be passed into the stored process it must be from a SAS® style
template. When creating a CSS sheet the graph selectors are not passed from template
into CSS.

Paper 1308-2014
4
Now that the customized style is replacing the default the
output is created based on my custom style definitions.
This additional step creates a product that is more in line
with our corporate style and will look great in our
PowerPoint reports.
Creating the Customized PowerPoint
Before creating your PowerPoint, save the stored process is in its final home within the
SAS folder structure. Currently there is no way to update the path from the SAS Add-In
for Microsoft Office to change the location of the stored process. Therefore if you create
a PowerPoint and then decide to change the stored process location you will have to
recreate the PowerPoint.
Now that the stored process has been created
to produce the desired output, we can begin creating
a customized PowerPoint. To open new content into
the PowerPoint, open the SAS tab on ribbon and click
the reports button. This opens a navigation window
which allows you to search through the SAS folders to
the stored process of interest. Select the stored
process and it opens into first open layout space in
the PowerPoint. If there is no space on the current
slide, the SAS Add-In for Microsoft Office will
automatically open the output to a new slide.
To place multiple pieces of output on a single slide, you can either select a slide layout that
meets your needs through the home tab on the ribbon or you can copy and paste output onto the slide
you want. If you copy and paste, make sure you paste using the ‘keep destination theme’ option. This
will preserve the link between the piece of output and the SAS toolbar and ensure the output remains
refreshable. Once the output has been positioned correctly it will keep that positioning for any future
refreshes. Even if the original output had to be resized or pieces of output had to be deleted the SAS
Add-In for Microsoft Office will respect those changes during later refreshes.

Paper 1308-2014
5
Updating the content for monthly production is now an easy process with the SAS Add-In for
Microsoft Office. There are several methods that you can use to refresh content. To update a single
piece of output, click on the piece of interest, then
select either refresh or modify on the SAS tab of the
ribbon. Refresh will update the output as is with no
prompt changes, modify will bring up the prompt
screen and allow you to change the stored process
prompts before running. Updating all content at once
is also simple, select manage content and
select all stored processes within the
presentation and hit refresh.
Adding customized tables to PowerPoint
The biggest challenge that we have faced in creating
customized reports in PowerPoint has been finding a method
to automate printing custom tables in our reports. All of our
reporting tables look similar to the one on the right, good
performance is not highlighted at all, moderate performance
has a light background change, and poor performance has both
a background color and cell borders to focus attention. Once
the table code was converted into stored process we could
begin testing it in PowerPoint. Table 2 is the result the first time
the table was created using the SAS Add-In for Microsoft Office,
this image is created using the default PowerPoint style rather
than the SAS style. To convert this back to the custom style, first
select the table, then select properties from the SAS toolbar, go
to the appearance tab and select ‘always apply the SAS style to
the results’ and then select the custom style from the list.
In order to see the custom style in the list of available SAS styles it must be added as an
external style in Enterprise Guide. To do this, first run the style template and save it to
the desired location. Then in Enterprise Guide select Tools-> Style Manager->Add… Then
enter the style name and location as a new external style and hit ok. Now the custom
style will be available both in SAS Enterprise Guide and the SAS Add-In for Microsoft
Office.
Table 2: PowerPoint default
Update a single piece of output
using refresh or modify.
Table 1: Original Design
Update all output at once
using manage content.

Paper 1308-2014
6
Now that the style properties are updated,
refreshing will update the image to incorporate the
changes. Table 3 is the updated image that uses the
custom defined style options. However, there is still
something missing from this image. Not only are the big red boxes
gone, but all of the cell borders are completely gone. For our
reports, this is a big problem, and currently there is no way around it in PowerPoint. The cell borders
were turned off by default in the product, and tech support is currently working on a fix for this
issue. (YAY!!!)
To circumvent this issue we tried
several options, the first was to use
in-line styles to add a red dot to those
low performing facilities. Table 4 is
the result of adding a red dot when
the table is output to html, however
when the same table is run using the
listing destination it appears like Table 4a.
Unfortunately for us, the default output destination for PowerPoint is SAS Report XML or .SRX which
is very similar to listing output. So the easy method of updating traffic lighting failed, and we are
very committed to staying far away from traditional
traffic lighting.
So since this was a PowerPoint issue, the first
thought was to open the output into Excel and then
insert it as an object into PowerPoint. Table 5
represents the product from opening the output with the correct
style into Excel. It is definitely the closest to the original,
however the big red box is not complete for any of the cells.
The output destination for this stored process has been
changed to HTML, but by default all output is brought into
the SAS Add-In for Microsoft Office using the SAS report
destination. To update this to HTML instead, on the SAS
toolbar go to tools -> options -> results-> and update the
format to HTML. This change requires a restart of Excel to
take effect.
Table 3: Closer…but no cell borders.
Table 4: HTML output. Table 4a: .SRX output
Table 5: Original Excel output.

Paper 1308-2014
7
Once that was done Table 5a was returned as output from the stored process. This output was
the closest that we could get to the original. The final problem is the PROC REPORT border
overwriting the outer cell borders. Currently we have no fix for this since the outer border has been
turned off for PROC REPORT output. With no fix, this goes on the long term list and until the SAS fix
comes out we continue to manually insert tables into all reports.
Contact Information:
Follow the QR code to my blog to find more information about this topic, or
email me at [email protected]
SAS and all other SAS Institute Inc. product or service names are registered trademarks or trademarks of SAS Institute Inc. in the USA and other countries. ® indicates USA registration. Other brand and product names are trademarks of their respective companies.
References:
Watts, Perry. Derby, Nate. Stakana Analytics, Elkins Park, PA; Using SAS® GTL to Visualize Your
Data When There is Too Much of it to Visualize; SAS® Global Forum 2012 (Paper 262-2012).
SAS® Institute Inc. 2009. SAS® 9.2 Stored Processes: Developer’s Guide. Cary, NC: SAS® Institute
Inc.
SAS® Institute Inc. 2012. Creating Business Intelligence for your Organization 1: Essentials Course
Notes. Cary, NC: SAS® Institute Inc.
Cynthia L. Zender. SAS® Institute Inc., Cary, NC; ODS Options and SAS® Stored Processes; SAS®
Global Forum 2007. (Paper 021-2007)
Table 5a: Final Excel output

Paper 1308-2014
8
Appendix 1: Template Code
/*Appendix 1: Template Code*/
libname b_style "\\bhcs.pvt\dfsusers\Home\SAS Paper\TemplateTesting";
ods path(prepend) b_style.bhcs_styles(update);
proc template;
define style styles.Baylor_core;
parent= styles.Journal;
style GraphFonts /
'GraphTitleFont'=("Arial",12pt,bold)
'GraphTitle1Font'=("Arial",10pt)
'GraphLabelFont'=("Arial",10pt)
'GraphLabel2Font'=("Arial",10pt)
'Graphfootnotefont' = ("Arial", 8pt, extra_light)
'GraphValueFont'=("Arial",10pt)
'GraphDataFont'=("Arial ",8pt)
'GraphUnicodeFont'=("Arial",8pt)
'GraphAnnoFont'=("Arial",10pt);
style colors/
'docbg' = azure
;
style GraphColors /
'gaxis' = blue /*control x,y axis color*/
'gwalls' = cxc2deea
'gdata2' = CX0073CF /* System Data*/
'gdata4' = pink
;
class GraphTitleText /
/*changes the size and color of the graph title*/
font=GraphFonts('GraphTitleFont')
color= Orange
;
class GraphFootnoteText /
/*changes the size and color of the graph footnote*/
font= GraphFonts('GraphFootnoteFont')
color=purple
textalign=left
;

Paper 1308-2014
9
class graphlabeltext / /*changes the font and size of the axis
labels*/
font=GraphFonts('GraphLabelFont')
color=red
;
class graphvaluetext /
/*changes the color and font of data values on the axis*/
font=GraphFonts('GraphValueFont')
color= green /*changes the color of all axis values*/;
class graphbackground /
backgroundcolor= colors ('docbg')
color=colors('docbg')/*outside of graph area (behind x&y
values)background color*/;
class GraphWalls /
linethickness = 1px
linestyle = 1
frameborder = off
contrastcolor = GraphColors('gaxis') /*controls x&y axis color*/
backgroundcolor = GraphColors('gwalls') /*controls background
color of graph*/
/*color = GraphColors('gfloor')*/ /*overwrites background color
if both are used*/
;
class GraphDataDefault / /*controls the marker appearance, must be
within the template (markerattrs)*/
markersize = 9px
markersymbol = "circlefilled" /*Line marker style*/
linethickness = 2 /*controls line thickness*/
linestyle = 4 /*controls pattern of line*/
contrastcolor = GraphColors('gdata2') /*control marker&line
color*/;
class GraphData1 /
markersize = 9px
markersymbol = "diamondfilled" /*Line marker style*/
linethickness = 2 /*controls line thickness*/
linestyle = 1 /*controls pattern of line*/
contrastcolor = GraphColors('gdata4');
end;
run;
proc template;
define statgraph b_style.baylor_RUNCHART ;
dynamic title1 title2
foot1 foot2 foot3
_YAXIS _yaxis2
xvalue yvalue
x2value y2value
y_label x_label;

Paper 1308-2014
10
begingraph /border=false;
entrytitle title1 /textattrs= Graphtitletext(weight = bold);
entrytitle title2 /textattrs= Graphtitletext(weight=normal);
entryfootnote halign= right foot1
halign=left foot2 / textattrs=graphfootnotetext;
entryfootnote halign= left foot3 / textattrs=graphfootnotetext;
layout overlay /
yaxisopts = (label = _YAXIS
display=(ticks tickvalues label line)
labelattrs = graphlabeltext)
xaxisopts= (display =( ticks tickvalues line))
y2axisopts = (label = _yaxis2
display=(ticks tickvalues line label)
labelattrs = graphlabeltext);
seriesplot x= x2value y= y2value /primary=true
connectorder=xvalues display=all
yaxis=y2
lineattrs= GraphDataDefault(pattern=shortdash)
markerattrs= GraphDataDefault ;
seriesplot x= xvalue y=yvalue / primary=false
connectorder=xvalues display=all
yaxis=y
lineattrs= GraphData1
markerattrs=GraphData1;

Paper 1308-2014
11
Appendix 2: Stored Process Code
/* --- Start of code for "Graph Code". --- */
%Global _odsstyle _odsoptions ;
*Process Body;
/*Find the style sheet*/
%Let _odsstyle = styles.baylor_core;
libname b_style
"\\bhdasas02\apps_data\SASResources\Styles\Output\Prod\StyleTemplates"
;
ods path(prepend) b_style.bhcs_styles(update);
/*CREATE DATA WITH A REP_PERIOD_DATE, 2 METRICS FOR REPORTING, AND
METRIC_CODE*/
Proc sql;
create table scsug_test
as select
count as metric_value,
day as rep_period_date,
case
when process = 'Process A' THEN metric_value
else .
end as Metric_1,
case
when process = 'Process B' THEN metric_value
else .
end as Metric_2,
10 as ref1,
5 as ref2
from SAShelp.failure;
quit;
proc sort data= scsug_test;
by rep_period_date descending metric_1 metric_2;
run;
Data scsug_test2;
set scsug_test;
by rep_period_Date descending metric_1 metric_2;
if first.rep_period_date = 1 or last.rep_period_date = 1;
run;
%stpbegin;
Paper 1308-2014
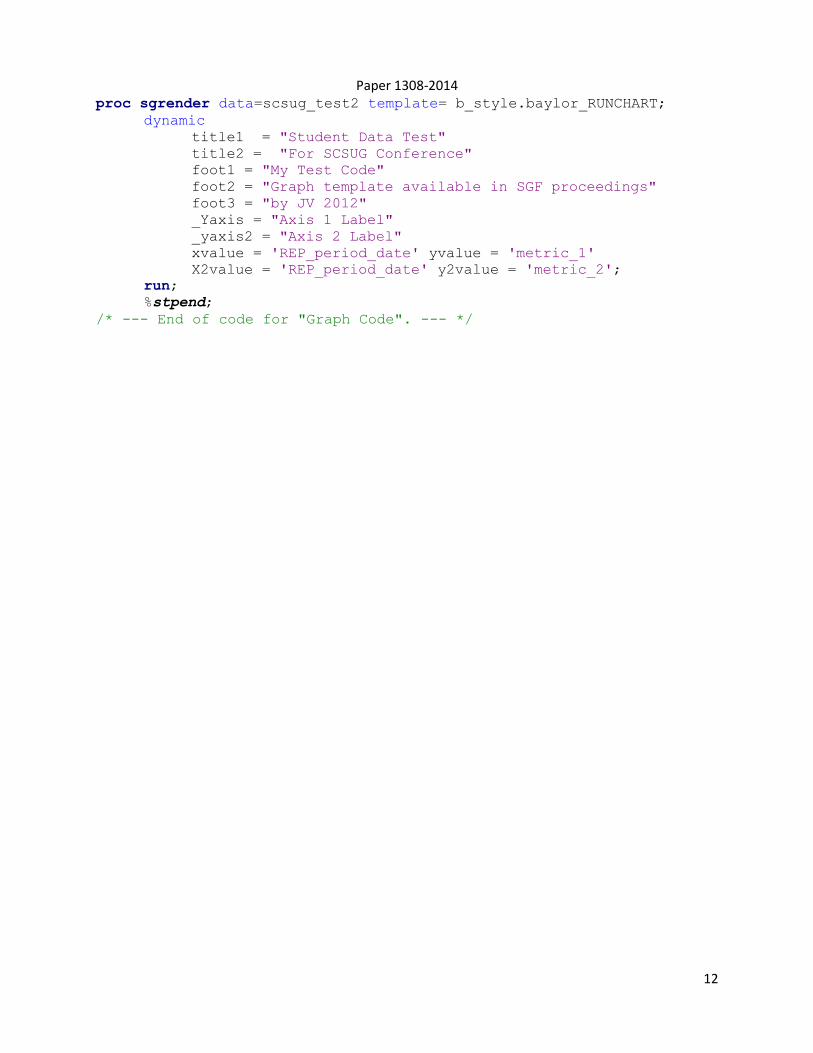
12
proc sgrender data=scsug_test2 template= b_style.baylor_RUNCHART;
dynamic
title1 = "Student Data Test"
title2 = "For SCSUG Conference"
foot1 = "My Test Code"
foot2 = "Graph template available in SGF proceedings"
foot3 = "by JV 2012"
_Yaxis = "Axis 1 Label"
_yaxis2 = "Axis 2 Label"
xvalue = 'REP_period_date' yvalue = 'metric_1'
X2value = 'REP_period_date' y2value = 'metric_2';
run;
%stpend;
/* --- End of code for "Graph Code". --- */