pandemic, unrest, crime, and violence in u.s. cities: 2020
TRANSCRIPT

Pandemic, Unrest, Crime, and Violence in U.S. Cities: 2020 Year-End Update
Richard Rosenfeld
University of Missouri - St. Louis
Thomas Abt Council on Criminal Justice
Ernesto Lopez
University of Missouri - St. Louis
Summary
• This study examines crime rates for ten different offenses in 34 American cities during the calendar year of 2020, with a special emphasis on homicide and other violent crimes. The current study updates previous studies by the authors with additional data through December 2020.
• Homicides, aggravated assaults, and gun assaults rose significantly in 2020. Homicide rates were 30% higher than in 2019, an historic increase representing 1,268 more deaths in the sample of 34 cities than the year before.
• The large size of this increase is deeply troubling, but readers should be aware that absolute rates of homicide rate of remain well below historical highs. In 2020, the homicide rate was 11.4 deaths per 100,000 residents in sample cities; 25 years earlier, in 1995, the rate was 19.4 per 100,000 residents.
• Aggravated assault and gun assault rates in 2020 were 6% and 8% higher, respectively, than in 2019. Robbery rates declined by 9%.
• Domestic violence increased significantly during the early months of the pandemic, but these results should be viewed with caution as year-end rates were comparable to year-end rates in 2019, and findings were based on data from just 12 cities.
• Property and drug crime rates, with the exception of motor vehicle theft, fell significantly during 2020. Residential burglary decreased by 24%, nonresidential burglary by 7%, larceny by 16%, and drug offenses by 30%. Motor vehicle theft rose by 13%.
• Homicides increased in nearly all of the 34 cities in the sample. In the authors’ view, urgent action is necessary to address these rapidly rising rates. Subduing the pandemic, increasing confidence in the police and the justice system, and implementing proven anti-violence strategies will be necessary to achieve a durable peace in the nation’s cities.
Introduction
This report examines changes in crime rates during the coronavirus pandemic, with a special emphasis on homicide rates. It also updates previous studies on the same subjects with data through December 2020. In a June 2020 report published by Arnold Ventures, the authors first examined the relationship between the pandemic and homicide.1 In July, September, and
1 Abt, Thomas, Richard Rosenfeld, and Ernesto Lopez. 2020. COVID-19 and Homicide: Final Report to Arnold Ventures. Houston, TX: Arnold Ventures.

2
November of 2020, in a series of reports released by the National Commission on COVID-19 and Criminal Justice, Rosenfeld and Lopez examined the relationship between the pandemic and crime rates more broadly.2 The current study consists of three parts. The first examines crime rate changes for ten violent, property, and drug offenses in a sample of U.S. cities during the calendar year of 2020. The second looks closely at homicide rates, offering observations on how the pandemic and other factors may explain the increase. The third offers recommendations for reducing homicide and other violent offenses. Data and Methods This study examines monthly crime rates for ten violent, property, and drug offenses in a total of 34 U.S. cities. Not all cities reported monthly data for each crime (see Appendix I). The mean population of the 34 cities for which homicide data were available is approximately 978,000; the median is 542,000. New York is the largest city in the sample with 8.42 million residents; Norfolk, Virginia is the smallest with 245,000 residents. While the sample for the current study was not drawn at random, it is roughly representative of the violent crime levels in large cities. In 2019, the violent crime rate of the sample was 756 violent crimes per 100,000 city population, very close to the FBI’s Uniform Crime Reporting program’s violent crime rate average of 736 per 100,000 residents for cities with populations between 500,000 and 999,000.3 The crime data were obtained from the online portals of city police departments providing monthly data for the 48-month period between January, 2017, and December, 2020, for the following offenses: homicide, aggravated assault, gun assault, domestic violence, robbery, residential burglary, nonresidential burglary, larceny, motor vehicle theft, and drug crimes. The data are subject to revision, and offense classifications varied somewhat across the cities. Offense counts were converted to monthly crime rates per 100,000 residents for analysis. A “structural breaks” methodology was used to estimate statistically significant changes in crime rates over time.4 The vertical red lines in the following figures indicate the point at which a structural break occurs in the data. In March of 2020, almost all states and the federal government declared states of emergency in response to the spread of the COVID-19 virus, imposing severe restrictions on movement and travel, limiting public and private gatherings, and issuing other directives. The shaded portions in Figures 1-10 represent the time period following these orders.
2 Rosenfeld, Richard, and Ernesto Lopez. 2020. Pandemic, Social Unrest, and Crime in U.S. Cities. Washington, D.C.: Council on Criminal Justice (July); Rosenfeld, Richard, and Ernesto Lopez. 2020. Pandemic, Social Unrest, and Crime in U.S. Cities: August Update. Washington, D.C.: Council on Criminal Justice (September); Rosenfeld, Richard, and Ernesto Lopez. 2020. Pandemic, Social Unrest, and Crime in U.S. Cities: October 2020 Update. Washington, D.C.: Council on Criminal Justice (November 2020). 3 For this comparison, violent crimes include homicide, aggravated assault, and robbery. See https://ucr.fbi.gov/crime-in-the-u.s/2019/crime-in-the-u.s.-2019. 4 Structural breaks denote a statistically significant change in the average level or rate of change in a time series, in this case monthly crime rates between January 2017 and December 2020. The structural break procedure used here assumes the break point is unknown and allows the model to estimate the significant break in the series. Because street crimes tend to rise and fall with seasonal changes and may exhibit long-run trends, the estimates are adjusted for seasonal effects and linear trends in the crime rates.

3
In order to explore additional questions concerning changes in homicide rates, the authors compiled data on city population size, age composition, poverty levels, and unemployment rates from the U.S. Census Bureau’s 2016-2019 five-year American Community Survey. Data concerning changes in public activity during the pandemic were compiled from Google Mobility Reports.5 The relationship between these variables and 2020 homicide rates was estimated in a regression model that also controls for time and place “fixed effects” of unmeasured influences on homicide. (See Appendix II for a discussion of the data and methods used in the homicide analysis.) Part One: Summary of Changes in Violent, Property, and Drug Offenses Part One describes the average change over time for the sample in monthly crime rates for each of the ten offenses. Homicide Criminal homicides are deliberate and unlawful killings of one human being by another. Figure 1 displays the average monthly homicide rate in the 34 cities for which homicide data were available (see Appendix I). As with all offenses examined here other than drug offenses, there is a clear cyclical pattern in homicide rates over time, with rates rising during the warmer summer months and falling during the fall and winter. That said, homicides rates in 2020 exceeded previous rates throughout the entire year and there was a structural break in the city average in June, indicating a large, statistically significant increase in rates
5 https://support.google.com/covid19-mobility/answer/9825414.

4
after adjusting for seasonality and the longer-term trend. After this break, homicide rates increased sharply through July, then declined through the end of the year, though not to levels observed in the prior year. In January and February, the average city homicide rate increased by 32.5% over the same period in 2019. From March through May, the rate was 19.4% higher. For the summer months of June through August, the homicide rate was 37.2% higher. For September through December, the rate was 28.2% higher. From the declaration of emergencies in March through the end of the year, the average city homicide rate increased by 28.6% over the same period in 2019. Across the entire year of 2020, the homicide rate was 29.6% higher in 2020 than the year before. That translates to an additional 1,268 homicides across the 34-city sample. KEY TAKEAWAY Homicide rates in 2020 were 30% higher than in 2019. There were 1,268 more homicides in the sample of 34 cities than the year before. Aggravated Assault
Aggravated assaults are assaults committed with a deadly weapon or those that result in or threaten serious bodily injury to the victim. Figure 2 displays the average monthly aggravated
.51
1.5
22.
5
Jan17 Apr17 Jul17 Oct17 Jan18 Apr18 Jul18 Oct18 Jan19 Apr19 Jul19 Oct19 Jan20 Apr20 Jul20 Oct20 Jan21
January 2017 - December 2020Figure 1. Monthly Homicides per 100,000 City Population
Pandemic

5
assault rate in the 19 cities for which the data were available. As with homicide, aggravated assault rates exhibit a cyclical pattern over time. The rate peaked in July of 2020, the structural break in the series, then dropped through the end of the year. In January and February, the average city aggravated assault increased by 3% over the same period in 2019. From March through May, the rate was .32% higher. For the summer months of June through August, the aggravated assault rate was 12.1% higher. For September through December, the rate was 7.5% higher. From the declaration of emergencies in March through the end of the year, the average city aggravated assault rate increased by 7.0% over the same period in 2019. Across the entire year of 2020, the rate was 6.4% higher than the year before, representing an additional 6,741 aggravated assaults across the 19-city sample. KEY TAKEAWAY Aggravated assault rates in 2020 were just over 6% higher than in 2019. There were 6,741 more aggravated assaults in the sample of 19 cities than the year before. Gun Assault
3035
4045
5055
Jan17 Apr17 Jul17 Oct17 Jan18 Apr18 Jul18 Oct18 Jan19 Apr19 Jul19 Oct19 Jan20 Apr20 Jul20 Oct20 Jan21
January 2017 - December 2020Figure 2. Monthly Aggravated Assaults per 100,000 City Population
Pandemic

6
Gun assaults are aggravated assaults committed with a firearm. The monthly gun assault rate in the 15 cities with available data exhibits a clear upward cyclical trend over time, with no structural break in the series. (Recall that the structural break equation includes the linear
trend in the data.) Gun assaults peaked in July of 2020, then declined through the end of the year. In January and February, the average city gun assault rate increased by 12.7% over the same period in 2019. From March through May, the rate was -0.8% lower. For the summer months of June through August, the gun assault rate was 12.9% higher. For September through December, the rate was 9.5% higher. From the declaration of emergencies in March through the end of the year, the average city gun assault rate increased by 7.4% over the same period in 2019. Across the entire year of 2020, the rate was 7.9% higher in 2020 than the year before, representing an additional 3,557 gun assaults across the 15-city sample. KEY TAKEAWAY Gun assault rates in 2020 were almost 8% higher than in 2019. There were 3,557 more gun assaults in the sample of 15 cities than the year before. Domestic Violence
1520
2530
Jan17 Apr17 Jul17 Oct17 Jan18 Apr18 Jul18 Oct18 Jan19 Apr19 Jul19 Oct19 Jan20 Apr20 Jul20 Oct20 Jan21
January 2017 - December 2020Figure 3. Monthly Gun Assaults per 100,000 City Population
Pandemic
7
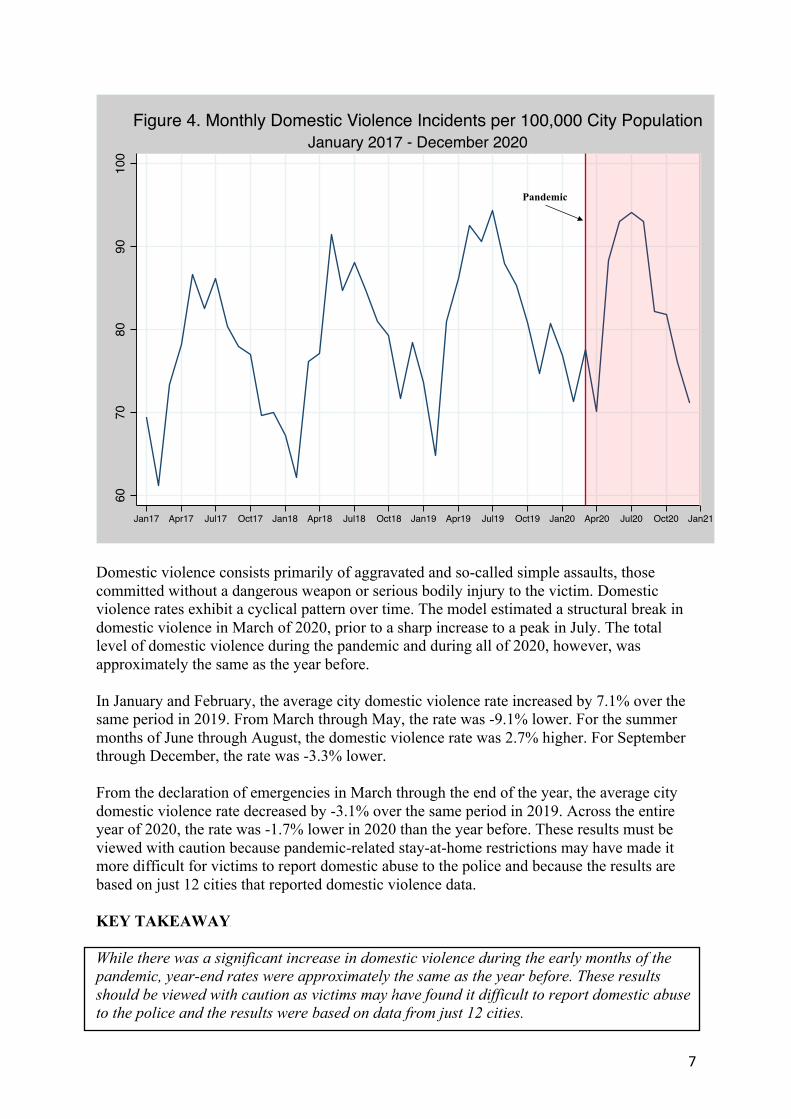
Domestic violence consists primarily of aggravated and so-called simple assaults, those committed without a dangerous weapon or serious bodily injury to the victim. Domestic violence rates exhibit a cyclical pattern over time. The model estimated a structural break in domestic violence in March of 2020, prior to a sharp increase to a peak in July. The total level of domestic violence during the pandemic and during all of 2020, however, was approximately the same as the year before. In January and February, the average city domestic violence rate increased by 7.1% over the same period in 2019. From March through May, the rate was -9.1% lower. For the summer months of June through August, the domestic violence rate was 2.7% higher. For September through December, the rate was -3.3% lower. From the declaration of emergencies in March through the end of the year, the average city domestic violence rate decreased by -3.1% over the same period in 2019. Across the entire year of 2020, the rate was -1.7% lower in 2020 than the year before. These results must be viewed with caution because pandemic-related stay-at-home restrictions may have made it more difficult for victims to report domestic abuse to the police and because the results are based on just 12 cities that reported domestic violence data. KEY TAKEAWAYY
While there was a significant increase in domestic violence during the early months of the pandemic, year-end rates were approximately the same as the year before. These results should be viewed with caution as victims may have found it difficult to report domestic abuse to the police and the results were based on data from just 12 cities.
6070
8090
100
Jan17 Apr17 Jul17 Oct17 Jan18 Apr18 Jul18 Oct18 Jan19 Apr19 Jul19 Oct19 Jan20 Apr20 Jul20 Oct20 Jan21
January 2017 - December 2020Figure 4. Monthly Domestic Violence Incidents per 100,000 City Population
Pandemic
D

8
Robbery
Robberies are thefts committed with force or the threat of force. Robbery rates in the 25 cities with available data exhibited a modest downward cyclical trend. The average robbery rate decreased during the early months of the pandemic, rose during the summer and early fall of 2020, and dropped again through the end of the year. These fluctuations, however, did not differ significantly from those of previous years. The robbery rate during the pandemic period of March to December of 2020 was 9.1% lower than during the same period the year before. The robbery rate during the entire year was 9.3% lower than in 2019. A structural break in robbery rates was detected in May of 2019, nearly a year before the pandemic began. KEY TAKEAWAY The robbery rate was 9% lower during the pandemic than during the same period in 2019 and 9% lower during the entire year than the year before. Residential Burglary
1520
2530
Jan17 Apr17 Jul17 Oct17 Jan18 Apr18 Jul18 Oct18 Jan19 Apr19 Jul19 Oct19 Jan20 Apr20 Jul20 Oct20 Jan21
January 2017 - December 2020Figure 5. Monthly Robberies per 100,000 City Population
Pandemic
9
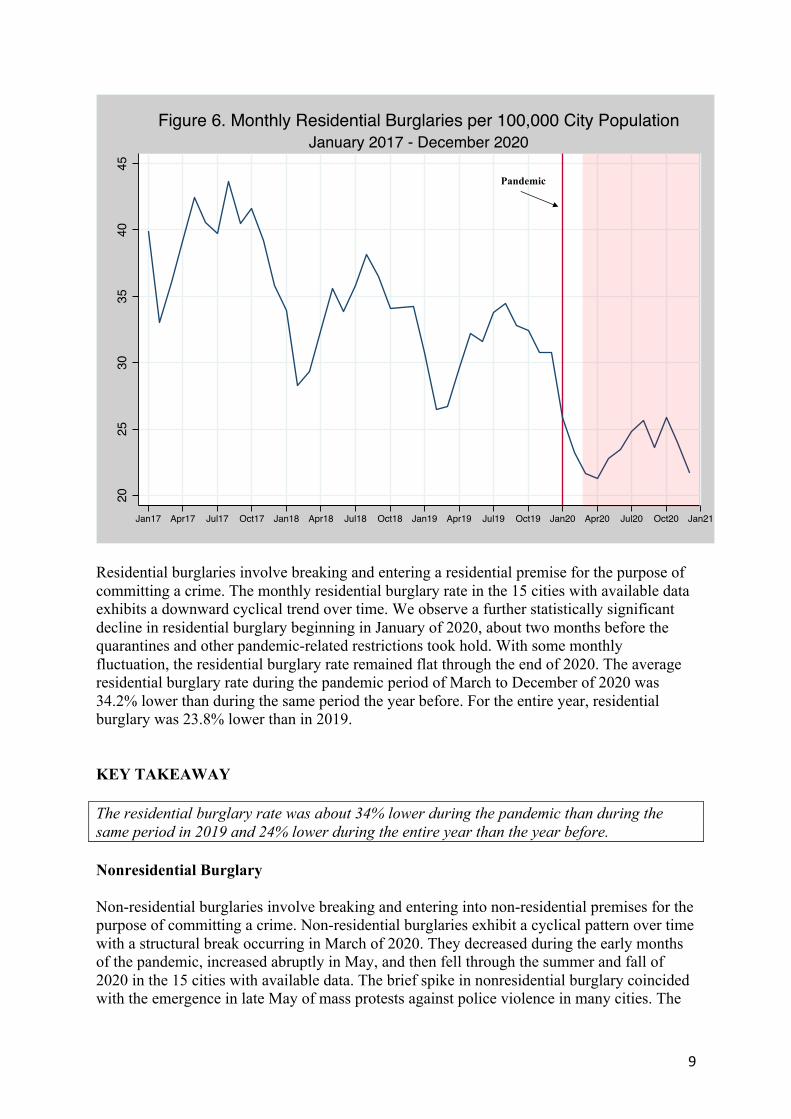
Residential burglaries involve breaking and entering a residential premise for the purpose of committing a crime. The monthly residential burglary rate in the 15 cities with available data exhibits a downward cyclical trend over time. We observe a further statistically significant decline in residential burglary beginning in January of 2020, about two months before the quarantines and other pandemic-related restrictions took hold. With some monthly fluctuation, the residential burglary rate remained flat through the end of 2020. The average residential burglary rate during the pandemic period of March to December of 2020 was 34.2% lower than during the same period the year before. For the entire year, residential burglary was 23.8% lower than in 2019. KEY TAKEAWAY The residential burglary rate was about 34% lower during the pandemic than during the same period in 2019 and 24% lower during the entire year than the year before. Nonresidential Burglary Non-residential burglaries involve breaking and entering into non-residential premises for the purpose of committing a crime. Non-residential burglaries exhibit a cyclical pattern over time with a structural break occurring in March of 2020. They decreased during the early months of the pandemic, increased abruptly in May, and then fell through the summer and fall of 2020 in the 15 cities with available data. The brief spike in nonresidential burglary coincided with the emergence in late May of mass protests against police violence in many cities. The
2025
3035
4045
Jan17 Apr17 Jul17 Oct17 Jan18 Apr18 Jul18 Oct18 Jan19 Apr19 Jul19 Oct19 Jan20 Apr20 Jul20 Oct20 Jan21
January 2017 - December 2020Figure 6. Monthly Residential Burglaries per 100,000 City Population
Pandemic

10
average non-residential burglary rate during the pandemic period of March to December of 2020 was 8.1% lower than during the same period the year before. It was 6.6% lower for the entire year than during the year before.
KEY TAKEAWAY The non-residential burglary rate was 8% lower during the pandemic than during the same period in 2019 and 7% lower during the entire year than the year before. Larceny Larcenies are thefts unaccompanied by force or breaking and entering. The monthly larceny rate exhibits a pronounced cyclical pattern over time and a structural break in March of 2020. The larceny rate in the 23 cities with available data decreased in the early months of the pandemic and rose during the next several months. The average larceny rate during the pandemic period of March to December of 2020 was 20% lower than during the same period the year before. During the entire year, it was 16% lower than the year before.
5060
7080
Jan17 Apr17 Jul17 Oct17 Jan18 Apr18 Jul18 Oct18 Jan19 Apr19 Jul19 Oct19 Jan20 Apr20 Jul20 Oct20 Jan21
January 2017 - December 2020Figure 7. Monthly Nonresidential Burglaries per 100,000 City Population
Pandemic

11
KEY TAKEAWAY The larceny rate was 20% lower during the pandemic than during the same period in 2019 and 16% lower during the entire year than the year before. Motor Vehicle Theft Motor vehicle thefts are thefts or attempted thefts of motor vehicles, mostly automobiles. Monthly motor vehicle theft rates rose and fell cyclically with no evident linear trend in the 25 cities with available data. Motor vehicle thefts increased during the early months of the pandemic. A structural break occurred in July of 2020, and the rate peaked in October before declining through the rest of the year. The motor vehicle theft rate during the pandemic increased by 12.6% over the same period the year before. The increase during all of 2020 was 12.9%.
160
180
200
220
240
260
Jan17 Apr17 Jul17 Oct17 Jan18 Apr18 Jul18 Oct18 Jan19 Apr19 Jul19 Oct19 Jan20 Apr20 Jul20 Oct20 Jan21
January 2017 - December 2020Figure 8. Monthly Larcenies per 100,000 City Population
Pandemic

12
KEY TAKEAWAY Motor vehicle theft was about 13% higher during the pandemic and during all of 2020 than the year before. Drug Offenses Drug offenses include arrests for the manufacture, sale, or possession of illicit drugs. The weekly drug offense rate in the 17 cities with available data exhibits a structural break in March of 2020, shortly after which the rate rose and then dropped sharply. Overall, the drug offense rate during the pandemic decreased by 38.7% over the same period in 2019, dropping to a level far lower than at any time during the previous three years. During all of 2020, the drug offense rate decreased by 30% from the year before.
3540
4550
55
Jan17 Apr17 Jul17 Oct17 Jan18 Apr18 Jul18 Oct18 Jan19 Apr19 Jul19 Oct19 Jan20 Apr20 Jul20 Oct20 Jan21
January 2017 - December 2020Figure 9. Monthly Motor Vehicle Thefts per 100,000 City Population
Pandemic

13
KEY TAKEAWAY Drug offenses were nearly 39% lower during the pandemic and 30% lower during all of 2020 than the year before. Summary and Discussion Part One of this study updates previous reports for Arnold Ventures and the National Commission on COVID-19 and Criminal Justice on crime changes during the coronavirus pandemic. It reveals statistically significant changes in the rates of violent, property, and drug offenses for a sample of American cities during calendar year 2020. Homicide rates were higher during every month of 2020 relative to rates from the previous year. That said, rates increased significantly in June, well after the pandemic began, coinciding with the death of George Floyd and the mass protests that followed. Overall, homicide rates increased 30% in 2020, a large and troubling increase that has no modern precedent. An increase of this size in large cities suggests that the national homicide rate increase almost certainly will exceed the 10.2% increase in 2016, after police killings in Ferguson, MO and elsewhere sparked widespread protests, as well as previous largest single-year increase of 12.7% in 1968.6 But, as other commentators have noted, a final determination must await official crime statistics from the federal government, which will be released later this year.
6 https://ucr.fbi.gov/crime-in-the-u.s/2019/crime-in-the-u.s.-2019; FBI Unified Crime Reports, historical data.
3040
5060
70
Jan17 Apr17 Jul17 Oct17 Jan18 Apr18 Jul18 Oct18 Jan19 Apr19 Jul19 Oct19 Jan20 Apr20 Jul20 Oct20 Jan21
January 2017 - December 2020Figure 10. Monthly Drug Offenses per 100,000 City Population
Pandemic
14
While the size of this one-year increase is cause for concern, readers should be aware that absolute rates of homicide rate of remain well below historical highs. In 2020, in sample cities the homicide rate was 11.4 deaths per 100,000 residents; twenty-five years earlier, in 1995, the rate for the same sample was 19.4 per 100,000 residents. Homicide rates have largely declined since the early 1990s, with brief spikes in 2005, 2006, 2015, and 2016, after which homicide rates continued to fall.7 On the other hand, property crimes such as burglaries and larcenies fell significantly during 2020, although thefts of motor vehicle thefts increased. Drug offenses also dropped substantially. The timing of these declines coincided with the stay-at-home mandates and business closings in response to the pandemic. Quarantines reduce residential burglaries – when residents are at home, opportunities for burglaries are foreclosed. When businesses are closed, there is no opportunity for larcenies such as shoplifting. Drug arrests fall when police prioritize away from drug enforcement activities, and when street-level drug-selling becomes more difficult because fewer people are out in public. Relatedly, residential burglaries and larcenies increased somewhat as quarantines were lifted and shops reopened during the summer. Domestic violence increased sharply during the spring and summer of 2020 but remained flat overall compared to 2019. This result should be viewed with caution because pandemic restrictions may have made it difficult for victims to report domestic abuse to the police, and the result is based on just 12 of the 28 cities in our analysis. Part Two: In-Depth Analysis of Changes in Homicide Offenses As reported above, the homicide rate in the 34 cities for which monthly homicide data were available rose on average by 30% between 2019 and 2020 – a historic increase. Part Two analyzes the potential causes and contributors to rising homicide rates during the past year, exploring variation across cities in demographic and social conditions, the coronavirus pandemic, the protests against police violence following the death of George Floyd, and other factors. Variation Across Cities Figure 11 shows the 2019-2020 percentage change in the number of homicides in each of the 34 cities in the sample. Most obviously and importantly, homicides rose in 29 of 34 (85%) of the cities included in the sample. Several of the greatest increases occurred in smaller cities with very small homicide counts, where even a few additional homicides can produce a large percentage change. For example, Chula Vista, California, experienced the largest homicide increase in the sample (150%), but that percentage is based on a difference of just six homicides (ten in 2020 compared with four in 2019). But large increases in homicides were not limited to smaller cities. Chicago added 278 homicides to its 2019 total of 502, for an increase of 55%. New York added 131 homicides, representing a 43% increase. Not surprisingly, given their size, large cities with appreciable homicide increases contributed disproportionately to the overall increase in murder victims. The three largest cities (New York, Los Angeles, and Chicago) accounted for fully 40% of the 1,268 additional people
7 https://ucr.fbi.gov/crime-in-the-u.s/2019/crime-in-the-u.s.-2019/topic-pages/tables/table-1

15
killed in 2020. While there is variation among the cities, what is most notable is that homicide rose substantially in the vast majority of them. To further explore variations among cities, the authors performed a regression analysis to assess the relationship between homicide rates and differences in various demographic and socioeconomic variables and population mobility rates. The results of this analysis are presented in full in Appendix II. To account for seasonality effects, the homicide rate during the same month the year before is included in the analysis. As might be expected, more disadvantaged cities – those with higher poverty and unemployment rates – experienced greater increases in homicide in 2020. Larger cities had modestly smaller increases in homicide, as did those with a larger share of residents between the ages of 18 and 24. Finally, increased time spent at home was associated with decreases (or smaller increases) in homicide, as explained below.
While definitive answers must await further research, local variations in social and demographic conditions, while important, do not appear to be the primary driving force behind rising homicide rates. National factors must be explored to better understand the increase. The Coronavirus Pandemic As the authors noted in a previous report,8 the coronavirus pandemic may have temporarily suppressed some homicides by limiting the opportunities for offenders and victims to interact
8 Abt, Rosenfeld, and Lopez, 2020.
150%133%
100%85%
80%73%
63%61%
55%48%48%
46%43%
38%38%37%35%
32%30%29%29%29%
27%25%
19%14%13%
8%6%
0%-4%-4%
-25%-50%
Figure 11. Percentage Change in Homicides, 2019 - 2020
16
following government-ordered restrictions on travel, work, and social activity. Compared to other periods in 2020, the smallest homicide increases occurred in March through May, when the most severe restrictions were in place. This finding is consistent with a large body of criminological theory and research on the relationship between crime and everyday activity patterns. In addition, as mentioned above, new data lends support to this hypothesis. Data on changes in public activity from Google Mobility Reports were used to estimate time spent at home for a large sample of the U.S. population. As expected, time spent at home peaked during the early months of the pandemic, then eased over the summer months. It appears that as pandemic-related restrictions were relaxed during the late spring and summer of 2020, or compliance with them diminished, homicide rates increased. The authors have also noted previously that the pandemic may have increased the commission of homicides in multiple ways. First, the pandemic has disproportionately affected vulnerable populations, placing at-risk individuals under additional physical, mental, emotional, and financial stress. Secondly, the pandemic has strained the institutions charged with responding to violent offenses, including police agencies, courts, hospitals, emergency medical services, and community-based groups that productively engage at-risk individuals. Most evidence-informed violence reduction efforts depend heavily on proactive outreach to at-risk people and places,9 and such outreach has been largely curtailed by the ongoing risk of infection. To summarize, COVID-related restrictions may have had an initial suppressive effect on homicides, but the waning of those restrictions, coupled with the strain on at-risk individuals and key institutions – aggravated further by the lack of outreach to such individuals – have all likely contributed to elevated homicide rates in 2020. Protests against Police Violence As noted above, a precipitous rise in homicides coincided with the emergence of mass protests after George Floyd was killed in late May by a police officer in Minneapolis. In June through August 2020, the homicide rate was 37% higher than the previous year and higher than during any other period in 2020. That said, the connection between police violence, protests and social unrest, and heightened community violence remains uncertain. As the authors have noted previously,10 it may be instructive to compare recent increases in violence to those that followed the August 2014 police killing of Michael Brown in Ferguson, Missouri, and the subsequent protests around the country. In the aftermath, homicides in large cities rose in 2015 and 2016 by nearly 22% - the largest two-year increase in 25 years.11 Analysts at the time tied the heightened violence to two versions of a so-called Ferguson Effect, both of which remain plausible today. The first connects violence to “de-policing,” a pullback in proactive law enforcement by officers who fear they will be unfairly scrutinized and could lose their jobs. The second connects violence to “de-legitimizing,” positing that disadvantaged communities drew away from police due to breached trust and lost confidence.
9 Abt, Thomas. 2019. Bleeding Out. New York: Basic Books. 10 Rosenfeld and Lopez, 2020 (July). 11 Rosenfeld, Richard, Shytierra Gaston, Howard Spivak, and Seri Irazola. 2017. “Assessing and Responding to the Recent Homicide Rise in the United States.” NCJ 251067. Washington, DC: National Institute of Justice.

17
Reduced reliance on the police impedes crime investigations and increases “street justice” to resolve disputes, resulting in more violence. While it remains unclear how much these theories explain such increases, it is clear that no simple connection exists between police violence, protests against such violence, and community violence. Other Factors Finally, it should be noted that other factors may be contributing to increased homicide and violent crime. For example, some commentators have observed that massive increases in firearm purchases at the outset of the pandemic may have contributed to an increase in homicides and gun crimes. There is some preliminary evidence to support such a conclusion, but more research is required.12 Other commentators have argued that reductions in jail populations due to the pandemic and, in some places, bail reforms have led to an increase in violence. The evidence for these claims is anecdotal at best. Finally, it should be noted that homicides were already on the rise in January and February, so there may be unknown factors unrelated to the pandemic or police violence contributing to rising rates of violence. While it is impossible to be certain, it is probable that the pandemic, protests, and other factors all combined to create a “perfect storm” of circumstances pushing homicide rates to record levels. KEY TAKEAWAY The vast majority of cities experienced homicide increases in 2020. City-to-city variation in demographic and social conditions do not fully explain the homicide rise. The coronavirus pandemic and protests over police violence are likely contributors, along with yet-to-be-identified additional factors. Part Three: Recommendations for Reducing Homicide and Other Violent Offenses The coronavirus pandemic, continuing incidents of police violence, and rising homicide and violent crime rates each pose massive policy challenges in their own right, but the interplay between them creates even more difficult decisions for policymakers. Despite this difficulty, leaders at all levels of government should take bold action in responding to all three crises. First, as the authors have observed previously, subduing the coronavirus pandemic remains crucial for reducing homicide and other forms of violence.13 While COVID-related restrictions may have temporarily suppressed homicide rates, the pandemic has placed individuals and institutions under tremendous strain, ultimately pushing homicide rates higher. In addition, the pandemic has impeded outreach to at-risk individuals – a key component of most evidence-informed anti-violence strategies. For example, visits by trained
12 https://www.medrxiv.org/content/10.1101/2020.07.02.20145508v2 13 Rosenfeld and Lopez, 2020 (July).

18
case managers to hospitalized gunshot victims can reduce subsequent violence.14 These efforts require face-to-face interaction by police, public health, and community-based workers with those most likely to be involved with violence; such interactions cannot be replaced by Zoom. Effectively addressing the pandemic is especially important given that COVID-19 cases and deaths have soared in the very communities where violence is concentrated. Criminal justice measures to address the pandemic are described in the interim and final reports of the National Commission on COVID-19 and Criminal Justice. Second, sustained reductions in violence depend heavily on improving the fairness and legitimacy of the justice system in general, and policing in particular. Protestors around the nation have called for significant changes in how disadvantaged communities are policed, including the adoption of accountability measures for officers who engage in serious misconduct and redirecting the mentally ill, homeless and other troubled populations to non-enforcement agencies. Translating these calls into workable policy will not be easy, but it is essential for sustained improvements in both safety and justice. Among other efforts, the Council on Criminal Justice has established a Task Force on Policing for precisely this purpose. Some commentators suggest that the need for safety (freedom from violent and other crime) and the need for justice (freedom from excessive and unequal exercises of state power) are in tension with one another. They are not. To sustainably reduce homicide and other violent crime in disadvantaged communities, those communities must believe they are being treated fairly and appropriately by the police and other components of the justice system. Lastly, responses to record-breaking increases in homicide must not wait. Policymakers can and should address the pandemic, police legitimacy, and violent crime simultaneously. A large body of rigorous empirical evidence demonstrates that violent crime can be addressed using strategies that are available now and do not require significant budgetary outlays, new legislation, or deep systemic reforms. It is now well-established that by using a combination of programmatic efforts that are collectively focused, balanced, and fair, policymakers can make concrete progress on curbing violent street crime.15 A Federal Priorities Task Force, also convened by the Council on Criminal Justice, recently recommended a national anti-violence effort along these lines. To implement these efforts immediately, such strategies can be “COVID-proofed” by providing the police, public health, and community-based workers implementing them with prioritized access to vaccines and personal protective equipment, along with the necessary health and medical care. With so many lives at stake, the time to act is now.
14 https://giffords.org/lawcenter/gun-laws/policy-areas/other-laws-policies/intervention-strategies/#footnote_42_5669. 15 Abt, 2019.

19
Appendix I: Cities and Offenses City 1 2 3 4 5 6 7 8 9 10 Arlington x Atlanta x x x x x x x Austin x x x x x x x x x Baltimore x x x x x x Buffalo x x x x x Chandler x x x x x Chicago x x x x x x x x x x Chula Vista x Cincinnati x x x x x Dallas x x x x x x Denver x x x x x x x x Detroit x x x x x x x Jacksonville x Lexington x Lincoln x Long Beach x Los Angeles x x x x x x x Louisville x x x x x x x Madison x Memphis x x x x x x x x Milwaukee x x x x Minneapolis x x x x x Nashville x x x x x x x New York x Norfolk x x x x x x x Omaha x x x x x x Philadelphia x x x x x x x x Phoenix x x x x x x x x Pittsburgh x x x x x x x x Raleigh x x x x x x x x Riverside x x x x x x x Sacramento x x x San Diego x San Francisco Seattle x x x x x x St. Louis x St. Paul x x x x x x x x St. Petersburg x x x x x x x x Virginia Beach x Washington x x x x x x Number 34 19 15 12 25 15 15 23 25 17
Key 1 Homicide 2 Aggravated Assault 3 Gun Assault
4 Domestic Violence 5 Robbery 6 Residential Burglary
7 Nonresidential Burglary 8 Larceny 9 Motor Vehicle Theft
10 Drug Offense

20
Appendix II: City Homicide Model We estimated the association between the 2020 monthly city homicide rate and the measure of residential duration, the city population, the percentage of residents between the ages of 18 and 24, the family poverty rate, and the unemployment rate in a regression model incorporating time and place fixed effects. The poverty and unemployment variables are highly correlated and are combined into a single Disadvantage factor in the regression. The homicide rate lagged 12 months is included to adjust the estimates for seasonal effects. Therefore, the model estimates the residual change in the monthly homicide rate from the 2019 homicide rate during the same month. The residential duration measure varies month-to-month during 2020. The square of residential duration is included to capture possible nonlinear (e.g., threshold) effects of time spent at home on homicide. All other variables are time invariant. Time and place fixed effects (month and city dummy variables) are included to absorb unmeasured influences on the residual change in the homicide rate. The city population is highly skewed in original metric and is transformed to its natural log. Robust standard errors are used to account for heteroskedasticity in the regression errors. The regression results are shown in Table AII. Table AII. Regression Results for Monthly Change in Homicide Rate in 2020 (N = 363)a _____________________________________________________ Coefficient Standardized (s.e.) Coefficient _____________________________________________________ Lagged Homicide Rate .662* .491 (.180) Residential Duration -.147* -.408 (.068) Residential Duration2 .004b .227 (.002) Disadvantage .546* .266 (.144) Log Population -.808* -.356 (.211) Age 18-24 -.089* -.139 (.031) R2 .823 F (45, 317) 39.010* _____________________________________________________ aTime and place fixed effects not shown. Robust standard errors in parentheses. bp=.06 *p <. 05