palaeodata-informed modelling of large carbon losses from ... · pdf filepaleodata-informed...
TRANSCRIPT
1
Paleodata-informed modeling of large carbon losses from recent burning of boreal forests Ryan Kelly, Hélène Genet, A. David McGuire, Feng Sheng Hu
Supplementary Discussion
Evaluation of spin-up C stocks The spPaleo and spModern experiments simulate initial (1950 AD) soil C stocks of 9.8 and 6.0 kg C/m2, respectively. The former is well within the range of measured values for sites similar to our study area, which average 12.1±5.6 kg C/m2 (mean ± s.d.; ref. 1). Similarly, vegetation C stocks estimated from inventory data for upland black spruce plots2 yield an estimate of 3.5±2.5 kg C/m2, which is again matched more closely by spPaleo (2.2 kg C/m2) than spModern (1.1 kg C/m2). Thus, overall the higher estimated C stocks of the spPaleo spin-up seem more realistic than those of spModern, consistent with the notion that paleodata-informed model spin-up provides improved estimates of model initial conditions. Finally, we note that measured soil and vegetation C stocks are greater than our simulated initial conditions in either experiment, suggesting that CECO for our study area may have been even greater in 1950 AD than estimated by spPaleo. This would imply that recent C losses and the bias of spModern due to low initial C stocks are both greater than reported in the main text, thus reinforcing the key findings of our study.
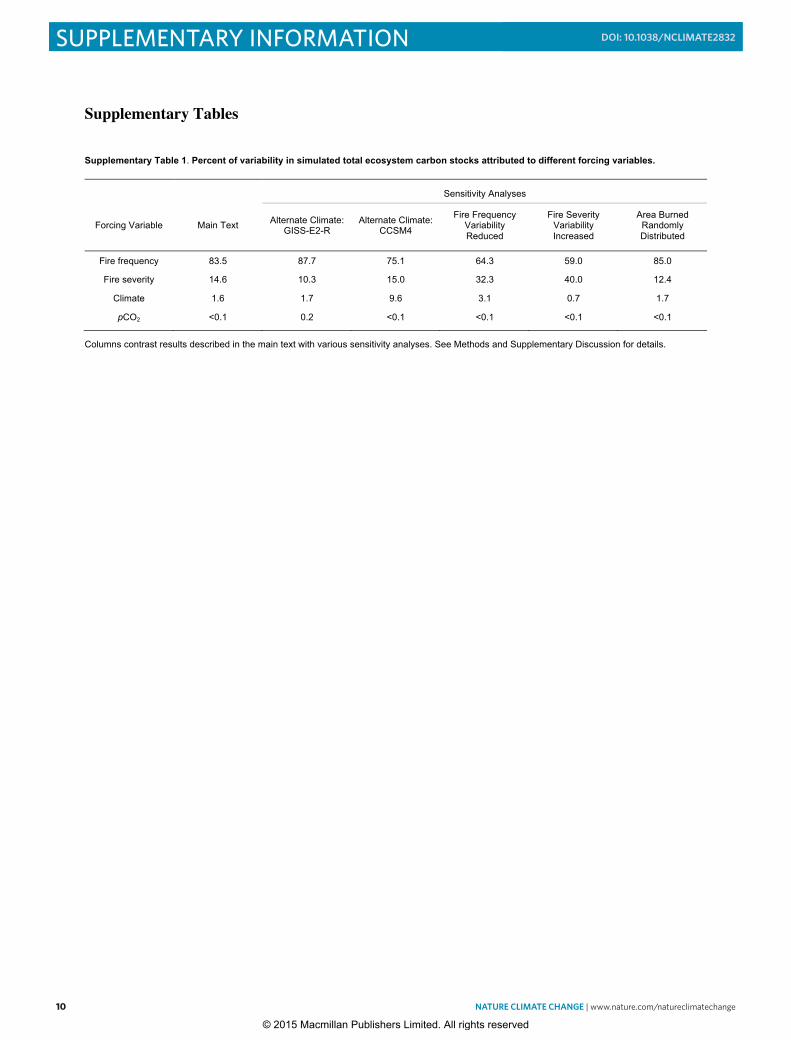
Sensitivity of results to fire history prescribed from paleorecords As a centennial composite of 14 sites, the Yukon Flats fire frequency record represents some degree of averaging across both space and time. As such, it is unlikely that the record systematically overestimates past variability in the fire regime, and our sensitivity experiment with a reduced-variance version of the record is therefore quite conservative. As expected, in this experiment the effects of fire frequency on C cycling are reduced compared to the results reported in the main text (Supplementary Fig. 5a; Supplementary Table 1). Nevertheless, fire frequency remains the strongest driver of simulated CECO. Moreover, most of the lost explanatory power of fire frequency is taken up by fire severity in this experiment, demonstrating that the fire regime clearly dominated patterns of past C balance overall, even if there is some uncertainty about the relative contributions of fire frequency versus severity. Similarly, if we assume that the range of fire severity in the past millennium was much greater than that represented by the default configuration of DOS-TEM, we naturally conclude that changes in fire severity were more important to past C cycling than suggested by our primary model experiments (Supplementary Fig. 5b; Supplementary Table 1). In particular, CECO grew dramatically during low-severity conditions from ca. 1680-1970 AD in our experiment, reflecting the assignment of all fires in that period to the lowest empirical severity measurement observed in 178 burned sites3. Again this conservative analysis does not qualitatively change the ranking of CECO drivers considered, but it does reduce the difference in CECO variability explained between fire frequency and severity. Uncertainty in past fire frequency could also influence our estimate of modern C balance, since the latter is driven largely by the recent increase in fire activity relative to the rate of burning inferred from the paleorecord. Indeed, past-millennium simulations forced with the limits of a 90% confidence interval on reconstructed fire frequency differ substantially in terms
Palaeodata-informed modelling of large carbon losses from recent burning of boreal forests
SUPPLEMENTARY INFORMATIONDOI: 10.1038/NCLIMATE2832
NATURE CLIMATE CHANGE | www.nature.com/natureclimatechange 1
© 2015 Macmillan Publishers Limited. All rights reserved

2
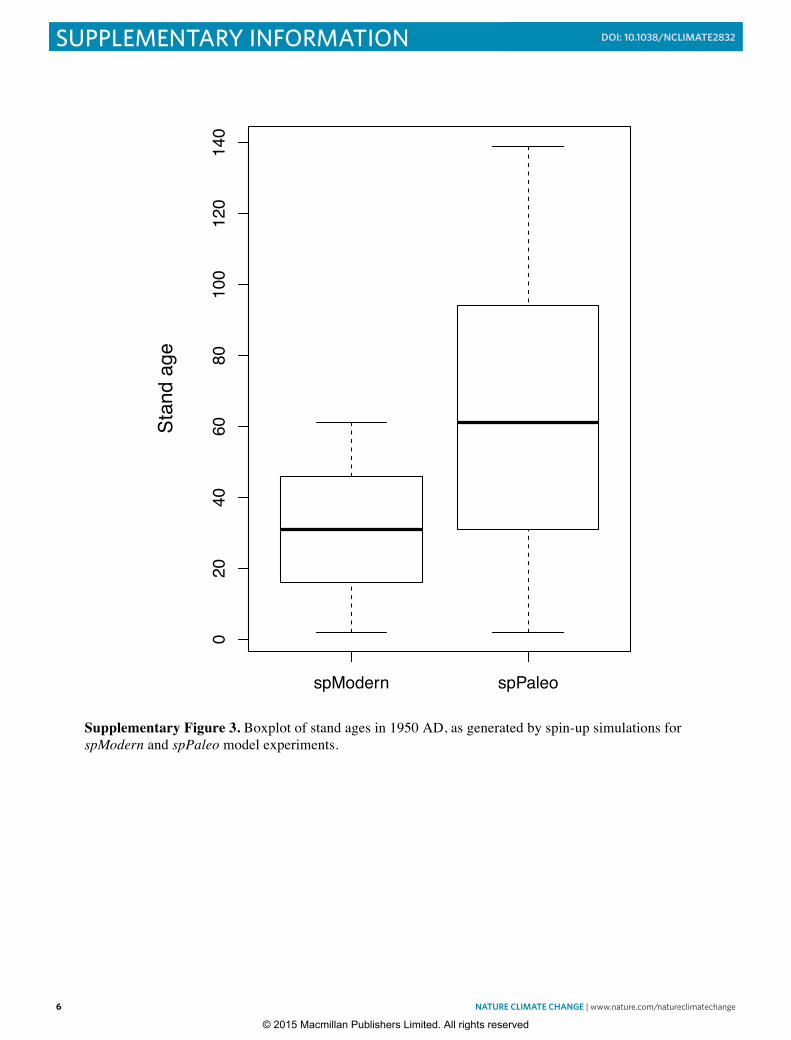
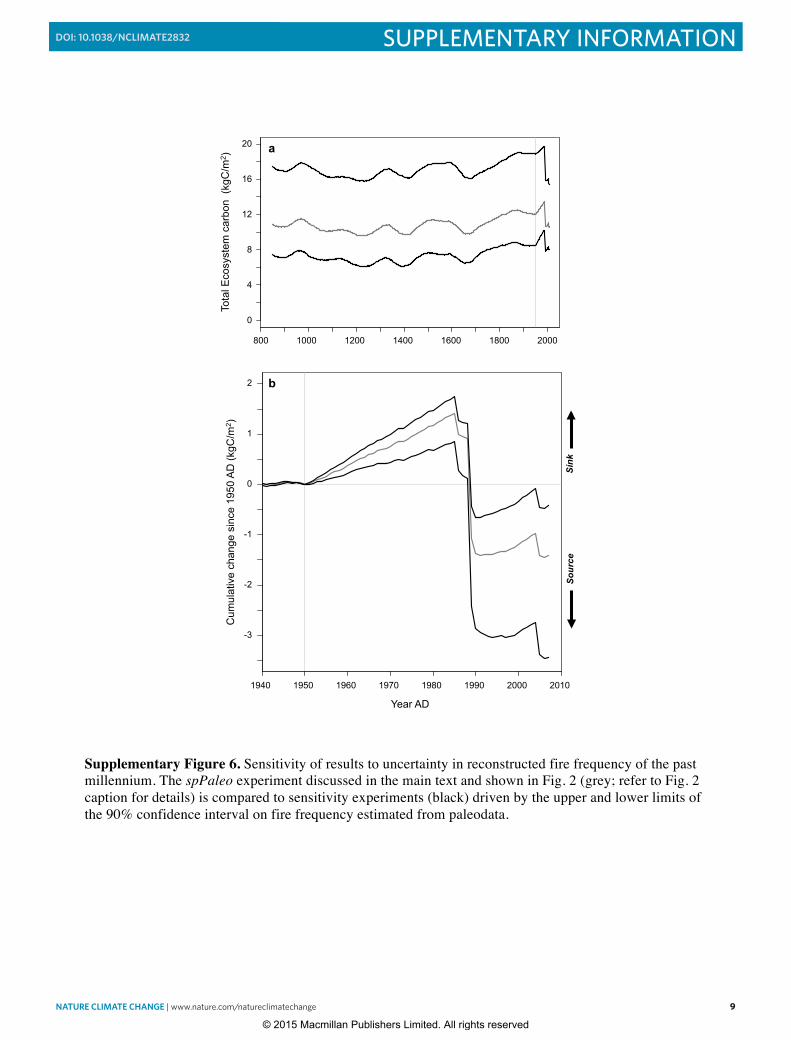
of absolute CECO, and thus result in quite different 1950 AD conditions (Supplementary Fig. 6a). If these divergent simulations are then used as spin-up alternatives for the spPaleo experiment, the results suggest that the true net C balance of our study area for the period 1950-2006 AD could range anywhere from -0.5 to -3.4 kg C/m2
(Supplementary Fig. 6b). Thus, while we can confidently conclude that the Yukon Flats region has been a C source in recent decades due to extensive burning, there is considerable uncertainty about the exact magnitude of the source. Finally, with respect to the alternate methods for distributing burned area among simulated grid cells, we found that adopting randomly-distributed fires in our experiments alters the distribution of stand ages on the simulated landscape, consistently shifting it towards a greater mean age and thus increasing total simulated C stocks (Supplementary Fig. 5c). However, the approach does not appreciably change temporal patterns in CECO or the relative differences among model experiments, and thus it has a minimal impact on our results (Supplementary Table 1). Sensitivity of results to uncertainties in past-millennium climate Among the three paleoclimate simulations we used, temporal trends and the range of variability of climate variables differed substantially for our study region (Supplementary Fig. 4). For example, compared to the MPI-ESM climate dataset reported in the main text, the GISS-E2-R model simulated overall less variability in mean annual temperature (MAT) and precipitation. By contrast, the Community Climate System Model version 4 (CCSM4) demonstrated greater variability in MAT, a more pronounced cooling trend over the past millennium prior to the onset of recent warming, and lower precipitation overall. It is difficult to critically evaluate which of the three climate datasets is most accurate, because independent paleoclimate evidence from proxy data are spatially sparse and temporally coarse, and they represent only a restricted subset of climate variables. For example, as a benchmark we considered the temperature difference between the Medieval Climate Anomaly (MCA; ca. 950-1450 AD) and Little Ice Age (LIA; ca. 1550-1900 AD), two well-studied periods known for relatively warm and cool climate conditions, respectively. The periods differ by only 0.17 °C in a recent synthesis of Arctic paleoclimate archives (Kaufman et al. 2009), but by 0.5 °C or more in some individual records (e.g. Hu et al. 2001). By comparison, the paleoclimate simulations indicate MCA–LIA differentials in MAT of 0.28 °C (MPI-ESM), 0.12 °C (GISS-E2-R), and 0.50 °C (CCSM4). Thus, besides being an excellent model in terms of Arctic climate simulation4, MPI-ESM is a reasonable choice for this study in the sense that it simulates a moderate amount of past climate variability compared to other models and available proxy data. As there is considerable variability among the paleoclimate models considered, it is not possible to make a precise statement about the specific contributions of past climate to C cycling. However, even in the suite of model experiments forced with the high-variability CCSM4 dataset, climate only accounts for ~10% of variability in simulated total ecosystem C stocks (CECO; Supplementary Table 1). Therefore we conclude that paleoclimate uncertainty does not substantially alter our conclusion that the direct role of climate in driving C balance of the past millennium was minor.
3
References
1. Johnson, K. D. et al. Soil carbon distribution in Alaska in relation to soil-forming factors. Geoderma 167-168, 71–84 (2011).
2. Malone, T., Liang, J. & Packee, E. C. Cooperative Alaska Forest Inventory. 1–50 (USDA, 2009).
3. Turetsky, M. R. et al. Recent acceleration of biomass burning and carbon losses in Alaskan forests and peatlands. Nat Geosci 4, 27–31 (2010).
4. Walsh, J. E., Chapman, W. L., Romanovsky, V., Christensen, J. H. & Stendel, M. Global Climate Model Performance over Alaska and Greenland. J Clim 21, 6156–6174 (2008).
5. Kelly, R. et al. Recent burning of boreal forests exceeds fire regime limits of the past 10,000 years. Proc Natl Acad Sci USA 110, 13055–13060 (2013).
6. Kasischke, E. S., Williams, D. & Barry, D. Analysis of the patterns of large fires in the boreal forest region of Alaska. Int J Wildland Fire 11, 131–144 (2002).
2 NATURE CLIMATE CHANGE | www.nature.com/natureclimatechange
SUPPLEMENTARY INFORMATION DOI: 10.1038/NCLIMATE2832
© 2015 Macmillan Publishers Limited. All rights reserved

2
of absolute CECO, and thus result in quite different 1950 AD conditions (Supplementary Fig. 6a). If these divergent simulations are then used as spin-up alternatives for the spPaleo experiment, the results suggest that the true net C balance of our study area for the period 1950-2006 AD could range anywhere from -0.5 to -3.4 kg C/m2
(Supplementary Fig. 6b). Thus, while we can confidently conclude that the Yukon Flats region has been a C source in recent decades due to extensive burning, there is considerable uncertainty about the exact magnitude of the source. Finally, with respect to the alternate methods for distributing burned area among simulated grid cells, we found that adopting randomly-distributed fires in our experiments alters the distribution of stand ages on the simulated landscape, consistently shifting it towards a greater mean age and thus increasing total simulated C stocks (Supplementary Fig. 5c). However, the approach does not appreciably change temporal patterns in CECO or the relative differences among model experiments, and thus it has a minimal impact on our results (Supplementary Table 1). Sensitivity of results to uncertainties in past-millennium climate Among the three paleoclimate simulations we used, temporal trends and the range of variability of climate variables differed substantially for our study region (Supplementary Fig. 4). For example, compared to the MPI-ESM climate dataset reported in the main text, the GISS-E2-R model simulated overall less variability in mean annual temperature (MAT) and precipitation. By contrast, the Community Climate System Model version 4 (CCSM4) demonstrated greater variability in MAT, a more pronounced cooling trend over the past millennium prior to the onset of recent warming, and lower precipitation overall. It is difficult to critically evaluate which of the three climate datasets is most accurate, because independent paleoclimate evidence from proxy data are spatially sparse and temporally coarse, and they represent only a restricted subset of climate variables. For example, as a benchmark we considered the temperature difference between the Medieval Climate Anomaly (MCA; ca. 950-1450 AD) and Little Ice Age (LIA; ca. 1550-1900 AD), two well-studied periods known for relatively warm and cool climate conditions, respectively. The periods differ by only 0.17 °C in a recent synthesis of Arctic paleoclimate archives (Kaufman et al. 2009), but by 0.5 °C or more in some individual records (e.g. Hu et al. 2001). By comparison, the paleoclimate simulations indicate MCA–LIA differentials in MAT of 0.28 °C (MPI-ESM), 0.12 °C (GISS-E2-R), and 0.50 °C (CCSM4). Thus, besides being an excellent model in terms of Arctic climate simulation4, MPI-ESM is a reasonable choice for this study in the sense that it simulates a moderate amount of past climate variability compared to other models and available proxy data. As there is considerable variability among the paleoclimate models considered, it is not possible to make a precise statement about the specific contributions of past climate to C cycling. However, even in the suite of model experiments forced with the high-variability CCSM4 dataset, climate only accounts for ~10% of variability in simulated total ecosystem C stocks (CECO; Supplementary Table 1). Therefore we conclude that paleoclimate uncertainty does not substantially alter our conclusion that the direct role of climate in driving C balance of the past millennium was minor.
3
References
1. Johnson, K. D. et al. Soil carbon distribution in Alaska in relation to soil-forming factors. Geoderma 167-168, 71–84 (2011).
2. Malone, T., Liang, J. & Packee, E. C. Cooperative Alaska Forest Inventory. 1–50 (USDA, 2009).
3. Turetsky, M. R. et al. Recent acceleration of biomass burning and carbon losses in Alaskan forests and peatlands. Nat Geosci 4, 27–31 (2010).
4. Walsh, J. E., Chapman, W. L., Romanovsky, V., Christensen, J. H. & Stendel, M. Global Climate Model Performance over Alaska and Greenland. J Clim 21, 6156–6174 (2008).
5. Kelly, R. et al. Recent burning of boreal forests exceeds fire regime limits of the past 10,000 years. Proc Natl Acad Sci USA 110, 13055–13060 (2013).
6. Kasischke, E. S., Williams, D. & Barry, D. Analysis of the patterns of large fires in the boreal forest region of Alaska. Int J Wildland Fire 11, 131–144 (2002).
NATURE CLIMATE CHANGE | www.nature.com/natureclimatechange 3
SUPPLEMENTARY INFORMATIONDOI: 10.1038/NCLIMATE2832
© 2015 Macmillan Publishers Limited. All rights reserved

4
Supplementary Figures
0 10 20km
Supplementary Figure 1. Map of study area. Simulations were conducted on 1-km2 grid cells (squares; n=1,931) within 10 km of sites contributing to a prior paleofire reconstruction (circles; ref. 5) used as model input in this study. Fire perimeters (gray shading) represent burns documented in the observational record (1950-2006 AD; ref. 6). Inset shows the location of the study area in Alaska (black box), and the Yukon River (heavy black line) is shown for spatial reference.
5
Dynamic Organic Soil Module
(Soil structure)
Vegetation composition and atmospheric CO2
concentration
Ecological Module (Biogeochemical Processes)
Fire occurrence, topography
Disturbance Module (Fire effects)
Climate Data
Environmental Module (Biophysical Processes)
Burn severity
Soil
structure
Supplementary Figure 2. Structure of DOS-TEM. Solid ellipses represent the four main modules of the model, and arrows indicate the information passed between modules. The solid boxes show where prescribed forcing data enter the model.
Supplementary Figure 2. Structure of DOS-TEM. Solid ellipses represent the four main modules of the model, and arrows indicate the information passed between modules. The solid boxes show where prescribed forcing data enter the model.
4 NATURE CLIMATE CHANGE | www.nature.com/natureclimatechange
SUPPLEMENTARY INFORMATION DOI: 10.1038/NCLIMATE2832
© 2015 Macmillan Publishers Limited. All rights reserved

4
Supplementary Figures
0 10 20km
Supplementary Figure 1. Map of study area. Simulations were conducted on 1-km2 grid cells (squares; n=1,931) within 10 km of sites contributing to a prior paleofire reconstruction (circles; ref. 5) used as model input in this study. Fire perimeters (gray shading) represent burns documented in the observational record (1950-2006 AD; ref. 6). Inset shows the location of the study area in Alaska (black box), and the Yukon River (heavy black line) is shown for spatial reference.
5
Dynamic Organic Soil Module
(Soil structure)
Vegetation composition and atmospheric CO2
concentration
Ecological Module (Biogeochemical Processes)
Fire occurrence, topography
Disturbance Module (Fire effects)
Climate Data
Environmental Module (Biophysical Processes)
Burn severity
Soil
structure
Supplementary Figure 2. Structure of DOS-TEM. Solid ellipses represent the four main modules of the model, and arrows indicate the information passed between modules. The solid boxes show where prescribed forcing data enter the model.
Supplementary Figure 2. Structure of DOS-TEM. Solid ellipses represent the four main modules of the model, and arrows indicate the information passed between modules. The solid boxes show where prescribed forcing data enter the model.
NATURE CLIMATE CHANGE | www.nature.com/natureclimatechange 5
SUPPLEMENTARY INFORMATIONDOI: 10.1038/NCLIMATE2832
© 2015 Macmillan Publishers Limited. All rights reserved
6
spModern spPaleo
020
4060
80100
120
140
Stan
d ag
e
Supplementary Figure 3. Boxplot of stand ages in 1950 AD, as generated by spin-up simulations for spModern and spPaleo model experiments.
Supplementary Figure 3. Boxplot of stand ages in 1950 AD, as generated by spin-up simulations for spModern and spPaleo model experiments.
7
Supplementary Figure 4. Sensitivity analysis results using alternative past-millennium climate drivers simulated by GISS-E2-R (a) and CCSM4 (b). For each analysis, the lower panel compares temperature and precipitation trends from the alternate dataset (black) to values from the MPI-ESM drivers used in the simulations described in the main text (grey), and the upper panel illustrates the influence of the alternate climate dataset on simulated carbon stocks in the suite of experiments shown in Fig. 1a (i.e., with model drivers applied in combination [black] or individually [colors; see legend]).
−20
2
800 1100 1500 1900
2
0
-1
1
-2
3
Yr AD
a
800 1000 1200 1400 1600 1800 2000
26
24
28
Tota
l eco
syst
em C
(Dev
iatio
ns fr
om c
ontro
l, kg
C/m
2 )Pr
ecip
itatio
n(T
otal
ann
ual,
cm)
−20
2
800 1100 1500 1900
2
0
-1
1
-2
3
Yr AD
b
800 1000 1200 1400 1600 1800 2000
26
24
28
Tota
l eco
syst
em C
(Dev
iatio
ns fr
om c
ontro
l, kg
C/m
2 )Pr
ecip
itatio
n(T
otal
ann
ual,
cm)
−10
12
800 1000 1400 1800
Climate pCO2
Fire frequency Fire severity All
Model drivers applied
−6−4
2326
29
800 1100 1400 1700 2000
2326
29
800 1100 1400 1700 2000
−6−4
Temperature
(Mean annual, °C
)
-3
-4
-6
-5
Temperature
(Mean annual, °C
)
-3
-4
-6
-5
Supplementary Figure 4. Sensitivity analysis results using alternative past-millennium climate drivers simulated by GISS-E2-R (a) and CCSM4 (b). For each analysis, the lower panel compares temperature and precipitation trends from the alternate dataset (black) to values from the MPI-ESM drivers used in the simulations described in the main text (grey), and the upper panel illustrates the influence of the alternate climate dataset on simulated carbon stocks in the suite of experiments shown in Fig. 1a (i.e., with model drivers applied in combination [black] or individually [colors; see legend]).
6 NATURE CLIMATE CHANGE | www.nature.com/natureclimatechange
SUPPLEMENTARY INFORMATION DOI: 10.1038/NCLIMATE2832
© 2015 Macmillan Publishers Limited. All rights reserved

6
spModern spPaleo
020
4060
80100
120
140
Stan
d ag
e
Supplementary Figure 3. Boxplot of stand ages in 1950 AD, as generated by spin-up simulations for spModern and spPaleo model experiments.
Supplementary Figure 3. Boxplot of stand ages in 1950 AD, as generated by spin-up simulations for spModern and spPaleo model experiments.
7
Supplementary Figure 4. Sensitivity analysis results using alternative past-millennium climate drivers simulated by GISS-E2-R (a) and CCSM4 (b). For each analysis, the lower panel compares temperature and precipitation trends from the alternate dataset (black) to values from the MPI-ESM drivers used in the simulations described in the main text (grey), and the upper panel illustrates the influence of the alternate climate dataset on simulated carbon stocks in the suite of experiments shown in Fig. 1a (i.e., with model drivers applied in combination [black] or individually [colors; see legend]).
−20
2800 1100 1500 1900
2
0
-1
1
-2
3
Yr AD
a
800 1000 1200 1400 1600 1800 2000
26
24
28
Tota
l eco
syst
em C
(Dev
iatio
ns fr
om c
ontro
l, kg
C/m
2 )Pr
ecip
itatio
n(T
otal
ann
ual,
cm)
−20
2
800 1100 1500 1900
2
0
-1
1
-2
3
Yr AD
b
800 1000 1200 1400 1600 1800 2000
26
24
28
Tota
l eco
syst
em C
(Dev
iatio
ns fr
om c
ontro
l, kg
C/m
2 )Pr
ecip
itatio
n(T
otal
ann
ual,
cm)
−10
12
800 1000 1400 1800
Climate pCO2
Fire frequency Fire severity All
Model drivers applied
−6−4
2326
29
800 1100 1400 1700 2000
2326
29
800 1100 1400 1700 2000
−6−4
Temperature
(Mean annual, °C
)
-3
-4
-6
-5
Temperature
(Mean annual, °C
)
-3
-4
-6
-5
Supplementary Figure 4. Sensitivity analysis results using alternative past-millennium climate drivers simulated by GISS-E2-R (a) and CCSM4 (b). For each analysis, the lower panel compares temperature and precipitation trends from the alternate dataset (black) to values from the MPI-ESM drivers used in the simulations described in the main text (grey), and the upper panel illustrates the influence of the alternate climate dataset on simulated carbon stocks in the suite of experiments shown in Fig. 1a (i.e., with model drivers applied in combination [black] or individually [colors; see legend]).
NATURE CLIMATE CHANGE | www.nature.com/natureclimatechange 7
SUPPLEMENTARY INFORMATIONDOI: 10.1038/NCLIMATE2832
© 2015 Macmillan Publishers Limited. All rights reserved

8
050
150
800 1100 1400 1700 2000
−20
2
800 1100 1500 1900
Supplementary Figure 5. Sensitivity analyses on past-millennium fire inputs, including model experiments based on (a) fire frequency inferred from paleodata with variance artificially reduced, (b) fire severity inferred from paleodata and defined to span the full range of modern observations, and (c) fires assumed to occur randomly with respect to simulated stand age. For each analysis, the lower panel compares the alternate driver (black) to the version described in the main text (grey), and the upper panel illustrates the influence of the alternate driver on simulated carbon stocks in the suite of experiments shown in Fig. 1a (i.e., with model drivers applied in combination [black] or individually [colors; see legend]).
a b
−20
2
800 1100 1500 1900
0.005
0.015
800 1100 1400 1700 2000
2
0
-1
1
-2
3
Yr AD
800 1000 1200 1400 1600 1800 2000
Tota
l eco
syst
em C
(Dev
iatio
ns fr
om c
ontro
l, kg
C/m
2 )
Fire frequency (fires / kyr)
20
5
10
15
−20
2
800 1100 1500 1900
0.0
0.4
0.8
800 1100 1400 1700 2000
2
0
-1
1
-2
3
Yr AD
800 1000 1200 1400 1600 1800 2000
Tota
l eco
syst
em C
(Dev
iatio
ns fr
om c
ontro
l, kg
C/m
2 )
Fire severity (proportion of S
OM
consumed)
1.0
0
0.6
0.8
0.4
0.2
−10
12
800 1000 1400 1800
Climate pCO2
Fire frequency Fire severity All
Model drivers applied
2
0
-1
1
-2
3
Yr AD
800 1000 1200 1400 1600 1800 2000
Tota
l eco
syst
em C
(Dev
iatio
ns fr
om c
ontro
l, kg
C/m
2 )M
edian stand age (yr since last fire)
150
0
100
50
c
Supplementary Figure 5. Sensitivity analyses on past-millennium fire inputs, including model experiments based on (a) fire frequency inferred from paleodata with variance artificially reduced, (b) fire severity inferred from paleodata and defined to span the full range of modern observations, and (c) fires assumed to occur randomly with respect to simulated stand age. For each analysis, the lower panel compares the alternate driver (black) to the version described in the main text (grey), and the upper panel illustrates the influence of the alternate driver on simulated carbon stocks in the suite of experiments shown in Fig. 1a (i.e., with model drivers applied in combination [black] or individually [colors; see legend]).
9
Year AD
8
0
20
4
12
16
1940 1960 1980 2000 1950 1970 1990 2010
a
800 1200 1600 2000 1000 1400 1800
Tota
l Eco
syst
em c
arbo
n (k
gC/m
2 )
-3
2
0
-2
1
-1
Cum
ulat
ive
chan
ge s
ince
195
0 A
D (k
gC/m
2 )
Sou
rce
Sin
k
Supplementary Figure 6. Sensitivity of results to uncertainty in reconstructed fire frequency of the past millennium. The spPaleo experiment discussed in the main text and shown in Fig. 2 (grey; refer to Fig. 2 caption for details) is compared to sensitivity experiments (black) driven by the upper and lower limits of the 90% confidence interval on fire frequency estimated from paleodata.
b
04
812
18
800 1100 1400 1700 2000
1940 1960 1980 2000
−3.5
−2.0
−0.5
0.5
1.5
Supplementary Figure 6. Sensitivity of results to uncertainty in reconstructed fire frequency of the past millennium. The spPaleo experiment discussed in the main text and shown in Fig. 2 (grey; refer to Fig. 2 caption for details) is compared to sensitivity experiments (black) driven by the upper and lower limits of the 90% confidence interval on fire frequency estimated from paleodata.
8 NATURE CLIMATE CHANGE | www.nature.com/natureclimatechange
SUPPLEMENTARY INFORMATION DOI: 10.1038/NCLIMATE2832
© 2015 Macmillan Publishers Limited. All rights reserved
8
050
150
800 1100 1400 1700 2000
−20
2
800 1100 1500 1900
Supplementary Figure 5. Sensitivity analyses on past-millennium fire inputs, including model experiments based on (a) fire frequency inferred from paleodata with variance artificially reduced, (b) fire severity inferred from paleodata and defined to span the full range of modern observations, and (c) fires assumed to occur randomly with respect to simulated stand age. For each analysis, the lower panel compares the alternate driver (black) to the version described in the main text (grey), and the upper panel illustrates the influence of the alternate driver on simulated carbon stocks in the suite of experiments shown in Fig. 1a (i.e., with model drivers applied in combination [black] or individually [colors; see legend]).
a b
−20
2
800 1100 1500 1900
0.005
0.015
800 1100 1400 1700 2000
2
0
-1
1
-2
3
Yr AD
800 1000 1200 1400 1600 1800 2000
Tota
l eco
syst
em C
(Dev
iatio
ns fr
om c
ontro
l, kg
C/m
2 )
Fire frequency (fires / kyr)
20
5
10
15
−20
2
800 1100 1500 1900
0.0
0.4
0.8
800 1100 1400 1700 2000
2
0
-1
1
-2
3
Yr AD
800 1000 1200 1400 1600 1800 2000
Tota
l eco
syst
em C
(Dev
iatio
ns fr
om c
ontro
l, kg
C/m
2 )
Fire severity (proportion of S
OM
consumed)
1.0
0
0.6
0.8
0.4
0.2
−10
12
800 1000 1400 1800
Climate pCO2
Fire frequency Fire severity All
Model drivers applied
2
0
-1
1
-2
3
Yr AD
800 1000 1200 1400 1600 1800 2000
Tota
l eco
syst
em C
(Dev
iatio
ns fr
om c
ontro
l, kg
C/m
2 )
Median stand age (yr since last fire)
150
0
100
50
c
Supplementary Figure 5. Sensitivity analyses on past-millennium fire inputs, including model experiments based on (a) fire frequency inferred from paleodata with variance artificially reduced, (b) fire severity inferred from paleodata and defined to span the full range of modern observations, and (c) fires assumed to occur randomly with respect to simulated stand age. For each analysis, the lower panel compares the alternate driver (black) to the version described in the main text (grey), and the upper panel illustrates the influence of the alternate driver on simulated carbon stocks in the suite of experiments shown in Fig. 1a (i.e., with model drivers applied in combination [black] or individually [colors; see legend]).
9
Year AD
8
0
20
4
12
16
1940 1960 1980 2000 1950 1970 1990 2010
a
800 1200 1600 2000 1000 1400 1800
Tota
l Eco
syst
em c
arbo
n (k
gC/m
2 )
-3
2
0
-2
1
-1
Cum
ulat
ive
chan
ge s
ince
195
0 A
D (k
gC/m
2 )
Sou
rce
Sin
k
Supplementary Figure 6. Sensitivity of results to uncertainty in reconstructed fire frequency of the past millennium. The spPaleo experiment discussed in the main text and shown in Fig. 2 (grey; refer to Fig. 2 caption for details) is compared to sensitivity experiments (black) driven by the upper and lower limits of the 90% confidence interval on fire frequency estimated from paleodata.
b
04
812
18
800 1100 1400 1700 2000
1940 1960 1980 2000
−3.5
−2.0
−0.5
0.5
1.5
Supplementary Figure 6. Sensitivity of results to uncertainty in reconstructed fire frequency of the past millennium. The spPaleo experiment discussed in the main text and shown in Fig. 2 (grey; refer to Fig. 2 caption for details) is compared to sensitivity experiments (black) driven by the upper and lower limits of the 90% confidence interval on fire frequency estimated from paleodata.
NATURE CLIMATE CHANGE | www.nature.com/natureclimatechange 9
SUPPLEMENTARY INFORMATIONDOI: 10.1038/NCLIMATE2832
© 2015 Macmillan Publishers Limited. All rights reserved
10
Supplementary Tables
Supplementary Table 1. Percent of variability in simulated total ecosystem carbon stocks attributed to different forcing variables.
Sensitivity Analyses
Forcing Variable Main Text Alternate Climate: GISS-E2-R
Alternate Climate: CCSM4
Fire Frequency Variability Reduced
Fire Severity Variability Increased
Area Burned Randomly Distributed
Fire frequency 83.5 87.7 75.1 64.3 59.0 85.0
Fire severity 14.6 10.3 15.0 32.3 40.0 12.4
Climate 1.6 1.7 9.6 3.1 0.7 1.7
pCO2 <0.1 0.2 <0.1 <0.1 <0.1 <0.1
Columns contrast results described in the main text with various sensitivity analyses. See Methods and Supplementary Discussion for details.
10 NATURE CLIMATE CHANGE | www.nature.com/natureclimatechange
SUPPLEMENTARY INFORMATION DOI: 10.1038/NCLIMATE2832
© 2015 Macmillan Publishers Limited. All rights reserved