pakistan - kp
TRANSCRIPT

PAKISTAN
FARHAT ABBAS DURRANIDIRECTORATE GENERAL AGRICULTURE EXTENSION,
KHYBER PAKHTUNKHWA, PAKISTAN
WELCOME
BENVENUTO

PAKI
STAN
AT
GLA
NCE • Important Islamic State
• Stretches over 1600kms north-south, 800kms east-west, and 1064kms along the costal-line of Arabian Sea
• Gateway of Central Asia and only way to reach Persian Gulf through central Asia, that’s why get important position in Sub-continent Asia
• Pakistan in this magnificent era of 21st Century have a lot of Blessing of Allah.
• Population of Pakistan is 184.35 Million (2012-13 Estimates) With a growth rate of 2.69% (1998 Census).
• Khyber Pakhtunkhwa share with 27.932 Million (i.e. 15% of Pakistan ‘s Population) with a growth rate of 2.82% (1998 Census).
Pakistan 21st Century

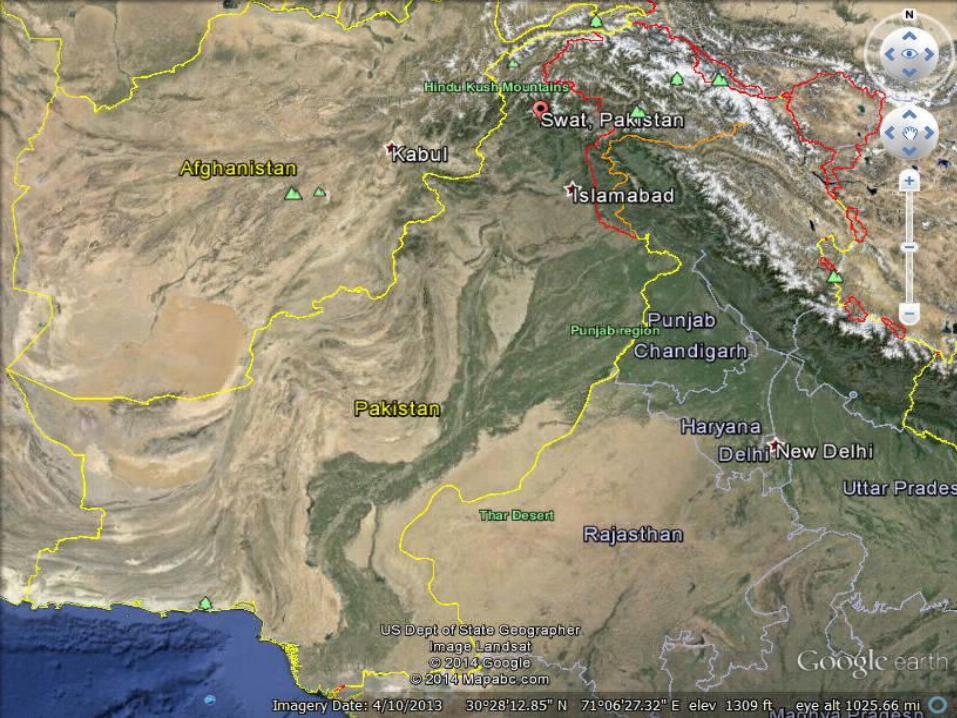
MAP OF PAKISTANLOCATION AND NEIGHBOUR HOOD
Location:• Pakistan is located
between 23 degrees North to 37 degrees North Latitude and 61 degrees East to 77 degrees East Longitude.
Neighbours:China lies in the north Afghanistan and Iran are in the West India lies in the East and Arabian Sea in South

AGRICULTURE• Pakistan's principal natural
resources are arable land and water. Punjab is the largest province with wheat and cotton as major crop.
• Khyber Pakhtunkhwa and Baluchistan are blessed with favourable environment for horticulture and produces almost all kinds of fruits (tropical and sub tropical)
• Sugarcane and cereal crops are also harvested at large scale.
• Pakistan’s export reserves consist largely of agricultural products.
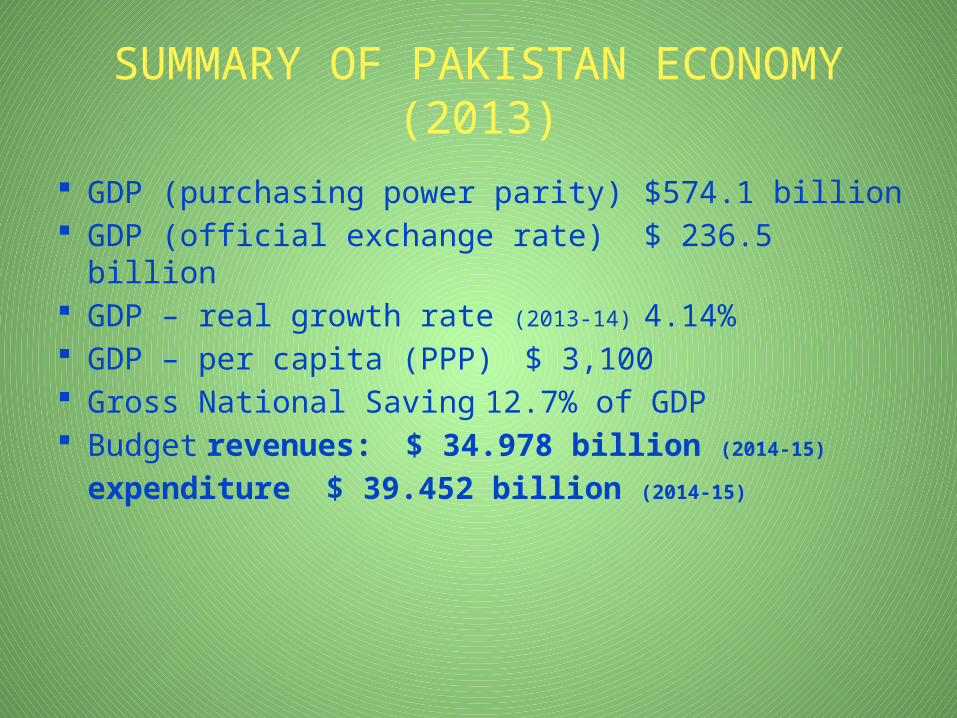
SUMMARY OF PAKISTAN ECONOMY(2013)
GDP (purchasing power parity) $574.1 billion GDP (official exchange rate) $ 236.5 billion GDP – real growth rate (2013-14) 4.14% GDP – per capita (PPP) $ 3,100 Gross National Saving 12.7% of GDP Budget revenues: $ 34.978 billion (2014-15)
expenditure $ 39.452 billion (2014-15)

STATISTICAL ABSTRACT OF AGRICULTURE
S.No. Items PakistanKhyber
Pakhtunkhwa% Share of Khyber
Pakhtunkhwai) Wheat 24231 1150 4.75%ii) Rice 5541 78 1.41%iii) Jowar 122 4 3.28%iv) Bajra/Millet 310 2 0.65%v) Maize 4631 834 18.01%vi) Sugarcane 62472 4741 7.59%vii) Barley 62 13 20.97%viii) Gram 673 19 2.82%ix) Rape Seed & Mustard 153 7 4.58%x) Seasamum 29 0.07 0.24%xi) Cotton 2215 0.15 0.01%xii) Tobacco 97 83 85.57%
Production “000” Tonnes

Agriculture21%
Industries21%
Services58%
SECTORAL GDP SHARE
Source: Economic Survey of Pakistan 2013-14

2008-09 2009-10 2010-11 2011-12 2012-13 2013-14
0.40%
2.60%
3.62%3.84% 3.70%
4.14%
GDP REAL GROWTH
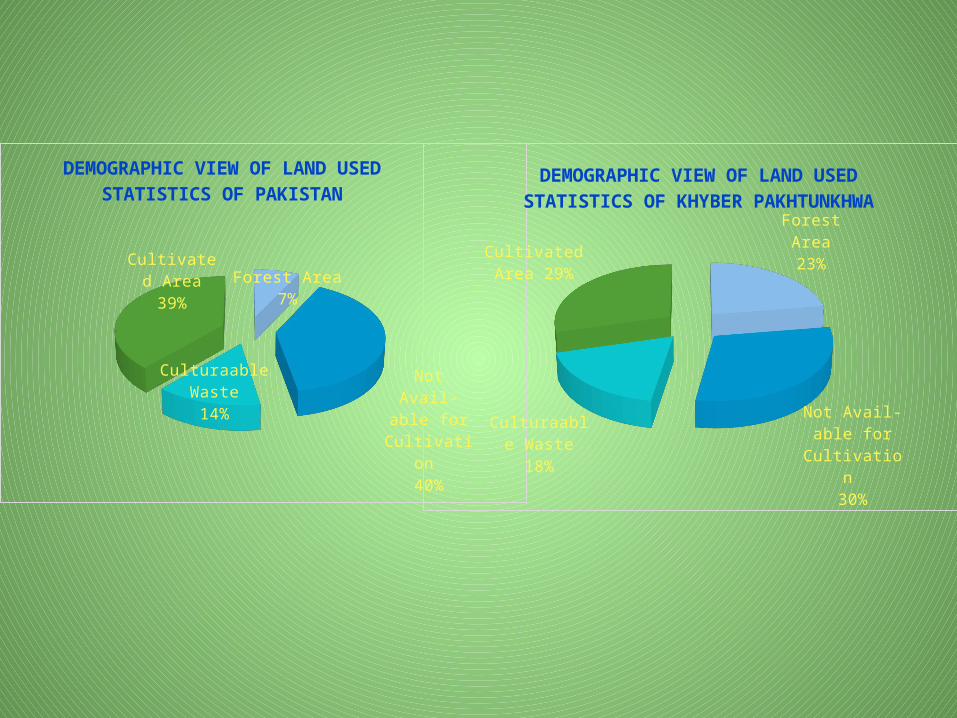
Forest Area7%
Not Avail-able for Cultivation
40%Culturaable Waste
14%
Cultivated Area 39%
DEMOGRAPHIC VIEW OF LAND USED STATISTICS OF PAKISTAN
Forest Area23%
Not Avail-able for Cultivation
30%
Culturaable Waste18%
Cultivated Area 29%
DEMOGRAPHIC VIEW OF LAND USED STATISTICS OF KHYBER PAKHTUNKHWA

LAND USED STATISTICS(PROPORTIONAL %AGE SHARE OF PROVINCE AND
DISTRICT SWAT)
Current Fallow
Net Area Sown
Total Area Cultivated
(6+7)1 2 3 4 5 6 7 8 9 10
Pakistan 79.61 57.74 4.26 23.06 8.22 6.79 15.41 22.2 7.34 22.75
Khyber Pakhtunkhwa 7.452 5.62 1.27 1.687 1.02 0.52 1.13 1.65 0.55 1.68
% of the Pakistan 9.4% 9.7% 29.8% 7.3% 12.4% 7.7% 7.3% 7.4% 7.5% 7.4%
Swat 0.534 0.51 0.14 0.19 0.09 0.00 0.10 0.10 0.08 0.18
% of the Province 7.2% 9.0% 10.7% 11.1% 8.4% 0.0% 8.5% 5.9% 15.3% 10.7%
Area Sown more than
once
Total Cropped
Area(7+9)
Country/Province/
District Swat
Cultivated Area
Total AreaReported
AreaForest Area
Not Avail-able for
Cultivation
Culturaable Waste
Million Hectares
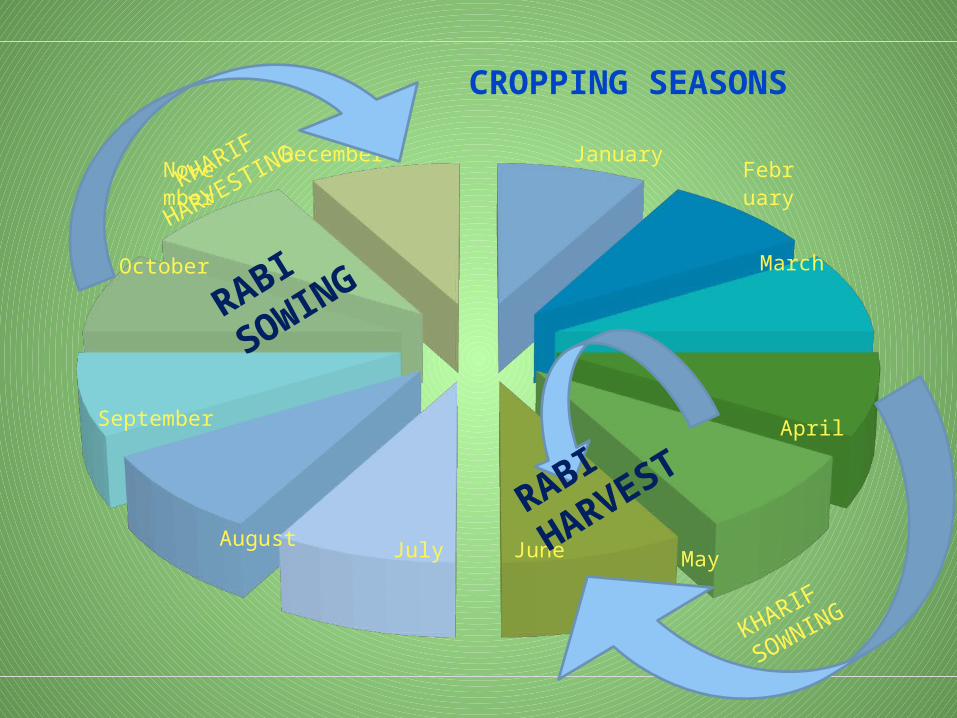
January February
March
April
MayJuneJulyAugust
September
October
NovemberDecember
CROPPING SEASONS
KHARIF SOWNING
KHARIF HARVESTING
RABI HARVEST
RABI SOWING

AREA IRRIGATED BY DIFFERENT SOURCES
PAKISTAN
Canals 5.82 Mill HectaresWells 0.32 -do-Canal Wells 0.19 -do-Tube wells 4.03 -do-Canal Tube wells 7.86 -do-Others 0.22 -do-
KHYBER PAKHTUNKHWA
Canals 0.606 Mill HectaresWells 0.040 -do-Tube wells 0.074 -do-Tank/Lift Pumps 0.057 -do-Others
SWAT DISTRICT
Canals 0.042 Mill HectaresWells 0.016 -do-Tube wells 0.008 -do-Tank/Lift Pumps 0.023 -do-Others
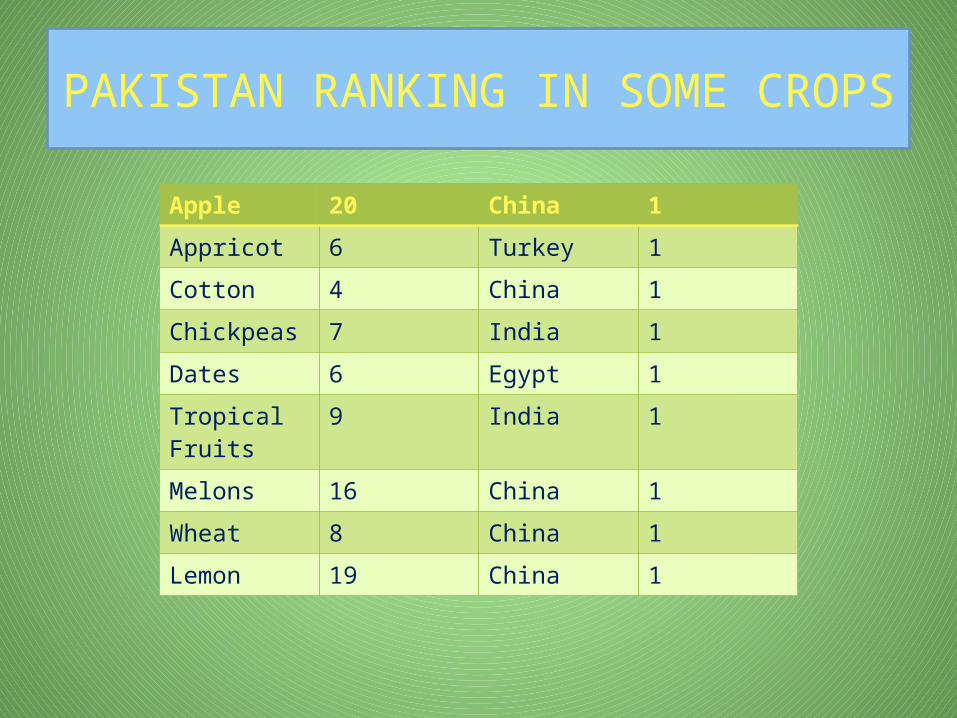
PAKISTAN RANKING IN SOME CROPS
Apple 20 China 1
Appricot 6 Turkey 1
Cotton 4 China 1
Chickpeas 7 India 1
Dates 6 Egypt 1
Tropical Fruits 9 India 1
Melons 16 China 1
Wheat 8 China 1
Lemon 19 China 1
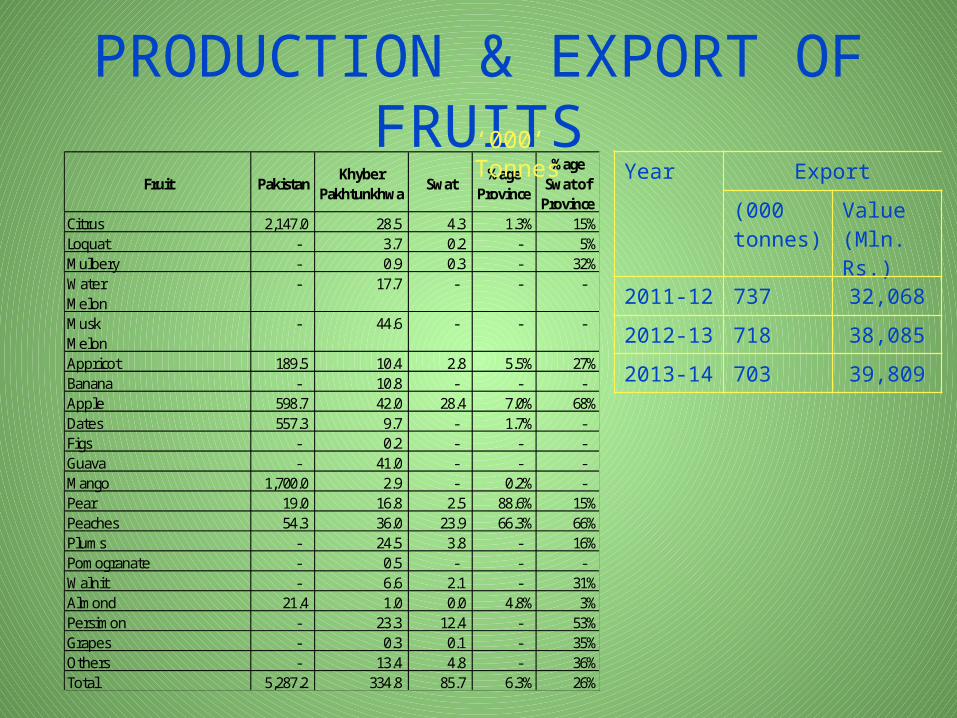
PRODUCTION & EXPORT OF FRUITSFruit Pakistan
KhyberPakhtunkhwa
Swat%age
Province
%ageSwat of
ProvinceCitrus 2,147.0 28.5 4.3 1.3% 15%Loquat - 3.7 0.2 - 5%Mulbery - 0.9 0.3 - 32%Water Melon
- 17.7 - - -
MuskMelon
- 44.6 - - -
Appricot 189.5 10.4 2.8 5.5% 27%Banana - 10.8 - - - Apple 598.7 42.0 28.4 7.0% 68%Dates 557.3 9.7 - 1.7% - Figs - 0.2 - - - Guava - 41.0 - - - Mango 1,700.0 2.9 - 0.2% - Pear 19.0 16.8 2.5 88.6% 15%Peaches 54.3 36.0 23.9 66.3% 66%Plums - 24.5 3.8 - 16%Pomogranate - 0.5 - - - Walnit - 6.6 2.1 - 31%Almond 21.4 1.0 0.0 4.8% 3%Persimon - 23.3 12.4 - 53%Grapes - 0.3 0.1 - 35%Others - 13.4 4.8 - 36%Total 5,287.2 334.8 85.7 6.3% 26%
‘000’ TonnesYear Export
(000 tonnes)
Value(Mln. Rs.)
2011-12 737 32,068
2012-13 718 38,085
2013-14 703 39,809

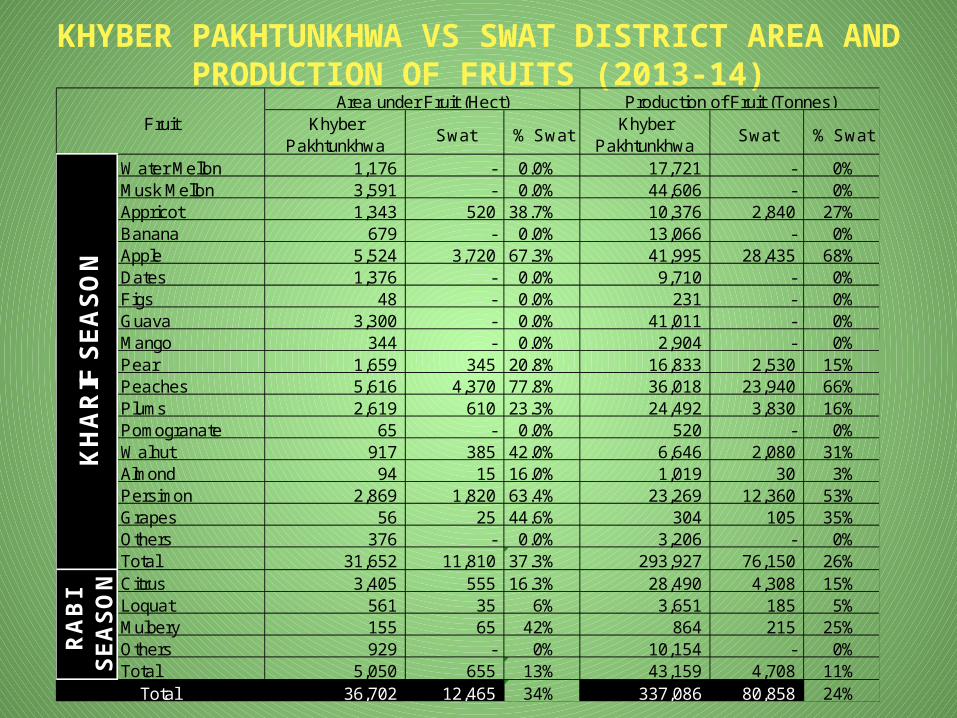
KHYBER PAKHTUNKHWA VS SWAT DISTRICT AREA AND PRODUCTION OF FRUITS (2013-14)
Khyber Pakhtunkhwa
Swat % SwatKhyber
PakhtunkhwaSwat % Swat
Water Mellon 1,176 - 0.0% 17,721 - 0%Musk Mellon 3,591 - 0.0% 44,606 - 0%Appricot 1,343 520 38.7% 10,376 2,840 27%Banana 679 - 0.0% 13,066 - 0%Apple 5,524 3,720 67.3% 41,995 28,435 68%Dates 1,376 - 0.0% 9,710 - 0%Figs 48 - 0.0% 231 - 0%Guava 3,300 - 0.0% 41,011 - 0%Mango 344 - 0.0% 2,904 - 0%Pear 1,659 345 20.8% 16,833 2,530 15%Peaches 5,616 4,370 77.8% 36,018 23,940 66%Plums 2,619 610 23.3% 24,492 3,830 16%Pomogranate 65 - 0.0% 520 - 0%Walnut 917 385 42.0% 6,646 2,080 31%Almond 94 15 16.0% 1,019 30 3%Persimon 2,869 1,820 63.4% 23,269 12,360 53%Grapes 56 25 44.6% 304 105 35%Others 376 - 0.0% 3,206 - 0%Total 31,652 11,810 37.3% 293,927 76,150 26%Citrus 3,405 555 16.3% 28,490 4,308 15%Loquat 561 35 6% 3,651 185 5%Mulbery 155 65 42% 864 215 25%Others 929 - 0% 10,154 - 0%Total 5,050 655 13% 43,159 4,708 11%
36,702 12,465 34% 337,086 80,858 24%
Area under Fruit (Hect) Production of Fruit (Tonnes)K
HA
RIF
SE
AS
ON
RA
BI
SE
AS
ON
Total
Fruit

ISTITUTO AGRONOMICO PER L’ OLTREMARE (IAO) Florence.
• IAO launched two phases Development Programme.
• First Development Programme covers Fruit Processing
• Second Development Programme is of 3 folds: – Off Season Vegetable Promotion in Upper Swat. – Promotion of Hill Orchards & Mushroom cultivation. – Gender Skill Development (Birds + Kitchen
Gardening)

Project BudgetAllocated
Budget Released
Percent (%)
Expenditure Balance Remarks
A Project-I 68.844 68.844 100% 68.844 - Completed B Project-II1 1st Installment 2.999 30% 2.999 - 2 2nd Installment 2.999 30% 2.299 0.700 3 3rd Installment - 30% - - 4 4th Installment - 10% - -
Total:- Total Project-II 9.966 5.998 100% 5.298 0.700
BUDGET RELEASE AND EXPENDITURE (PKR)for 2013-14
9.966 Work is in progress.
S.No.
BUDGET(AGRICULTURE EXTENSION COMPONENT)
PKRS IN MILLION

IAO DEVELOPMENT PROJECT(S) OBJECTIVES
• “Technical assistance and support to fruit and vegetable growers in the Swat Valley for the improvement of production and marketing in the horticultural value chain”
• To promote off-season vegetable in Madyan by increasing area under off –season vegetable by 20% through community awareness.
• To enhance productivity and incomes of small farmers by 30% through skill enhancement of farmers by adopting Best Agriculture Practices.
• To get all the (5) FSCs in Swat, registered under MFSC act 2013 and transform it into self reliance cooperatives.
• To involve the women folk in the development process by registering them as FSC members.
• To generate job opportunities, reduce un- employment and ensure peace.

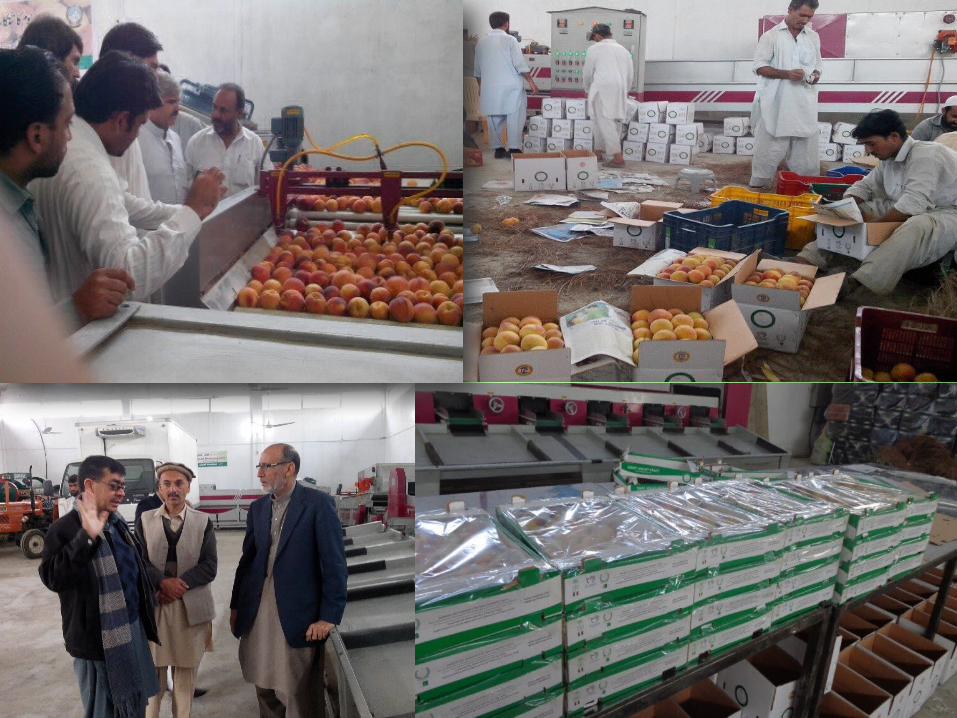
ACHIEVEMENTS OF PROJECT-I• Two numbers grading units have been established one each in FSC Matta and Kabal.
• Two agriculture offices have been rehabilitated and well equipped with office materials.
• Two separate bank accounts has been opened for each unit and seed money has been provided as a revolving funds.
• Two pickups have been handed over to MCs FSC for collection of fruit.
• Two refrigerated trucks have been allotted as part of cool chain.
• One cold room each in Kabala and Matta has been constructed for reducing field heat and storing the fruit.

PROGRESS GRADING PROCESSING PLANTS
• During the current season both the grading lines have started work on peaches on test basis. A campaign was launched through agriculture field staff for community awareness to avail the facility.
• A message was also floated on local FM radio for mass awareness of the fruit producers in the area.
• During the current season in total ninety six (96) tons of fruits have been graded. Out of which 77.5 tons were peaches and 18.5 tons apple has been graded that fetched comparatively good prices in the market ie. Rs. 10-25 per kg.
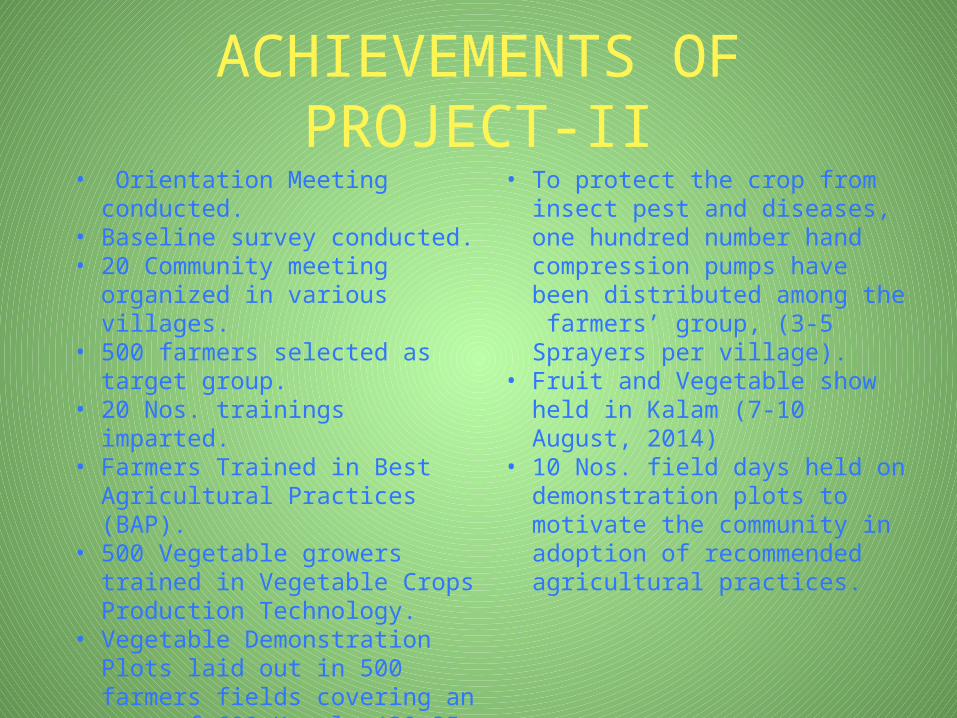
ACHIEVEMENTS OF PROJECT-II• Orientation Meeting conducted. • Baseline survey conducted. • 20 Community meeting organized in
various villages. • 500 farmers selected as target group.• 20 Nos. trainings imparted. • Farmers Trained in Best Agricultural
Practices (BAP). • 500 Vegetable growers trained in
Vegetable Crops Production Technology.
• Vegetable Demonstration Plots laid out in 500 farmers fields covering an area of 600 Kanals (30.35 hectares)
• To protect the crop from insect pest and diseases, one hundred number hand compression pumps have been distributed among the farmers’ group, (3-5 Sprayers per village).
• Fruit and Vegetable show held in Kalam (7-10 August, 2014)
• 10 Nos. field days held on demonstration plots to motivate the community in adoption of recommended agricultural practices.

AVERAGE COST OF PRODUCTION OF DRIED FRUIT (BEING PROCESSED IN SWAT DISTRICT)
Fruit Fresh Fruit Qty(Kgs)
Value of Fresh Fruit(PKRs)
DriedWeight(Kgs)
ChemicalCharges(PKRS/Kg)
LabourCost(PKRS/KG)
PakagingCost(PKRS/KG)
Total Per Kg Drying Cost(PKRS)
Avg Market Value (PKRS/KG)
Peach 10 120 to 150 160-190 350 to 500
Persimon 4 to 5 80 to 100 120 to 140 400 to 700
Apple 7 to 8 100 to 120 140 to 160 350 to 500
101 10 20
NOTE: Drying peaches is more difficult as compared to other two crops because of high percentage of humidity during the period of drying.
AGRICULTURE DEVELOPMENT PROJECT IN SWAT VALLEY - GENDER, COOPERATIVES AND HILL ORCHARDS
(ADP-Swat2- GECOHO)
“GENDER COMPONENT”

Sr # Titles Budget Expenditure Balance 1 TNA (5 person team) 0.150 0.149 0.001 2 Hoteling for TNA team 0.060 0.060 0.000 3 Training Module Development 0.525 - 0.525 4 70 Trainings (3 days each) with 2 Resource Persons 1.400 0.387 1.013 5 Hoteling for Training team 0.840 0.236 0.604 6 Lunch & Teas during Trainings 2.450 0.162 2.288 7 Training Report Writing 0.175 - 0.175 8 Team Leader 0.300 0.200 0.100 9 Support staff 0.050 0.050 -
10 POL/Repair/Travelling 0.300 0.340 -0.040 11 Kits 4.500 1.196 3.305 12 Training materials (like printing materials, brochures etc) 0.350 0.089 0.261 13 Stationery/Printing/Copying 0.100 0.011 0.089 14 Monitoring visits Honoraria 0.300 0.130 0.170 15 Monitoring team hoteling 0.060 0.074 -0.014 16 Veterinary Consultancy 0.090 - 0.090
Sub Total 11.650 3.081 8.569 17 University Overheads @5% 0.583 - 0.583
Total 12.233 3.081 9.151
Project Title: Agriculture Development Project in Swat - Gender, Cooperatives and Hill Orchards (ADP SWAT 2 - GECOHO) under IAO
Head-wise Re-appropriation (Gender Component)
BUDGET PKRS IN MILLION
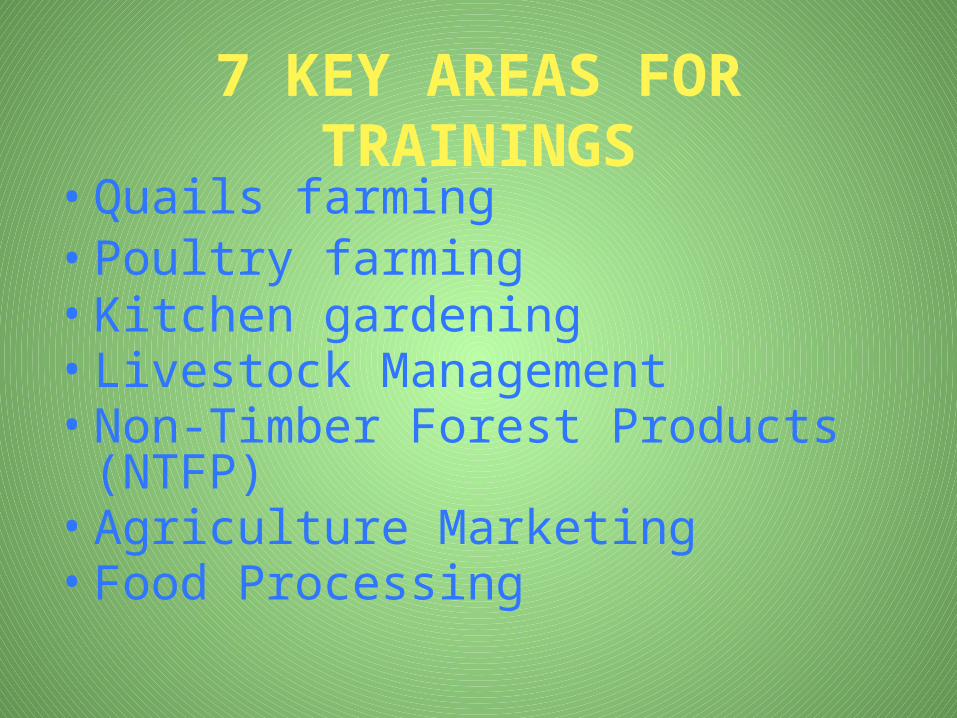
7 KEY AREAS FOR TRAININGS• Quails farming• Poultry farming• Kitchen gardening• Livestock Management• Non-Timber Forest Products (NTFP)• Agriculture Marketing• Food Processing
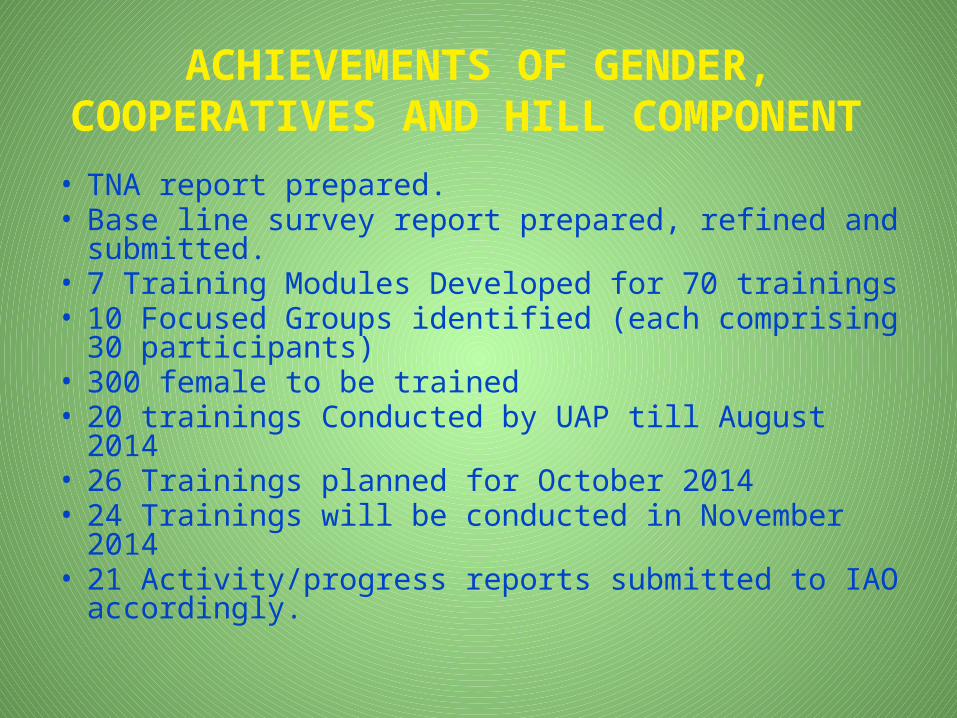
ACHIEVEMENTS OF GENDER, COOPERATIVES AND HILL COMPONENT
• TNA report prepared.• Base line survey report prepared, refined and
submitted.• 7 Training Modules Developed for 70 trainings• 10 Focused Groups identified (each comprising 30
participants)• 300 female to be trained• 20 trainings Conducted by UAP till August 2014• 26 Trainings planned for October 2014• 24 Trainings will be conducted in November 2014• 21 Activity/progress reports submitted to IAO
accordingly.

WATER MELON PRODUCTION IN TONFS - KHYBER PAKHTUNKHWA
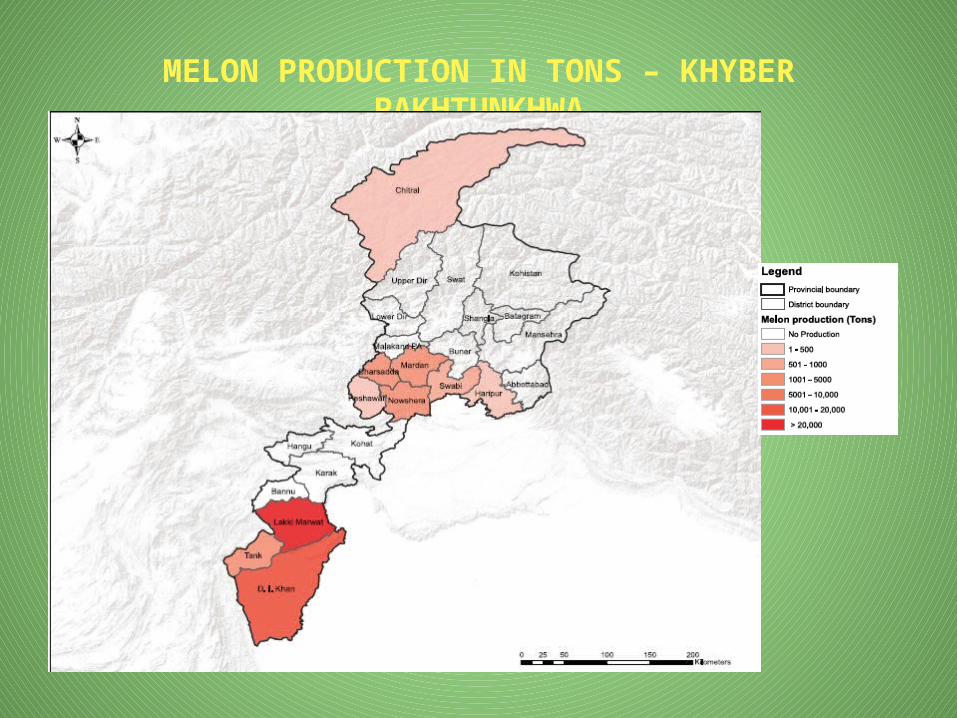
MELON PRODUCTION IN TONS – KHYBER PAKHTUNKHWA

APRICOT PRODUCTION IN TONS – KHYBER PAKHTUNKHWA

BANANA PRODUCTION IN TONS – KHYBER PAKHTUNKHWA

APPLE PRODUCTION IN TONS –KHYBER PAKHTUNKHWA

DATES PRODUCTION IN TONS – KHYBER PAKHTUNKHWA

FIG PRODUCTION IN TONS – KHYBER PAKHTUNKHWA
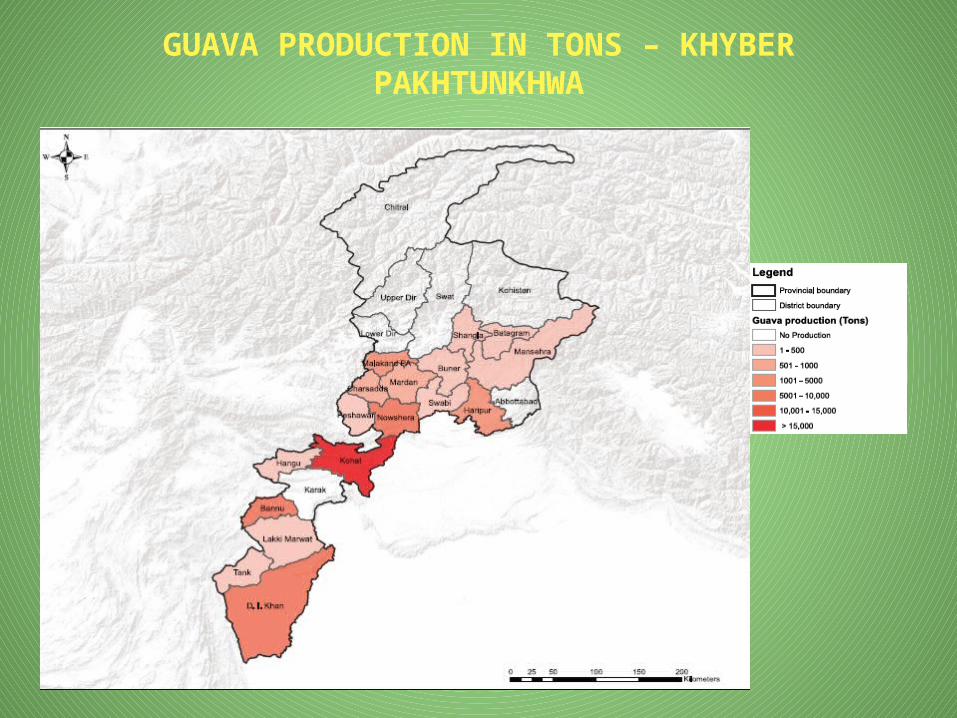
GUAVA PRODUCTION IN TONS – KHYBER PAKHTUNKHWA
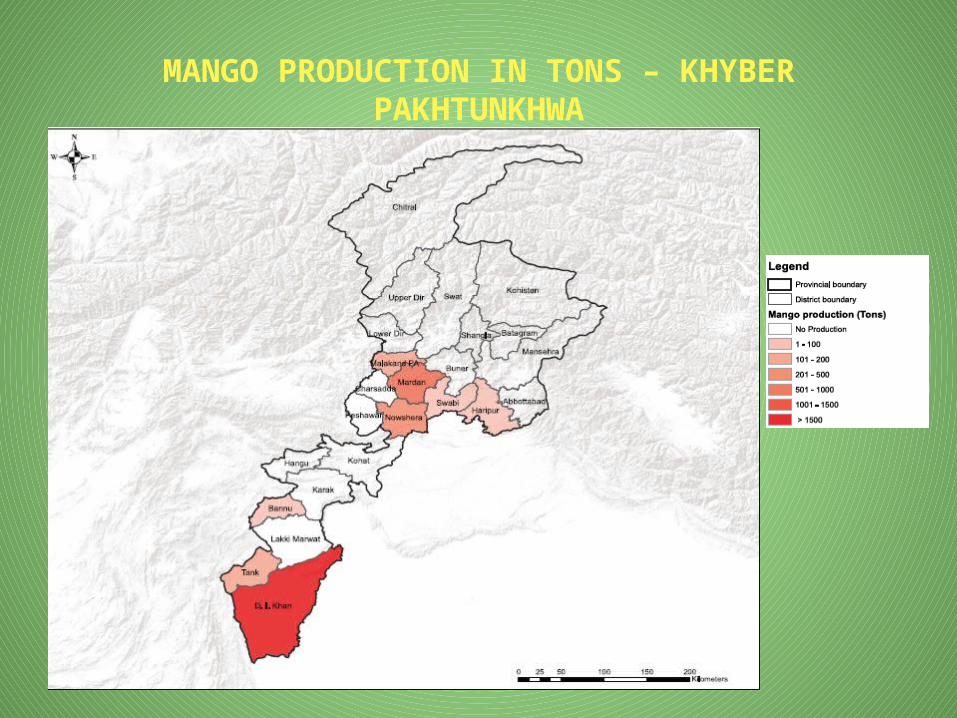
MANGO PRODUCTION IN TONS – KHYBER PAKHTUNKHWA

PEAR PRODUCTION IN TONS – KHYBER PAKHTUNKHWA

PEACH PRODUCTION IN TONS – KHYBER PAKHTUNKHWA

PLUM PRODUCTION IN TONS – KHYBER PAKHTUNKHWA

POMEGRANATE PRODUCTION IN TONS – KHYBER PAKHTUNKHWA

WALNUT PRODUCTION IN TONS – KHYBER PAKHTUNKHWA
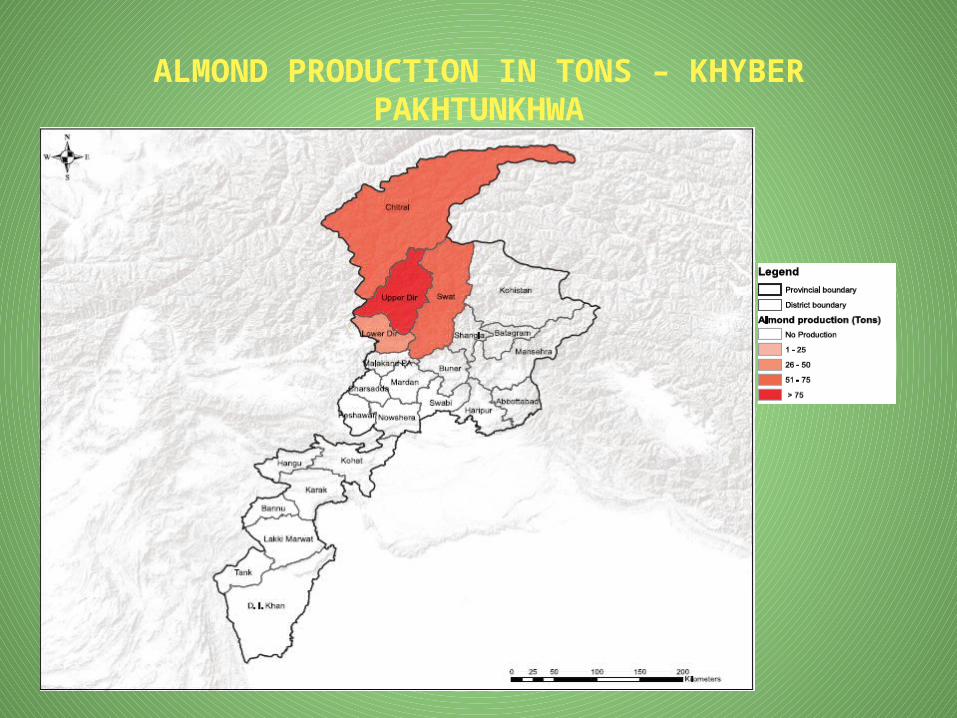
ALMOND PRODUCTION IN TONS – KHYBER PAKHTUNKHWA

PERSIMON PRODUCTION IN TONS – KHYBER PAKHTUNKHWA

GRAPS PRODUCTION IN TONS – KHYBER PAKHTUNKHWA

CITRUS PRODUCTION IN TONS – KHYBER PAKHTUNKHWA

LOQUATE PRODUCTION IN TONS – KHYBER PAKHTUNKHWA

MULBERY PRODUCTION IN TONS – KHYBER PAKHTUNKHWA

AGRIBUSINESS OPPORTUNATIES • Fruit and Vegetable processing,
Packaging and its Marketing• Cool Chain Establishment • Setting up of Dehydration Plants • Dates Processing and its export• Setting up of Cane Food Industry/Units

THANK YOU