page 1 sdo briefing to research to operations meeting, october 15, 2007 the solar dynamics...
TRANSCRIPT

Page 1SDO Briefing to Research to Operations Meeting, October 15, 2007
The Solar Dynamics Observatory& TIMED/SEE
W. Dean PesnellSDO Project ScientistTIMED NASA Deputy Project Scientist
Page 2SDO Briefing to Research to Operations Meeting, October 15, 2007
Outline
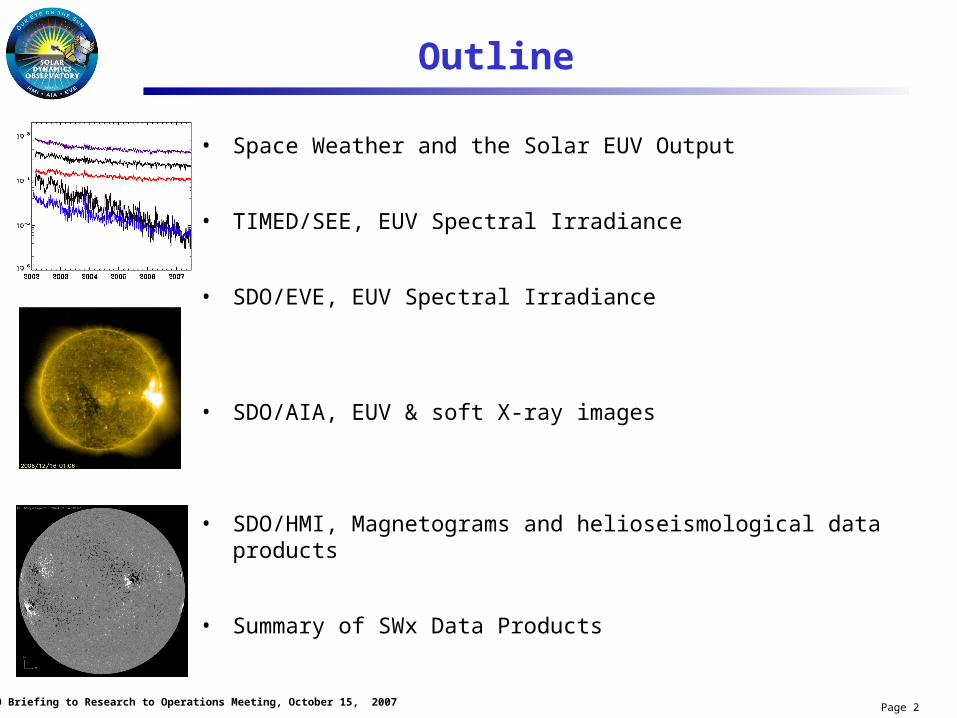
• Space Weather and the Solar EUV Output
• TIMED/SEE, EUV Spectral Irradiance
• SDO/EVE, EUV Spectral Irradiance
• SDO/AIA, EUV & soft X-ray images
• SDO/HMI, Magnetograms and helioseismological data products
• Summary of SWx Data Products
Page 3SDO Briefing to Research to Operations Meeting, October 15, 2007
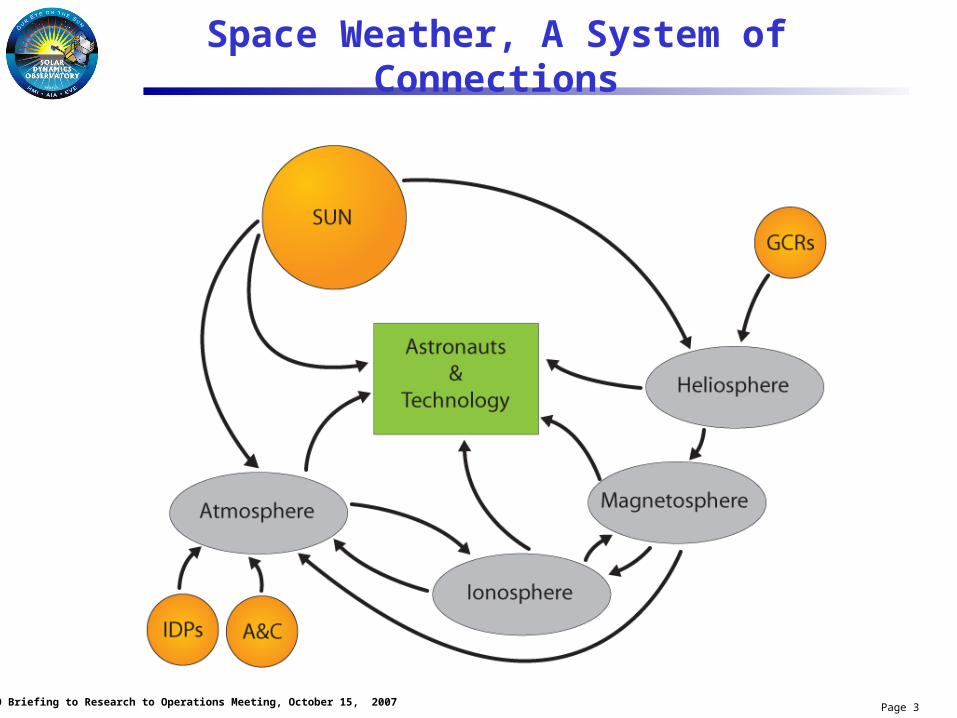
Space Weather, A System of Connections
Page 4SDO Briefing to Research to Operations Meeting, October 15, 2007
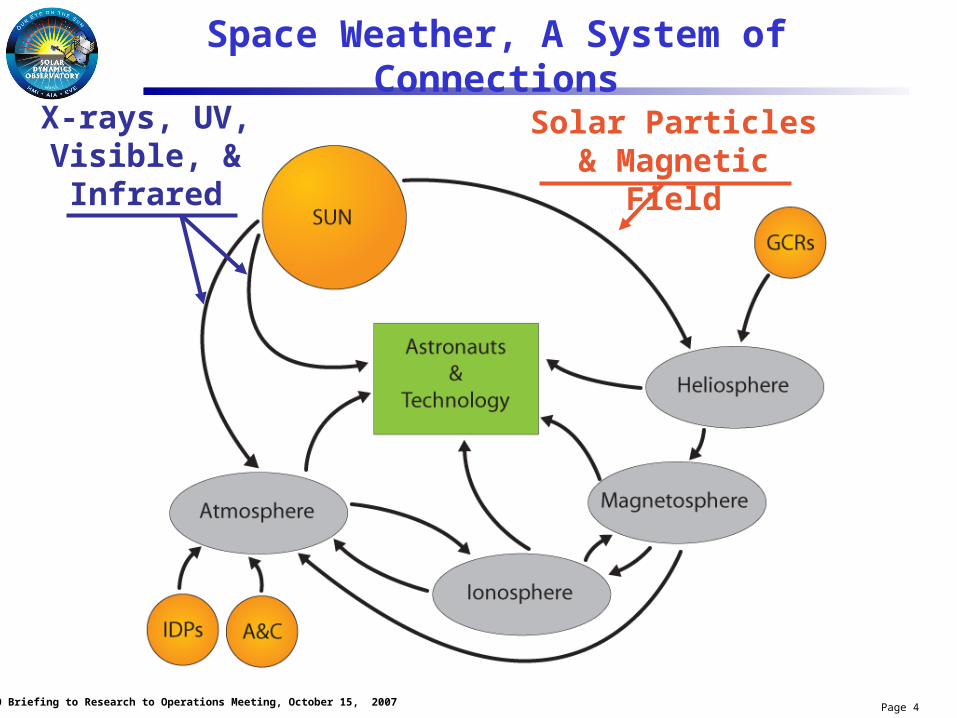
Space Weather, A System of Connections
Solar Particles & Magnetic
Field
X-rays, UV, Visible, & Infrared

Page 5SDO Briefing to Research to Operations Meeting, October 15, 2007
Space Weather from EUV
CME LiftoffX-rays, EUV, FUV, & Flares

Page 6SDO Briefing to Research to Operations Meeting, October 15, 2007
Space Weather from EUV
X-rays, EUV, & FUV are absorbed in the atmosphere …
… and causing satellite drag and interfering with radio communications.
… creating the thermosphere and ionosphere …

Page 7SDO Briefing to Research to Operations Meeting, October 15, 2007
Thermosphere, Ionosphere Energetics and Dynamics (TIMED)
TIMED was launched into a 625 km circular orbit with an inclination of 74.1 degrees aboard a Delta II 7920-10 from the Western Range at Vandenberg Air Force Base, Calif., on Dec. 7, 2001.
The primary goal of the TIMED mission is to understand the MLTI (Mesosphere and Lower Thermosphere/Ionosphere) region’s basic pressure, temperature and wind that result from the transfer of energy into and out of this region.
TIMED’s four instruments are the:
• Global Ultraviolet Imager (GUVI, Goldberg will discuss tomorrow);
• Sounding of the Atmosphere using Broadband Emission Radiometry (SABER);
• Solar Extreme Ultraviolet Experiment (SEE);
• TIMED Doppler Interferometer (TIDI).
QuickTime™ and aTIFF (Uncompressed) decompressor
are needed to see this picture.

Page 8SDO Briefing to Research to Operations Meeting, October 15, 2007
TIMED SEE
QuickTime™ and aTIFF (Uncompressed) decompressor
are needed to see this picture.
QuickTime™ and aTIFF (Uncompressed) decompressor
are needed to see this picture.
EGS is a Rowland-circle grating spectrograph that measures the solar spectral irradiance from 26-195 nm (EUV to FUV). Wavelengths are dispersed across a microchannel plate and measured on a 1024x64 CODACON.
XPS is a suite of broadband X-Ray Photometers that make irradiance measurements of the Sun from 0.1-35 nm and 121.5 nm. Each photometer is a diode with a special coating that provides a bandpass in this wavelength region.
Page 9SDO Briefing to Research to Operations Meeting, October 15, 2007
SEE Data & Research
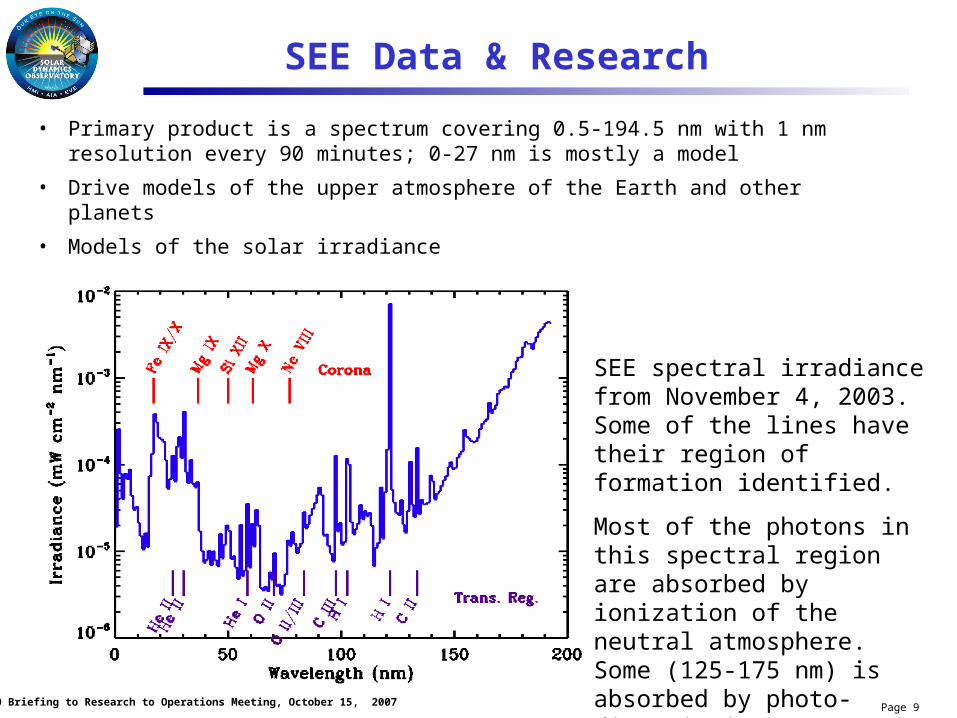
• Primary product is a spectrum covering 0.5-194.5 nm with 1 nm resolution every 90 minutes; 0-27 nm is mostly a model
• Drive models of the upper atmosphere of the Earth and other planets
• Models of the solar irradiance
SEE spectral irradiance from November 4, 2003. Some of the lines have their region of formation identified.
Most of the photons in this spectral region are absorbed by ionization of the neutral atmosphere. Some (125-175 nm) is absorbed by photo-dissociation.

Page 10SDO Briefing to Research to Operations Meeting, October 15, 2007
The EUV, The Heartbeat of the Sun
SEE has made the longest set of solar EUV spectral irradiance measurements. All wavelengths are fading as cycle 23 fades, but the Fe XVI (335) and the broadband X-ray channel are down an order of magnitude or more over the past 5 years. We are only now starting to understand how to use this data in SWx.
Page 11SDO Briefing to Research to Operations Meeting, October 15, 2007
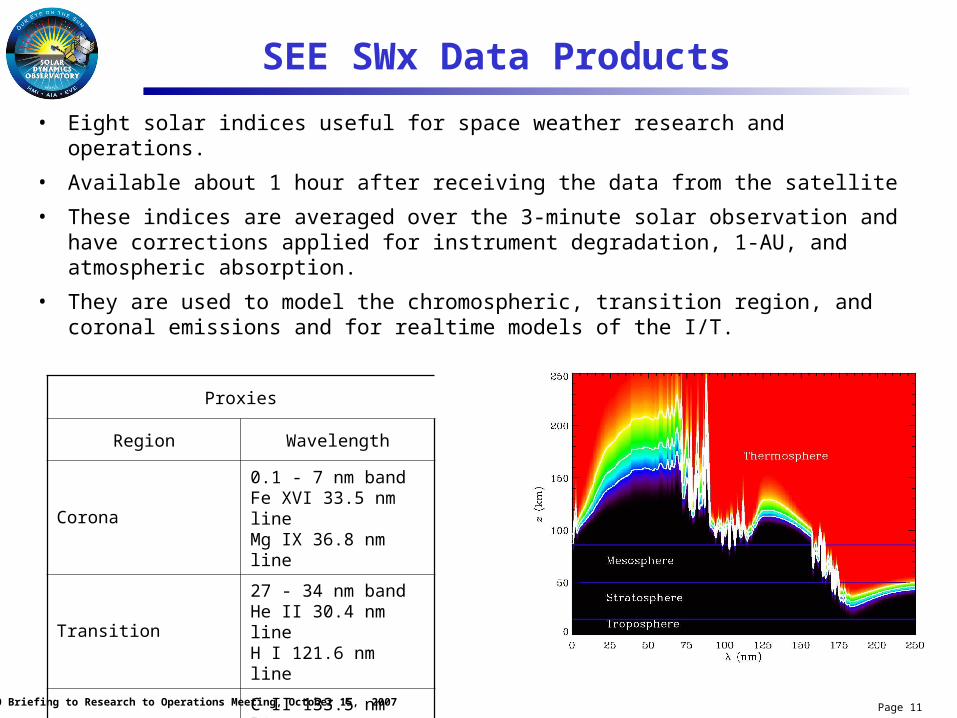
SEE SWx Data Products
• Eight solar indices useful for space weather research and operations.
• Available about 1 hour after receiving the data from the satellite
• These indices are averaged over the 3-minute solar observation and have corrections applied for instrument degradation, 1-AU, and atmospheric absorption.
• They are used to model the chromospheric, transition region, and coronal emissions and for realtime models of the I/T.
Proxies
Region Wavelength
Corona0.1 - 7 nm bandFe XVI 33.5 nm lineMg IX 36.8 nm line
Transition27 - 34 nm bandHe II 30.4 nm lineH I 121.6 nm line
Chromospheric C II 133.5 nm line145 - 165 nm band

Page 12SDO Briefing to Research to Operations Meeting, October 15, 2007
Solar Dynamics Observatory
The Solar Dynamics Observatory (SDO) is the first Living With a Star mission. It will use telescopes to study the Sun’s magnetic field, the interior of the Sun, and changes in solar activity. Some of the telescopes will take pictures of the Sun, others will view the Sun as if it were a star.
•The primary goal of the SDO mission is to understand, driving towards a predictive capability, the solar variations that influence life on Earth and humanity’s technological systems by determining:
–How the Sun’s magnetic field is generated and structured
–How this stored magnetic energy is converted and released into the heliosphere and geospace in the form of solar wind, energetic particles, and variations in the solar irradiance.

Page 13SDO Briefing to Research to Operations Meeting, October 15, 2007
SDO Investigations:
• Extreme Ultraviolet Variability Experiment (EVE); PI: Tom Woods – LASP, Univ. of CO; measures the solar extreme ultraviolet (EUV) irradiance to understand variations. Helioseismic Magnetic Imager (HMI); PI: Phil Scherrer – Stanford Univ.; Images the Sun’s helioseismic and magnetic fields to understand the Sun’s interior and magnetic activity.
• Atmospheric Imaging Assembly (AIA) and Guide Telescopes (GT); PI: Alan Title – LMSAL; Multiple simultaneous, high-resolution images of the corona over a wide range of temperatures.
Approximate deployed characteristics (current best estimates):
• Mass: 3000 kg
• Power: 1000 W
• Width: 6 m
• Height: 4.7 m
HMI
EVE
Instrument Module
S/C Bus & Prop. Modules
Solar Arrays
Antenna Booms
AIA SUITE
SDO Observatory

Page 14SDO Briefing to Research to Operations Meeting, October 15, 2007
EVE

Page 15SDO Briefing to Research to Operations Meeting, October 15, 2007
EVE Data & Research
• One spectrum every 10 seconds is the primary product.
– Spectral range is 0.1 to 105 nm with 0.1 nm resolution and L.
• Identify sources of EUV irradiance (with AIA)
• Predict the future of EUV irradiance (with HMI)
Absorption of radiation as it enters the Earth’s atmosphere. EVE will measure the ionizing radiation with < 105 nm.
Example of an EVE spectrum.
Page 16SDO Briefing to Research to Operations Meeting, October 15, 2007
EVE Space Weather Plans
• Provide near realtime (< 15 min delay) SWx data:
– High resolution spectra (as counts or “crudely” calibrated) (MEGS)
• 10 second cadence
– Broadband solar irradiances (ESP and MEGS-P)
• More rapid (4 Hz) cadence
– First-ever near-realtime XUV and EUV flare monitor
• SWx data to be used by:
– Ionospheric disturbance nowcasting (XUV/EUV flare response)
– Operational GAIM (Global Assimilative Ionospheric Model)
– Operational SOLAR2000 (solar irradiance model), which is in-turn used as a driver for operational atmospheric, ionospheric, and neutral thermospheric wind models
• SWX data will be available as a pull product from EVE web site
– May also be served through NOAA-SEC
Page 17SDO Briefing to Research to Operations Meeting, October 15, 2007
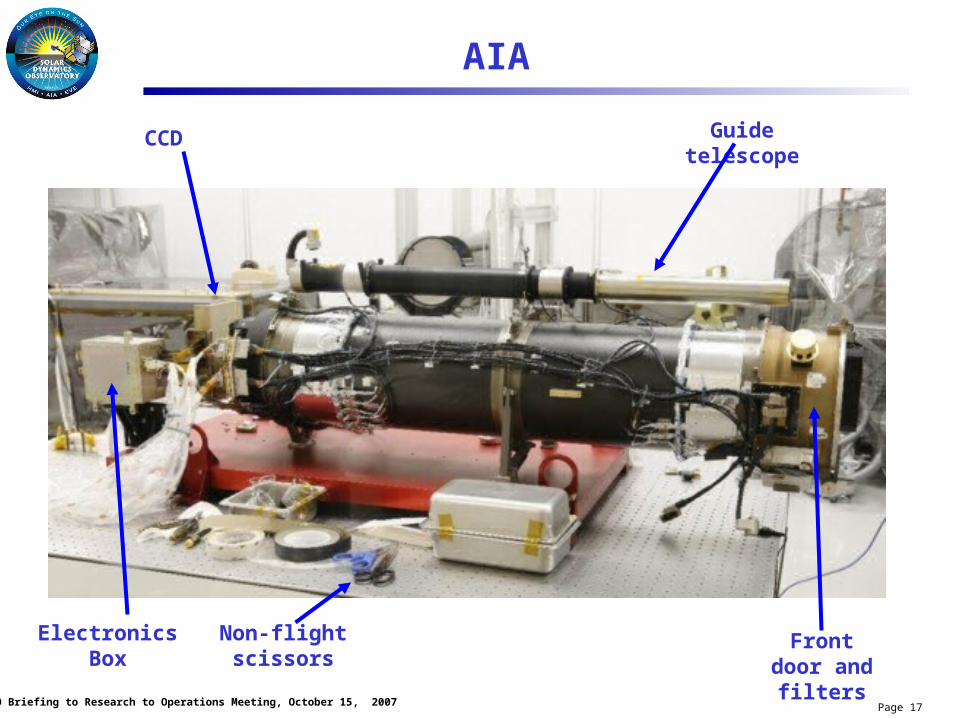
AIA
Guide telescope
Front door and filters
CCD
Non-flight scissors
Electronics Box
Page 18SDO Briefing to Research to Operations Meeting, October 15, 2007
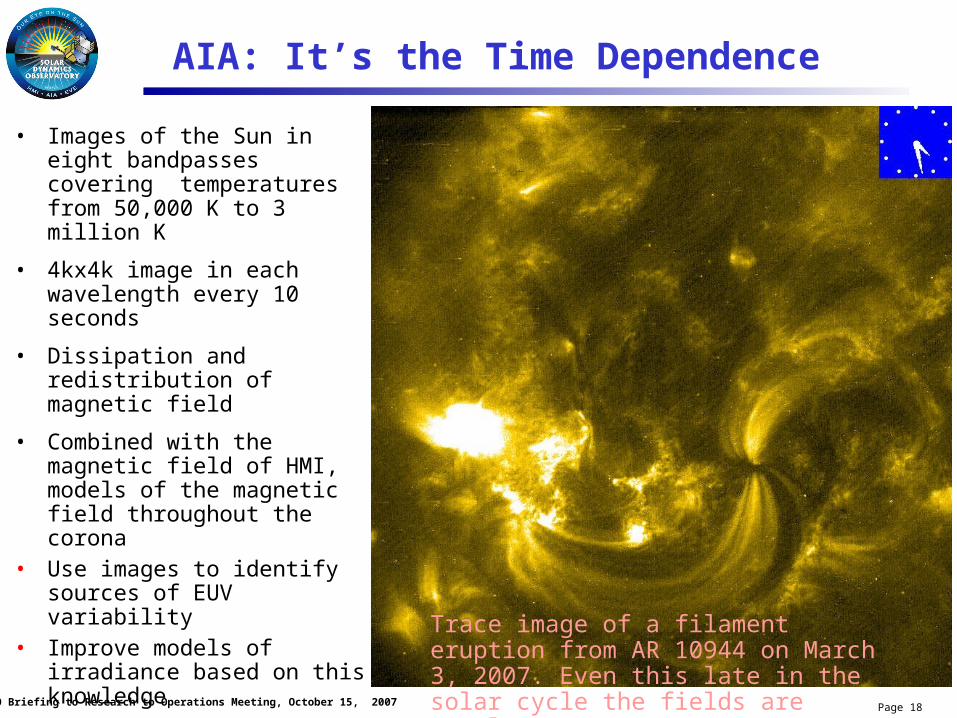
AIA: It’s the Time Dependence
• Images of the Sun in eight bandpasses covering temperatures from 50,000 K to 3 million K
• 4kx4k image in each wavelength every 10 seconds
• Dissipation and redistribution of magnetic field
• Combined with the magnetic field of HMI, models of the magnetic field throughout the corona
• Use images to identify sources of EUV variability
• Improve models of irradiance based on this knowledge
Trace image of a filament eruption from AR 10944 on March 3, 2007. Even this late in the solar cycle the fields are complex.

Page 19SDO Briefing to Research to Operations Meeting, October 15, 2007
Calibration of AIA Data
Page 20SDO Briefing to Research to Operations Meeting, October 15, 2007
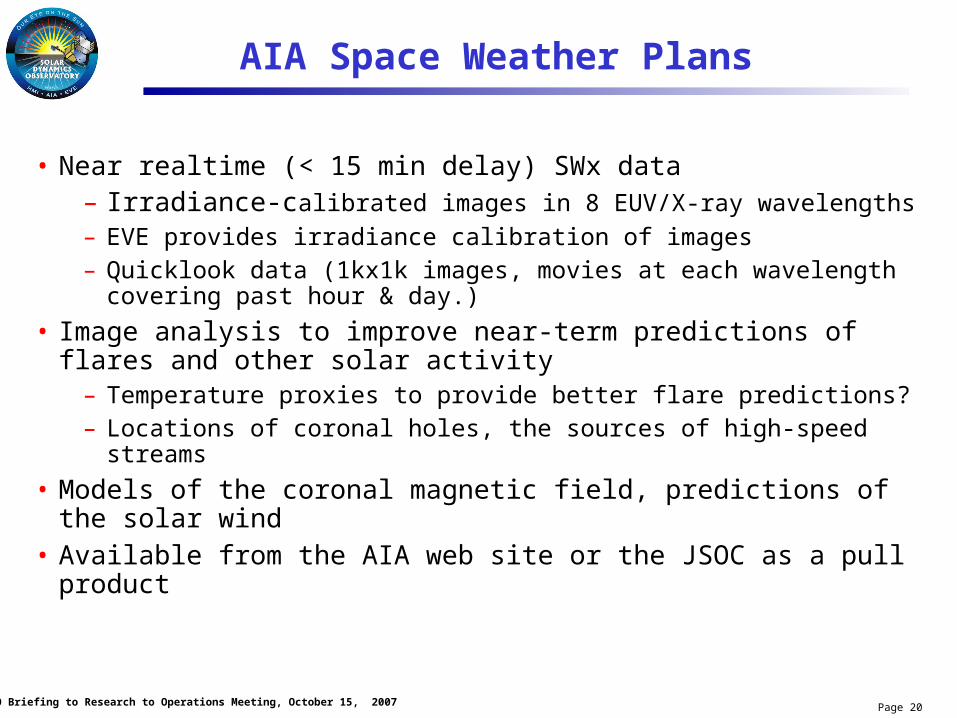
AIA Space Weather Plans
• Near realtime (< 15 min delay) SWx data– Irradiance-calibrated images in 8 EUV/X-ray wavelengths– EVE provides irradiance calibration of images– Quicklook data (1kx1k images, movies at each wavelength covering past hour
& day.)
• Image analysis to improve near-term predictions of flares and other solar activity
– Temperature proxies to provide better flare predictions?– Locations of coronal holes, the sources of high-speed streams
• Models of the coronal magnetic field, predictions of the solar wind• Available from the AIA web site or the JSOC as a pull product
Page 21SDO Briefing to Research to Operations Meeting, October 15, 2007
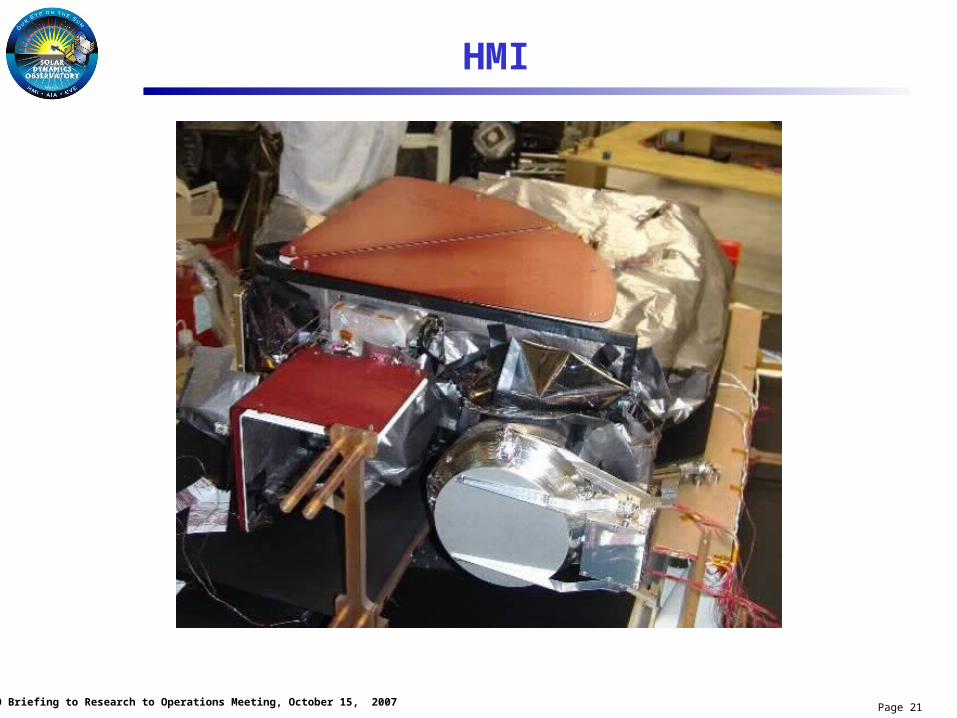
HMI

Page 22SDO Briefing to Research to Operations Meeting, October 15, 2007
HMI: Seeing Inside the SunSeeing Inside the Sun
Helioseismology uses sound to see into and through the Sun— like thunking a watermelon
The velocities under a sunspot show that material moves toward the spot near the surface and away from the spot lower down.
Right: Farside images show the active regions that launched the largest flares ever measured. We can see them on our side at top, continuing around the Sun in the middle and re-appearing at the bottom. The middle view is two weeks after the top and the bottom two weeks later.
Page 23SDO Briefing to Research to Operations Meeting, October 15, 2007
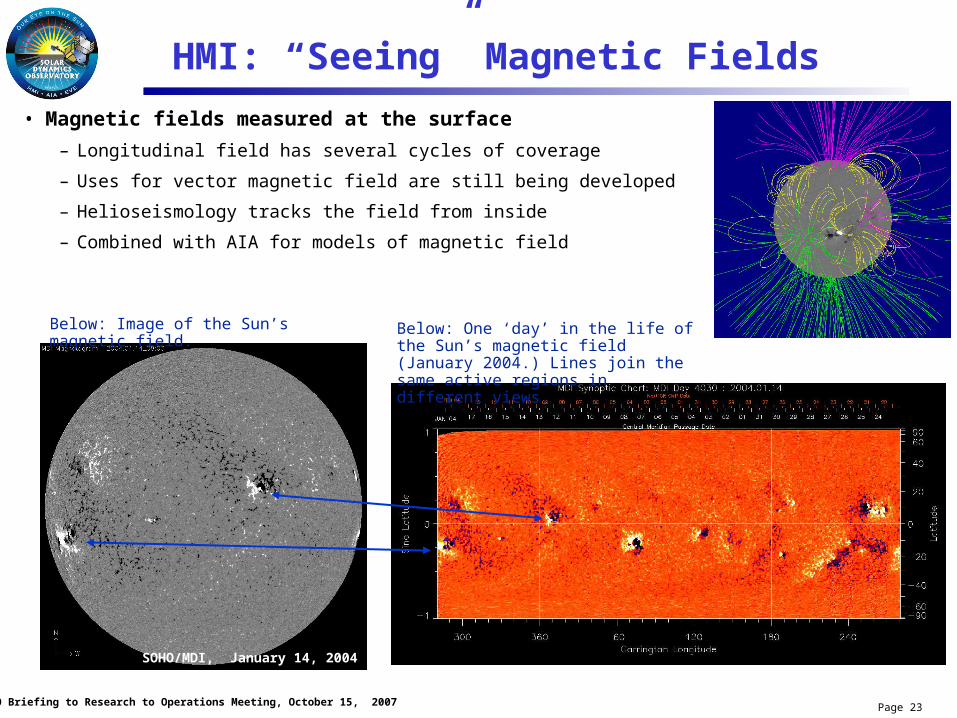
SOHO/MDI, January 14, 2004
HMI: “Seeing” Magnetic Fields
• Magnetic fields measured at the surface
– Longitudinal field has several cycles of coverage
– Uses for vector magnetic field are still being developed
– Helioseismology tracks the field from inside
– Combined with AIA for models of magnetic field
Below: Image of the Sun’s magnetic field.
Below: One ‘day’ in the life of the Sun’s magnetic field (January 2004.) Lines join the same active regions in different views.

Page 24SDO Briefing to Research to Operations Meeting, October 15, 2007
HMI Space Weather Plans
• Near realtime (< 15 min delay) SWx data– 4k x 4k magnetogram
–LOS with 50 sec. cadence, vector every 10 min.– Continuum images
• Helioseismic data products– Far-side images– Active region emergence and evolution– Magnetic field creation and emergence
• Models of the convection zone and dynamo– Enables the prediction of long-term solar activity
• Available from the JSOC as a pull product
Page 25SDO Briefing to Research to Operations Meeting, October 15, 2007
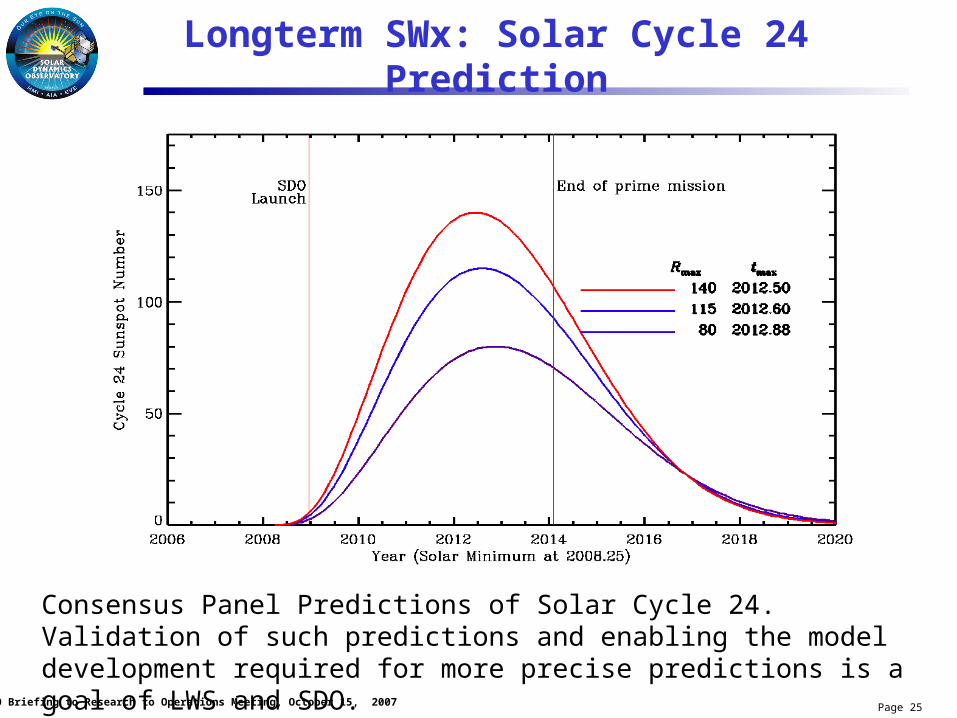
Longterm SWx: Solar Cycle 24 Prediction
Consensus Panel Predictions of Solar Cycle 24. Validation of such predictions and enabling the model development required for more precise predictions is a goal of LWS and SDO.

Page 26SDO Briefing to Research to Operations Meeting, October 15, 2007
Solar Magnetic Cycle at the Poles
SDO’s 5-year mission starting at solar minimum should observe the polar field reversal and many of the surges of magnetic field from lower latitude (courtesy Hathaway/NASA).

Page 27SDO Briefing to Research to Operations Meeting, October 15, 2007
Summary
• SDO is working toward a launch in December 2008
• SDO SWx data includes
– EVE EUV spectra and radiometers at 10 sec cadence
– AIA images in 7 EUV/X-ray wavelengths at 10 sec cadence, UV and visible at a less rapid cadence
• Flare prediction and assessment
• CME liftoffs
– HMI will produce magnetograms and Dopplergrams
• LOS magnetograms every 50 sec
• Vector magnetograms every 10 min
• Cadences of products derived from Dopplergrams is not yet determined
o Far-side images, active region emergence, magnetic field emergence, predictions of activity
• SDO Space Weather data will be available with a 15 minute latency
• These are the known SWx products, we hope more will be developed!
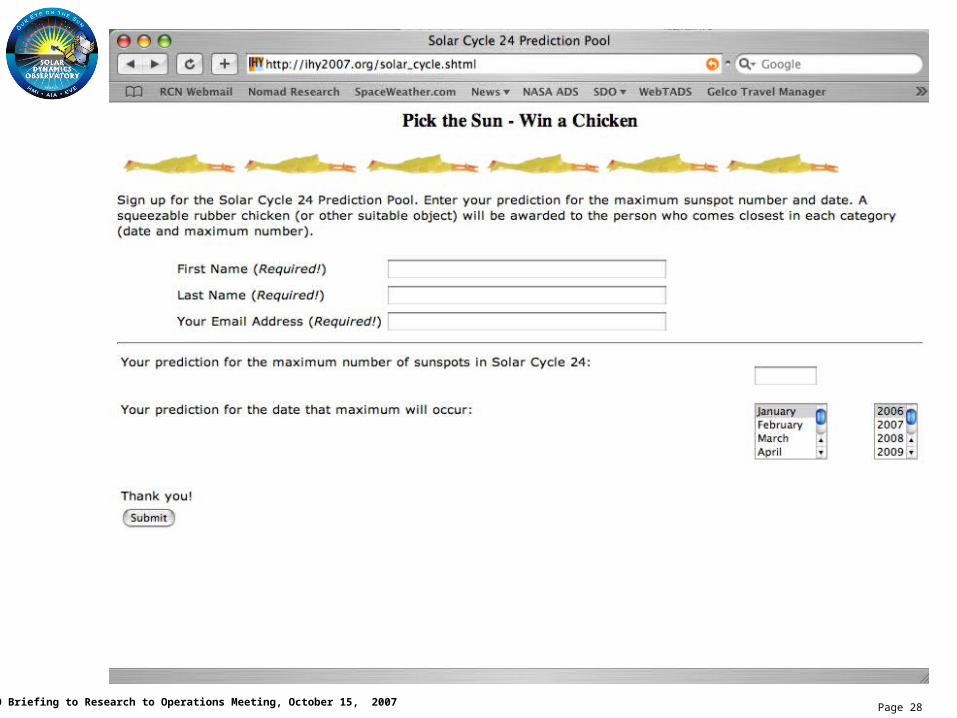
Page 28SDO Briefing to Research to Operations Meeting, October 15, 2007

Page 29SDO Briefing to Research to Operations Meeting, October 15, 2007
• W. Dean Pesnell: [email protected]
• http://sdo.gsfc.nasa.gov

Page 30SDO Briefing to Research to Operations Meeting, October 15, 2007
What Do You Want?
User
Parameter
Cadence
Accuracy & precision
Spectral coverage
Spectral resolution
Spatial coverage
Spatial resolution
Other requirements