paddy soil heavy metal contamination and uptake in rice plants from the adjacent area of barapukuria...
TRANSCRIPT
ORIGINAL PAPER
Paddy soil heavy metal contamination and uptake in rice plantsfrom the adjacent area of Barapukuria coal mine, northwestBangladesh
M. A. Halim & R. K. Majumder & M. N. Zaman
Received: 9 January 2014 /Accepted: 19 May 2014# Saudi Society for Geosciences 2014
Abstract This study was carried out to estimate the heavymetal contamination in paddy soil and subsoil and uptake byrice plants collected from Barapukuria coal mine area ofBangladesh. The mean contents of As, Cr, Cu, Mn, Ni, Pb,and Zn in paddy soil and subsoil exceed the world averages,and the observed soils are moderately to extremely pollutedwith inputs from mining activities. Correlation and regressionmodel analyses suggest that pH and TOC have distinct effecton the availability of observed metals in soils. Sequentialextraction of paddy soil and subsoil samples demonstrate thatthe mobility of heavy metals increases in the order of Cu>Zn>Pb>Fe>Cr>Ni>Mn>As. The uptake of metals in riceroot is much higher than those in straw and rice grains.Arsenic, Cr, and Pb uptake in rice grains are 6.87-, 1.58-,and 5.26-fold higher than the maximum permissible concen-tration which shows a tendency of transformation of theseelements from contaminated soil to rice plants.
Keywords Paddy soil . Heavymetals contamination . Soilquality . Uptake . Statistical analysis . Rice plants
Introduction
Paddy soil as well as subsoil contamination with heavy metalsfrom mining activities such as grinding, concentrating ores,and discharge and dispersion of mine waste materials, includ-ing tailings and acid mine drainage effluents, became a severeissue in agricultural production around the world in the pastfew decades (Korre et al. 2002; Liu et al. 2005; Zeng et al.2008; Rogan et al. 2009; Nganje et al. 2011; Al-Hobaib et al.2012). Although some heavy metals such as Fe, Zn, Mn, andCu are essential at low level for plants (Machender et al.2014), animals, and human beings. Meanwhile, other metalslike Cr, Pb, and As are toxic and may pose a great threat(Costa 2000; Adepoju and Adekoya 2014). The major routefor heavy metal exposure to humans is mainly through soil–crop–food pathway. The residual plant components, includingstraw and root are partly returned to soil and partly used as aningredient in food for livestock, which is also a possiblepathway of heavy metals into human body by ingesting con-taminated food. Therefore, a detailed risk assessment of heavymetal accumulation in agricultural soils (Almasoud et al.2014) and their transfer in a soil–plant system is required toensure the safe crop production (Papafilippaki et al. 2007;Zhao et al. 2009).
Crops and vegetables grown in the mine waste can accu-mulate significant concentrations of metals with resultingadverse health effects. The accumulation of a specific metalin plants depends on the mobility and availability of metal insoil (Sidenko et al. 2007). The soluble, exchangeable, andchelated metal species in soils are labile fractions available toplants (Kabata-Pendias and Pendias 2001). The mobility andavailability of heavy metals is controlled by several factors,including pH, total organic carbon (TOC), cation exchangecapacity (CEC), redox potential, claymineral content, and Fe–Mn oxides (Kashem and Singh 2001; Antoniadis et al. 2008;Zeng et al. 2011). Among these factors, pH and TOC are
Electronic supplementary material The online version of this article(doi:10.1007/s12517-014-1480-1) contains supplementary material,which is available to authorized users.
M. A. HalimIsotope Hydrology Division, Institute of Nuclear Science andTechnology, Bangladesh Atomic Energy Commission, Savar,Dhaka 1349, Bangladesh
R. K. Majumder (*)Nuclear Minerals Unit, Bangladesh Atomic Energy Commission,Savar, Dhaka 1349, Bangladeshe-mail: [email protected]
M. N. ZamanInstitute ofMining, Mineralogy andMetallurgy, Bangladesh Councilof Scientific and Industrial Research, Joypurhat 5900, Bangladesh
Arab J GeosciDOI 10.1007/s12517-014-1480-1
found to play the most important role in determining themobility and bioavailability of heavy metals in soils(McCauley et al. 2009; Zhao et al. 2010). Soil pH is consid-ered one of the most important factors determining the con-centration of metals in the soil solution, their mobility andavailability to plants (Alkorta et al. 2004). The increase ofhydrogen ion concentration affects the mobilization intensityof heavy metals. In highly acidic soils, the mobility of metallicelements is much higher than in soils with neutral and alkalinereaction (Alkorta et al. 2004; Vamerali et al. 2010). Mean-while, TOC plays an important role in soil structure, waterretention, cation exchange, and in the formation of complexes.They contribute easily to the accumulation of trace element inclay layers of soils (Tremel-Schaub and Feix 2005). TOC insoils significantly increases the availability of the metals toplants. Increasing concentrations of TOC resulted in increas-ing metal extractability from the soils and elevated metalconcentration and uptake in the plants (Antoniadis andAlloway 2002).
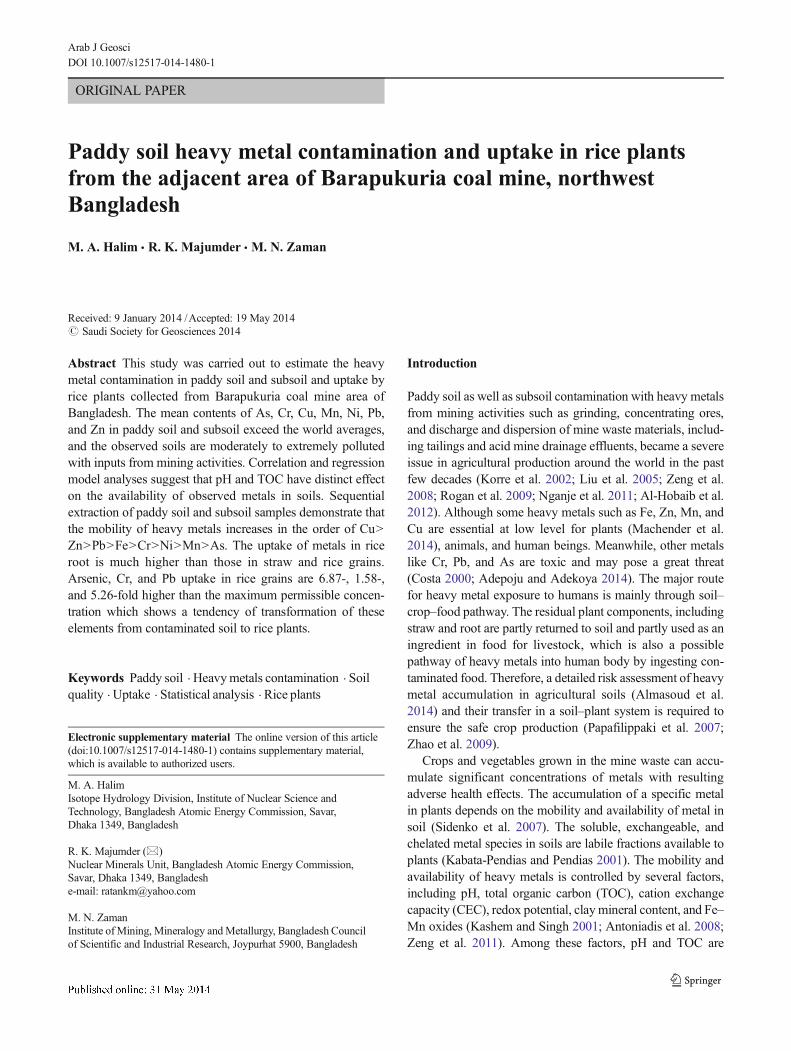
The Barapukuria coal mine, located in the northwesternpart of Bangladesh (Fig. 1), has the potential of contributingsignificantly to resolving the current energy crisis and improv-ing the living standards in Bangladesh (Bhuiyan et al. 2010).The environment of the mining area is becoming polluted dayby day in a great extent (Harun-Or-Rashid et al. 2014a; Hoqueet al. 2013). Barapukuria coal mine adversely impacts on thesurrounding environment and aquatic ecosystems along withother coal mines. It also introduces heavy metal
contaminations to the soil of coal mine area, leading to lowproduction of agricultural crops. Themining process disturbedthe habitat and plant communities, and it is considered as aserious threat to biodiversity. Bangladesh is an agricultural-based country and a major part of agricultural crops cultivatedin the northwestern part. The different types of crops such asrice (Aman and Boro), wheat, maize, potato, chilly, jute, andother various types of leguminous crops are grown in thenorthwestern districts. Hence, the contamination of farm landwas a great concern in this area from the beginning of coalmining (Harun-Or-Rashid et al. 2014b).
The Barapukuria underground coal mine operated byBarapukuria Coal Mining Co. Ltd. (BCMCL) requires con-tinuous pumping and discharge of about 1,500 m3 of waterevery hour to keep the mine free from flooding. The pumpedout mine water has been disposed in the discharge canal aswell as nearby paddy fields. Thus, huge amount of waterflowing from the Barapukuria coal mine site stands over theadjacent paddy fields. The mine water carries suspendedparticles comprising a variety of materials (Halim et al.2013). The coal mine canal water is of increasing concern asthe local farmers use this water directly for irrigation withoutany pretreatment, which increases paddy soil as well as sub-soil contamination and thus results to the uptake of heavymetals by rice plants, posing a significant public health risk tothe local community. Numerous studies have been undertakento refer mining activity heavy metal contamination in paddysoil, subsoil, and plants in various countries (Rogan et al.
2 13i4
11
10
9
87
6
5
1514
13
12
(a) (b)
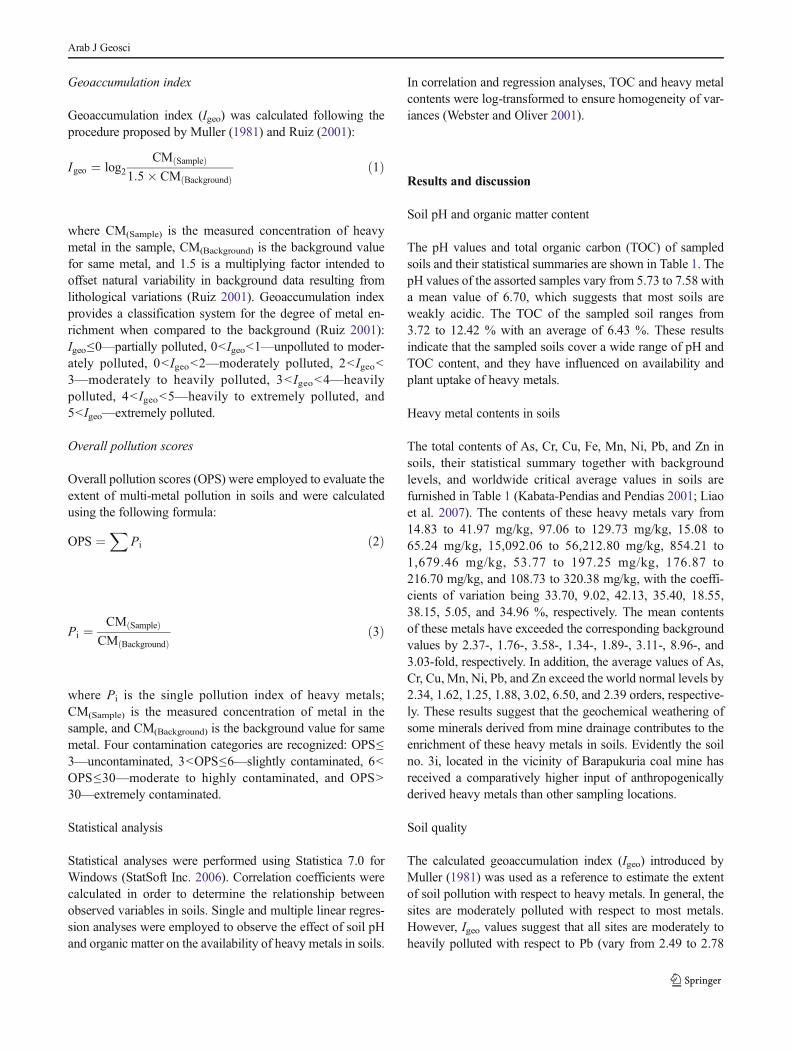
Fig. 1 Location of the samplingsites in Barapukuria coal minearea of Bangladesh. Photographsare shown on (a) rice plants in soilno. 3i and (b) subsoils (3i–3v)
Arab J Geosci
2009; Bruce et al. 2003; Fernández-Caliani et al. 2009; Yapet al. 2009; Nganje et al. 2011; Halim et al. 2013; Machenderet al. 2014; Almasoud et al. 2014). However, several studiesshow heavy metal contamination in agricultural soils anduptake by rice plants in Bangladesh (Kibria et al. 2006;Rahman et al. 2010).
The present study was undertaken in order (1) to assess theconcentrations of heavy metals As, Cr, Cu, Fe, Mn, Ni, Pb,and Zn in paddy soils and subsoil, rice root, straw, andrice grains; (2) to assess the degree of contamination bycalculating pollution indices; (3) to reveal the potentialeffect of soil pH and TOC on the availability of heavymetals in soils; and (4) to assess the uptake of heavymetals by rice plants. These findings will essentiallyprovide useful references not only for future remediationactions but also for developing strategies to prevent paddysoil and subsoil contamination in the vicinity of Barapukuriacoal minewhichmay ultimately reduce heavymetal uptake byrice plants.
Materials and methods
Paddy soil, subsoil, and rice plant sampling
In the vicinity of Barapukuria coal mine area, a total of 15paddy soil (0–15 cm depth) samples were collected randomlyfrom paddy fields irrigated by mine water during December2009 (Fig. 1) to find out the heavy metal contamination inagricultural soil watered by coal mine water. At the same time,an Aman (a local variety of rice) rice plant along with fourvertical subsoils up to the depth of 75 cm were also collectedfrom sampling point no. 3i to observe the vertical distributionof heavy metals in subsoils as well as uptake by rice plants(Fig. 1). The Aman rice is very popular and widely grown inBangladesh. Two unaffected soils (0–15 cm depth) were alsocollected from an agricultural land at a distance of ∼5 km fromthe study area for background studies. The sampled soils wereair-dried at room temperature for 7 days and were then treatedto remove stones and plant residues. Dried samples werecrushed in a mechanical agate grinder, passed through a2-mm nylon sieve and homogenized for analysis. The sam-pled plants were washed in tap water and deionized water. Therice plants then separated into root, straw, and grains, oven-dried at 65 °C to constant weight, and milled into powder in acoffee grinder.
Chemical analysis
For determination of soil pH, 10 g of the air-dried sample wasmixed with 25 mL distilled water (sediment/water at a ratio of1:2.5) and was stirred. The mixture was allowed to stand for30 min for allowing it to settle. The slurry was decanted, and
pH was measured with a calibrated pH meter (Sidenkoet al. 2007; Halim et al. 2013). TOC was measured bydry combustion method according to Carbonell-Barrachina et al. (2000). The soil samples were wet-digested with a concentrated acid mixture (HNO3,HClO4, and HCl). The samples of root, straw, andgrains were digested with HNO3 and HClO4 in 5:1 ratiountil a transparent solution was obtained (Allen et al.1986; Markert 1996). The soil and rice plant (root,straw, and grains) digested solutions were cooled toroom temperature, filtered, and transferred quantitatively to50- and 25-mL volumetric flasks, respectively. Finally, thefiltered solution was made up to volume with distilled waterand kept in clean plastic vials before analysis.
A sequential extraction procedure was used to determinethe speciation of As, Cr, Cu, Fe, Mn, Ni, Pb, and Zn insubsoils (3i–3v) (Tissier et al. 1979). One gram of samplewas placed into a 50-mL polyethylene centrifuge tube anddissolved sequentially in different reagents. After each step ofthe extraction (a)–(d), the solid residue was separated from theliquid by centrifuging at 3,000 rpm for 20 min, and superna-tant was separated by filtering through filter paper (WhatmanNo. 42). The residue was rinsed with 8 mL of distilled water,which were subsequently centrifuged, decanted, anddiscarded. The extraction method operationally defines heavymetals in five chemical forms: (a) water-soluble fraction(10 mL), (b) exchangeable fraction with Na-acetate solutionbuffered by acetic acid (8 mL, 1M, pH 5), (c) Fe–Mn oxide orreducible fraction with NH2OH·HCl (20 mL, 0.04 M, 25 %acetic acid), (d) organic/sulfide bound or oxidizable fractionwith H2O2 (12.5 mL, 30 %, pH 2) and HNO3 (7.5 mL,0.02 M), add NH4-acetate (12.5 mL, 3.2 M) to 25 % v/vHNO3, and (e) residual fraction was calculated to be thedifference between the total content and the sum of concen-trations from steps (a) to (d).
The concentration of heavy metals in solution was mea-sured using atomic absorption spectrophotometry. The ac-curacy and precision of sample analyses were validatedusing the certified reference materials (IAEA Soil 5 andSoil 7, NIST Citrus Leaves 1572 and Orchard Leaves1571). The analytical precision and accuracy were betterthan ±5 % for the analyzed metals. Blanks were used toaccount for possible reagent contributions. All analyses wereperformed in triplicates using the external calibration method,and data presented in this study are expressed on a dry weightbasis (Table 1).
Soil quality
The quality of soil samples collected from Barapukuria coalmine area was assessed by calculating geoaccumulation indexand overall pollution scores.
Arab J Geosci
Tab
le1
SoilpH
,totalorganiccarbon
(%),heavymetalconcentration(m
g/kg),geoaccum
ulationindex(Igeo),overallp
ollutio
nscores
(OPS
),andtheirstatisticalsummary
Sam
ple
Depth
pHTOC
As
Cr
Cu
Fe
Mn
Ni
Pb
Zn
OPS
(cm)
Content
I geo
Content
I geo
Content
I geo
Content
I geo
Content
I geo
Content
I geo
Content
I geo
Content
I geo
10–15
6.81
6.38
24.17
0.77
106.42
0.22
35.78
1.51
24,883.23
−0.32
1,063.30
0.35
76.13
0.68
189.44
2.58
139.01
0.81
25.72
20–15
6.27
7.40
25.62
0.85
109.18
0.25
42.01
1.74
26,406.50
−0.23
1,078.78
0.37
109.04
1.20
194.02
2.62
194.73
1.30
29.08
3i0–15
5.73
12.42
41.97
1.56
129.73
0.50
65.24
2.38
56,212.80
0.86
1,679.46
1.01
197.25
2.05
216.70
2.78
320.38
2.02
42.68
3ii
15–30
6.40
6.84
28.01
0.98
119.02
0.38
40.11
1.68
23,604.18
−0.40
1,040.06
0.32
83.11
0.80
192.59
2.61
172.52
1.12
27.75
3iii
30–45
6.17
5.86
29.36
1.05
106.31
0.21
36.93
1.56
31,047.22
0.00
1,009.09
0.28
79.28
0.74
189.66
2.59
143.11
0.86
26.79
3iv
45–60
6.16
5.76
18.22
0.36
99.56
0.12
21.06
0.75
33,564.92
0.11
854.21
0.04
84.29
0.83
186.49
2.56
140.83
0.83
23.42
3v60–75
5.88
9.72
33.91
1.26
125.81
0.46
46.91
1.90
45,869.49
0.56
1,386.53
0.74
153.85
1.69
201.53
2.67
255.74
1.69
35.23
40–15
7.58
4.25
14.83
0.06
97.39
0.09
18.51
0.56
15,092.06
−1.04
892.93
0.10
67.22
0.50
176.93
2.49
110.37
0.48
20.33
50–15
7.04
5.92
16.04
0.18
107.23
0.23
22.03
0.81
24,023.68
−0.37
978.11
0.23
119.73
1.33
182.71
2.53
126.07
0.67
23.85
60–15
6.97
6.41
17.16
0.27
102.94
0.17
28.94
1.20
21,289.17
−0.54
970.37
0.22
80.51
0.76
189.16
2.58
132.68
0.75
23.77
70–15
7.48
4.20
18.59
0.39
98.05
0.10
17.43
0.47
21,093.90
−0.56
916.16
0.14
61.90
0.38
178.24
2.50
118.95
0.59
21.00
80–15
6.17
7.81
27.81
0.97
108.57
0.24
28.27
1.17
30,612.74
−0.02
1,047.14
0.33
149.83
1.65
191.07
2.60
179.04
1.18
28.65
90–15
7.29
5.90
15.97
0.17
99.06
0.11
21.37
0.77
22,457.73
−0.47
954.88
0.20
68.04
0.52
185.04
2.55
125.91
0.67
21.99
100–15
7.31
4.21
19.13
0.43
101.70
0.15
19.10
0.61
17,457.02
−0.83
900.67
0.11
53.77
0.18
176.87
2.49
125.07
0.66
20.90
110–15
7.05
5.75
15.06
0.08
98.26
0.10
22.09
0.82
32,061.35
0.05
954.88
0.20
115.07
1.27
188.82
2.58
127.36
0.69
24.12
120–15
7.58
3.72
17.04
0.26
97.06
0.08
15.08
0.26
18,191.39
−0.77
900.67
0.11
69.06
0.54
179.50
2.51
108.73
0.46
20.46
130–15
6.04
8.23
28.66
1.01
118.35
0.37
37.19
1.57
31,326.13
0.01
1,141.41
0.46
127.02
1.42
196.05
2.63
236.19
1.58
30.77
140–15
6.85
6.21
19.79
0.48
110.81
0.27
27.55
1.13
26,877.94
−0.21
1,117.50
0.43
74.19
0.64
187.09
2.57
147.02
0.89
24.52
150–15
6.51
5.25
15.08
0.09
103.72
0.18
23.72
0.92
25,647.00
−0.28
1,032.32
0.31
103.71
1.12
181.73
2.52
136.81
0.79
23.72
Min
5.73
3.72
14.83
0.06
97.06
0.08
15.08
0.26
15,092.06
−1.04
854.21
0.04
53.77
0.18
176.87
2.49
108.73
0.46
20.33
Max
7.58
12.42
41.97
1.56
129.73
0.50
65.24
2.38
56,212.80
0.86
1,679.46
1.01
197.25
2.05
216.70
2.78
320.38
2.02
42.68
Mean
6.70
6.43
22.44
0.59
107.32
0.22
29.96
1.15
27,774.66
−0.23
1,048.34
0.31
98.58
0.96
188.61
2.58
160.03
0.95
26.04
CV(%
)8.93
32.39
33.70
76.31
9.02
56.3
42.13
48.82
35.40
−196
1,8.55
74.5
38.15
52.5
5.05
2.75
34.96
45.1
21.49
Background
7.69
2.82
9.47
61.09
8.37
20,696.38
554.88
31.72
21.05
52.74
Worldwidea
9.59
b67
2434,600
b558
32.7b
2967
CVcoefficiento
fvariance
aMeanvalues
ofvariablein
topsoilsfrom
variouscountriesas
tabulatedby
Kabata-PendiasandPendias(2001)
bLiaoetal.2007
Arab J Geosci
Geoaccumulation index
Geoaccumulation index (Igeo) was calculated following theprocedure proposed by Muller (1981) and Ruiz (2001):
Igeo ¼ log2CM Sampleð Þ
1:5� CM Backgroundð Þð1Þ
where CM(Sample) is the measured concentration of heavymetal in the sample, CM(Background) is the background valuefor same metal, and 1.5 is a multiplying factor intended tooffset natural variability in background data resulting fromlithological variations (Ruiz 2001). Geoaccumulation indexprovides a classification system for the degree of metal en-richment when compared to the background (Ruiz 2001):Igeo≤0—partially polluted, 0<Igeo<1—unpolluted to moder-ately polluted, 0< Igeo<2—moderately polluted, 2<Igeo<3—moderately to heavily polluted, 3< Igeo<4—heavilypolluted, 4< Igeo<5—heavily to extremely polluted, and5<Igeo—extremely polluted.
Overall pollution scores
Overall pollution scores (OPS) were employed to evaluate theextent of multi-metal pollution in soils and were calculatedusing the following formula:
OPS ¼X
Pi ð2Þ
Pi ¼CM Sampleð Þ
CM Backgroundð Þð3Þ
where Pi is the single pollution index of heavy metals;CM(Sample) is the measured concentration of metal in thesample, and CM(Background) is the background value for samemetal. Four contamination categories are recognized: OPS≤3—uncontaminated, 3<OPS≤6—slightly contaminated, 6<OPS≤30—moderate to highly contaminated, and OPS>30—extremely contaminated.
Statistical analysis
Statistical analyses were performed using Statistica 7.0 forWindows (StatSoft Inc. 2006). Correlation coefficients werecalculated in order to determine the relationship betweenobserved variables in soils. Single and multiple linear regres-sion analyses were employed to observe the effect of soil pHand organic matter on the availability of heavy metals in soils.
In correlation and regression analyses, TOC and heavy metalcontents were log-transformed to ensure homogeneity of var-iances (Webster and Oliver 2001).
Results and discussion
Soil pH and organic matter content
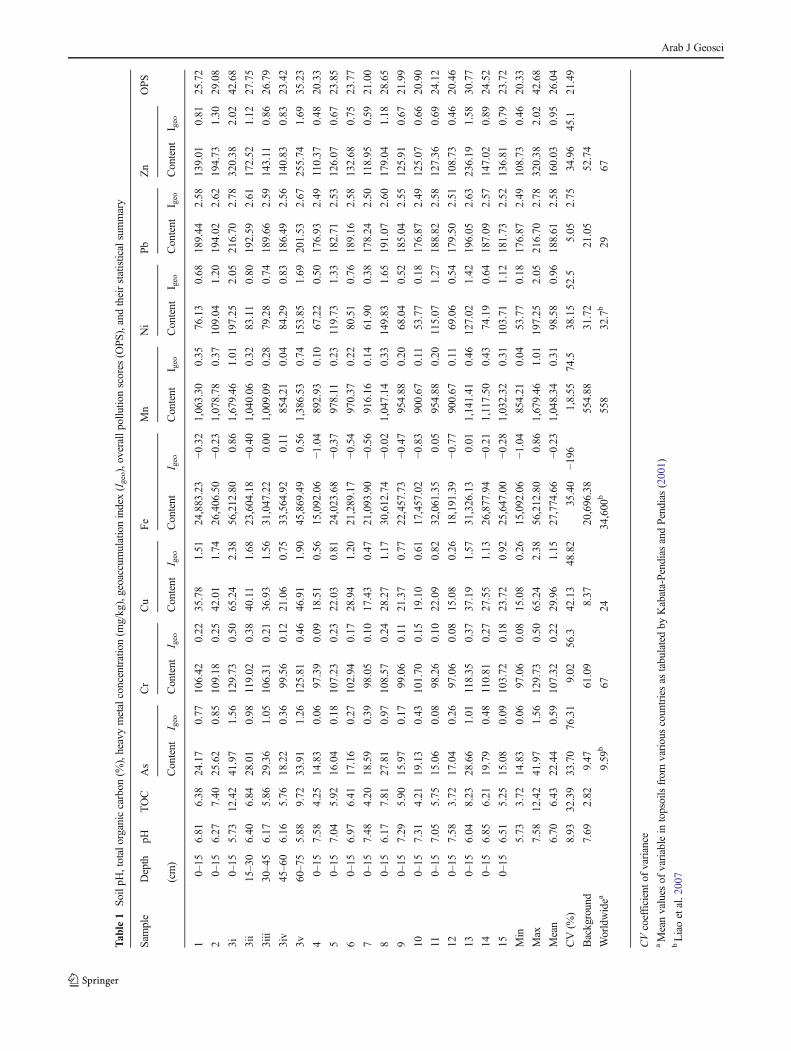
The pH values and total organic carbon (TOC) of sampledsoils and their statistical summaries are shown in Table 1. ThepH values of the assorted samples vary from 5.73 to 7.58 witha mean value of 6.70, which suggests that most soils areweakly acidic. The TOC of the sampled soil ranges from3.72 to 12.42 % with an average of 6.43 %. These resultsindicate that the sampled soils cover a wide range of pH andTOC content, and they have influenced on availability andplant uptake of heavy metals.
Heavy metal contents in soils
The total contents of As, Cr, Cu, Fe, Mn, Ni, Pb, and Zn insoils, their statistical summary together with backgroundlevels, and worldwide critical average values in soils arefurnished in Table 1 (Kabata-Pendias and Pendias 2001; Liaoet al. 2007). The contents of these heavy metals vary from14.83 to 41.97 mg/kg, 97.06 to 129.73 mg/kg, 15.08 to65.24 mg/kg, 15,092.06 to 56,212.80 mg/kg, 854.21 to1,679.46 mg/kg, 53.77 to 197.25 mg/kg, 176.87 to216.70 mg/kg, and 108.73 to 320.38 mg/kg, with the coeffi-cients of variation being 33.70, 9.02, 42.13, 35.40, 18.55,38.15, 5.05, and 34.96 %, respectively. The mean contentsof these metals have exceeded the corresponding backgroundvalues by 2.37-, 1.76-, 3.58-, 1.34-, 1.89-, 3.11-, 8.96-, and3.03-fold, respectively. In addition, the average values of As,Cr, Cu, Mn, Ni, Pb, and Zn exceed the world normal levels by2.34, 1.62, 1.25, 1.88, 3.02, 6.50, and 2.39 orders, respective-ly. These results suggest that the geochemical weathering ofsome minerals derived from mine drainage contributes to theenrichment of these heavy metals in soils. Evidently the soilno. 3i, located in the vicinity of Barapukuria coal mine hasreceived a comparatively higher input of anthropogenicallyderived heavy metals than other sampling locations.
Soil quality
The calculated geoaccumulation index (Igeo) introduced byMuller (1981) was used as a reference to estimate the extentof soil pollution with respect to heavy metals. In general, thesites are moderately polluted with respect to most metals.However, Igeo values suggest that all sites are moderately toheavily polluted with respect to Pb (vary from 2.49 to 2.78
Arab J Geosci
with an average of 2.58) and site no. 3i is also moderately tohighly contaminated with respect to Cu and Zn (Table 1).Moreover, OPS was calculated to account for the presenceof multiple metals at a site (Table 1). The overall pollutionscores of the soils no. 3i, no. 3v, and no. 13 have exceeded 30,with the highest value in no. 3i (scored 42.68), suggesting thatthese sites are extremely contaminated, and the rest of soils aremoderately to highly polluted with respect to heavy metals.This pollution is undoubtedly related to the irrigation of paddyfields with channel water from Barapukuria coal mine, whichdrains mine waters and untreated wastes from Barapukuriamine. Moreover, these sites are affected by coal mine dust andfly ash, which are derived from the nearby coal-fired thermalpower station in the study area.
Correlation analysis
Correlation analysis plays a significant role in explainingheavy metal contamination in the study area. The results showthat the contents of As, Cr, Cu, Fe, Mn, Ni, Pb, and Zn arestrongly affected by soil pH and TOC (Table 2). Soil pH isinversely correlated with these metals, and the highest corre-lation coefficient is found for Fe (r=−0.946, P<0.001). Gen-erally, in natural systems, the mobility and availability of Crusually increases with the increase of soil pH because of thereduction of soluble Cr (VI) to dissoluble Cr (III) under theacidic condition (Sahibin et al. 2002). However, an inversecorrelation between Cr and pH (r=−0.772, P<0.001) is ob-served in this study, demonstrating a hypothesis that apartfrom pH, other parameters and anthropogenic activities haveinfluence on the availability of Cr in soils.
The content of TOC is positively correlated with the con-centrations of As, Cr, Cu, Fe, Mn, Ni, Pb, and Zn (Table 2),and these relationships can be explained by linear regressionmodels (Table 3). TOC plays a significant role in determiningthe mobility and availability of heavy metals in soils in two
aspects. Firstly, TOC can reduce the bioavailability of heavymetals in soils by adsorption or forming stable complexes withhumic substances (Liu et al. 2009). In contrast, TOC is alsoinvolved in supplying organic chemicals to the soil solution,which may serve as chelates and increase metal availability toplants (McCualey et al. 2009). For example, X-ray absorptionspectrometry and electro spin resonance studies have shownthat Pb and Zn form inner sphere complexes with soil organicmatter, i.e., humic acids (Lund et al. 1981). Therefore, thesesignificant relationships among the measured variables indi-cate their common sources and also moving together, espe-cially from coal-bearing minerals in underground mining ac-tivities in the study area.
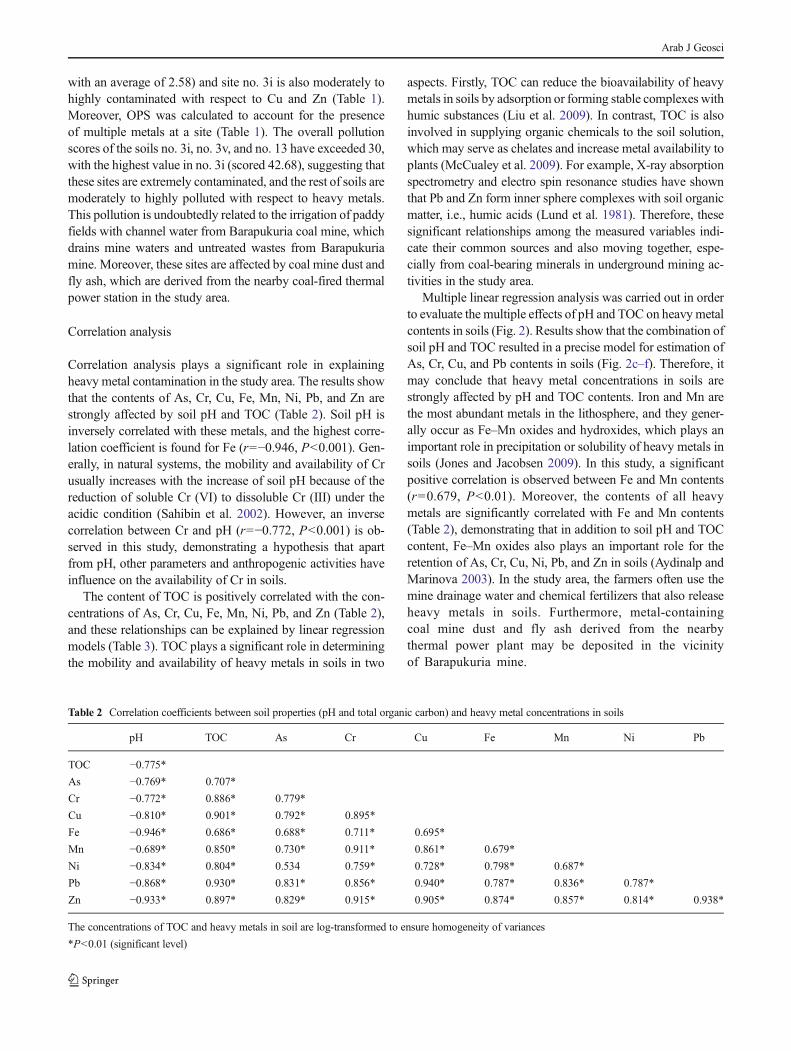
Multiple linear regression analysis was carried out in orderto evaluate the multiple effects of pH and TOC on heavymetalcontents in soils (Fig. 2). Results show that the combination ofsoil pH and TOC resulted in a precise model for estimation ofAs, Cr, Cu, and Pb contents in soils (Fig. 2c–f). Therefore, itmay conclude that heavy metal concentrations in soils arestrongly affected by pH and TOC contents. Iron and Mn arethe most abundant metals in the lithosphere, and they gener-ally occur as Fe–Mn oxides and hydroxides, which plays animportant role in precipitation or solubility of heavy metals insoils (Jones and Jacobsen 2009). In this study, a significantpositive correlation is observed between Fe and Mn contents(r=0.679, P<0.01). Moreover, the contents of all heavymetals are significantly correlated with Fe and Mn contents(Table 2), demonstrating that in addition to soil pH and TOCcontent, Fe–Mn oxides also plays an important role for theretention of As, Cr, Cu, Ni, Pb, and Zn in soils (Aydinalp andMarinova 2003). In the study area, the farmers often use themine drainage water and chemical fertilizers that also releaseheavy metals in soils. Furthermore, metal-containingcoal mine dust and fly ash derived from the nearbythermal power plant may be deposited in the vicinityof Barapukuria mine.
Table 2 Correlation coefficients between soil properties (pH and total organic carbon) and heavy metal concentrations in soils
pH TOC As Cr Cu Fe Mn Ni Pb
TOC −0.775*As −0.769* 0.707*
Cr −0.772* 0.886* 0.779*
Cu −0.810* 0.901* 0.792* 0.895*
Fe −0.946* 0.686* 0.688* 0.711* 0.695*
Mn −0.689* 0.850* 0.730* 0.911* 0.861* 0.679*
Ni −0.834* 0.804* 0.534 0.759* 0.728* 0.798* 0.687*
Pb −0.868* 0.930* 0.831* 0.856* 0.940* 0.787* 0.836* 0.787*
Zn −0.933* 0.897* 0.829* 0.915* 0.905* 0.874* 0.857* 0.814* 0.938*
The concentrations of TOC and heavy metals in soil are log-transformed to ensure homogeneity of variances
*P<0.01 (significant level)
Arab J Geosci
Mobility and bioavailability of heavy metals
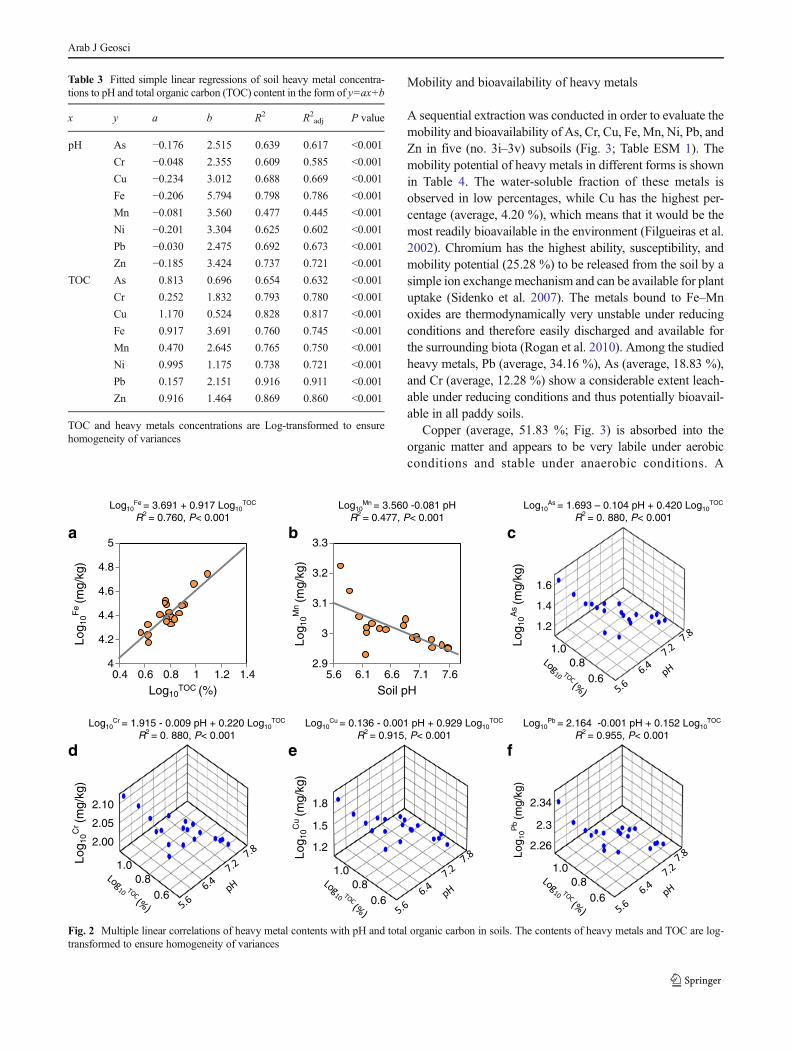
A sequential extraction was conducted in order to evaluate themobility and bioavailability of As, Cr, Cu, Fe,Mn, Ni, Pb, andZn in five (no. 3i–3v) subsoils (Fig. 3; Table ESM 1). Themobility potential of heavy metals in different forms is shownin Table 4. The water-soluble fraction of these metals isobserved in low percentages, while Cu has the highest per-centage (average, 4.20 %), which means that it would be themost readily bioavailable in the environment (Filgueiras et al.2002). Chromium has the highest ability, susceptibility, andmobility potential (25.28 %) to be released from the soil by asimple ion exchangemechanism and can be available for plantuptake (Sidenko et al. 2007). The metals bound to Fe–Mnoxides are thermodynamically very unstable under reducingconditions and therefore easily discharged and available forthe surrounding biota (Rogan et al. 2010). Among the studiedheavy metals, Pb (average, 34.16 %), As (average, 18.83 %),and Cr (average, 12.28 %) show a considerable extent leach-able under reducing conditions and thus potentially bioavail-able in all paddy soils.
Copper (average, 51.83 %; Fig. 3) is absorbed into theorganic matter and appears to be very labile under aerobicconditions and stable under anaerobic conditions. A
Table 3 Fitted simple linear regressions of soil heavy metal concentra-tions to pH and total organic carbon (TOC) content in the form of y=ax+b
x y a b R2 R2adj P value
pH As −0.176 2.515 0.639 0.617 <0.001
Cr −0.048 2.355 0.609 0.585 <0.001
Cu −0.234 3.012 0.688 0.669 <0.001
Fe −0.206 5.794 0.798 0.786 <0.001
Mn −0.081 3.560 0.477 0.445 <0.001
Ni −0.201 3.304 0.625 0.602 <0.001
Pb −0.030 2.475 0.692 0.673 <0.001
Zn −0.185 3.424 0.737 0.721 <0.001
TOC As 0.813 0.696 0.654 0.632 <0.001
Cr 0.252 1.832 0.793 0.780 <0.001
Cu 1.170 0.524 0.828 0.817 <0.001
Fe 0.917 3.691 0.760 0.745 <0.001
Mn 0.470 2.645 0.765 0.750 <0.001
Ni 0.995 1.175 0.738 0.721 <0.001
Pb 0.157 2.151 0.916 0.911 <0.001
Zn 0.916 1.464 0.869 0.860 <0.001
TOC and heavy metals concentrations are Log-transformed to ensurehomogeneity of variances
2.9
3
3.1
3.2
3.3
5.6 6.1 6.6 7.1 7.6
Soil pH
Log 1
0Mn
(mg/
kg)
Log10Mn = 3.560 -0.081 pH
R2 = 0.477, P< 0.001
4
4.2
4.4
4.6
4.8
5
0.4 0.6 0.8 1 1.2 1.4
Log10TOC (%)
Log 1
0Fe
(mg/
kg)
Log10Fe = 3.691 + 0.917 Log10
TOC
R2 = 0.760, P< 0.001
1.00.8
0.6
Log 1
0Pb
(mg/
kg)
2.34
2.26
2.3
Log10Pb = 2.164 -0.001 pH + 0.152 Log10
TOC
R2 = 0.955, P< 0.001
1.00.8
0.6
2.10
2.05
2.00
Log 1
0Cr (m
g/kg
)
Log10Cr = 1.915 - 0.009 pH + 0.220 Log10
TOC
R2 = 0. 880, P< 0.001
a
f
1.00.8
0.6
Log 1
0Cu
(mg/
kg)
1.8
1.5
1.2
Log10Cu = 0.136 - 0.001 pH + 0.929 Log10
TOC
R2 = 0.915, P< 0.001
ed
b
1.00.8
0.6
Log10As = 1.693 – 0.104 pH + 0.420 Log10
TOC
R2 = 0. 880, P< 0.001
Log 1
0As (m
g/kg
)
1.2
1.4
1.6
c
Fig. 2 Multiple linear correlations of heavy metal contents with pH and total organic carbon in soils. The contents of heavy metals and TOC are log-transformed to ensure homogeneity of variances
Arab J Geosci
significant fraction of rest heavy metals such as Zn (average,37.30 %), Ni (average, 37.17 %), As (average, 32.18 %), Cr(average, 30.91 %), Pb (average, 25.61 %), etc. are also linkedto organic matter within the soil matrix into solution (Fig. 3).Interestingly, organic phase extracted heavymetal contents arestrongly positively correlated among them (Table 5). Thisrelationship further suggests that organic matter plays majorrole for the contamination of paddy soils with these heavymetals. Arsenic represents the highest proportions in the re-sidual fractions (37.25 %), indicating that As is the mostnonmobile element. Consequently, Cu is the most mobile,and the mobility potential of all metals increase in the orderof Cu>Zn>Pb>Fe>Cr>Ni>Mn>As in the studied soils.
Heavy metal contents in the root, straw, and rice grains
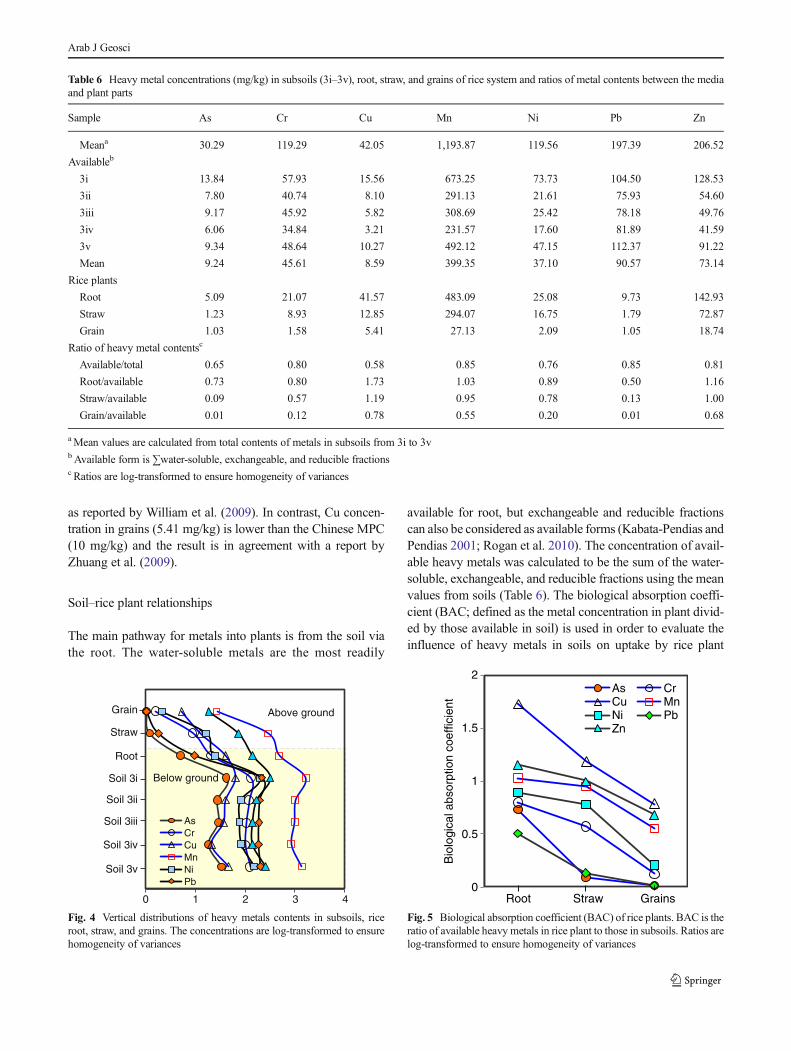
The concentrations of As, Cr, Cu, Mn, Ni, Pb, and Zn in theroot, straw, and rice grains are shown in Table 6. In this study,the highest contents of Mn are observed in all plant parts,
while Zn (142.93 mg/kg) in the root is an order of magnitudegreater than of Cr, Cu, and Ni and two times higher than thatof As and Pb. Overall, the contents of these metals in the rootare much higher than those in straw and grains, following theorder root>straw>grains (Fig. 4). The concentrations of Asand Pb show little difference between straw and grains. It maysuggest that the remobilizing abilities of these metals fromstraw to grains are much lower than those of Cr, Cu, Fe, Mn,Ni, and Zn. Furthermore, grains with As (1.03 mg/kg), Cr(1.58 mg/kg), and Pb (1.05 mg/kg) are 6.87-, 1.58-, and 5.26-fold higher than the Chinese maximum permissible concen-trations (MPC) (0.15, 1.0, and 0.2 mg/kg, respectively)(CFSA 2005), indicating that soil contamination with As,Cr, and Pb has become a health threat in rice production(Zhao et al. 2009). In this study, contents of As, Zn, and Niin rice grains are greater than that of normal rice in Bangladesh
0%
20%
40%
60%
80%
100%
As Cr Cua b c Fed
0%
20%
40%
60%
80%
100%
Mn Ni Pb Zne f g h
Water Soluable Exchangeable Fe-Mn Oxide Organic Residual
1 2 3 4 5 1 2 3 4 5 1 2 3 4 5 1 2 3 4 5
1 2 3 4 5 1 2 3 4 5 1 2 3 4 5 1 2 3 4 5
Fig. 3 Partitioning of heavymetals in the solid phase asdetermined from sequentialextraction of soils from 3i to 3v
Table 4 Mobility potential of heavy metals in paddy subsoils
Condition Mobility
Water soluble Cu>Zn>Ni>Fe>Mn>As>Cr>Pb
Ion exchange Cr>Zn>Pb>Cu>As>Ni>Mn>Fe
Reduction reaction Fe>Pb>Mn>Zn>As>Ni>Cr>Cu
Oxidation reaction Cu>Zn>Ni>Mn>As>Cr>Fe>Pb
Insolubility As>Mn>Ni>Cr>Fe>Pb>Zn>Cu
Table 5 Correlation coefficients between heavy metals extracted fromthe organic phase in soils
Metals As Cr Cu Fe Mn Ni Pb
Cr 0.92
Cu 0.97 0.96
Fe 0.80 0.85 0.74
Mn 0.92 0.97 0.91 0.95
Ni 0.80 0.89 0.77 0.97 0.96
Pb 0.81 0.97 0.85 0.89 0.96 0.94
Zn 0.91 0.98 0.91 0.91 0.99 0.96 0.97
The concentrations are log-transformed to ensure homogeneity ofvariances
Arab J Geosci
as reported by William et al. (2009). In contrast, Cu concen-tration in grains (5.41 mg/kg) is lower than the Chinese MPC(10 mg/kg) and the result is in agreement with a report byZhuang et al. (2009).
Soil–rice plant relationships
The main pathway for metals into plants is from the soil viathe root. The water-soluble metals are the most readily
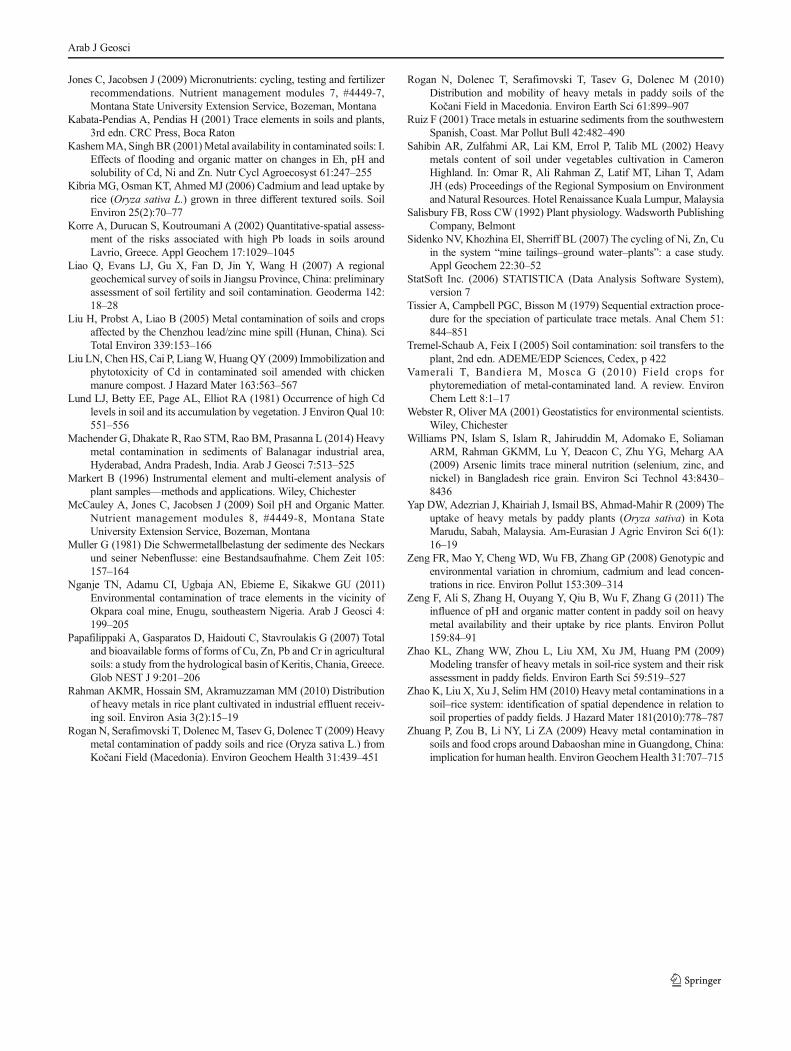
available for root, but exchangeable and reducible fractionscan also be considered as available forms (Kabata-Pendias andPendias 2001; Rogan et al. 2010). The concentration of avail-able heavy metals was calculated to be the sum of the water-soluble, exchangeable, and reducible fractions using the meanvalues from soils (Table 6). The biological absorption coeffi-cient (BAC; defined as the metal concentration in plant divid-ed by those available in soil) is used in order to evaluate theinfluence of heavy metals in soils on uptake by rice plant
Table 6 Heavy metal concentrations (mg/kg) in subsoils (3i–3v), root, straw, and grains of rice system and ratios of metal contents between the mediaand plant parts
Sample As Cr Cu Mn Ni Pb Zn
Meana 30.29 119.29 42.05 1,193.87 119.56 197.39 206.52
Availableb
3i 13.84 57.93 15.56 673.25 73.73 104.50 128.53
3ii 7.80 40.74 8.10 291.13 21.61 75.93 54.60
3iii 9.17 45.92 5.82 308.69 25.42 78.18 49.76
3iv 6.06 34.84 3.21 231.57 17.60 81.89 41.59
3v 9.34 48.64 10.27 492.12 47.15 112.37 91.22
Mean 9.24 45.61 8.59 399.35 37.10 90.57 73.14
Rice plants
Root 5.09 21.07 41.57 483.09 25.08 9.73 142.93
Straw 1.23 8.93 12.85 294.07 16.75 1.79 72.87
Grain 1.03 1.58 5.41 27.13 2.09 1.05 18.74
Ratio of heavy metal contentsc
Available/total 0.65 0.80 0.58 0.85 0.76 0.85 0.81
Root/available 0.73 0.80 1.73 1.03 0.89 0.50 1.16
Straw/available 0.09 0.57 1.19 0.95 0.78 0.13 1.00
Grain/available 0.01 0.12 0.78 0.55 0.20 0.01 0.68
aMean values are calculated from total contents of metals in subsoils from 3i to 3vbAvailable form is ∑water-soluble, exchangeable, and reducible fractionsc Ratios are log-transformed to ensure homogeneity of variances
Grain
Straw
Root
Soil 3i
Soil 3ii
Soil 3iii
Soil 3iv
Soil 3v
0 1 2 3 4
AsCrCuMnNiPb
Above ground
Below ground
Fig. 4 Vertical distributions of heavy metals contents in subsoils, riceroot, straw, and grains. The concentrations are log-transformed to ensurehomogeneity of variances
0
0.5
1
1.5
2
Bio
logi
cal a
bsor
ptio
n co
effic
ient
As CrCu MnNi PbZn
GrainsStrawRoot
Fig. 5 Biological absorption coefficient (BAC) of rice plants. BAC is theratio of available heavy metals in rice plant to those in subsoils. Ratios arelog-transformed to ensure homogeneity of variances
Arab J Geosci

(Fig. 5) (Sidenko et al. 2007). The obtained values for Cu,Mn,and Zn are higher than those for As, Cr, Ni, and Pb, whichmay be due to the different solubility of those metal species insoils governing their availability to plants. Nevertheless, Cu inavailable fraction can be mobilized by the amino acids of rootexudates and then consumed by the plants (Salisbury andRoss 1992).
Conclusions
The mean contents of As, Cr, Cu, Fe, Mn, Ni, Pb, and Zn inthe analyzed paddy soils and subsoil have exceeded the cor-responding background values by 2.37-, 1.76-, 3.58-, 1.34-,1.89-, 3.11-, 8.96-, and 3.03-fold, respectively. In addition, theaverage values of As, Cr, Cu, Mn, Ni, Pb, and Zn haveexceeded the world normal levels by 2.34, 1.62, 1.25, 1.88,3.02, 6.50, and 2.39 orders, respectively. Pb is the dominantcontaminant followed by Cu, Ni, Zn, As, Mn, and Cr in mostsoils mainly due to the mining activities in the study area. Thehighest contents of Mn are observed in all rice plant parts,while Zn in the root is an order of magnitude greater than ofCr, Cu, and Ni and two times higher than that of As and Pb.The contents of As, Cr, Cu, Fe, Mn, Ni, Pb, and Zn in the rootare much higher than those in straw and rice grains, followingthe order root>straw>grains and the order of metal contentroot–straw–grains are Mn>Zn>Cu>Ni>Cr>Pb>As. Theobserved results indicate that the studied soils and subsoilshave been suffering from moderate to extremely heavy metalpollution. Correlation and regression analysis suggests that thecontents of all observed heavy metals are negatively correlat-ed with soil pH while significantly positively correlated withTOC contents. Moreover, the studied heavy metals are signif-icantly correlated with soil pH and TOC, which suggests theircommon sources, and are derived from organic matter andchemical weathering of some metal-bearing minerals. Se-quential extraction further suggests that most of the availablemetals are predominantly associated with soil TOC and Fe–Mn oxides. The mobility of heavy metals in soils increases inthe order of Cu>Zn>Pb>Fe>Cr>Ni>Mn>As.
Elevated concentrations of heavy metals are observed inrice grains, especially 1.03 of As, 1.58 of Cr, and 1.05 mg/kgof Pb. These results demonstrate that the coal mining-affectedpaddy soils are not suitable for rice cultivation and the uptakeof heavy metals in rice plants may avert the extent of toxico-logical effects of As, Cr, and Pb on rice plants, animals, andhumans within the study area.
Acknowledgments Authors are thankful to the Director General of theAtomic Energy Research Establishment, Bangladesh for arranging thefinancial support from the revenue budget to conduct this study.
References
Adepoju MO, Adekoya JA (2014) Heavy metal distribution and assess-ment in stream sediments of River Orle, southwestern Nigeria. ArabJ Geosci 7:743–756
Al-Hobaib AS, Al-Jaseem KQ, Baioumy HM, Ahmed AH (2012)Environmental impact assessment inside and around Mahd AdhDhahab gold mine, Saudi Arabia. Arab J Geosci 4:199–205
Alkorta I, Hernandez-Alica J, Becerril JM, Amezaga I, Albizu I, GarbisuC (2004) Recent findings on the phytoremediation of soils contam-inated with environmentally toxic heavy metals and metalloids suchas zinc, cadmium, lead and arsenic. Rev Environ Sci Bio/Tech 3:71–90
Allen SE, Grimshaw HM, Rowland AP (1986) Chemical analysis. In:Moore PD, Chapman SB (eds) Methods in plant ecology. BlackwellScientific, London
Almasoud FI, Usman AR, Al-Farraj AS (2014) Heavy metals in the soilsof the Arabian Gulf coast affected by industrial activities: analysisand assessment using enrichment factor and multivariate analysis.Arab J Geosci. doi:10.1007/s12517-014-1298-x
Antoniadis V, Alloway BJ (2002) The role of dissolved organic carbon inthe mobility of Cd, Ni and Zn in sewage sludge-amended soils.Environ Poll 117:515–521
Antoniadis V, Robinson JS, Alloway BJ (2008) Effects of short-term pHfluctuations on cadmium, nickel, lead, and zinc availability to rye-grass in a sewage sludge-amended field. Chemosphere 71:759–764
Aydinalp C,Marinova S (2003)Distribution and forms of heavymetals insome agricultural soils. Pol J Environ Stud 12:629–633
Bhuiyana MAH, Parvez L, Islam MA, Dampare SB, Suzu S (2010)Heavy metal pollution of coal mine-affected agricultural soils inthe northern part of Bangladesh. J Hazard Mat 173:384–392
Bruce SL, Noller BN, Grigg AH, Mullen BF, Mulligan DR, Ritchie PJ,Currey N, Ng JC (2003) A field study conducted at Kidston GoldMine, to evaluate the impact of arsenic and zinc frommine tailing tograzing cattle. Toxicol Lett 137:23–34
Carbonell-Barrachina AA, Jugsujinda A, Burlo F, Delaune RD, PatrickWH (2000) Arsenic chemistry in municipal sewage sludge as af-fected by redox potential and pH. Water Res 34:216–224
CFSA (Chinese Food Standards Agency) (2005) Hygienic standard forgrain-maximum levels of pollutant in rice, GB
Costa M (2000) Chromium and nickel. In: Zalups RK, Koropatnick J(eds) Molecular biology and toxicology of metals. Taylor andFrancis, Great Britain
Fernández-Caliani JC, Barba-Brioso C, González I, Galán E (2009)Heavy metal pollution in soils around the abandoned mine sites ofthe Iberian pyrite belt (southwest Spain). Water Air Soil Pollut 200:211–226
Filgueiras AV, Lavilla I, Bendicho C (2002) Chemical sequential extrac-tion for metal partitioning in environmental solid samples. J EnvironMonit 4:823–857
Halim MA, Majumder RK, Zaman MN, Hossain S, Rasul MG, Sasaki K(2013) Mobility and impact of trace metals in Barapukuria coalmining area, northwest Bangladesh. Arab J Geosci 6:4593–4605
Harun-Or-Rashid, Hossain MS, Urbi Z, Islam MS (2014a)Environmental impact of coal mining: a case study on thebarapukuria coal mining industry, Dinajpur, Bangladesh. Middle-East J Sci Res 21:268–274
Harun-Or-Rashid, Shanto MAS, Roy DR, Hossain MS, Islam MS,Hoque MMM, Zannat Urbi Z (2014b) Impact of coal mining onsoil, water and agricultural crop production: a cross-sectional studyon Barapukuria coal mine industry, Dinajpur, Bangladesh. J EnvironSci Res 1(1):1–6
Hoque MMM, Roy DR, Shanta MAS, Roy S (2013) Level of mineralelements in soil and plant roots of the adjacent area of Barapukuriacoal mine. J Innov Dev Strateg 7:10–13
Arab J Geosci
Jones C, Jacobsen J (2009) Micronutrients: cycling, testing and fertilizerrecommendations. Nutrient management modules 7, #4449-7,Montana State University Extension Service, Bozeman, Montana
Kabata-Pendias A, Pendias H (2001) Trace elements in soils and plants,3rd edn. CRC Press, Boca Raton
KashemMA, Singh BR (2001)Metal availability in contaminated soils: I.Effects of flooding and organic matter on changes in Eh, pH andsolubility of Cd, Ni and Zn. Nutr Cycl Agroecosyst 61:247–255
Kibria MG, Osman KT, Ahmed MJ (2006) Cadmium and lead uptake byrice (Oryza sativa L.) grown in three different textured soils. SoilEnviron 25(2):70–77
Korre A, Durucan S, Koutroumani A (2002) Quantitative-spatial assess-ment of the risks associated with high Pb loads in soils aroundLavrio, Greece. Appl Geochem 17:1029–1045
Liao Q, Evans LJ, Gu X, Fan D, Jin Y, Wang H (2007) A regionalgeochemical survey of soils in Jiangsu Province, China: preliminaryassessment of soil fertility and soil contamination. Geoderma 142:18–28
Liu H, Probst A, Liao B (2005) Metal contamination of soils and cropsaffected by the Chenzhou lead/zinc mine spill (Hunan, China). SciTotal Environ 339:153–166
Liu LN, Chen HS, Cai P, LiangW, HuangQY (2009) Immobilization andphytotoxicity of Cd in contaminated soil amended with chickenmanure compost. J Hazard Mater 163:563–567
Lund LJ, Betty EE, Page AL, Elliot RA (1981) Occurrence of high Cdlevels in soil and its accumulation by vegetation. J Environ Qual 10:551–556
Machender G, Dhakate R, Rao STM, Rao BM, Prasanna L (2014) Heavymetal contamination in sediments of Balanagar industrial area,Hyderabad, Andra Pradesh, India. Arab J Geosci 7:513–525
Markert B (1996) Instrumental element and multi-element analysis ofplant samples—methods and applications. Wiley, Chichester
McCauley A, Jones C, Jacobsen J (2009) Soil pH and Organic Matter.Nutrient management modules 8, #4449-8, Montana StateUniversity Extension Service, Bozeman, Montana
Muller G (1981) Die Schwermetallbelastung der sedimente des Neckarsund seiner Nebenflusse: eine Bestandsaufnahme. Chem Zeit 105:157–164
Nganje TN, Adamu CI, Ugbaja AN, Ebieme E, Sikakwe GU (2011)Environmental contamination of trace elements in the vicinity ofOkpara coal mine, Enugu, southeastern Nigeria. Arab J Geosci 4:199–205
Papafilippaki A, Gasparatos D, Haidouti C, Stavroulakis G (2007) Totaland bioavailable forms of forms of Cu, Zn, Pb and Cr in agriculturalsoils: a study from the hydrological basin of Keritis, Chania, Greece.Glob NEST J 9:201–206
Rahman AKMR, Hossain SM, Akramuzzaman MM (2010) Distributionof heavy metals in rice plant cultivated in industrial effluent receiv-ing soil. Environ Asia 3(2):15–19
Rogan N, Serafimovski T, DolenecM, Tasev G, Dolenec T (2009) Heavymetal contamination of paddy soils and rice (Oryza sativa L.) fromKočani Field (Macedonia). Environ Geochem Health 31:439–451
Rogan N, Dolenec T, Serafimovski T, Tasev G, Dolenec M (2010)Distribution and mobility of heavy metals in paddy soils of theKočani Field in Macedonia. Environ Earth Sci 61:899–907
Ruiz F (2001) Trace metals in estuarine sediments from the southwesternSpanish, Coast. Mar Pollut Bull 42:482–490
Sahibin AR, Zulfahmi AR, Lai KM, Errol P, Talib ML (2002) Heavymetals content of soil under vegetables cultivation in CameronHighland. In: Omar R, Ali Rahman Z, Latif MT, Lihan T, AdamJH (eds) Proceedings of the Regional Symposium on Environmentand Natural Resources. Hotel Renaissance Kuala Lumpur, Malaysia
Salisbury FB, Ross CW (1992) Plant physiology. Wadsworth PublishingCompany, Belmont
Sidenko NV, Khozhina EI, Sherriff BL (2007) The cycling of Ni, Zn, Cuin the system “mine tailings–ground water–plants”: a case study.Appl Geochem 22:30–52
StatSoft Inc. (2006) STATISTICA (Data Analysis Software System),version 7
Tissier A, Campbell PGC, Bisson M (1979) Sequential extraction proce-dure for the speciation of particulate trace metals. Anal Chem 51:844–851
Tremel-Schaub A, Feix I (2005) Soil contamination: soil transfers to theplant, 2nd edn. ADEME/EDP Sciences, Cedex, p 422
Vamerali T, Bandiera M, Mosca G (2010) Field crops forphytoremediation of metal-contaminated land. A review. EnvironChem Lett 8:1–17
Webster R, Oliver MA (2001) Geostatistics for environmental scientists.Wiley, Chichester
Williams PN, Islam S, Islam R, Jahiruddin M, Adomako E, SoliamanARM, Rahman GKMM, Lu Y, Deacon C, Zhu YG, Meharg AA(2009) Arsenic limits trace mineral nutrition (selenium, zinc, andnickel) in Bangladesh rice grain. Environ Sci Technol 43:8430–8436
Yap DW, Adezrian J, Khairiah J, Ismail BS, Ahmad-Mahir R (2009) Theuptake of heavy metals by paddy plants (Oryza sativa) in KotaMarudu, Sabah, Malaysia. Am-Eurasian J Agric Environ Sci 6(1):16–19
Zeng FR, Mao Y, Cheng WD, Wu FB, Zhang GP (2008) Genotypic andenvironmental variation in chromium, cadmium and lead concen-trations in rice. Environ Pollut 153:309–314
Zeng F, Ali S, Zhang H, Ouyang Y, Qiu B, Wu F, Zhang G (2011) Theinfluence of pH and organic matter content in paddy soil on heavymetal availability and their uptake by rice plants. Environ Pollut159:84–91
Zhao KL, Zhang WW, Zhou L, Liu XM, Xu JM, Huang PM (2009)Modeling transfer of heavy metals in soil-rice system and their riskassessment in paddy fields. Environ Earth Sci 59:519–527
Zhao K, Liu X, Xu J, Selim HM (2010) Heavy metal contaminations in asoil–rice system: identification of spatial dependence in relation tosoil properties of paddy fields. J Hazard Mater 181(2010):778–787
Zhuang P, Zou B, Li NY, Li ZA (2009) Heavy metal contamination insoils and food crops around Dabaoshan mine in Guangdong, China:implication for human health. EnvironGeochemHealth 31:707–715
Arab J Geosci