package drop testing: the do's and don'ts of ... - westpak · pdf filefor each...
TRANSCRIPT
PACKAGE DROP TESTING:
THE DO’S AND DON’TS OF PACKAGE IMPACT PERFORMANCE TESTS
PREPARED BY
HERBERT H. SCHUENEMAN, CP-P, MH and
MARK ESCOBEDO
PRESENTED BY
WESTPAK, INC. 83 Great Oaks Blvd., San Jose, CA 95119
(408) 224-1300 FAX (408) 224-5113 www.westpak.com
__________________________________________________

TABLE OF CONTENTS
PAGE
2 Abstract
3 Definition of Terms
5 Review of Dynamic Cushion Testing
10 Package Drop Height
12 Number and Orientations of Impacts During a Package Drop Test Procedure
14 Effect of Drop Height and Test Procedure on Package Design
16 Performance vs. Integrity Testing Procedures
17 Location of the Response Accelerometers
18 Conducting the Drop Test
20 Collecting the Data
23 Data Analysis
26 Use of a Shock Machine in Place of a Drop Tester
28 Conclusions
29 References

3
ABSTRACT
This paper discusses some of the issues involved with the development and testing of a protective package system. Issues related to impact or shock are specifically addressed. The purpose of this paper is to assist those who design and test protective packages. Many elements go into a protective package system, some of which have a large effect on the ability of the package to do its job. The test procedures used to verify package performance can likewise have a substantial effect on the outcome and the eventual determination of passing or failing a particular package design. Suggestions are offered for data collection techniques and for analyzing the response waveforms to determine the best way to improve package impact performance.

4
DEFINITION OF TERMS It is necessary to establish a common base for terms used in package dynamics. Packaging engineers will already be familiar with most of these.
DISPLACEMENT is a measure of distance typically in millimeters or inches. (It is the
integral of velocity with respect to time.) VELOCITY is the rate at which displacement changes. It is a vector quantity having
both magnitude and direction. It is measured in meters per second, miles per hour, inches per second and similar units. (It is the integral of acceleration and the differential of displacement with respect to time.)
ACCELERATION is the rate at which velocity changes. It is generally defined as a
percentage of earth's gravitational constant at sea level. (g = 9.8 m/sec2 or 386 in/sec2) (Acceleration is the differential of velocity with respect to time.)
PEAK ACCELERATION is also the peak or high point of the acceleration vs. time
pulse. DECELERATION is negative acceleration. The two terms are often used
interchangeably, although acceleration properly refers to an increasing rate of velocity change and deceleration as a decreasing rate of velocity change.
VELOCITY CHANGE is another term often used in dynamic packaging. It refers to the
difference between an initial and final velocity and can be thought of as a measure of energy dissipated during a dynamic event. It is equal to the area under the acceleration vs. time pulse (the integral of the pulse). Velocity change can be estimated by multiplying the peak acceleration of a pulse times its effective duration. The following equations apply:
∆V = Ap Te = (A) (g) (Dur) (wave shape factor)
∆V = Vi - (-Vr) = Vi + Vr = (1 + e) gh2
Where e = Vr / Vi Ap = peak pulse acceleration (G’) Te = effective pulse duration (sec) g = Earth’s gravitational constant (386.4 in/sec2) COEFFICIENT OF RESTITUTION (e) is the ratio of the rebound velocity to the impact
velocity expressed as a percentage (Vr / Vi). It is a measure of the energy dissipated or stored during a dynamic event such as an impact.
5
DESIGN DROP HEIGHT is the package drop height normally determined from a study
of environment data showing package weight vs. typical drop heights. ACCELEROMETER is a small device in which a Piezo-electric crystal and an
associated mass convert a mechanical excitation such as acceleration into an electrical signal that can be calibrated resulting in a convenient measurement technique. Most accelerometers are single axis devices measuring one orientation only. Triaxial accelerometers are three accelerometers mounted together, one in each orientation resulting in three signals.
EFFECTIVE FREEFALL DROP HEIGHT (EFFDH) is an estimate of the drop height
associated with a known velocity change. If the coefficient of restitution can be closely estimated, then the equivalent freefall drop height can be determined from a given velocity change input.
h = ∆V2 / (1 + e)2 2g
where h = freefall drop height in inches
e = coefficient of restitution of the impact surfaces (ranges from 0 to 1)
g = gravitational constant = 386 in/sec2
FILTERING is a term normally applied to electronically removing higher frequency data from a lower frequency shock pulse such as occurs in a drop test. It is a commonly used procedure, but one which must be used prudently in order to avoid data distortion.
WAVEFORM MORPHOLOGY is the study of the deceleration response from a package
drop or impact in order to determine the deflection characteristics of a cushion material, including the rate at which the cushion deflects.

6
REVIEW OF DYNAMIC CUSHION TESTING
Most packaging engineers are familiar with cushion curves such as that shown in Figure 1. A cushion curve describes the amount of shock (deceleration) transmitted through a given thickness of cushion when subjected to a known loading (typically described as a "static stress" in lbs./in2 or kg/cm2). A cushion curve is used in the package design process by drawing a line across the cushion curve at the critical acceleration level of the product. This is shown in Figure 2. The maximum loading intersection of the cushion curve and the fragility level of the product defines the most optimum point of loading for the cushion material.
Figure 1: Typical Cushion Curve Source: DYLITE Design Manual, Arco Polymers

7
Figure 2: Optimum Static Stress Loadings Source: DYLITE Design Manual, Arco Polymers
Cushion curves are developed by means of standardized test procedures, including ASTM D1596(1), ASTM D4168(1), MIL-PPP-C-1728, MIL-PPP-C-26514E, and similar. Typically a cushion material of known area and thickness is subjected to an impact from a guided platen (D1596), and the deceleration level of the platen at impact is monitored with an accelerometer mounted to the platen. The test requires 5 impacts at each static stress level. A minimum of 5 static stress levels are required to draw a cushion curve.

8
For each static stress level, the first impact data point is discarded, and the cushion curve is constructed from the average of the last 4 of 5 impacts. Refer to the paper, "Testing, Cushion Materials"(2), available from Westpak for more information on the operation of the various test procedures. It should be noted that the test procedure itself has a great influence on the data generated. For example, the ASTM D1596 data comes from a machine with a platen free falling onto a cushion material. (See Figure 3) The effect of the air between the cushion and the platen is ignored as well as the friction of the guide rods on the platen. An interesting study was conducted in 1986 on the effect of these various test procedures on cushion design and the results of those designs. Refer to "A Comparison of Three Different Cushion Test Methods"(3) available from Westpak for more details.
Figure 3: Cushion Tester
9
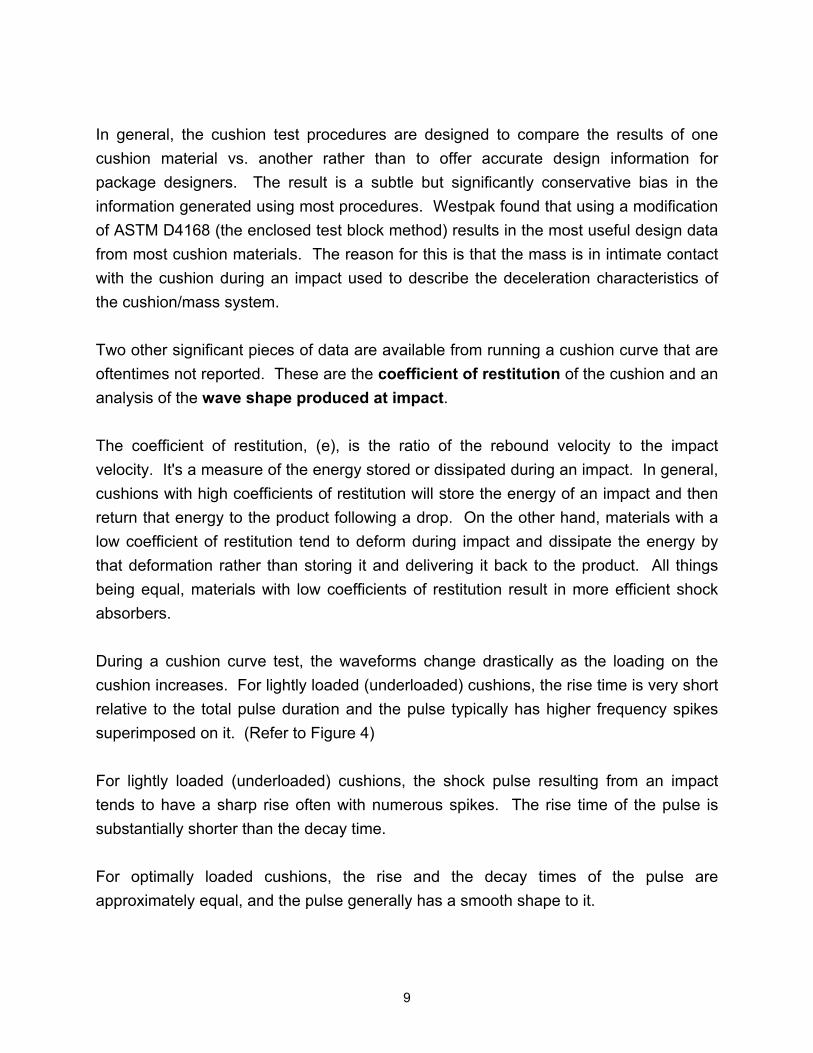
In general, the cushion test procedures are designed to compare the results of one cushion material vs. another rather than to offer accurate design information for package designers. The result is a subtle but significantly conservative bias in the information generated using most procedures. Westpak found that using a modification of ASTM D4168 (the enclosed test block method) results in the most useful design data from most cushion materials. The reason for this is that the mass is in intimate contact with the cushion during an impact used to describe the deceleration characteristics of the cushion/mass system. Two other significant pieces of data are available from running a cushion curve that are oftentimes not reported. These are the coefficient of restitution of the cushion and an analysis of the wave shape produced at impact. The coefficient of restitution, (e), is the ratio of the rebound velocity to the impact velocity. It's a measure of the energy stored or dissipated during an impact. In general, cushions with high coefficients of restitution will store the energy of an impact and then return that energy to the product following a drop. On the other hand, materials with a low coefficient of restitution tend to deform during impact and dissipate the energy by that deformation rather than storing it and delivering it back to the product. All things being equal, materials with low coefficients of restitution result in more efficient shock absorbers. During a cushion curve test, the waveforms change drastically as the loading on the cushion increases. For lightly loaded (underloaded) cushions, the rise time is very short relative to the total pulse duration and the pulse typically has higher frequency spikes superimposed on it. (Refer to Figure 4) For lightly loaded (underloaded) cushions, the shock pulse resulting from an impact tends to have a sharp rise often with numerous spikes. The rise time of the pulse is substantially shorter than the decay time. For optimally loaded cushions, the rise and the decay times of the pulse are approximately equal, and the pulse generally has a smooth shape to it.
10
Figure 4: Underloaded, Overloaded, and Properly Loaded Cushions For overloaded cushions, the rise time tends to be much greater than the decay time, and the pulse has a spike near the end of it. These are classic signs of cushion materials that are under loaded, properly loaded, and overloaded respectively. This information will be very useful during package performance testing.
Properly Loaded Cushion Response
Underloaded (stiff) Cushion Response
Overloaded Cushion Response
11
PACKAGE DROP HEIGHT
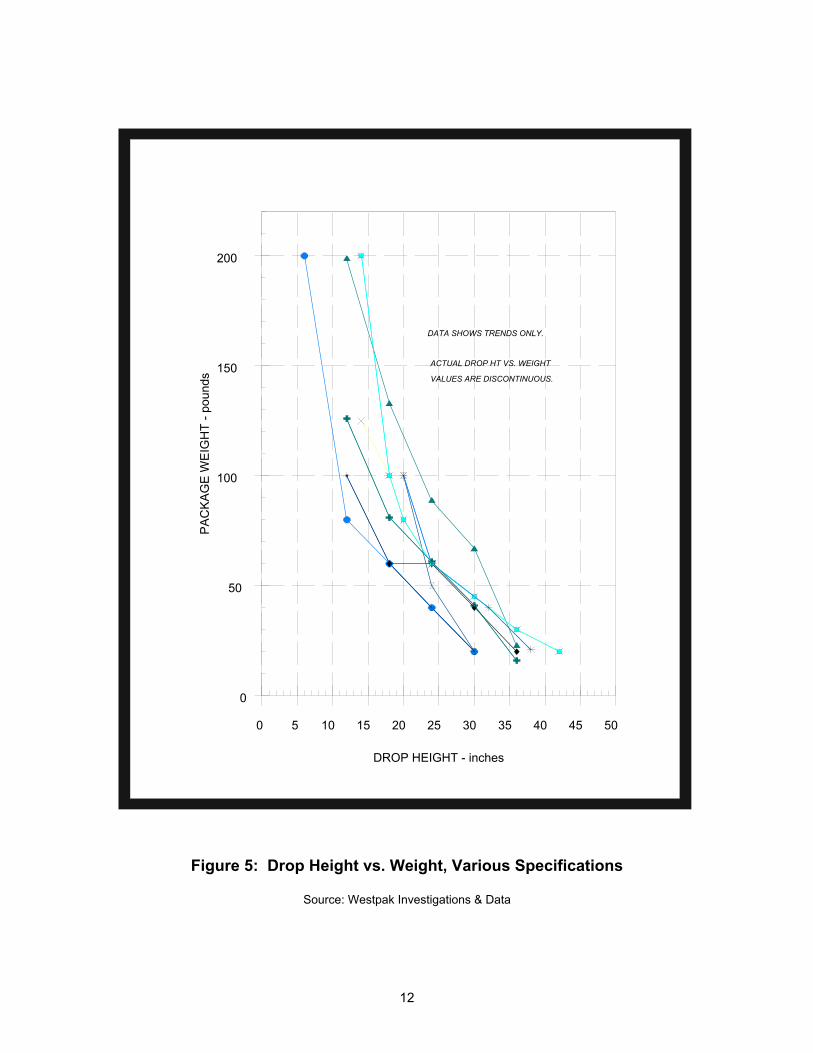
Numerous studies have been conducted attempting to define the package drop height and package weight combinations that are typical of manual handling. The most frequently quoted study, FPL-22(4), from the Forest Products Laboratory is a summation of a great deal of data previously collected. However, if one closely examines the data and the methods used to collect it, one glaring flaw is apparent. The data is generally collected on a single package of a given weight, and the drop height associated with that package and weight combination are given as a probability function. Namely, the probability of a given drop height for that particular combination. The same information for lighter or heavier package systems is normally collected using different instruments, and therefore, the drop height vs. package weight comparison is at best an indirect one. In addition the accuracy of the various devices used to collect this data is extremely questionable. In attempting to correlate the various pieces of drop height recording equipment available, the author found a great deal of variability in even the most state of the art equipment. For more information, refer to "Package Drop Height: What is the Data Really Telling Us?"(5) available from Westpak. Eventually the package drop height studies will make their way into specifications dictating the design drop heights for package systems of various weights. It is interesting to plot the variations that occur amongst specifications in the public domain. The graph in Figure 5 shows such a comparison.
12
DROP HEIGHT - inches
PAC
KAG
E W
EIG
HT
- pou
nds
0 5 10 15 20 25 30 35 40 45 50
0
50
100
150
200
DATA SHOWS TRENDS ONLY.
ACTUAL DROP HT VS. WEIGHT
VALUES ARE DISCONTINUOUS.
Figure 5: Drop Height vs. Weight, Various Specifications
Source: Westpak Investigations & Data

13
NUMBER AND ORIENTATIONS OF IMPACTS DURING A PACKAGE DROP TEST PROCEDURE
The most common, and often quoted, drop test procedure is the ISTA Procedure 1A 10-drop procedure which includes one drop on a base corner, one drop on each edge radiating from that corner, and one on each flat face of the package; a total of 10 impacts. All of these drops are from the "design drop height". It is unknown how the ISTA procedure developed. It is, however, widely used and widely accepted. Other procedures use different drop heights, number of impacts, and orientations. Some electronic firms do not specify the exact corner for an impact; only that it should be the "most vulnerable" corner. Other procedures test all corners and edges in an attempt to make sure that nothing slips through the cracks. Some companies that historically trans-ship products use a higher number of drops. That is, companies that receive a product from its original manufacturer, provide some level of upgrade to the product, and then redistribute it. The theory is that this "double shipment" will result in a higher exposure of drops of the product, and therefore, that should be tested. The chart in Figure 6 summarizes some of the existing specifications in the public domain as far as the number and orientation of impacts.

14
SPECIFICATIONS NUMBER OF
DROPS
ORIENTATIONS
ISTA 1A 10 6 flat, 1 corner, 3 edges
Fed Std 101 6 6 flat
ASTM D4169 6-13 flat, corner, edge
Computer Co. A 10 6 flat, 1 corner, 3 edges
Monitor Co. B 14 6 flat, 2 corners, 6 edges
Computer Co. B 8 6 flat, 1 corner, 1 edge
Computer Co. C 28 12 flat, 4 corners, 12 edges
Figure 6: Summary of Drop Test Specifications
Source: Westpak Investigations & Data
It is suggested that the flat impacts be conducted at a drop height slightly lower than the corner and edge impacts and that the total corners and edges should equal at least six. The reason for this comes from environmental data such as that contained in FPL-22 (4), which tells us clearly that most impacts are on their base and the others more or less evenly distributed about the container system. Another interesting piece of environmental data is that very few flat impacts actually occur. Most of the drops are on the corner or edges of the package system.
15
EFFECT OF DROP HEIGHT AND TEST PROCEDURE ON PACKAGE DESIGN
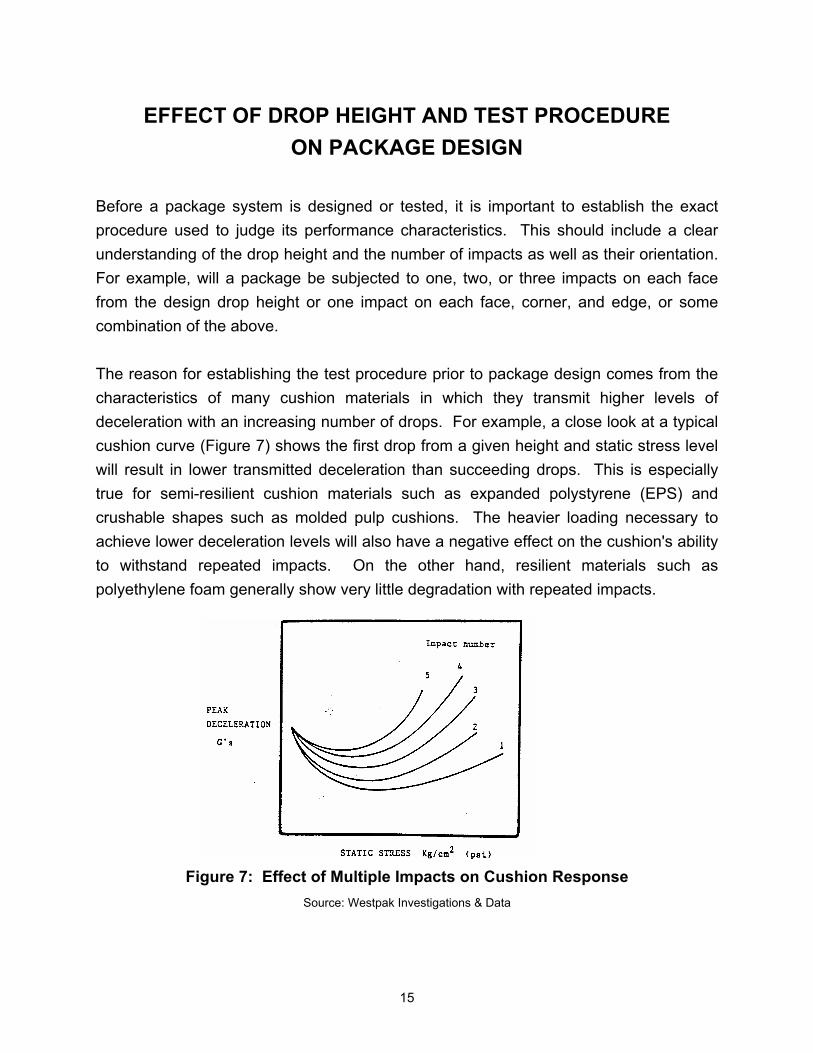
Before a package system is designed or tested, it is important to establish the exact procedure used to judge its performance characteristics. This should include a clear understanding of the drop height and the number of impacts as well as their orientation. For example, will a package be subjected to one, two, or three impacts on each face from the design drop height or one impact on each face, corner, and edge, or some combination of the above. The reason for establishing the test procedure prior to package design comes from the characteristics of many cushion materials in which they transmit higher levels of deceleration with an increasing number of drops. For example, a close look at a typical cushion curve (Figure 7) shows the first drop from a given height and static stress level will result in lower transmitted deceleration than succeeding drops. This is especially true for semi-resilient cushion materials such as expanded polystyrene (EPS) and crushable shapes such as molded pulp cushions. The heavier loading necessary to achieve lower deceleration levels will also have a negative effect on the cushion's ability to withstand repeated impacts. On the other hand, resilient materials such as polyethylene foam generally show very little degradation with repeated impacts.
Figure 7: Effect of Multiple Impacts on Cushion Response Source: Westpak Investigations & Data
16
The result is that if one were designing an EPS pack for single impact verification test procedure, the static loading would be different (probably heavier) than if the test procedure required multiple impacts on the same face. However, if one were using a polyethylene foam design, it would probably make little difference if a test procedure called for one impact on each face or multiple impacts. The test procedure should be clearly established prior to cushion design.

17
PERFORMANCE VS. QUANTITATIVE ANALYSIS TESTING PROCEDURES
There is a subtle but distinct difference between the performance and the quantitative analysis characteristics of the package system both in terms of the design criteria and the testing used to verify compliance with those criteria. Quantitative analysis of the package refers to the ability to mitigate shock inputs to a level below product fragility. This is distinguished from performance that refers to the ability of the package system itself to withstand the normal forces involved in the distribution process and hold together. It is very possible to design a package which has the proper laboratory performance characteristics but will not withstand the forces typical of the real shipping environment. Package quantitative analysis testing normally involves a series of flat impacts where the deceleration level transmitted through the cushion material is monitored by appropriate instrumentation. The transmitted deceleration level will result in a passing or failing grade for the cushion characteristics. This is a quantitative test in that numbers will result. Shock performance, on the other hand, refers to the ability of the package to perform its primary function, namely, safe product delivery, and is generally verified by a series of corner and edge impacts typical of the ISTA and ASTM D4169 test procedures. No monitoring is called for or necessary with these tests. This is a qualitative test in that the ability of the package to protect the product is verified by the end result, not necessarily by a deceleration reading of the product during the test. It is interesting to note that design quantitative analysis is something that is taught in universities and can be verified by analytical techniques. Design performance, however, is something that you must learn by experience, and it is probably more art than science. It is indeed rare to find a designer who can successfully integrate both characteristics into a package cushion design.

18
LOCATION OF THE RESPONSE ACCELEROMETERS
When conducting a package performance test, it is important to locate response accelerometers in a position and orientation such that a proper reading is obtained. Improper location of the accelerometers or faulty mounting can result in erroneous data. As a general rule, it's best to have the accelerometer as low as possible on the face of the product at the most rigid location possible. This tends to minimize the distortions that occur when a product deflects into a cushion in a non-linear fashion. It's also important to tie down or restrict as many suspended and loose components in the product as possible. During a dynamic input, all spring/mass systems within the product will be excited and the response accelerometer will pick up that information. However, the purpose of the testing is to determine the amount of shock transmitted through the cushion, not necessarily how various products respond when they are excited. Therefore, it's important to locate the accelerometer in a position that minimizes this type of confusion. A common practice used by Westpak is the use of three accelerometers, or a triaxial accelerometer, when appropriate, for measuring each impact during a package drop test procedure. There are several important advantages to this. The first is that the package need not be opened between various drops in order to relocate a single accelerometer. This results in a much faster test procedure. It's also less disruptive on the package system. Of greater significance is the fact that the engineer can determine the amount of non-linear compression of the cushion material itself. Sometimes the cross axis "coupling" of the product can be significant, and this can only be determined with the use of three accelerometers.

19
With the appropriate software, one can also use a vector analysis to determine the net effect of a corner or edge impact. The actual value of deceleration transmitted through the corners and edges of a cushion is not a very useful number because fragility analysis is normally not conducted in this orientation. However, if cushion bottoming tends to occur in any of these orientations, it will clearly show up on one or more of the individual accelerometers and on the resultant vector. Refer to Figure 8 for more details.
Figure 8: Vector Sum Analysis From Triaxial Input Source: Westpak Investigations & Data
20
CONDUCTING THE DROP TEST
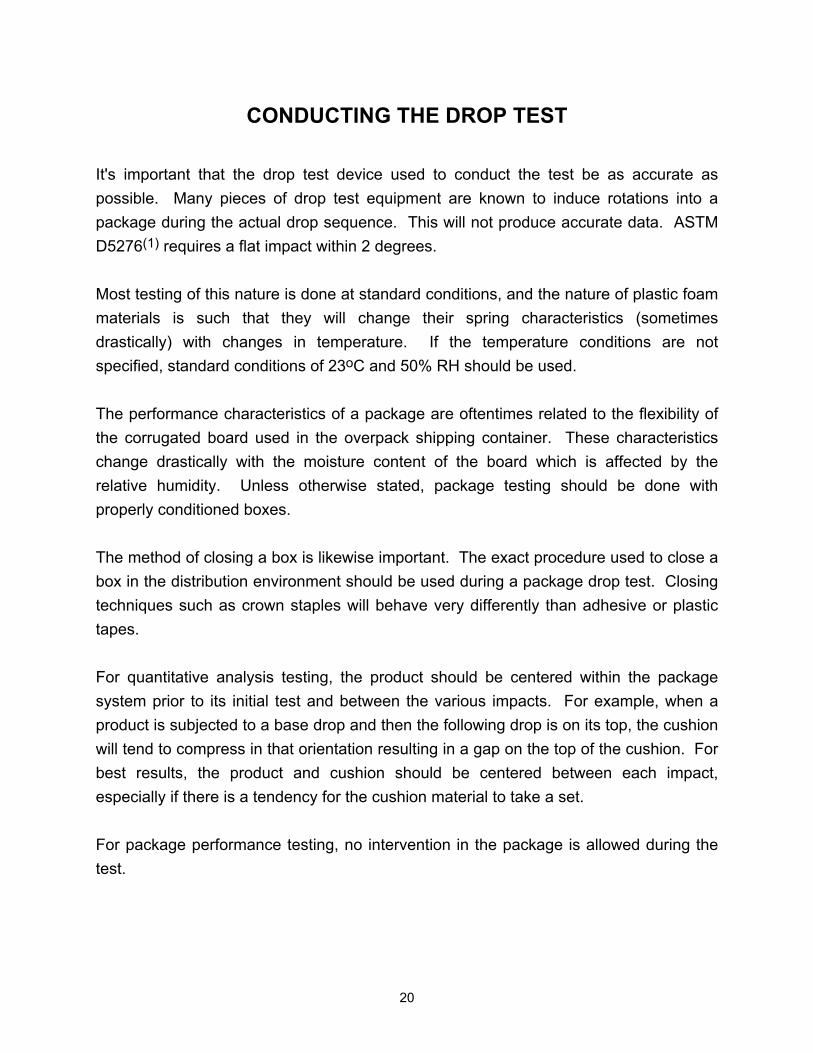
It's important that the drop test device used to conduct the test be as accurate as possible. Many pieces of drop test equipment are known to induce rotations into a package during the actual drop sequence. This will not produce accurate data. ASTM D5276(1) requires a flat impact within 2 degrees. Most testing of this nature is done at standard conditions, and the nature of plastic foam materials is such that they will change their spring characteristics (sometimes drastically) with changes in temperature. If the temperature conditions are not specified, standard conditions of 23oC and 50% RH should be used. The performance characteristics of a package are oftentimes related to the flexibility of the corrugated board used in the overpack shipping container. These characteristics change drastically with the moisture content of the board which is affected by the relative humidity. Unless otherwise stated, package testing should be done with properly conditioned boxes. The method of closing a box is likewise important. The exact procedure used to close a box in the distribution environment should be used during a package drop test. Closing techniques such as crown staples will behave very differently than adhesive or plastic tapes. For quantitative analysis testing, the product should be centered within the package system prior to its initial test and between the various impacts. For example, when a product is subjected to a base drop and then the following drop is on its top, the cushion will tend to compress in that orientation resulting in a gap on the top of the cushion. For best results, the product and cushion should be centered between each impact, especially if there is a tendency for the cushion material to take a set. For package performance testing, no intervention in the package is allowed during the test.

21
COLLECTING THE DATA
During a drop test, the data should be collected using some type of data gathering systems such as an oscilloscope (in its simplest form) or a transient capture and analysis system that is much more preferred. Normally these transient capture systems can easily collect 4 channels (or more) of data and therefore show the x, y, and z axes simultaneously. Once the package response data has been captured in its broad band (unfiltered) format, the signal can be filtered using digital filtering techniques in which the high frequency cut off is operator selectable. This is a very useful tool that allows the test operator to filter out unwanted high frequency "superposed noise" while retaining the bulk of the useful data. It also helps eliminate the human filtering or "faring" which normally occurs with a noisy response pulse. The operator must also avoid the trap of over-filtering the response pulse in which serious data distortions can occur. Figure 9 shows an example of a broad band and filtered pulse using this technique.
Figure 9: Broadband (unfiltered) Top and Filtered Response Data Source: Westpak Investigations & Data

22
Many engineers have not been exposed to the broad band response of a packaged item during a drop test, and it may be beneficial for them to see the degree of superimposed noise that normally exists on a package response pulse. It would be particularly useful to attempt to determine the lowest natural frequency of an unfiltered waveform without benefit of an analytical tool. Filtering the pulse in ratios of its lowest component frequency starting with .5 times its frequency and then going on to 1.0, 2.0, 5.0 and 10 times that frequency makes the effect readily apparent. For most package drop testing, Westpak recommends a filter frequency no lower than 10 times the pulse frequency. (See Figure 10)
Figure 10: Effect of Pulse Filtering (Source: Westpak data) Where post filtering of the data is not available because of equipment limitations, we recommend a level of no less than 500 Hz for package drop testing and 2000 Hz for product fragility analysis such as Damage Boundary or velocity change tests. Remember that the best filter is no filter at all, so if you can possibly get away without filtering data, that's the best option.
HALF SINE
HAVERSINE
COMPLEX
SQUARE WAVE

23
SRS The use of Shock Response Spectrum (SRS) analysis is slowly gaining acceptance in the area of package drop testing. Using this technique, a maximum tolerance band is created during the product fragility testing, and this becomes the upper band above which the package response acceleration cannot go. The advantage of this approach is that it is potentially very accurate and relatively easy to do. Of greater significance is the fact that no filtering of the data is necessary or allowed. Thus the chances for distorted laboratory data are reduced.
Figure 11: SRS Used for Package Performance Tests Source: Westpak Investigations & Data
It is known that influential companies such as IBM have begun to incorporate this technique into their standard package test procedures. Likely this trend will continue as the analysis technique becomes more widespread and better understood. Refer to SRS De-Mystified in "The Perfect Package" (6) newsletter.
Frequency Domain Signal
Time Domain Signal

24
DATA ANALYSIS
Once the data has been collected and properly formatted, an analysis will reveal much about the impact of the packaged product during a drop test. The first thing that's readily apparent is the peak deceleration transmitted through the cushion. This is the peak of the waveform measured from the baseline. In many cases, this is the only passing or failing criteria applied to the test. However, much more data is available. The first thing that should be checked is the total velocity change or the integral of the acceleration vs. time waveform. We know from previous analysis that this number must be somewhere between the impact velocity from the package drop height and two times the impact velocity. However, if the velocity change number is smaller than the impact velocity or greater than two times the impact velocity, something is wrong with the data, and it should be investigated. As a practical matter, the velocity change at impact from a package drop test is almost always between 1.2 and 1.7 times the impact velocity.
Figure 12: Package Drop Test Waveforms (Source: Westpak) Properly Loaded (left) and Underloaded (right)
25
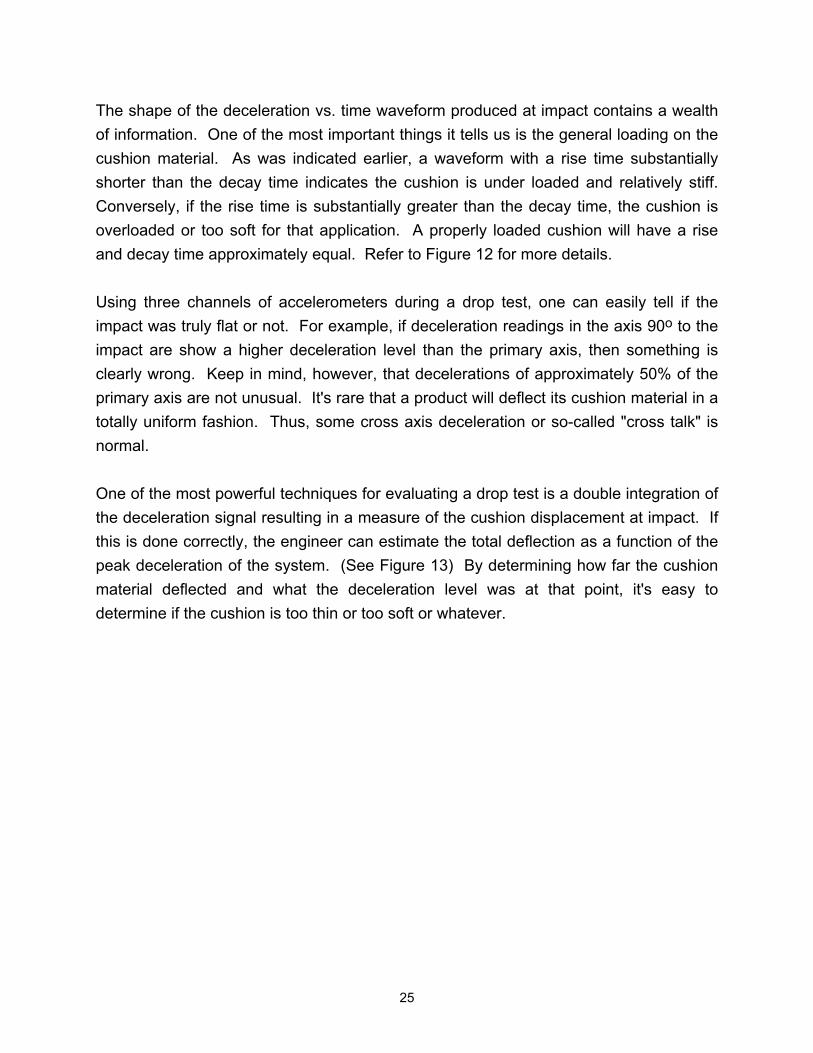
The shape of the deceleration vs. time waveform produced at impact contains a wealth of information. One of the most important things it tells us is the general loading on the cushion material. As was indicated earlier, a waveform with a rise time substantially shorter than the decay time indicates the cushion is under loaded and relatively stiff. Conversely, if the rise time is substantially greater than the decay time, the cushion is overloaded or too soft for that application. A properly loaded cushion will have a rise and decay time approximately equal. Refer to Figure 12 for more details. Using three channels of accelerometers during a drop test, one can easily tell if the impact was truly flat or not. For example, if deceleration readings in the axis 90o to the impact are show a higher deceleration level than the primary axis, then something is clearly wrong. Keep in mind, however, that decelerations of approximately 50% of the primary axis are not unusual. It's rare that a product will deflect its cushion material in a totally uniform fashion. Thus, some cross axis deceleration or so-called "cross talk" is normal. One of the most powerful techniques for evaluating a drop test is a double integration of the deceleration signal resulting in a measure of the cushion displacement at impact. If this is done correctly, the engineer can estimate the total deflection as a function of the peak deceleration of the system. (See Figure 13) By determining how far the cushion material deflected and what the deceleration level was at that point, it's easy to determine if the cushion is too thin or too soft or whatever.
26
Figure 13: Integration of Deceleration Waveform (Source: Westpak data) Care should be exercised in this process. Improper integration will result in strange numbers and the resulting inaccuracy of the analysis. The old adage of "garbage in, garbage out" certainly applies.
27
USE OF A SHOCK MACHINE IN PLACE OF A DROP TESTER
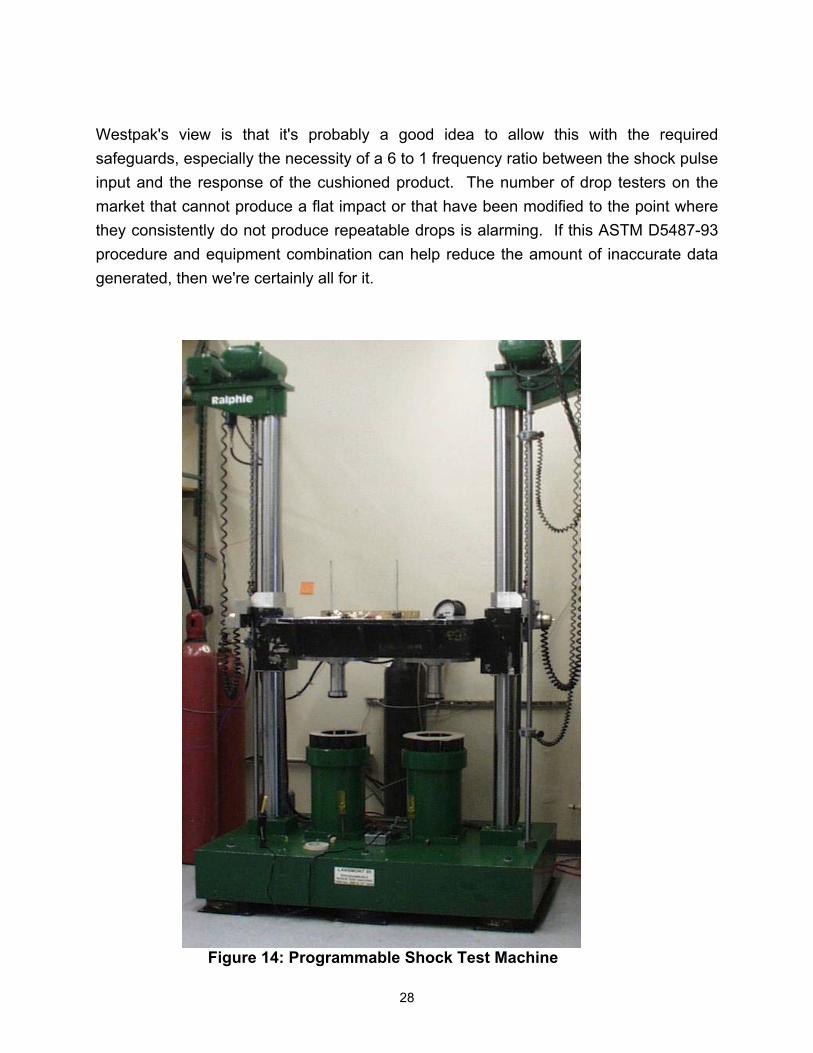
For some time now, some test equipment manufacturers have proclaimed that using a shock machine (see figure 14) in place of a drop tester will result in more accurate and repeatable drop test data. The technique involves using short duration half sine programmers on the shock machine and equating the velocity change at impact to the freefall impact velocity of the design drop height for the package. The only requirement is that the responding cushion system have a frequency at least 6 times lower than the input shock pulse frequency.
∆ V (from shock machine) = (?) Vi (from the design drop height)
The advantages claimed for this approach are that it is potentially much more accurate and that precise orientation of the package can be maintained throughout the entire drop procedure. This includes flat, corner, and edge impacts. Another advantage is that it is potentially cost saving in that one machine can function for the requirements of two. That is, if a laboratory has a shock machine anyway to conduct product fragility analysis, they would not need to buy a separate drop test machine for that purpose only. The disadvantages of this approach include the fact that it hasn't been proven to everyone's satisfaction that there is an equivalence between the velocity change on the shock machine and the freefall impact velocity from a drop tester. However, studies conducted by Westpak several years ago showed good correlation between the two using the enclosed test block with various cushion samples.
28
Westpak's view is that it's probably a good idea to allow this with the required safeguards, especially the necessity of a 6 to 1 frequency ratio between the shock pulse input and the response of the cushioned product. The number of drop testers on the market that cannot produce a flat impact or that have been modified to the point where they consistently do not produce repeatable drops is alarming. If this ASTM D5487-93 procedure and equipment combination can help reduce the amount of inaccurate data generated, then we're certainly all for it.
Figure 14: Programmable Shock Test Machine

29
CONCLUSIONS
Package drop testing can be an accurate and useful tool in package performance evaluation if:
1. The correct procedure is used 2. For the correct reason 3. The testing is conducted in a conscientious manner using good
laboratory practice 4. The transducers are located in the proper orientation and locations 5. The test is run on accurate and repeatable equipment 6. The data is collected and treated in a rational fashion 7. The results are used in a defensible way to accept or reject the
performance of the package
Westpak is often called on to do so-called “referee testing” on package drop performance because two or more different laboratories got different results when testing the same product or package. Inaccurate results can often be traced to failure to follow one or more of the guidelines presented herein. The advice given to football players by the late, great Vince Lombardi of the Green Bay Packers certainly helps in accurate drop testing as well: "Do the right things right all the time."
30
REFERENCES
1. American Society for Testing and materials, 1916 Race Street, Philadelphia, PA. 2. Brody, et al: Encyclopedia of Packaging Technology, "Testing, Cushion Materials",
copyright (c) 1996 by John Wiley & Sons, Inc. 3. Schueneman, Herbert H. "A Comparison of Three Different Cushion Test Methods."
Prepared for the Symposium on Current Trends in Protective Packaging of Computers and Electronic Components, October 22-24, 1986, Phoenix, Arizona.
4. Forest Products Laboratory, "An Assessment of the Common Carrier Shipping
Environment," General Technical Report FPL 22, U.S. Department of Agriculture, Madison WI, 1979
5. Schueneman, Herbert H. "Re-Examining the Package Drop Height Environment:
What is the Data Really Telling Us?", Westpak, Inc., San Jose, CA. 6. "SRS De-Mystified", The Perfect Package, Westpak, Inc., San Jose, CA. 7. Henderson, George. "Advanced Techniques for Shock and Vibration Analysis as
Applied to Distribution Engineering," GHI Systems, Incorporated.
Revised 100203