package ‘aim’ - cran.microsoft.com filebackfit.lm.main 3 backfit.lm.main internal function used...
TRANSCRIPT

Package ‘AIM’February 19, 2015
Title AIM: adaptive index model
Version 1.01
Author L. Tian and R. Tibshirani
Description R functions for adaptively constructing index models forcontinuous, binary and survival outcomes. Implementationrequires loading R-pacakge ``survival''
Maintainer Robert Tibshirani <[email protected]>
LazyLoad false
LazyData false
Depends survival
Imports survival
License LGPL-2
Repository CRAN
Date/Publication 2010-04-05 19:01:20
NeedsCompilation no
R topics documented:backfit.cox.interaction . . . . . . . . . . . . . . . . . . . . . . . . . . . . . . . . . . . . 2backfit.cox.main . . . . . . . . . . . . . . . . . . . . . . . . . . . . . . . . . . . . . . . 2backfit.lm.interaction . . . . . . . . . . . . . . . . . . . . . . . . . . . . . . . . . . . . 2backfit.lm.main . . . . . . . . . . . . . . . . . . . . . . . . . . . . . . . . . . . . . . . 3backfit.logistic.interaction . . . . . . . . . . . . . . . . . . . . . . . . . . . . . . . . . . 3backfit.logistic.main . . . . . . . . . . . . . . . . . . . . . . . . . . . . . . . . . . . . . 3cox.interaction . . . . . . . . . . . . . . . . . . . . . . . . . . . . . . . . . . . . . . . 4cox.main . . . . . . . . . . . . . . . . . . . . . . . . . . . . . . . . . . . . . . . . . . . 5cv.cox.interaction . . . . . . . . . . . . . . . . . . . . . . . . . . . . . . . . . . . . . . 7cv.cox.main . . . . . . . . . . . . . . . . . . . . . . . . . . . . . . . . . . . . . . . . . 9cv.lm.interaction . . . . . . . . . . . . . . . . . . . . . . . . . . . . . . . . . . . . . . 11cv.lm.main . . . . . . . . . . . . . . . . . . . . . . . . . . . . . . . . . . . . . . . . . . 13cv.logistic.interaction . . . . . . . . . . . . . . . . . . . . . . . . . . . . . . . . . . . . 15cv.logistic.main . . . . . . . . . . . . . . . . . . . . . . . . . . . . . . . . . . . . . . . 17
1

2 backfit.lm.interaction
index.prediction . . . . . . . . . . . . . . . . . . . . . . . . . . . . . . . . . . . . . . . 19lm.interaction . . . . . . . . . . . . . . . . . . . . . . . . . . . . . . . . . . . . . . . . 20lm.main . . . . . . . . . . . . . . . . . . . . . . . . . . . . . . . . . . . . . . . . . . . 22logistic.interaction . . . . . . . . . . . . . . . . . . . . . . . . . . . . . . . . . . . . . 23logistic.main . . . . . . . . . . . . . . . . . . . . . . . . . . . . . . . . . . . . . . . . . 25
Index 28
backfit.cox.interaction
Internal function used in cox.interaction
Description
Internal functions used in cox.interaction
Author(s)
Lu Tian and Robert Tibshirani
backfit.cox.main Internal function used in cox.main
Description
Internal functions used in cox.main
Author(s)
Lu Tian and Robert Tibshirani
backfit.lm.interaction
Internal function used in lm.interaction
Description
Internal functions used in lm.interaction
Author(s)
Lu Tian and Robert Tibshirani

backfit.lm.main 3
backfit.lm.main Internal function used in lm.main
Description
Internal functions used in lm.main
Author(s)
Lu Tian and Robert Tibshirani
backfit.logistic.interaction
Internal function used in logistic.interaction
Description
Internal functions used in logistic.interaction
Author(s)
Lu Tian and Robert Tibshirani
backfit.logistic.main Internal function used in logistic.main
Description
Internal functions used in logistic.main
Author(s)
Lu Tian and Robert Tibshirani
4 cox.interaction
cox.interaction Interaction Cox adaptive index model
Description
Estimate adpative index model for survival outcomes in the context of Cox regression. The resultingindex characterizes the interaction between covariates and treatment.
Usage
cox.interaction(x, trt, y, delta, nsteps=8, mincut=.1, backfit=F, maxnumcut=1, dirp=0)
Arguments
x n by p matrix. The covariate matrix
trt n vector. The treatment indicator
y n vector. The observed follow-up time
delta n 0/1 vector. The status indicator. 1=failure and 0=alive.
nsteps the maximum number of binary rules to be included in the index
mincut the minimum cutting proportion for the binary rule at either end. It typically isbetween 0 and 0.2.
backfit T/F. Whether the existing split points are re-adjusted after including new a binaryrule
maxnumcut the maximum number of binary splits per predictor
dirp p vector. The given direction of the binary split for each of the p predictors.0 represents "no pre-given direction"; 1 represents "(x>cut)" and -1 represents"(x<cut)". Alternatively, "dirp=0" represents that there is no pre-given directionfor any of the predictor.
Details
cox.interaction sequentially estimates a sequence of adaptive index models with up to "nsteps"terms for survival outcomes. The aglorithm seeks the index having the strong interaction with thetreatment in the Cox regression. The appropriate number of binary rules can be selected via K-foldcross-validation (cv.cox.interaction).
Value
cox.interaction returns maxsc, which is the observed partial likelihood score test statistics forthe index*treatment interaction in the fitted model and res, which is a list with components
jmaa number of predictors
cutp split points for the binary rules
maxdir direction of split: 1 represents "(x>cut)" and -1 represents "(x<cut)"
maxsc observed partial likelihood score test statistics for the interaction
cox.main 5
Author(s)
Lu Tian and Robert Tibshirani
References
Lu Tian and Robert Tibshirani (2010) "Adaptive index models for marker-based risk stratification",Tech Report, available at http://www-stat.stanford.edu/~tibs/AIM.
Examples
## generate dataset.seed(1)
n=400p=10x=matrix(rnorm(n*p), n, p)z=(x[,1]<0.2)+(x[,5]>0.2)beta=1trt=rbinom(n,1,0.5)fail.time=rexp(n)*exp(-beta*z*trt)cen.time=rexp(n)*1.25y=pmin(fail.time, cen.time)y=round(y*10)/10delta=1*(fail.time<cen.time)
## fit the interaction Cox AIM modela=cox.interaction(x, trt, y, delta, nsteps=10)
## examine the model sequenceprint(a)
## compute the index based on the 2nd model in the sequence using data xz.prd=index.prediction(a$res[[2]],x)
## compute the index based on the 2nd model of the sequence using new data xx, and compare the result with the true indexnn=10xx=matrix(rnorm(nn*p), nn, p)zz=(xx[,1]<0.2)+(xx[,5]>0.2)zz.prd=index.prediction(a$res[[2]],xx)cbind(zz, zz.prd)
cox.main Main effect Cox adaptive index model
Description
Estimate adpative index model for survival outcomes in the context of Cox regression. The resultingindex characterizes the main covariate effect on the hazard.

6 cox.main
Usage
cox.main(x, y, delta, nsteps=8, mincut=.1, backfit=F, maxnumcut=1, dirp=0)
Arguments
x n by p matrix. The covariate matrix
y n vector. The observed follow-up time
delta n 0/1 vector. The status indicator. 1=failure and 0=alive.
nsteps the maximum number of binary rules to be included in the index
mincut the minimum cutting proportion for the binary rule at either end. It typically isbetween 0 and 0.2.
backfit T/F. Whether the existing split points are adjusted after including a new binaryrule
maxnumcut the maximum number of binary splits per predictor
dirp p vector. The given direction of the binary split for each of the p predictors. 0represents "no pre-given direction"; 1 represents "(x>cut)"; -1 represents "(x<cut)".Alternatively, "dirp=0" represents that there is no pre-given direction for any ofthe predictor.
Details
cox.main sequentially estimates a sequence of adaptive index models with up to "nsteps" termsfor survival outcomes. The appropriate number of binary rules can be selected via K-fold cross-validation (cv.cox.main).
Value
cox.main returns maxsc, which is the partial likelihood score test statistics in the fitted model andres, which is a list with components
jmaa number of predictors
cutp split points for the binary rules
maxdir direction of split: 1 represents "(x>cut)" and -1 represents "(x<cut)"
maxsc observed partial likelihood score test statistics for the main effect
Author(s)
Lu Tian and Robert Tibshirani
References
Lu Tian and Robert Tibshirani (2010) "Adaptive index models for marker-based risk stratification",Tech Report, available at http://www-stat.stanford.edu/~tibs/AIM.
cv.cox.interaction 7
Examples
## generate dataset.seed(1)
n=200p=10x=matrix(rnorm(n*p), n, p)z=(x[,1]<0.2)+(x[,5]>0.2)beta=1fail.time=rexp(n)*exp(-beta*z)cen.time=rexp(n)*1.25y=pmin(fail.time, cen.time)y=round(y*10)/10delta=1*(fail.time<cen.time)
## fit the main effect Cox AIM modela=cox.main(x, y, delta, nsteps=10)
## examine the model sequenceprint(a)
## compute the index based on the 2nd model of the sequence using data xz.prd=index.prediction(a$res[[2]],x)
## compute the index based on the 2nd model of the sequence using new data xx, and compare the result with the true indexnn=10xx=matrix(rnorm(nn*p), nn, p)zz=(xx[,1]<0.2)+(xx[,5]>0.2)zz.prd=index.prediction(a$res[[2]],xx)cbind(zz, zz.prd)
cv.cox.interaction Cross-validation in the interaction Cox AIM
Description
Cross-validation for selecting the number of binary rules in interaction AIM with survival outcomesin the context of Cox regression.
Usage
cv.cox.interaction(x, trt, y, status, K.cv=5, num.replicate=1, nsteps, mincut=0.1, backfit=F, maxnumcut=1, dirp=0)
Arguments
x n by p matrix. The covariate matrix
trt n vector. The treatment indicator

8 cv.cox.interaction
y n vector. The observed follow-up time
status n 0/1 vector. The status indicator. 1=failure and 0=alive.
K.cv K.cv-fold cross validation
num.replicate number of independent replications of K-fold cross validations.
nsteps the maximum number of binary rules to be included in the index
backfit T/F. Whether the existing split points are adjusted after including a new binaryrule
mincut the minimum cutting proportion for the binary rule at either end. It typically isbetween 0 and 0.2.
maxnumcut the maximum number of binary splits per predictor
dirp p vector. The given direction of the binary split for each of the p predictors. 0represents "no pre-given direction"; 1 represents "(x>cut)"; -1 represents "(x<cut)".Alternatively, "dirp=0" represents that there is no pre-given direction for any ofthe predictor.
Details
cv.cox.interaction implements K-fold cross-validation for the interaction Cox AIM. It estimatesthe partial likelihood score test statistics for testing the treatment*index interaction in the test set. Italso provides pre-validated fits for each observation and pre-validated partial likelihood score teststatistics. The output can be used to select the optimal number of binary rules.
Value
cv.cox.interaction returns
kmax the optimal number of binary rules based the cross-validation
meanscore nsteps-vector. The cross-validated partial likelihood score test statistics (signifi-cant at 0.05, if greater than 1.96) for the treatment*index interaction.
pvfit.score nsteps-vector. The pre-validated partial likelihood score test statistics (signifi-cant at 0.05, if greater than 1.96) for the treatment*index interaction.
preval nsteps by n matrix. Pre-validated fits for individual observation
References
L Tian and R Tibshirani Adaptive index models for marker-based risk stratification, Tech Report,available at http://www-stat.stanford.edu/~tibs/AIM.
R Tibshirani and B Efron, Pre-validation and inference in microarrays, Statist. Appl. Genet. Mol.Biol., 1:1-18, 2002.
Author(s)
Lu Tian and Robert Tibshirani

cv.cox.main 9
Examples
## generate dataset.seed(1)
n=400p=10x=matrix(rnorm(n*p), n, p)z=(x[,1]<0.2)+(x[,5]>0.2)beta=1trt=rbinom(n,1,0.5)fail.time=rexp(n)*exp(-beta*z*trt)cen.time=rexp(n)*1.25y=pmin(fail.time, cen.time)y=round(y*10)/10delta=1*(fail.time<cen.time)
## cross-validate the interaction Cox AIM modela=cv.cox.interaction(x, trt, y, delta, nsteps=10, K.cv=4, num.replicate=5)
## examine the score test statistics for the interaction in the test setpar(mfrow=c(1,2))plot(a$meanscore, type="l")plot(a$pvfit.score, type="l")
## construct the index with the optimal number of binary rulesk.opt=a$kmaxa=cox.interaction(x, trt, y, delta, nsteps=k.opt)print(a)
cv.cox.main Cross-validation in main effect Cox AIM
Description
Cross-validation for selecting the number of binary rules in the main effect AIM with survivaloutcomes.
Usage
cv.cox.main(x, y, status, K.cv=5, num.replicate=1, nsteps, mincut=0.1, backfit=F, maxnumcut=1, dirp=0)
Arguments
x n by p matrix. The covariate matrix
y n vector. The observed follow-up time
status n 0/1 vector. The status indicator. 1=failure and 0=alive.

10 cv.cox.main
K.cv K.cv-fold cross validation
num.replicate number of independent replications of K-fold cross validations.
nsteps the maximum number of binary rules to be included in the index
backfit T/F. Whether the existing split points are adjusted after including new binaryrules
mincut the minimum cutting proportion for the binary rule at either end. It typically isbetween 0 and 0.2.
maxnumcut the maximum number of binary splits per predictor
dirp p vector. The given direction of the binary split for each of the p predictors. 0represents "no pre-given direction"; 1 represents "(x>cut)"; -1 represents "(x<cut)".Alternatively, "dirp=0" represents that there is no pre-given direction for any ofthe predictor.
Details
cv.cox.main implements the K-fold cross-validation for the main effect Cox AIM. It estimates thepartial likelihood score test statistics in the test set for testing the association between the survivaltime and index constructed using training data. It also provides pre-validated fits for each observa-tion and pre-validated partial likelihood score test statistics. The output can be used to select theoptimal number of binary rules.
Value
cv.cox.main returns
kmax the optimal number of binary rules based the cross-validation
meanscore nsteps-vector. The cross-validated partial likelihood score test statistics (signif-icant at 0.05, if greater than 1.96) for the association between survival time andindex.
pvfit.score nsteps-vector. The pre-validated partial likelihood score test statistics (signifi-cant at 0.05, if greater than 1.96) for the association between survival time andindex.
preval nsteps by n matrix. Pre-validated fits for individual observation
References
L Tian and R Tibshirani Adaptive index models for marker-based risk stratification, Tech Report,available at http://www-stat.stanford.edu/~tibs/AIM.
R Tibshirani and B Efron, Pre-validation and inference in microarrays, Statist. Appl. Genet. Mol.Biol., 1:1-18, 2002.
Author(s)
Lu Tian and Robert Tibshirani
cv.lm.interaction 11
Examples
## generate data
set.seed(1)
n=200p=10x=matrix(rnorm(n*p), n, p)z=(x[,1]<0.2)+(x[,5]>0.2)beta=1fail.time=rexp(n)*exp(-beta*z)cen.time=rexp(n)*1.25y=pmin(fail.time, cen.time)y=round(y*10)/10delta=1*(fail.time<cen.time)
## cross-validate the main effect Cox AIMa=cv.cox.main(x, y, delta, nsteps=10, K.cv=3, num.replicate=3)
## examine the test statistics in the test setpar(mfrow=c(1,2))plot(a$meanscore, type="l")plot(a$pvfit.score, type="l")
## construct the index with the optimal number of binary rulesk.opt=a$kmaxa=cox.main(x, y, delta, nsteps=k.opt)print(a)
cv.lm.interaction Cross-validation in interaction linear AIM
Description
Cross-validation for selecting the number of binary rules in the interaction AIM with continuousoutcomes
Usage
cv.lm.interaction(x, trt, y, K.cv=5, num.replicate=1, nsteps, mincut=0.1, backfit=F, maxnumcut=1, dirp=0)
Arguments
x n by p matrix. The covariate matrix
trt n vector. The treatment indicator
12 cv.lm.interaction
y n vector. The continuous response variable
K.cv K.cv-fold cross validation
num.replicate number of independent replications of K-fold cross validations
nsteps the maximum number of binary rules to be included in the index
mincut the minimum cutting proportion for the binary rule at either end. It typically isbetween 0 and 0.2.
backfit T/F. Whether the existing split points are adjusted after including a new binaryrule
maxnumcut the maximum number of binary splits per predictor
dirp p vector. The given direction of the binary split for each of the p predictors. 0represents "no pre-given direction"; 1 represents "(x>cut)"; -1 represents "(x<cut)".Alternatively, "dirp=0" represents that there is no pre-given direction for any ofthe predictor.
Details
cv.lm.interaction implements the K-fold cross-validation for interaction linear AIM. It esti-mates the score test statistics in the test set for testing the treatment*index interaction. It also pro-vides the pre-validated fits for each observation and pre-validated score test statistics. The outputcan be used to select the optimal number of binary rules.
Value
cv.lm.interaction returns
kmax the optimal number of binary rules based the cross-validation
meanscore nsteps-vector. The cross-validated score test statistics (significant at 0.05, ifgreater than 1.96) for the treatment*index interaction
pvfit.score nsteps-vector. The pre-validated score test statistics (significant at 0.05, if greaterthan 1.96) for the treatment*index interaction.
preval nsteps by n matrix. Prevalidated fits for individual observation
References
L Tian and R Tibshirani Adaptive index models for marker-based risk stratification, Tech Report,available at http://www-stat.stanford.edu/~tibs/AIM.
R Tibshirani and B Efron, Pre-validation and inference in microarrays, Statist. Appl. Genet. Mol.Biol., 1:1-18, 2002.
Author(s)
Lu Tian and Robert Tibshirani

cv.lm.main 13
Examples
## generate dataset.seed(1)
n=400p=10x=matrix(rnorm(n*p), n, p)z=(x[,1]<0.2)+(x[,5]>0.2)trt=rbinom(n, 1, 0.5)beta=1y=trt+beta*trt*z+rnorm(n)
## cross-validate the interaction linear AIMa=cv.lm.interaction(x, trt, y, nsteps=10, K.cv=5, num.replicate=3)
## examine the score test statistics in the test setpar(mfrow=c(1,2))plot(a$meanscore, type="l")plot(a$pvfit.score, type="l")
## construct the index with the optimal number of binary rulesk.opt=a$kmaxa=lm.interaction(x, y, trt, nsteps=k.opt)print(a)
cv.lm.main Cross-validation in main effect linear AIM
Description
Cross-validation for selecting the number of binary rules in the main effect linear AIM
Usage
cv.lm.main(x, y, K.cv=5, num.replicate=1, nsteps, mincut=0.1, backfit=F, maxnumcut=1, dirp=0)
Arguments
x n by p matrix. The covariate matrix
y n vector. The continuous response variable
K.cv K.cv-fold cross validation
num.replicate number of independent replications of K-fold cross validations.
nsteps the maximum number of binary rules to be included in the index
mincut the minimum cutting proportion for the binary rule at either end. It typically isbetween 0 and 0.2.
14 cv.lm.main
backfit T/F. Whether the existing split points are adjusted after including new a binaryrule
maxnumcut the maximum number of binary splits per predictor
dirp p vector. The given direction of the binary split for each of the p predictors. 0represents "no pre-given direction"; 1 represents "(x>cut)"; -1 represents "(x<cut)".Alternatively, "dirp=0" represents that there is no pre-given direction for any ofthe predictor.
Details
cv.lm.main implements the K-fold cross-validation for the main effect linear AIM. It estimates thescore test statistics in the test set for testing the association between the continuous response andindex constructed using training data. It also provides pre-validated fits for each observation andthe pre-validated score test statistics. The output can be used to select the optimal number of binaryrules.
Value
cv.lm.main returns
kmax the optimal number of binary rules based the cross-validation
meanscore nsteps-vector. The cross-validated score test statistics (significant at 0.05, ifgreater than 1.96) for the association between survival time and index.
pvfit.score nsteps-vector. The pre-validated score test statistics (significant at 0.05, if greaterthan 1.96) for the association between survival time and index.
preval nsteps by n matrix. Pre-validated fits for individual observation
References
L Tian and R Tibshirani Adaptive index models for marker-based risk stratification, Tech Report,available at http://www-stat.stanford.edu/~tibs/AIM.
R Tibshirani and B Efron, Pre-validation and inference in microarrays, Statist. Appl. Genet. Mol.Biol., 1:1-18, 2002.
Author(s)
Lu Tian and Robert Tibshirani
Examples
## generate dataset.seed(1)
n=400p=10x=matrix(rnorm(n*p), n, p)z=(x[,1]<0.2)+(x[,5]>0.2)beta=1y=beta*z+rnorm(n)
cv.logistic.interaction 15
## cross-validate the linear main effects AIMa=cv.lm.main(x, y, nsteps=10, K.cv=5, num.replicate=3)
## examine score test statistics in the test setpar(mfrow=c(1,2))plot(a$meanscore, type="l")plot(a$pvfit.score, type="l")
## construct the index with the optimal number of binary rulesk.opt=a$kmaxa=lm.main(x, y, nsteps=k.opt)print(a)
cv.logistic.interaction
Cross-validation in interaction logistic AIM
Description
Cross-validation for selecting the number of binary rules in the interaction AIM with binary out-comes.
Usage
cv.logistic.interaction(x, trt, y, K.cv=5, num.replicate=1, nsteps, mincut=0.1, backfit=F, maxnumcut=1, dirp=0, weight=1)
Arguments
x n by p matrix. The covariate matrixtrt n vector. The treatment indicatory n 0/1 vector. The binary response variableK.cv K.cv-fold cross validationnum.replicate number of independent replications of K-fold cross validations.nsteps the maximum number of binary rules to be included in the indexmincut The minimum cutting proportion for the binary rule at either end. It typically is
between 0 and 0.2.backfit T/F. Whether the existing split points are adjusted after including a new binary
rulemaxnumcut The maximum number of binary splits per predictordirp p vector. The given direction of the binary split for each of the p predictors. 0
represents "no pre-given direction"; 1 represents "(x>cut)"; -1 represents "(x<cut)".Alternatively, "dirp=0" represents that there is no pre-given direction for any ofthe predictor.
weight a positive value. The weight given to responses: "weight=0" means that allobservations are equally weighted.
16 cv.logistic.interaction
Details
cv.logistic.interaction implements the K-fold cross-validation for the interaction logisticAIM. It estimates the score test statistics in the test set for testing the treatment*index interac-tion. It also provides pre-validated fits for each observation and pre-validated score test statistic.The output can be used to select the optimal number of binary rules.
Value
cv.logistic.interaction returns
kmax the optimal number of binary rules based the cross-validation
meanscore nsteps-vector. The cross-validated score test statistics (significant at 0.05, ifgreater than 1.96) for the treatment*index interaction.
pvfit.score nsteps-vector, the pre-validated score test statistics (significant at 0.05, if greaterthan 1.96) for the treatment*index interaction.
preval nsteps by n matrix. Prevalidated fits for individual observation
References
L Tian and R Tibshirani Adaptive index models for marker-based risk stratification, Tech Report,available at http://www-stat.stanford.edu/~tibs/AIM.
R Tibshirani and B Efron, Pre-validation and inference in microarrays, Statist. Appl. Genet. Mol.Biol., 1:1-18, 2002.
Author(s)
Lu Tian and Robert Tibshirani
Examples
## generate dataset.seed(1)
n=400p=10x=matrix(rnorm(n*p), n, p)z=(x[,1]<0.2)+(x[,5]>0.2)trt=rbinom(n,1, 0.5)beta=1prb=1/(1+exp(trt-beta*trt*z-0.5))y=rbinom(n,1,prb)
## cross-validate the logistic interaction AIMa=cv.logistic.interaction(x, trt, y, nsteps=10, K.cv=4, num.replicate=5)
## examine score test statistics in the test setpar(mfrow=c(1,2))plot(a$meanscore, type="l")plot(a$pvfit.score, type="l")
cv.logistic.main 17
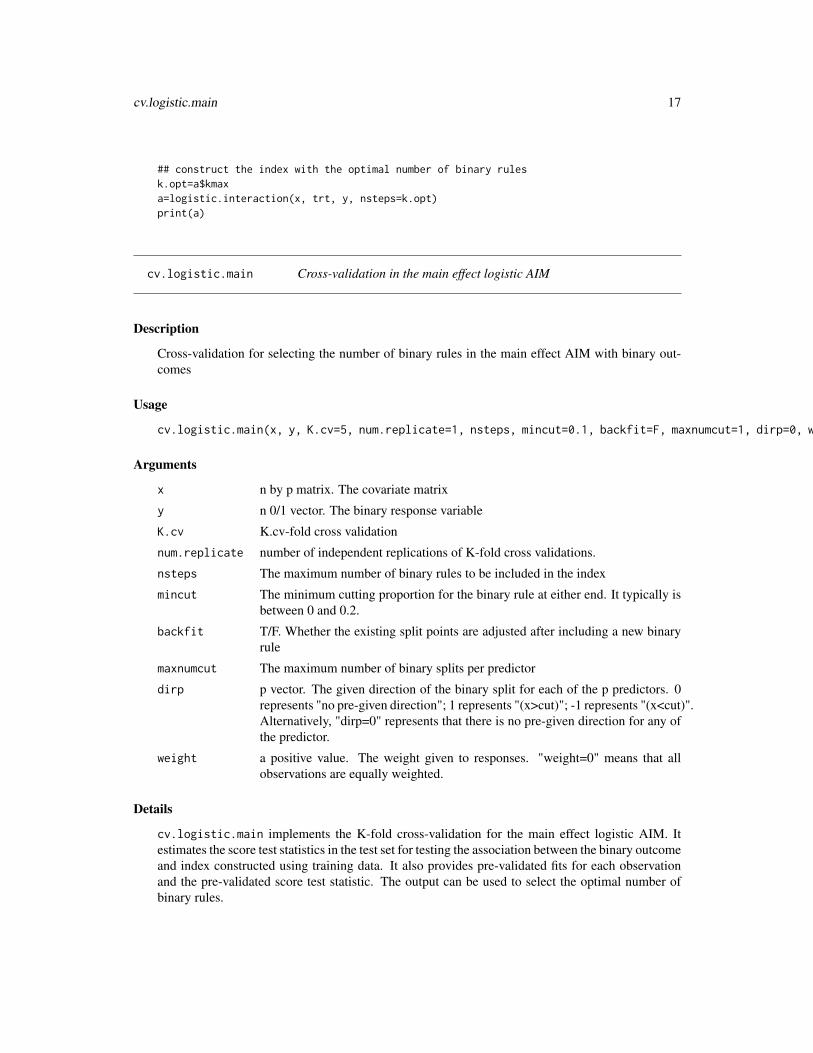
## construct the index with the optimal number of binary rulesk.opt=a$kmaxa=logistic.interaction(x, trt, y, nsteps=k.opt)print(a)
cv.logistic.main Cross-validation in the main effect logistic AIM
Description
Cross-validation for selecting the number of binary rules in the main effect AIM with binary out-comes
Usage
cv.logistic.main(x, y, K.cv=5, num.replicate=1, nsteps, mincut=0.1, backfit=F, maxnumcut=1, dirp=0, weight=1)
Arguments
x n by p matrix. The covariate matrix
y n 0/1 vector. The binary response variable
K.cv K.cv-fold cross validation
num.replicate number of independent replications of K-fold cross validations.
nsteps The maximum number of binary rules to be included in the index
mincut The minimum cutting proportion for the binary rule at either end. It typically isbetween 0 and 0.2.
backfit T/F. Whether the existing split points are adjusted after including a new binaryrule
maxnumcut The maximum number of binary splits per predictor
dirp p vector. The given direction of the binary split for each of the p predictors. 0represents "no pre-given direction"; 1 represents "(x>cut)"; -1 represents "(x<cut)".Alternatively, "dirp=0" represents that there is no pre-given direction for any ofthe predictor.
weight a positive value. The weight given to responses. "weight=0" means that allobservations are equally weighted.
Details
cv.logistic.main implements the K-fold cross-validation for the main effect logistic AIM. Itestimates the score test statistics in the test set for testing the association between the binary outcomeand index constructed using training data. It also provides pre-validated fits for each observationand the pre-validated score test statistic. The output can be used to select the optimal number ofbinary rules.
18 cv.logistic.main
Value
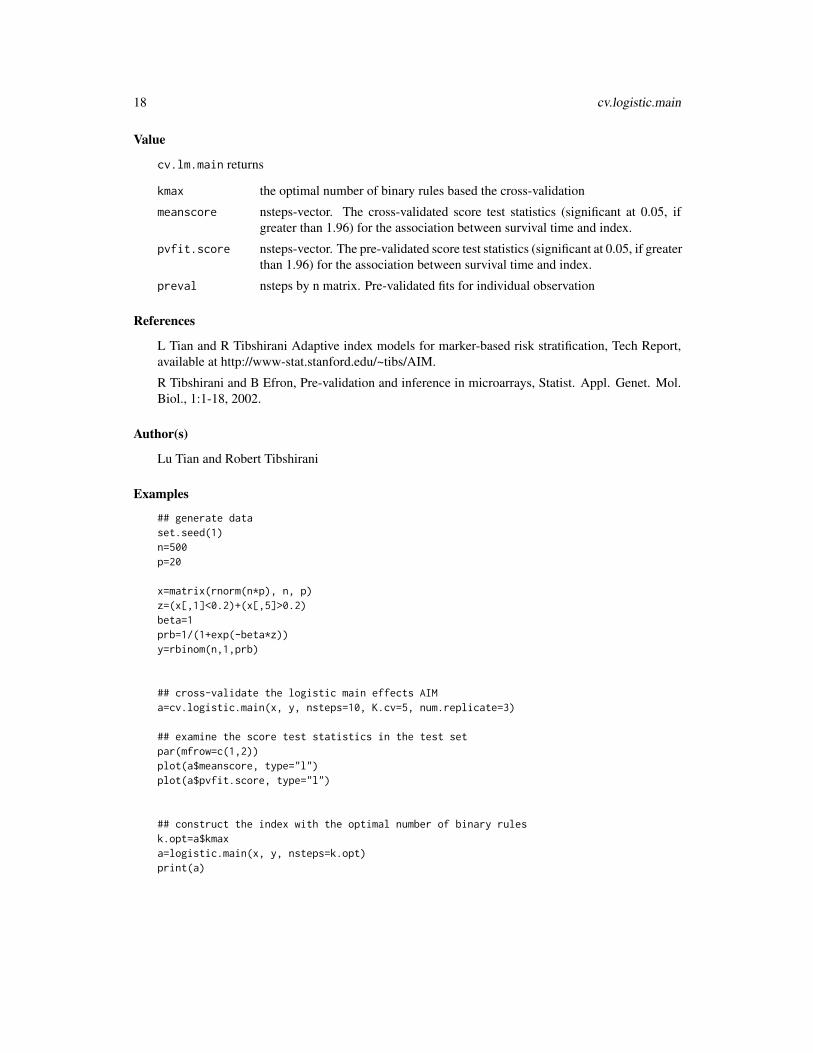
cv.lm.main returns
kmax the optimal number of binary rules based the cross-validation
meanscore nsteps-vector. The cross-validated score test statistics (significant at 0.05, ifgreater than 1.96) for the association between survival time and index.
pvfit.score nsteps-vector. The pre-validated score test statistics (significant at 0.05, if greaterthan 1.96) for the association between survival time and index.
preval nsteps by n matrix. Pre-validated fits for individual observation
References
L Tian and R Tibshirani Adaptive index models for marker-based risk stratification, Tech Report,available at http://www-stat.stanford.edu/~tibs/AIM.
R Tibshirani and B Efron, Pre-validation and inference in microarrays, Statist. Appl. Genet. Mol.Biol., 1:1-18, 2002.
Author(s)
Lu Tian and Robert Tibshirani
Examples
## generate dataset.seed(1)n=500p=20
x=matrix(rnorm(n*p), n, p)z=(x[,1]<0.2)+(x[,5]>0.2)beta=1prb=1/(1+exp(-beta*z))y=rbinom(n,1,prb)
## cross-validate the logistic main effects AIMa=cv.logistic.main(x, y, nsteps=10, K.cv=5, num.replicate=3)
## examine the score test statistics in the test setpar(mfrow=c(1,2))plot(a$meanscore, type="l")plot(a$pvfit.score, type="l")
## construct the index with the optimal number of binary rulesk.opt=a$kmaxa=logistic.main(x, y, nsteps=k.opt)print(a)

index.prediction 19
index.prediction Predict index based on fitted AIM
Description
Compute the index for new observations using output from lm.main, lm.interaction, logistic.main,logistic.interaction, cox.main and cox.interaction.
Usage
index.prediction(res, x)
Arguments
res list "res" term from the outputs in lm.main, lm.interaction, logistic.main,logistic.interaction, cox.main and cox.interaction
x New covariate matrix
Details
index.prediction computes the new index for given observations based on the fitted AIM
Value
index.prediction returns score which is the index for new observations with covariate matrix"x".
Author(s)
Lu Tian and Robert Tibshirani
References
Lu Tian and Robert Tibshirani (2010) Adaptive index models for marker-based risk stratification.Tech Report. Available at http://www-stat.stanford.edu/~tibs/AIM.
Examples
## generate dataset.seed(1)
n=400p=10x=matrix(rnorm(n*p), n, p)z=(x[,1]<0.2)+(x[,5]>0.2)trt=rbinom(n,1, 0.5)beta=1prb=1/(1+exp(trt-beta*trt*z-0.5))y=rbinom(n,1,prb)

20 lm.interaction
## fit the interaction logistic AIM modela=logistic.interaction(x, trt, y, nsteps=10)
## examine the model sequenceprint(a)
## compute the index based on the 2nd model of the sequence, using data xz.prd=index.prediction(a$res[[2]],x)
## compute the index based on the 2nd model of the sequence using new data xx, and compare the result with the true indexnn=10xx=matrix(rnorm(nn*p), nn, p)zz=(xx[,1]<0.2)+(xx[,5]>0.2)zz.prd=index.prediction(a$res[[2]],xx)cbind(zz, zz.prd)
lm.interaction Interaction linear adaptive index model
Description
Estimate adpative index model for continuous outcomes in the context of linear regression. Theresulting index characterizes the interactions between the covariates and treatment.
Usage
lm.interaction(x, trt, y, nsteps=8, backfit=F, mincut=.1, maxnumcut=1, dirp=0)
Arguments
x n by p matrix. The covariate matrix
trt n vector. The treatment indicator
y n vector. The continuous response variable
nsteps the maximum number of binary rules to be included in the index
backfit T/F. Whether the existing split points are adjusted after including a new binaryrule
mincut The minimum cutting proportion for the binary rule at either end. It typically isbetween 0 and 0.2.
maxnumcut The maximum number of binary splits per predictor
dirp p vector. The given direction of the binary split for each of the p predictors. 0represents "no pre-given direction"; 1 represents "(x>cut)"; -1 represents "(x<cut)".Alternatively, "dirp=0" represents that there is no pre-given direction for any ofthe predictor.
lm.interaction 21
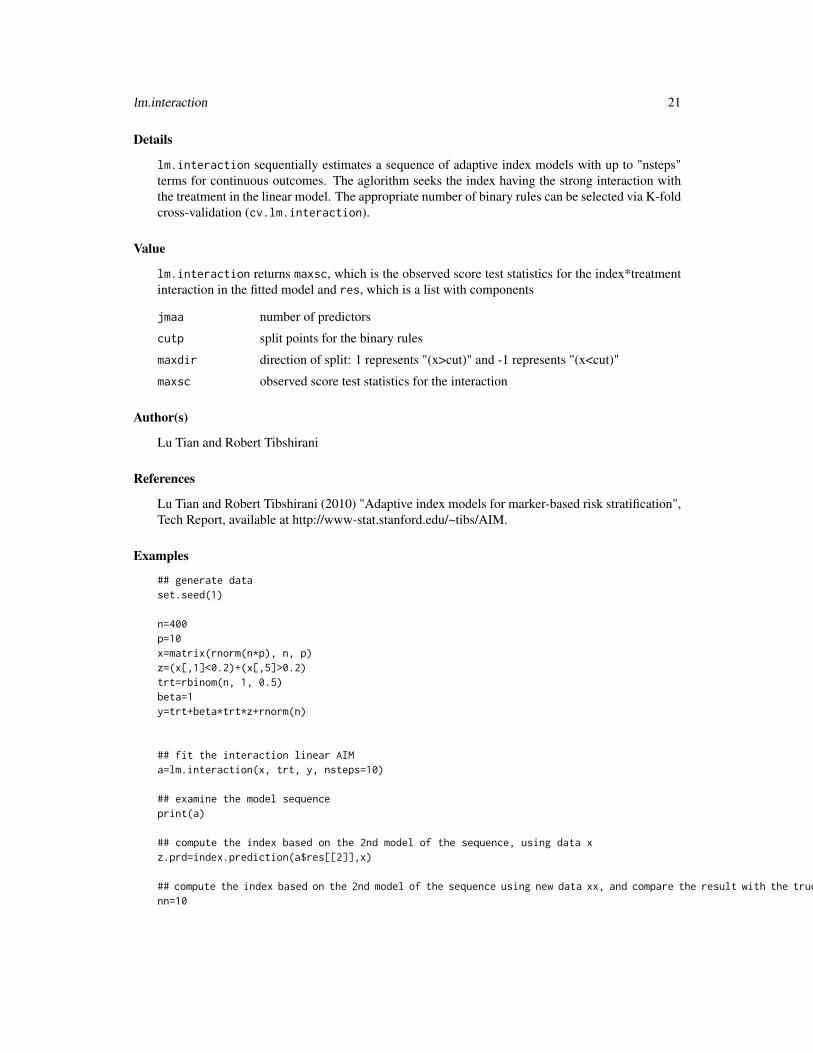
Details
lm.interaction sequentially estimates a sequence of adaptive index models with up to "nsteps"terms for continuous outcomes. The aglorithm seeks the index having the strong interaction withthe treatment in the linear model. The appropriate number of binary rules can be selected via K-foldcross-validation (cv.lm.interaction).
Value
lm.interaction returns maxsc, which is the observed score test statistics for the index*treatmentinteraction in the fitted model and res, which is a list with components
jmaa number of predictors
cutp split points for the binary rules
maxdir direction of split: 1 represents "(x>cut)" and -1 represents "(x<cut)"
maxsc observed score test statistics for the interaction
Author(s)
Lu Tian and Robert Tibshirani
References
Lu Tian and Robert Tibshirani (2010) "Adaptive index models for marker-based risk stratification",Tech Report, available at http://www-stat.stanford.edu/~tibs/AIM.
Examples
## generate dataset.seed(1)
n=400p=10x=matrix(rnorm(n*p), n, p)z=(x[,1]<0.2)+(x[,5]>0.2)trt=rbinom(n, 1, 0.5)beta=1y=trt+beta*trt*z+rnorm(n)
## fit the interaction linear AIMa=lm.interaction(x, trt, y, nsteps=10)
## examine the model sequenceprint(a)
## compute the index based on the 2nd model of the sequence, using data xz.prd=index.prediction(a$res[[2]],x)
## compute the index based on the 2nd model of the sequence using new data xx, and compare the result with the true indexnn=10
22 lm.main
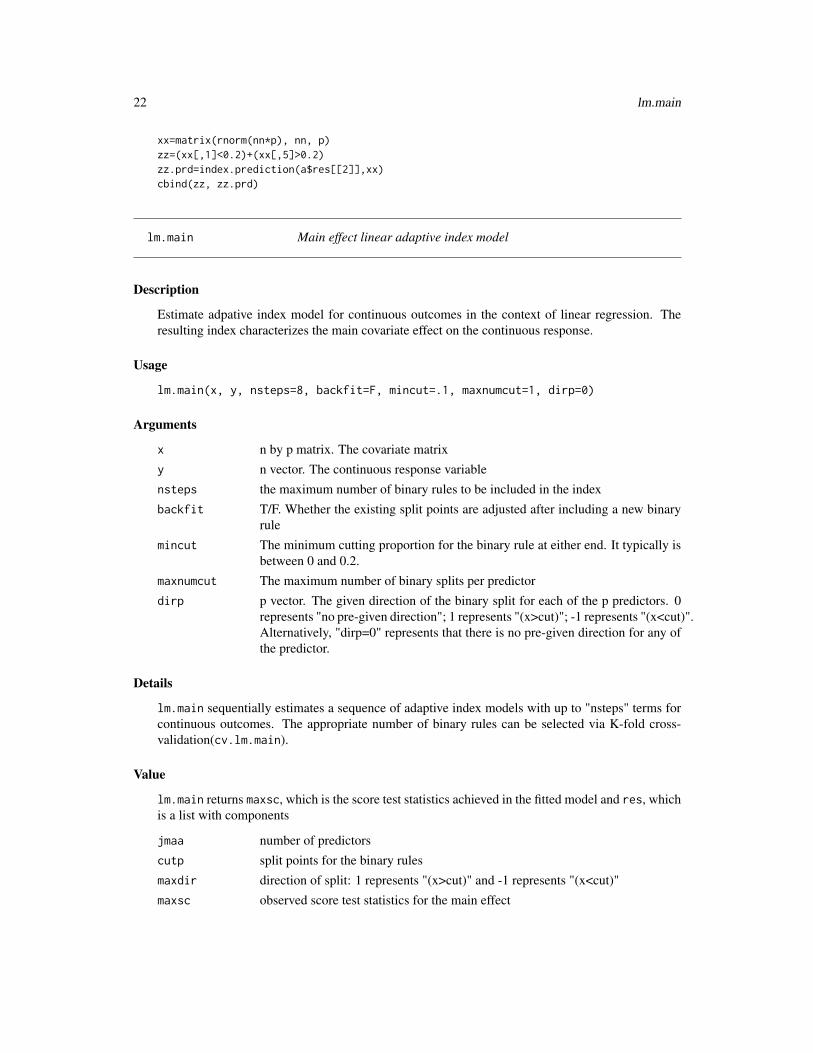
xx=matrix(rnorm(nn*p), nn, p)zz=(xx[,1]<0.2)+(xx[,5]>0.2)zz.prd=index.prediction(a$res[[2]],xx)cbind(zz, zz.prd)
lm.main Main effect linear adaptive index model
Description
Estimate adpative index model for continuous outcomes in the context of linear regression. Theresulting index characterizes the main covariate effect on the continuous response.
Usage
lm.main(x, y, nsteps=8, backfit=F, mincut=.1, maxnumcut=1, dirp=0)
Arguments
x n by p matrix. The covariate matrixy n vector. The continuous response variablensteps the maximum number of binary rules to be included in the indexbackfit T/F. Whether the existing split points are adjusted after including a new binary
rulemincut The minimum cutting proportion for the binary rule at either end. It typically is
between 0 and 0.2.maxnumcut The maximum number of binary splits per predictordirp p vector. The given direction of the binary split for each of the p predictors. 0
represents "no pre-given direction"; 1 represents "(x>cut)"; -1 represents "(x<cut)".Alternatively, "dirp=0" represents that there is no pre-given direction for any ofthe predictor.
Details
lm.main sequentially estimates a sequence of adaptive index models with up to "nsteps" terms forcontinuous outcomes. The appropriate number of binary rules can be selected via K-fold cross-validation(cv.lm.main).
Value
lm.main returns maxsc, which is the score test statistics achieved in the fitted model and res, whichis a list with components
jmaa number of predictorscutp split points for the binary rulesmaxdir direction of split: 1 represents "(x>cut)" and -1 represents "(x<cut)"maxsc observed score test statistics for the main effect

logistic.interaction 23
Author(s)
Lu Tian and Rob Tibshirani
References
Lu Tian and Robert Tibshirani (2010) "Adaptive index models for marker-based risk stratification",Tech Report, available at http://www-stat.stanford.edu/~tibs/AIM.
Examples
## generate dataset.seed(1)
n=500p=20x=matrix(rnorm(n*p), n, p)z=(x[,1]<0.2)+(x[,5]>0.2)beta=1y=beta*z+rnorm(n)
## fit the main effects linear AIMa=lm.main(x, y, nsteps=10)
## examine the model sequenceprint(a)
## compute the index based on the 2nd model of the sequence using data xz.prd=index.prediction(a$res[[2]],x)
## compute the index based on the 2nd model of the sequence using new data xx, and compare the result with the true indexnn=10xx=matrix(rnorm(nn*p), nn, p)zz=(xx[,1]<0.2)+(xx[,5]>0.2)zz.prd=index.prediction(a$res[[2]],xx)cbind(zz, zz.prd)
logistic.interaction Interaction logistic adaptive index model
Description
Estimate adpative index model for binary outcomes in the context of logistic regression. The result-ing index characterizes the interaction between the covariates and treatment.
Usage
logistic.interaction(x, trt, y, nsteps=8, mincut=.1, backfit=F, maxnumcut=1, dirp=0, weight=1)
24 logistic.interaction
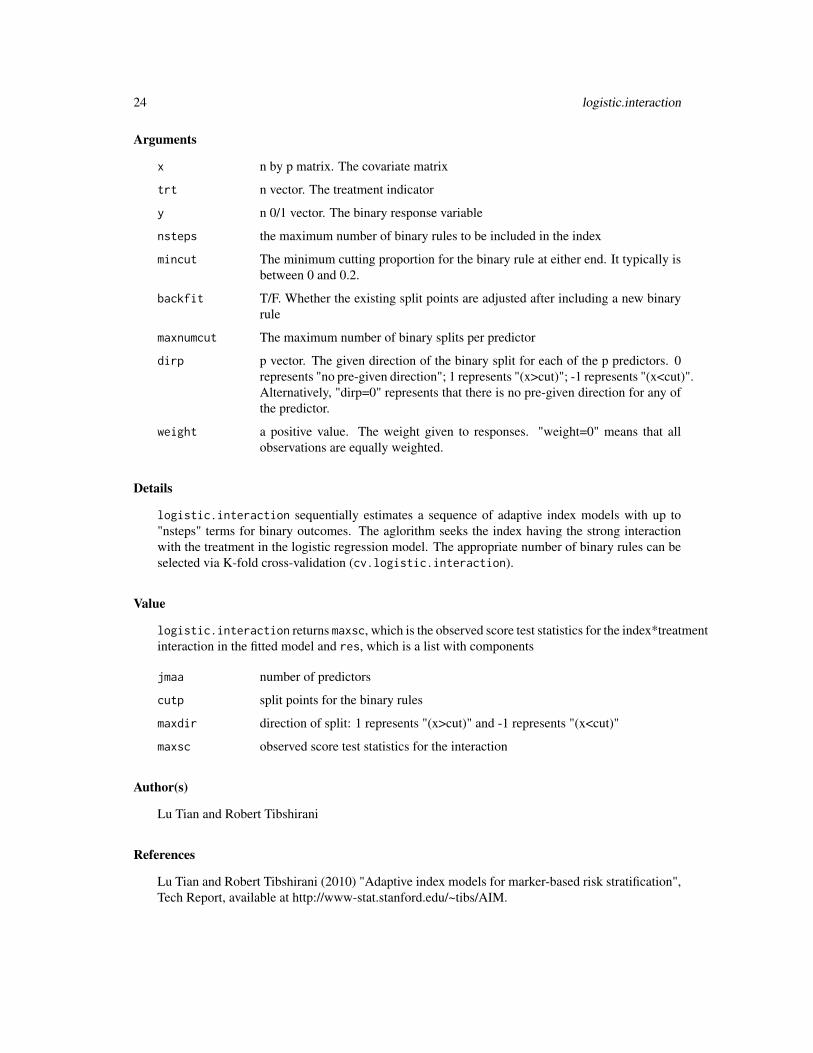
Arguments
x n by p matrix. The covariate matrix
trt n vector. The treatment indicator
y n 0/1 vector. The binary response variable
nsteps the maximum number of binary rules to be included in the index
mincut The minimum cutting proportion for the binary rule at either end. It typically isbetween 0 and 0.2.
backfit T/F. Whether the existing split points are adjusted after including a new binaryrule
maxnumcut The maximum number of binary splits per predictor
dirp p vector. The given direction of the binary split for each of the p predictors. 0represents "no pre-given direction"; 1 represents "(x>cut)"; -1 represents "(x<cut)".Alternatively, "dirp=0" represents that there is no pre-given direction for any ofthe predictor.
weight a positive value. The weight given to responses. "weight=0" means that allobservations are equally weighted.
Details
logistic.interaction sequentially estimates a sequence of adaptive index models with up to"nsteps" terms for binary outcomes. The aglorithm seeks the index having the strong interactionwith the treatment in the logistic regression model. The appropriate number of binary rules can beselected via K-fold cross-validation (cv.logistic.interaction).
Value
logistic.interaction returns maxsc, which is the observed score test statistics for the index*treatmentinteraction in the fitted model and res, which is a list with components
jmaa number of predictors
cutp split points for the binary rules
maxdir direction of split: 1 represents "(x>cut)" and -1 represents "(x<cut)"
maxsc observed score test statistics for the interaction
Author(s)
Lu Tian and Robert Tibshirani
References
Lu Tian and Robert Tibshirani (2010) "Adaptive index models for marker-based risk stratification",Tech Report, available at http://www-stat.stanford.edu/~tibs/AIM.

logistic.main 25
Examples
## generate dataset.seed(1)
n=400p=10x=matrix(rnorm(n*p), n, p)z=(x[,1]<0.2)+(x[,5]>0.2)trt=rbinom(n,1, 0.5)beta=1prb=1/(1+exp(trt-beta*trt*z-0.5))y=rbinom(n,1,prb)
## fit the interaction logistic AIMa=logistic.interaction(x, trt, y, nsteps=10)
## examine the model sequenceprint(a)
## compute the index based on the 2nd model of the sequence using data xz.prd=index.prediction(a$res[[2]],x)
## compute the index based on the 2nd model of the sequence using new data xx, and compare the result with the true indexnn=10xx=matrix(rnorm(nn*p), nn, p)zz=(xx[,1]<0.2)+(xx[,5]>0.2)zz.prd=index.prediction(a$res[[2]],xx)cbind(zz, zz.prd)
logistic.main Main effect logistic adaptive index model
Description
Estimate adpative index model for binary outcomes in the context of logistic regression. The result-ing index characterizes the main covariate effect on the response probability.
Usage
logistic.main(x, y, nsteps=8, mincut=.1, backfit=F, maxnumcut=1, dirp=0, weight=1)
Arguments
x n by p matrix. The covariate matrix
y n 0/1 vector. The binary response variable
nsteps the maximum number of binary rules to be included in the index
backfit T/F. Whether the existing split points are adjusted after including a new binaryrule

26 logistic.main
mincut The minimum cutting proportion for the binary rule at either end. It typically isbetween 0 and 0.2.
maxnumcut The maximum number of binary splits per predictor
dirp p vector. The given direction of the binary split for each of the p predictors. 0represents "no pre-given direction"; 1 represents "(x>cut)"; -1 represents "(x<cut)".Alternatively, "dirp=0" represents that there is no pre-given direction for any ofthe predictor.
weight a positive number. The weight given to responses. "weight=0" means that allobservations are equally weighted.
Details
logistic.main sequentially estimates a sequence of adaptive index models with up to "nsteps"terms for binary outcomes. The appropriate number of binary rules can be selected via K-foldcross-validation(cv.logistic.main).
Value
logistic.main returns maxsc, which is the score test statistics achieved in the fitted model andres, which is a list with components
jmaa number of predictors
cutp split points for the binary rules
maxdir direction of split: 1 represents "(x>cut)" and -1 represents "(x<cut)"
maxsc observed score test statistics for the main effect
Author(s)
Lu Tian and Robert Tibshirani
References
Lu Tian and Robert Tibshirani (2010) "Adaptive index models for marker-based risk stratification",Tech Report, available at http://www-stat.stanford.edu/~tibs/AIM.
Examples
## generate dataset.seed(1)n=200p=10
x=matrix(rnorm(n*p), n, p)z=(x[,1]<0.2)+(x[,5]>0.2)beta=1prb=1/(1+exp(-beta*z))y=rbinom(n,1,prb)

logistic.main 27
## fit logistic main effects AIMa=logistic.main(x, y, nsteps=10)
## examine the model sequenceprint(a)
## compute the index based on the 2nd model of the sequence using data xz.prd=index.prediction(a$res[[2]],x)
## compute the index based on the 2nd model of the sequence using new data xx, and compare the result with the true indexnn=10xx=matrix(rnorm(nn*p), nn, p)zz=(xx[,1]<0.2)+(xx[,5]>0.2)zz.prd=index.prediction(a$res[[2]],xx)cbind(zz, zz.prd)
Index
backfit.cox.interaction, 2backfit.cox.main, 2backfit.lm.interaction, 2backfit.lm.main, 3backfit.logistic.interaction, 3backfit.logistic.main, 3
cox.interaction, 4cox.main, 5cv.cox.interaction, 7cv.cox.main, 9cv.lm.interaction, 11cv.lm.main, 13cv.logistic.interaction, 15cv.logistic.main, 17
index.prediction, 19
lm.interaction, 20lm.main, 22logistic.interaction, 23logistic.main, 25
28