pacific union q2 2015 market report
DESCRIPTION
Pacific Union Q2 2015 Market ReportTRANSCRIPT
Quarterly Real Estate ReportQ2 2015


Upcoming Mortgage-Regulation ChangesWill Affect Both Buyers and Sellers 4
3 Factors Contributing to Bay Area Home Sales Declines 6
Contra Costa County/Tri-Valley 8
East Bay 12
Marin County 16
Napa County 20
San Francisco 24
Silicon Valley 32
Sonoma County 38
Sonoma Valley 42
Lake Tahoe/Truckee 46
Table of Contents
Mark A. McLaughlin, CEO, Pacific Union
Please remember to seek out local news, trend analysis, and expert advice for your real estate decisions.
Upcoming Mortgage-Regulation ChangesWill Affect Both Buyers and Sellers
Our industry is approaching a significant change designed to protect consumers from some of the elements that contributed to the 2007-2008 real estate collapse and general recession. Mortgage transactions – both purchase and refinance – originated after Oct. 3, 2015 will be subject to new regulations designed and enforced by the Consumer Financial Protection Bureau (CFPB).
Nearly 70 percent of Pacific Union’s 5,000-plus annual real estate transactions are financed by mortgages. Therefore, the CFPB rule changes will impact most of our buyers and sellers. After Oct. 3, the Good Faith Estimate, Truth in Lending, and HUD-1 disclosures will be replaced with a Loan Estimate (LE) and a Closing Disclosure (CD). These are brand-new forms that first-time homebuyers and sophisticated investors alike must review and sign if using a regulated mortgage product.
The practical impact appears in the event there is any change in the fees related to closing. We are somewhat accustomed to fee changes and modifications to the Good Faith Estimate and/or the final closing statement as part of the closing process. Variances of up to 10 percent were generally tolerated before a redisclosure was necessary. The new rules and regulations have zero tolerance for an error or changes in fees, credits, and so on.
After Oct. 3, borrowers will be notified if any fees, credits, or costs change via a new CD from the lender, and they will have a mandatory three business days to review them. Clearly this may have an impact on the timely closing of a real estate transaction.
These new CFPB rules and regulations are designed to protect the consumer, provide for full clarity in the LE, and achieve consistency between the original LE and the final CD. The fact that the rules and forms are changing means that all parties involved in a transaction have new processes to follow. Buyers and sellers will need to prepare for these new forms and be ready to relax stringent closing dates in the event that a redisclosure must be made. It is quite possible that, even with our finest intentions, the velocity of our closings may slow somewhat early in the fourth quarter.
We are conducting multiple training sessions for our real estate professionals to ensure that we continue to provide our clients with exceptional service. Please feel free to review all of the new CFPB rules and regulations with your escrow officer, lender, or Pacific Union real estate professional.
Sincerely,
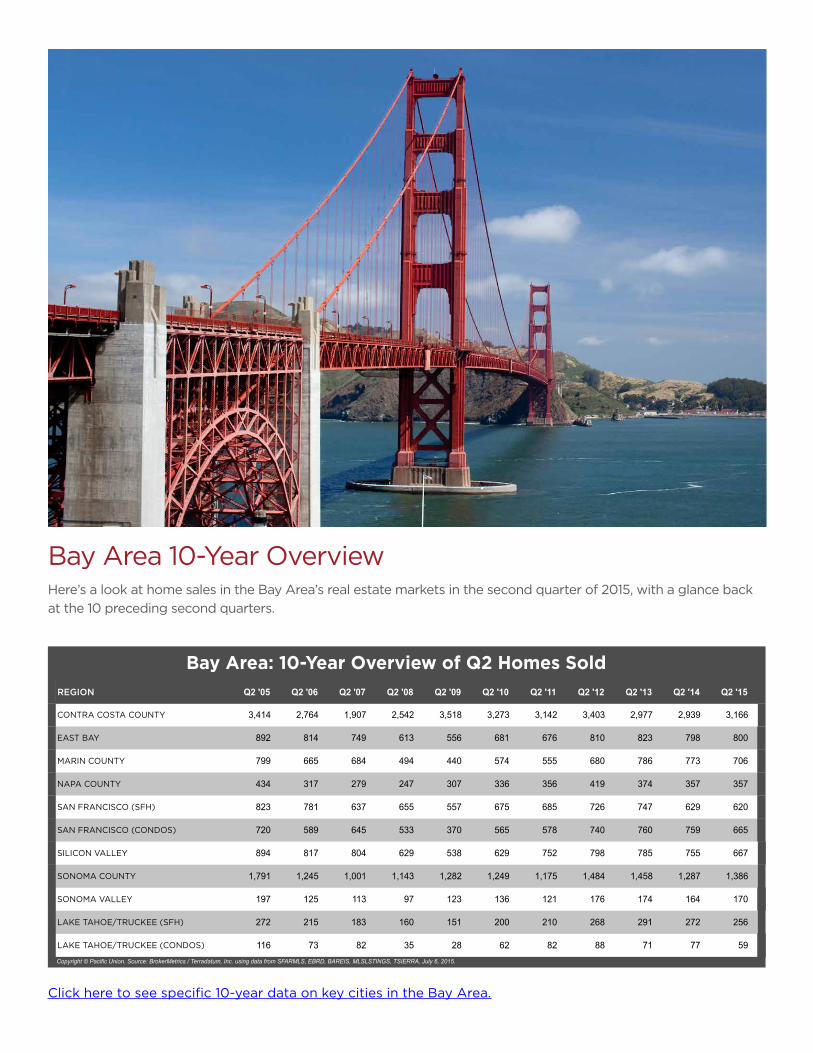
Bay Area 10-Year OverviewHere’s a look at home sales in the Bay Area’s real estate markets in the second quarter of 2015, with a glance back at the 10 preceding second quarters.
Click here to see specific 10-year data on key cities in the Bay Area.
REGION Q2 '05 Q2 '06 Q2 '07 Q2 '08 Q2 '09 Q2 '10 Q2 '11 Q2 '12 Q2 '13 Q2 '14 Q2 '15
CONTRA COSTA COUNTY 3,414 2,764 1,907 2,542 3,518 3,273 3,142 3,403 2,977 2,939 3,166
EAST BAY 892 814 749 613 556 681 676 810 823 798 800
MARIN COUNTY 799 665 684 494 440 574 555 680 786 773 706
NAPA COUNTY 434 317 279 247 307 336 356 419 374 357 357
SAN FRANCISCO (SFH) 823 781 637 655 557 675 685 726 747 629 620
SAN FRANCISCO (CONDOS) 720 589 645 533 370 565 578 740 760 759 665
SILICON VALLEY 894 817 804 629 538 629 752 798 785 755 667
SONOMA COUNTY 1,791 1,245 1,001 1,143 1,282 1,249 1,175 1,484 1,458 1,287 1,386
SONOMA VALLEY 197 125 113 97 123 136 121 176 174 164 170
LAKE TAHOE/TRUCKEE (SFH) 272 215 183 160 151 200 210 268 291 272 256
LAKE TAHOE/TRUCKEE (CONDOS) 116 73 82 35 28 62 82 88 71 77 59Copyright © Pacific Union. Source: BrokerMetrics / Terradatum, Inc. using data from SFARMLS, EBRD, BAREIS, MLSLSTINGS, TSIERRA, July 6, 2015.
Bay Area: 10-Year Overview of Q2 Homes Sold
3 Factors Contributing to Bay Area Home Sales Declines
Demand for San Francisco Bay Area real estate has arguably never been more intense, as highly paid professionals flock to the region to take advantage of an excellent job market. But a look at the number of single-family home sales across the Bay Area for the first half of 2015 shows that, for the most part, units sold have been slowing for the past two years.
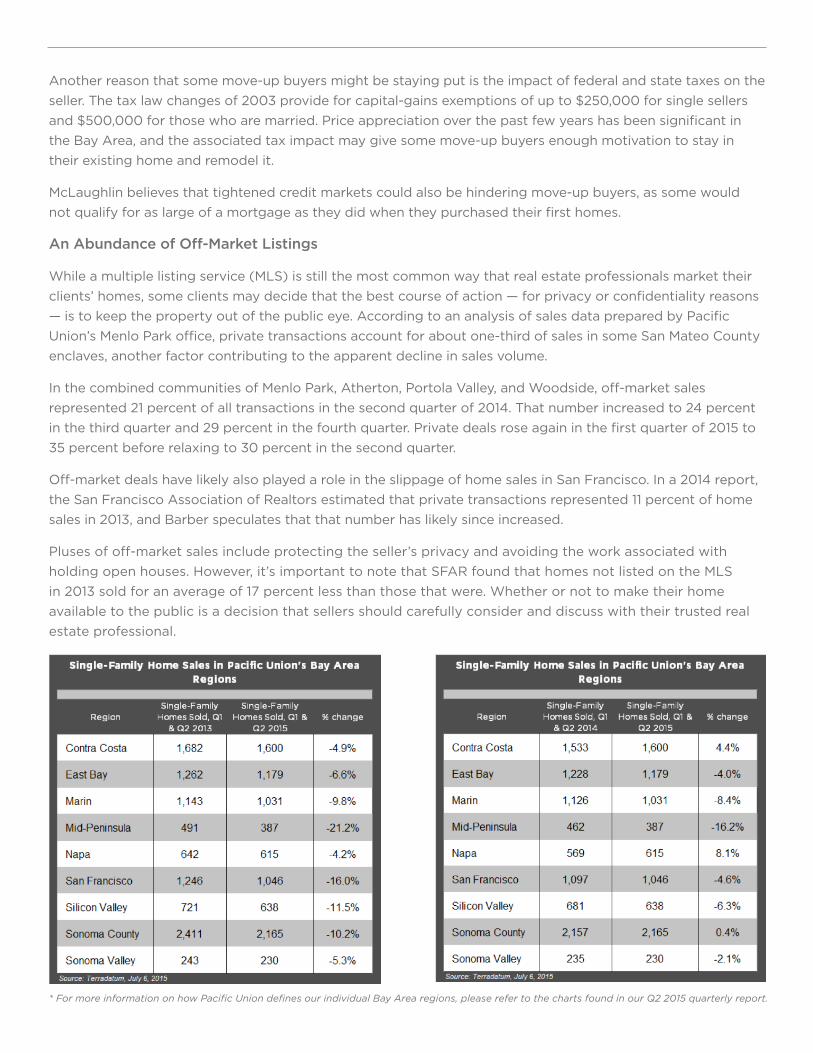
According to MLS data, single-family home sales dropped in six of Pacific Union’s nine Bay Area regions* in the first half of this year compared with the same period last year. When comparing this year’s first-half sales with 2013’s, the pattern becomes even more consistent, with all regions displaying a decrease in the number of homes sold. The two-year declines were largest in western Bay Area counties, where many of the nation’s most desirable jobs are located. (Complete units-sold numbers can be found in the charts below.)
So what’s causing the drop in sales at a time when so many people want to own a home in the Bay Area? Pacific Union CEO Mark A. McLaughlin believes that three major factors are at work.
“A slim supply of homes for sale and an increase in the number of off-market sales are certainly the largest drivers of the decline in units sold as recorded by the MLS,” he says, “but fewer move-up buyers in the market also impacts sales.”
Inventory Shortages
Anyone who follows Bay Area real estate is likely familiar with one of our housing market’s major challenges: fewer homes for sale than people that want to buy them. The situation hasn’t improved over the past year, with the months’ supply of inventory (MSI) for single-family homes sold being lower in June of this year than it was in June 2014 in all of the Bay Area regions in which Pacific Union operates.
An MSI between 4.0 and 6.0 months is generally considered to indicate a balanced market, with lower numbers favoring sellers and vice versa. In June, the MSI across the Bay Area ranged from 0.7 in the Mid-Peninsula region to 2.8 in Napa County, meaning that all of our markets seem to favor sellers.
In Silicon Valley and the Mid-Peninsula, where home sales have declined by double-digit percentages from the first half of 2013, a lack of inventory is a key factor slowing sales, according to David Barca, vice president of those two Pacific Union regions.
“Certainly, if there was more inventory, there would be more sales,” he says.
An Absence of Move-Up Buyers
A lack of homes for sale means that many move-up buyers are sitting on the sidelines, as they are unsure if they will be able to find a new home once they sell their current property. Barca says that in Silicon Valley, one of the nation’s most in-demand housing markets, even buyers with plenty of equity and money are staying put.
Both Pacific Union President Patrick Barber and Marin County Region President Brent Thomson cite reduced activity by move-up buyers as a contributing factor to sales declines on both sides of the Golden Gate Bridge. Barca also notes that first-time buyer activity is particularly low in expensive Silicon Valley – except for the young fortunate professionals that play important roles in local tech and social media companies. Otherwise, young first-time buyers may need to rely on parents or relatives who can assist with the down payment.
Another reason that some move-up buyers might be staying put is the impact of federal and state taxes on the seller. The tax law changes of 2003 provide for capital-gains exemptions of up to $250,000 for single sellers and $500,000 for those who are married. Price appreciation over the past few years has been significant in the Bay Area, and the associated tax impact may give some move-up buyers enough motivation to stay in their existing home and remodel it.
McLaughlin believes that tightened credit markets could also be hindering move-up buyers, as some would not qualify for as large of a mortgage as they did when they purchased their first homes.
An Abundance of Off-Market Listings
While a multiple listing service (MLS) is still the most common way that real estate professionals market their clients’ homes, some clients may decide that the best course of action — for privacy or confidentiality reasons — is to keep the property out of the public eye. According to an analysis of sales data prepared by Pacific Union’s Menlo Park office, private transactions account for about one-third of sales in some San Mateo County enclaves, another factor contributing to the apparent decline in sales volume.
In the combined communities of Menlo Park, Atherton, Portola Valley, and Woodside, off-market sales represented 21 percent of all transactions in the second quarter of 2014. That number increased to 24 percent in the third quarter and 29 percent in the fourth quarter. Private deals rose again in the first quarter of 2015 to 35 percent before relaxing to 30 percent in the second quarter.
Off-market deals have likely also played a role in the slippage of home sales in San Francisco. In a 2014 report, the San Francisco Association of Realtors estimated that private transactions represented 11 percent of home sales in 2013, and Barber speculates that that number has likely since increased.
Pluses of off-market sales include protecting the seller’s privacy and avoiding the work associated with holding open houses. However, it’s important to note that SFAR found that homes not listed on the MLS in 2013 sold for an average of 17 percent less than those that were. Whether or not to make their home available to the public is a decision that sellers should carefully consider and discuss with their trusted real estate professional.
* For more information on how Pacific Union defines our individual Bay Area regions, please refer to the charts found in our Q2 2015 quarterly report.
Ellen AndersonSenior Vice President, Contra Costa [email protected] Sycamore Valley Road West | Danville, CA 94526
Contra Costa County/Tri-ValleyQuarterly Real Estate ReportQ2 2015

Contra Costa County/Tri-Valley: Q2 ResultsOne word neatly describes second-quarter real estate activity in Pacific Union’s Contra Costa County/Tri-Valley region: phenomenal. Sales reached their highest levels in more than five years, even as inventory remained exceptionally low. Prices rose moderately, with many homes selling for more than their list prices and multiple offers at virtually all price points. (Listing agents have learned to price homes aggressively to generate bidding wars.)
New buyers continued to enter the market, many of them spurred by mortgage rates that are still hovering near record lows – and the threat that they won’t remain that way for much longer. Sellers, meanwhile, remained cautious: tempted by rising prices to put their homes on the market but uncertain of their prospects when they too become buyers.
Looking Forward: Real estate activity typically slows during the summer months, and the third quarter of 2015 will likely be no different. We expect that Contra Costa home prices will continue to rise moderately through the end of the year, with the region’s attractive homes and excellent schools continuing to woo buyers. A jump in mortgage rates could dampen sales or, conversely, prompt buyers to act quickly and lock in an affordable rate before they climb even higher.
Defining Contra Costa County/Tri-Valley: Our real estate markets in Contra Costa County include the cities of Alamo, Blackhawk, Danville, Diablo, Lafayette, Moraga, Orinda, Pleasant Hill, San Ramon, and Walnut Creek. Sales data in the charts below includes single-family homes in these communities.
Contra Costa County/Tri-Valleypacificunion.com
Median Sales Price
Months’ Supply of Inventory
$975,000 $1,040,000 $1,060,000
$965,000 $995,000 $1,007,500
$1,000,000 $970,000 $1,010,000 $1,092,000 $1,100,000
$1,110,000 $1,185,000
$100,000
$300,000
$500,000
$700,000
$900,000
$1,100,000
$1,300,000
Jun-14 Jul-14 Aug-14 Sep-14 Oct-14 Nov-14 Dec-14 Jan-15 Feb-15 Mar-15 Apr-15 May-15 Jun-15 Source: Terradatum, July 6, 2015. Median sales price for single-family homes in these Contra Costa County communities:
Alamo, Blackhawk, Danville, Diablo, Lafayette, Moraga, Orinda, Pleasant Hill, San Ramon, and Walnut Creek.
1.6 1.6 1.6
2.0
1.7 1.8
1.2
2.0
2.3
1.5 1.4 1.4
1.3
0.1
0.6
1.1
1.6
2.1
2.6
Jun-14 Jul-14 Aug-14 Sep-14 Oct-14 Nov-14 Dec-14 Jan-15 Feb-15 Mar-15 Apr-15 May-15 Jun-15
Source: Terradatum, July 6, 2015. Months' supply of inventory for single-family homes in these Contra Costa County communities: Alamo, Blackhawk, Danville, Diablo, Lafayette, Moraga, Orinda, Pleasant Hill, San Ramon, and Walnut Creek.
Contra Costa County/Tri-Valleypacificunion.com
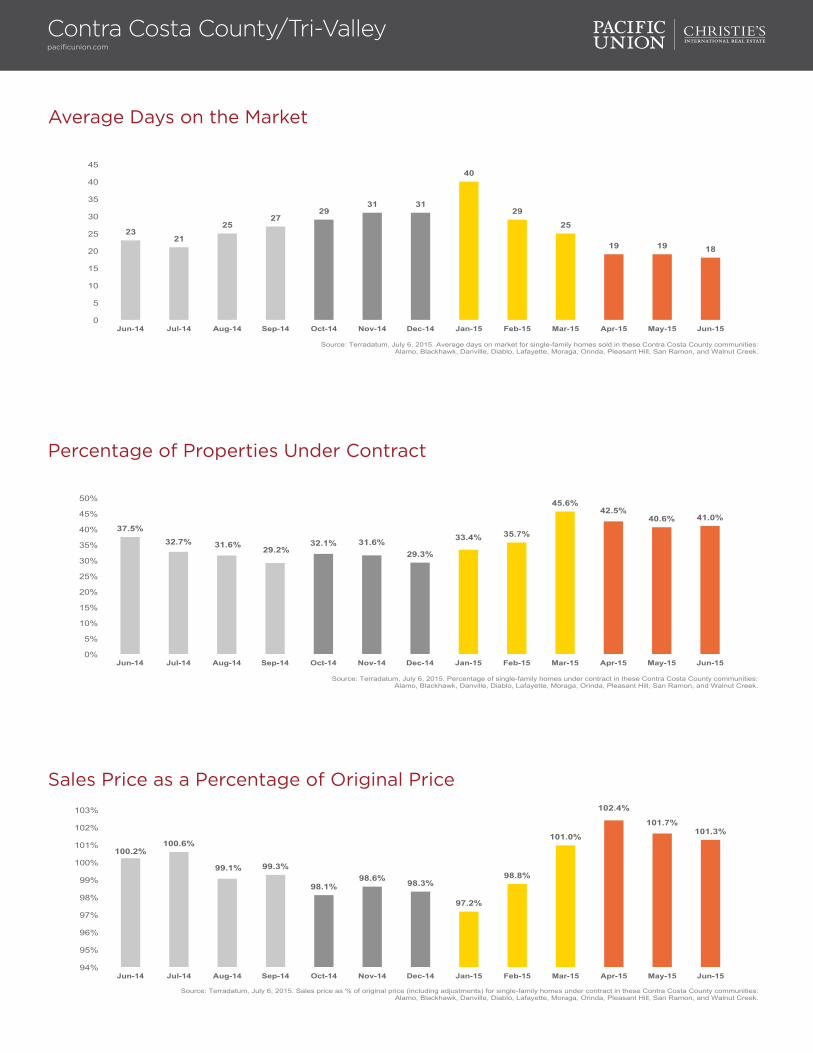
Average Days on the Market
23 21
25 27
29 31 31
40
29
25
19 19 18
0
5
10
15
20
25
30
35
40
45
Jun-14 Jul-14 Aug-14 Sep-14 Oct-14 Nov-14 Dec-14 Jan-15 Feb-15 Mar-15 Apr-15 May-15 Jun-15
Source: Terradatum, July 6, 2015. Average days on market for single-family homes sold in these Contra Costa County communities: Alamo, Blackhawk, Danville, Diablo, Lafayette, Moraga, Orinda, Pleasant Hill, San Ramon, and Walnut Creek.
Sales Price as a Percentage of Original Price
100.2% 100.6%
99.1% 99.3%
98.1% 98.6% 98.3%
97.2%
98.8%
101.0%
102.4%
101.7% 101.3%
94%
95%
96%
97%
98%
99%
100%
101%
102%
103%
Jun-14 Jul-14 Aug-14 Sep-14 Oct-14 Nov-14 Dec-14 Jan-15 Feb-15 Mar-15 Apr-15 May-15 Jun-15
Source: Terradatum, July 6, 2015. Sales price as % of original price (including adjustments) for single-family homes under contract in these Contra Costa County communities: Alamo, Blackhawk, Danville, Diablo, Lafayette, Moraga, Orinda, Pleasant Hill, San Ramon, and Walnut Creek.
Percentage of Properties Under Contract
37.5% 32.7% 31.6% 29.2%
32.1% 31.6% 29.3%
33.4% 35.7%
45.6% 42.5%
40.6% 41.0%
0%
5%
10%
15%
20%
25%
30%
35%
40%
45%
50%
Jun-14 Jul-14 Aug-14 Sep-14 Oct-14 Nov-14 Dec-14 Jan-15 Feb-15 Mar-15 Apr-15 May-15 Jun-15
Source: Terradatum, July 6, 2015. Percentage of single-family homes under contract in these Contra Costa County communities: Alamo, Blackhawk, Danville, Diablo, Lafayette, Moraga, Orinda, Pleasant Hill, San Ramon, and Walnut Creek.
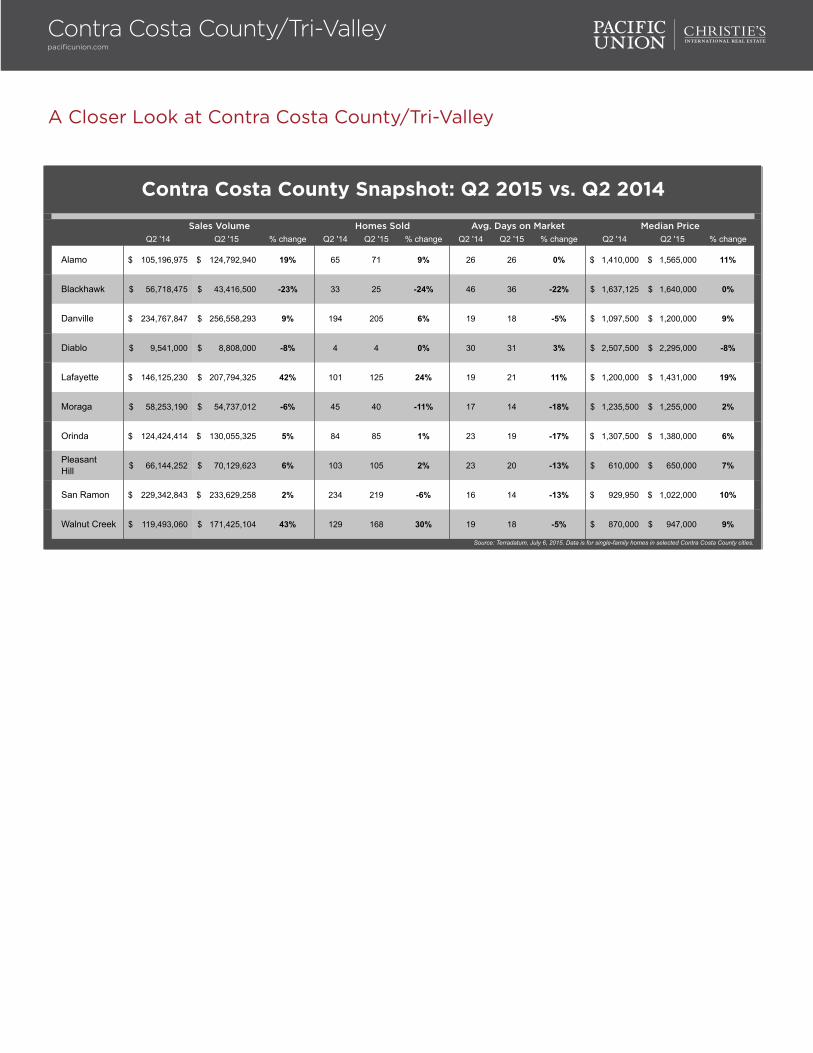
A Closer Look at Contra Costa County/Tri-Valley
Q2 '14 Q2 '15 % change Q2 '14 Q2 '15 % change Q2 '14 Q2 '15 % change Q2 '14 Q2 '15 % change
Alamo 105,196,975$ 124,792,940$ 19% 65 71 9% 26 26 0% 1,410,000$ 1,565,000$ 11%
Blackhawk 56,718,475$ 43,416,500$ -23% 33 25 -24% 46 36 -22% 1,637,125$ 1,640,000$ 0%
Danville 234,767,847$ 256,558,293$ 9% 194 205 6% 19 18 -5% 1,097,500$ 1,200,000$ 9%
Diablo 9,541,000$ 8,808,000$ -8% 4 4 0% 30 31 3% 2,507,500$ 2,295,000$ -8%
Lafayette 146,125,230$ 207,794,325$ 42% 101 125 24% 19 21 11% 1,200,000$ 1,431,000$ 19%
Moraga 58,253,190$ 54,737,012$ -6% 45 40 -11% 17 14 -18% 1,235,500$ 1,255,000$ 2%
Orinda 124,424,414$ 130,055,325$ 5% 84 85 1% 23 19 -17% 1,307,500$ 1,380,000$ 6%
PleasantHill 66,144,252$ 70,129,623$ 6% 103 105 2% 23 20 -13% 610,000$ 650,000$ 7%
San Ramon 229,342,843$ 233,629,258$ 2% 234 219 -6% 16 14 -13% 929,950$ 1,022,000$ 10%
Walnut Creek 119,493,060$ 171,425,104$ 43% 129 168 30% 19 18 -5% 870,000$ 947,000$ 9%
Source: Terradatum, July 6, 2015. Data is for single-family homes in selected Contra Costa County cities.
Contra Costa County Snapshot: Q2 2015 vs. Q2 2014
Sales Volume Homes Sold Avg. Days on Market Median Price
Contra Costa County/Tri-Valleypacificunion.com
Pam HoffmanSenior Vice President, Managing Broker, East Bay [email protected] Mountain Boulevard | Oakland, CA 94611
East BayQuarterly Real Estate ReportQ2 2015
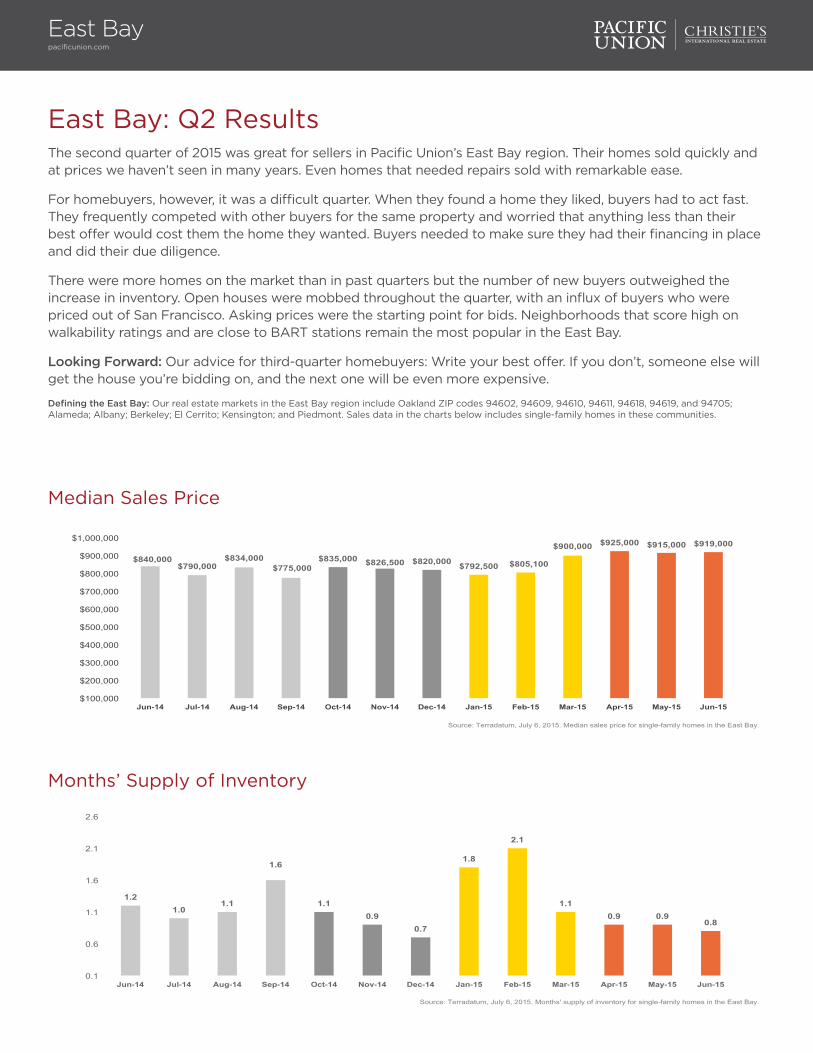
East Bay: Q2 ResultsThe second quarter of 2015 was great for sellers in Pacific Union’s East Bay region. Their homes sold quickly and at prices we haven’t seen in many years. Even homes that needed repairs sold with remarkable ease.
For homebuyers, however, it was a difficult quarter. When they found a home they liked, buyers had to act fast. They frequently competed with other buyers for the same property and worried that anything less than their best offer would cost them the home they wanted. Buyers needed to make sure they had their financing in place and did their due diligence.
There were more homes on the market than in past quarters but the number of new buyers outweighed the increase in inventory. Open houses were mobbed throughout the quarter, with an influx of buyers who were priced out of San Francisco. Asking prices were the starting point for bids. Neighborhoods that score high on walkability ratings and are close to BART stations remain the most popular in the East Bay.
Looking Forward: Our advice for third-quarter homebuyers: Write your best offer. If you don’t, someone else will get the house you’re bidding on, and the next one will be even more expensive.
Defining the East Bay: Our real estate markets in the East Bay region include Oakland ZIP codes 94602, 94609, 94610, 94611, 94618, 94619, and 94705; Alameda; Albany; Berkeley; El Cerrito; Kensington; and Piedmont. Sales data in the charts below includes single-family homes in these communities.
East Baypacificunion.com
Median Sales Price
Months’ Supply of Inventory
$840,000 $790,000
$834,000 $775,000
$835,000 $826,500 $820,000 $792,500 $805,100
$900,000 $925,000 $915,000 $919,000
$100,000
$200,000
$300,000
$400,000
$500,000
$600,000
$700,000
$800,000
$900,000
$1,000,000
Jun-14 Jul-14 Aug-14 Sep-14 Oct-14 Nov-14 Dec-14 Jan-15 Feb-15 Mar-15 Apr-15 May-15 Jun-15
Source: Terradatum, July 6, 2015. Median sales price for single-family homes in the East Bay.
1.2 1.0
1.1
1.6
1.1 0.9
0.7
1.8
2.1
1.1 0.9 0.9
0.8
0.1
0.6
1.1
1.6
2.1
2.6
Jun-14 Jul-14 Aug-14 Sep-14 Oct-14 Nov-14 Dec-14 Jan-15 Feb-15 Mar-15 Apr-15 May-15 Jun-15
Source: Terradatum, July 6, 2015. Months' supply of inventory for single-family homes in the East Bay.
East Baypacificunion.com
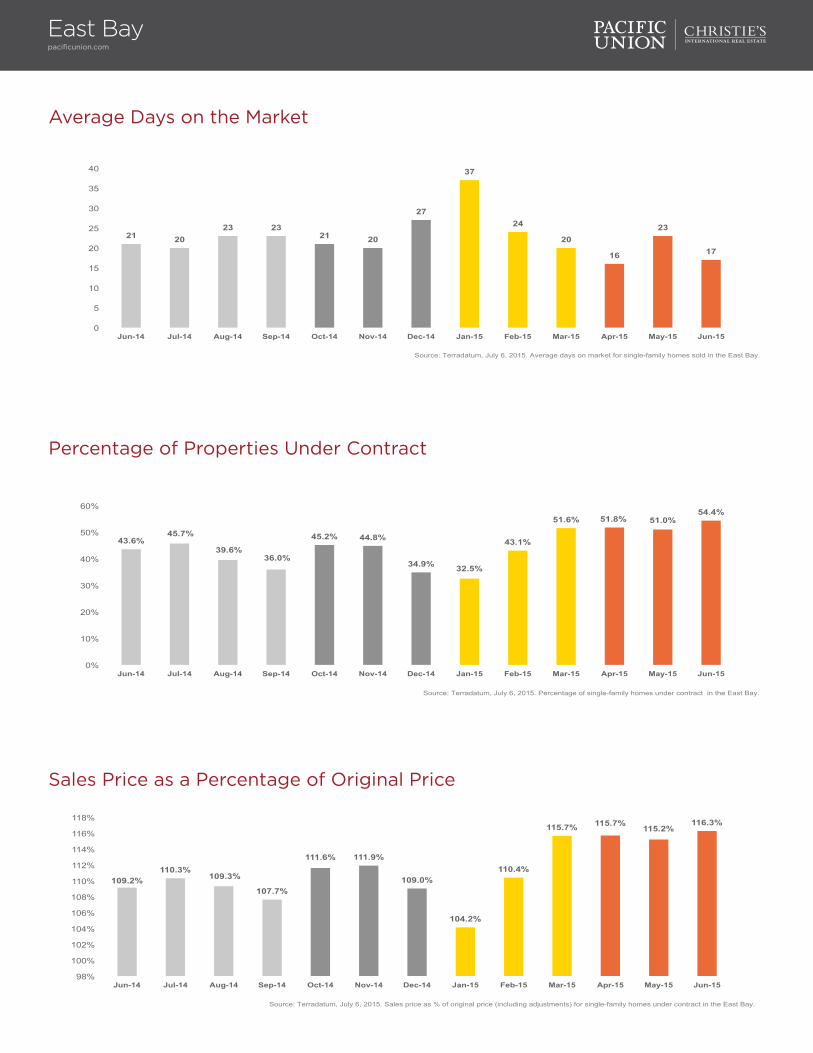
Average Days on the Market
21 20 23 23
21 20
27
37
24
20
16
23
17
0
5
10
15
20
25
30
35
40
Jun-14 Jul-14 Aug-14 Sep-14 Oct-14 Nov-14 Dec-14 Jan-15 Feb-15 Mar-15 Apr-15 May-15 Jun-15
Source: Terradatum, July 6, 2015. Average days on market for single-family homes sold in the East Bay.
Sales Price as a Percentage of Original Price
109.2% 110.3%
109.3%
107.7%
111.6% 111.9%
109.0%
104.2%
110.4%
115.7% 115.7% 115.2%
116.3%
98%
100%
102%
104%
106%
108%
110%
112%
114%
116%
118%
Jun-14 Jul-14 Aug-14 Sep-14 Oct-14 Nov-14 Dec-14 Jan-15 Feb-15 Mar-15 Apr-15 May-15 Jun-15
Source: Terradatum, July 6, 2015. Sales price as % of original price (including adjustments) for single-family homes under contract in the East Bay.
Percentage of Properties Under Contract
43.6% 45.7%
39.6% 36.0%
45.2% 44.8%
34.9% 32.5%
43.1%
51.6% 51.8% 51.0% 54.4%
0%
10%
20%
30%
40%
50%
60%
Jun-14 Jul-14 Aug-14 Sep-14 Oct-14 Nov-14 Dec-14 Jan-15 Feb-15 Mar-15 Apr-15 May-15 Jun-15
Source: Terradatum, July 6, 2015. Percentage of single-family homes under contract in the East Bay.

A Closer Look at the East Bay
Q2 '14 Q2 '15 % change Q2 '14 Q2 '15 % change Q2 '14 Q2 '15 % change Q2 '14 Q2 '15 % change
Alameda 79,838,483$ 103,441,500$ 30% 90 105 17% 20 16 -20% 804,000$ 890,000$ 11%
Albany 22,982,000$ 31,206,950$ 36% 28 33 18% 14 18 29% 776,000$ 950,000$ 22%
Berkeley 164,538,775$ 173,352,490$ 5% 150 150 0% 20 16 -20% 893,500$ 1,049,500$ 17%
El Cerrito 50,367,288$ 47,530,235$ -6% 66 60 -9% 23 17 -26% 705,750$ 770,000$ 9%
Kensington 21,498,024$ 17,396,168$ -19% 22 18 -18% 21 19 -10% 832,630$ 897,500$ 8%
Oakland* 331,682,382$ 384,837,834$ 16% 377 389 3% 23 21 -9% 790,000$ 860,000$ 9%
Piedmont 128,584,725$ 103,179,378$ -20% 65 45 -31% 17 15 -12% 1,740,000$ 2,150,000$ 24%
East Bay Snapshot: Q2 2015 vs. Q2 2014
Source: Terradatum, July 6, 2015. Data is for single-family homes in selected East Bay cities; *Oakland ZIP codes 94602, 94609, 94610, 94611, 94618, 94619, and 94705.
Sales Volume Homes Sold Avg. Days on Market Median Price
Q2 '14 Q2 '15 % change Q2 '14 Q2 '15 % change Q2 '14 Q2 '15 % change Q2 '14 Q2 '15 % change
Under $500,000 28,272,303$ 13,185,003$ -53% 69 33 -52% 33 65 97% 430,000$ 400,000$ -7%
Over $500,000 771,219,374$ 847,759,552$ 10% 729 767 5% 20 17 -15% 853,000$ 940,000$ 10%
$500,000 - $1 million 347,560,587$ 345,735,964$ -1% 468 443 -5% 19 17 -11% 749,500$ 785,000$ 5%
Over $1 million 423,658,787$ 502,023,588$ 18% 261 324 24% 21 16 -24% 1,365,000$ 1,350,000$ -1%
Source: Terradatum, July 6, 2015. Data is for SFH in the East Bay: Alameda, Albany, Berkeley, El Cerrito, Kensington, Piedmont, and Oakland ZIP codes 94602, 94609, 94610, 94611, 94618, 94619, and 94705.
East Bay Price Range Snapshot: Q2 2015 vs. Q2 2014
Sales Volume Homes Sold Avg. Days on Market Median Price
Q2 '14 Q2 '15 % change Q2 '14 Q2 '15 % change
Montclair / Joaquin Miller 83 102 23% $1,065,932 $1,089,188 2%
Crocker Highlands / Grand Lake 39 34 -13% $930,629 $1,174,117 26%
Rockridge / Claremont 50 50 0% $1,398,809 $1,559,888 12%
Glenview/Oakmore 34 30 -12% $845,764 $921,586 9%
Laurel / Dimond 17 15 -12% $513,417 $668,550 30%
Redwood Heights / Lincoln Heights 34 33 -3% $677,101 $790,910 17%
Crestmont / Ridgemont / Skyline 14 13 -7% $1,099,464 $1,266,692 15%
Temescal / Piedmont Ave. 11 19 73% $816,005 $976,000 20%
Oakland Snapshot: Q2 2015 vs. Q2 2014
NeighborhoodHomes Sold Average Price
Source: EBRD, July 6, 2015. Data is for single-family homes in selected Oakland neighborhoods.
East Baypacificunion.com
Brent ThomsonPresident, Marin [email protected] Redwood Highway, Suite 150 | Mill Valley, CA 94941
Marin CountyQuarterly Real Estate ReportQ2 2015
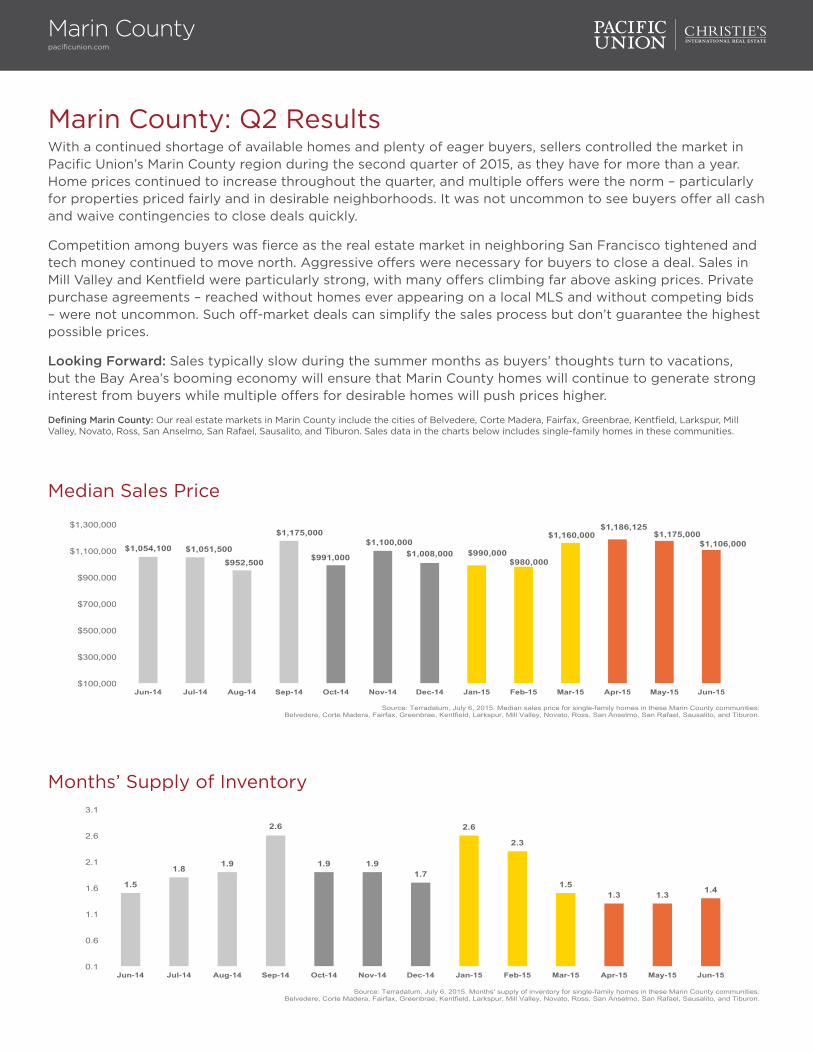
Marin County: Q2 ResultsWith a continued shortage of available homes and plenty of eager buyers, sellers controlled the market in Pacific Union’s Marin County region during the second quarter of 2015, as they have for more than a year. Home prices continued to increase throughout the quarter, and multiple offers were the norm – particularly for properties priced fairly and in desirable neighborhoods. It was not uncommon to see buyers offer all cash and waive contingencies to close deals quickly.
Competition among buyers was fierce as the real estate market in neighboring San Francisco tightened and tech money continued to move north. Aggressive offers were necessary for buyers to close a deal. Sales in Mill Valley and Kentfield were particularly strong, with many offers climbing far above asking prices. Private purchase agreements – reached without homes ever appearing on a local MLS and without competing bids – were not uncommon. Such off-market deals can simplify the sales process but don’t guarantee the highest possible prices.
Looking Forward: Sales typically slow during the summer months as buyers’ thoughts turn to vacations, but the Bay Area’s booming economy will ensure that Marin County homes will continue to generate strong interest from buyers while multiple offers for desirable homes will push prices higher.
Defining Marin County: Our real estate markets in Marin County include the cities of Belvedere, Corte Madera, Fairfax, Greenbrae, Kentfield, Larkspur, Mill Valley, Novato, Ross, San Anselmo, San Rafael, Sausalito, and Tiburon. Sales data in the charts below includes single-family homes in these communities.
Marin Countypacificunion.com
Median Sales Price
Months’ Supply of Inventory
$1,054,100 $1,051,500 $952,500
$1,175,000
$991,000
$1,100,000 $1,008,000 $990,000
$980,000
$1,160,000 $1,186,125
$1,175,000 $1,106,000
$100,000
$300,000
$500,000
$700,000
$900,000
$1,100,000
$1,300,000
Jun-14 Jul-14 Aug-14 Sep-14 Oct-14 Nov-14 Dec-14 Jan-15 Feb-15 Mar-15 Apr-15 May-15 Jun-15
Source: Terradatum, July 6, 2015. Median sales price for single-family homes in these Marin County communities: Belvedere, Corte Madera, Fairfax, Greenbrae, Kentfield, Larkspur, Mill Valley, Novato, Ross, San Anselmo, San Rafael, Sausalito, and Tiburon.
1.5
1.8 1.9
2.6
1.9 1.9 1.7
2.6
2.3
1.5 1.3 1.3 1.4
0.1
0.6
1.1
1.6
2.1
2.6
3.1
Jun-14 Jul-14 Aug-14 Sep-14 Oct-14 Nov-14 Dec-14 Jan-15 Feb-15 Mar-15 Apr-15 May-15 Jun-15
Source: Terradatum, July 6, 2015. Months' supply of inventory for single-family homes in these Marin County communities: Belvedere, Corte Madera, Fairfax, Greenbrae, Kentfield, Larkspur, Mill Valley, Novato, Ross, San Anselmo, San Rafael, Sausalito, and Tiburon.
Marin Countypacificunion.com
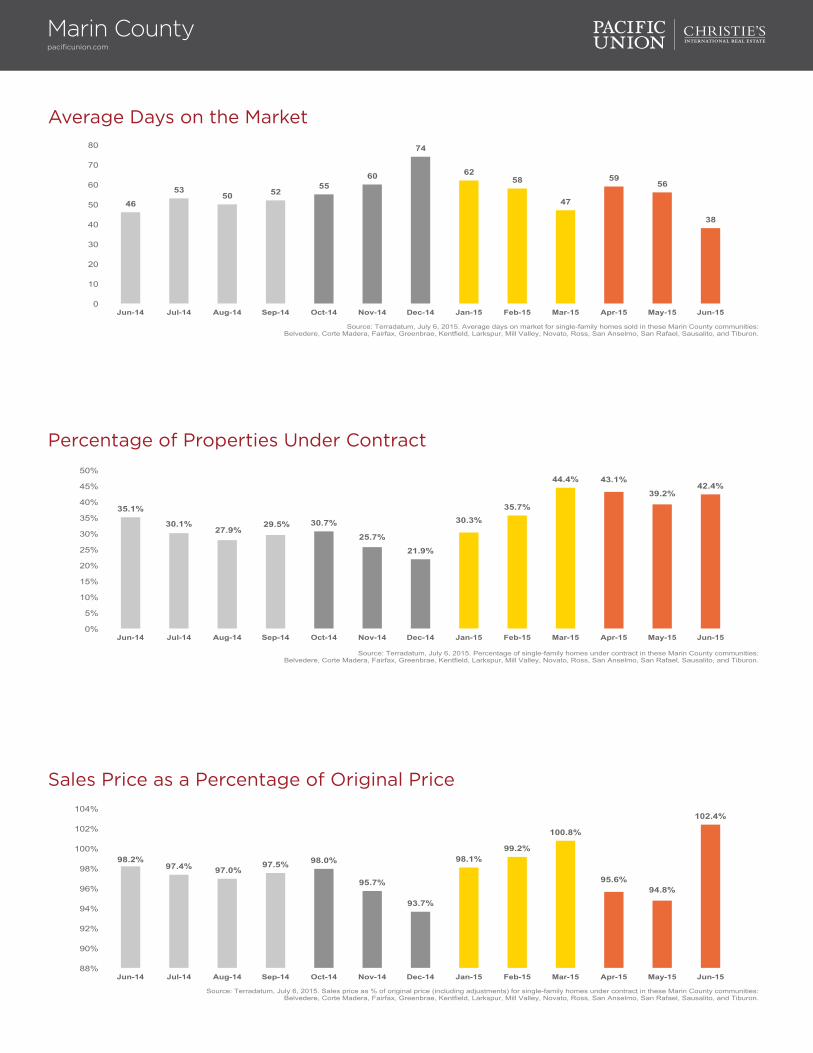
Average Days on the Market
Percentage of Properties Under Contract
46
53 50 52
55 60
74
62 58
47
59 56
38
0
10
20
30
40
50
60
70
80
Jun-14 Jul-14 Aug-14 Sep-14 Oct-14 Nov-14 Dec-14 Jan-15 Feb-15 Mar-15 Apr-15 May-15 Jun-15
Source: Terradatum, July 6, 2015. Average days on market for single-family homes sold in these Marin County communities: Belvedere, Corte Madera, Fairfax, Greenbrae, Kentfield, Larkspur, Mill Valley, Novato, Ross, San Anselmo, San Rafael, Sausalito, and Tiburon.
35.1%
30.1% 27.9%
29.5% 30.7%
25.7%
21.9%
30.3% 35.7%
44.4% 43.1%
39.2% 42.4%
0%
5%
10%
15%
20%
25%
30%
35%
40%
45%
50%
Jun-14 Jul-14 Aug-14 Sep-14 Oct-14 Nov-14 Dec-14 Jan-15 Feb-15 Mar-15 Apr-15 May-15 Jun-15
Source: Terradatum, July 6, 2015. Percentage of single-family homes under contract in these Marin County communities: Belvedere, Corte Madera, Fairfax, Greenbrae, Kentfield, Larkspur, Mill Valley, Novato, Ross, San Anselmo, San Rafael, Sausalito, and Tiburon.
Sales Price as a Percentage of Original Price
98.2% 97.4% 97.0%
97.5% 98.0%
95.7%
93.7%
98.1% 99.2%
100.8%
95.6% 94.8%
102.4%
88%
90%
92%
94%
96%
98%
100%
102%
104%
Jun-14 Jul-14 Aug-14 Sep-14 Oct-14 Nov-14 Dec-14 Jan-15 Feb-15 Mar-15 Apr-15 May-15 Jun-15
Source: Terradatum, July 6, 2015. Sales price as % of original price (including adjustments) for single-family homes under contract in these Marin County communities: Belvedere, Corte Madera, Fairfax, Greenbrae, Kentfield, Larkspur, Mill Valley, Novato, Ross, San Anselmo, San Rafael, Sausalito, and Tiburon.

A Closer Look at Marin County
Q2 '14 Q2 '15 % change Q2 '14 Q2 '15 % change Q2 '14 Q2 '15 % change Q2 '14 Q2 '15 % change
Belvedere 23,342,260$ 45,684,000$ 96% 9 6 -33% 76 939 1136% 2,470,000$ 7,685,750$ 211%
Corte Madera 33,693,348$ 31,277,000$ -7% 27 22 -19% 32 31 -3% 1,249,650$ 1,316,000$ 5%
Fairfax 22,724,015$ 21,783,875$ -4% 27 23 -15% 37 33 -11% 789,000$ 868,500$ 10%
Greenbrae 33,732,000$ 30,093,500$ -11% 22 17 -23% 33 16 -52% 1,475,500$ 1,700,000$ 15%
Kentfield 55,690,035$ 66,410,500$ 19% 27 24 -11% 37 21 -43% 1,800,000$ 2,275,000$ 26%
Larkspur 38,797,350$ 26,614,323$ -31% 26 18 -31% 34 32 -6% 1,347,500$ 1,398,000$ 4%
Mill Valley 198,353,722$ 223,146,172$ 12% 121 122 1% 40 36 -10% 1,350,000$ 1,613,250$ 20%
Novato 133,815,944$ 156,087,164$ 17% 162 177 9% 47 48 2% 762,500$ 800,000$ 5%
Ross 59,131,400$ 28,120,000$ -52% 17 8 -53% 60 37 -38% 3,200,000$ 3,450,000$ 8%
San Anselmo 79,967,205$ 78,090,965$ -2% 68 61 -10% 56 40 -29% 950,000$ 1,112,000$ 17%
San Rafael 171,704,995$ 178,333,442$ 4% 167 145 -13% 39 41 5% 858,000$ 980,000$ 14%
Sausalito 38,225,300$ 34,350,250$ -10% 20 18 -10% 44 91 107% 1,614,150$ 1,830,000$ 13%
Tiburon 127,701,500$ 94,907,700$ -26% 40 35 -13% 133 77 -42% 3,100,000$ 2,545,000$ -18%
Source: Terradatum, July 6, 2015. Data is for single-family homes in selected Marin County cities.
Marin County Snapshot: Q2 2015 vs. Q2 2014
Sales Volume Homes Sold Avg. Days on Market Median Price
Marin Countypacificunion.com
Linda CarrollRegional Executive, Napa [email protected] Main Street | Napa, CA 94559
Napa CountyQuarterly Real Estate ReportQ2 2015
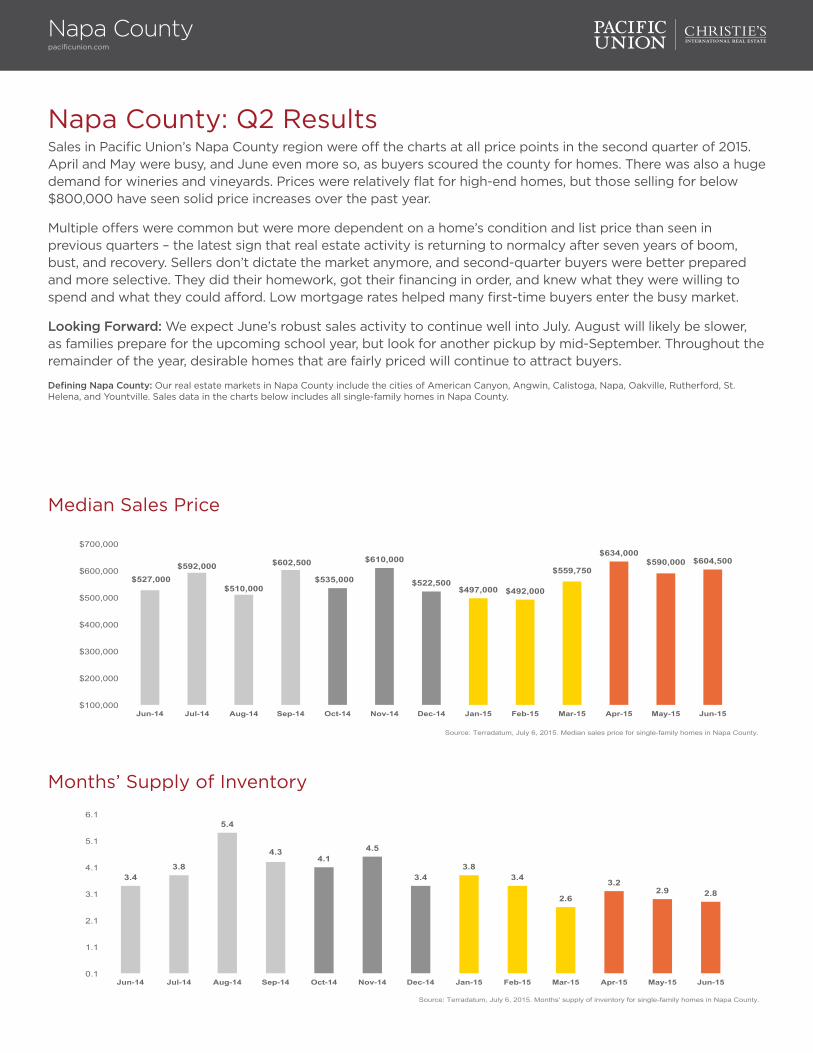
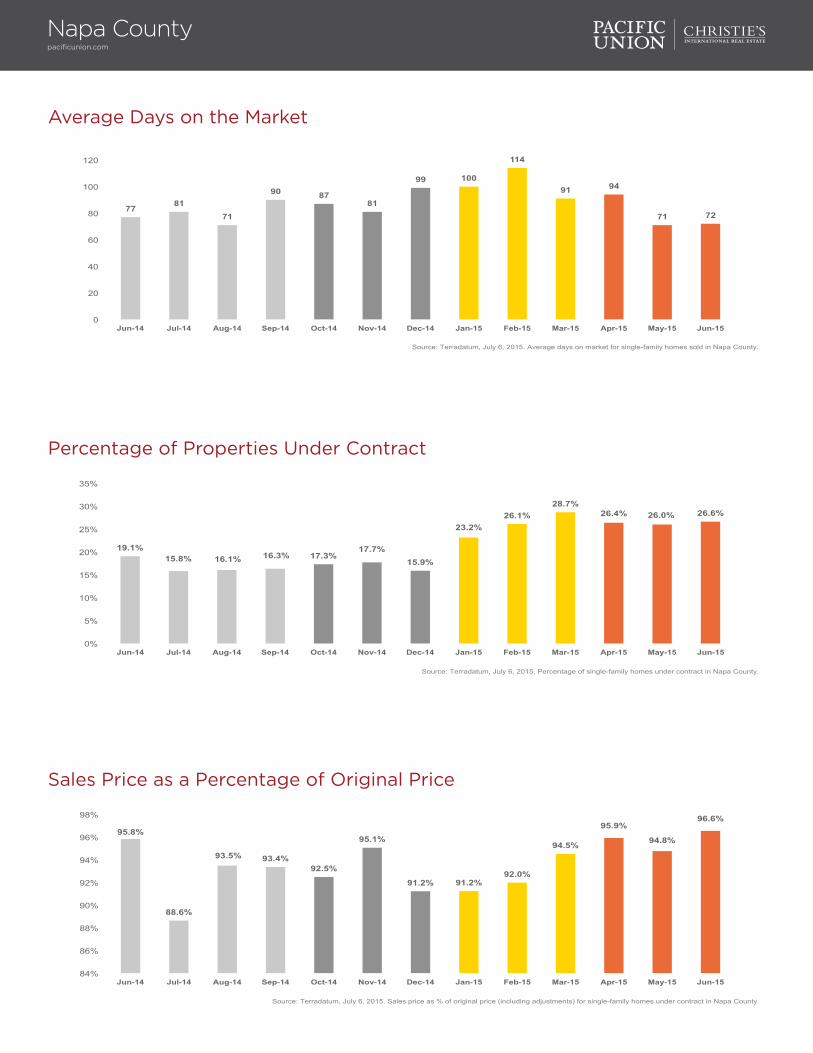
Napa County: Q2 ResultsSales in Pacific Union’s Napa County region were off the charts at all price points in the second quarter of 2015. April and May were busy, and June even more so, as buyers scoured the county for homes. There was also a huge demand for wineries and vineyards. Prices were relatively flat for high-end homes, but those selling for below $800,000 have seen solid price increases over the past year.
Multiple offers were common but were more dependent on a home’s condition and list price than seen in previous quarters – the latest sign that real estate activity is returning to normalcy after seven years of boom, bust, and recovery. Sellers don’t dictate the market anymore, and second-quarter buyers were better prepared and more selective. They did their homework, got their financing in order, and knew what they were willing to spend and what they could afford. Low mortgage rates helped many first-time buyers enter the busy market.
Looking Forward: We expect June’s robust sales activity to continue well into July. August will likely be slower, as families prepare for the upcoming school year, but look for another pickup by mid-September. Throughout the remainder of the year, desirable homes that are fairly priced will continue to attract buyers.
Defining Napa County: Our real estate markets in Napa County include the cities of American Canyon, Angwin, Calistoga, Napa, Oakville, Rutherford, St. Helena, and Yountville. Sales data in the charts below includes all single-family homes in Napa County.
Napa Countypacificunion.com
Median Sales Price
Months’ Supply of Inventory
$527,000 $592,000
$510,000
$602,500
$535,000
$610,000
$522,500 $497,000 $492,000
$559,750
$634,000 $590,000 $604,500
$100,000
$200,000
$300,000
$400,000
$500,000
$600,000
$700,000
Jun-14 Jul-14 Aug-14 Sep-14 Oct-14 Nov-14 Dec-14 Jan-15 Feb-15 Mar-15 Apr-15 May-15 Jun-15
Source: Terradatum, July 6, 2015. Median sales price for single-family homes in Napa County.
3.4 3.8
5.4
4.3 4.1
4.5
3.4 3.8
3.4
2.6
3.2 2.9 2.8
0.1
1.1
2.1
3.1
4.1
5.1
6.1
Jun-14 Jul-14 Aug-14 Sep-14 Oct-14 Nov-14 Dec-14 Jan-15 Feb-15 Mar-15 Apr-15 May-15 Jun-15
Source: Terradatum, July 6, 2015. Months' supply of inventory for single-family homes in Napa County.
Napa Countypacificunion.com
Average Days on the Market
Percentage of Properties Under Contract
77 81 71
90 87 81
99 100
114
91 94
71 72
0
20
40
60
80
100
120
Jun-14 Jul-14 Aug-14 Sep-14 Oct-14 Nov-14 Dec-14 Jan-15 Feb-15 Mar-15 Apr-15 May-15 Jun-15
Source: Terradatum, July 6, 2015. Average days on market for single-family homes sold in Napa County.
19.1% 15.8% 16.1% 16.3% 17.3%
17.7% 15.9%
23.2% 26.1%
28.7% 26.4% 26.0% 26.6%
0%
5%
10%
15%
20%
25%
30%
35%
Jun-14 Jul-14 Aug-14 Sep-14 Oct-14 Nov-14 Dec-14 Jan-15 Feb-15 Mar-15 Apr-15 May-15 Jun-15
Source: Terradatum, July 6, 2015. Percentage of single-family homes under contract in Napa County.
Sales Price as a Percentage of Original Price
95.8%
88.6%
93.5% 93.4% 92.5%
95.1%
91.2% 91.2% 92.0%
94.5%
95.9%
94.8%
96.6%
84%
86%
88%
90%
92%
94%
96%
98%
Jun-14 Jul-14 Aug-14 Sep-14 Oct-14 Nov-14 Dec-14 Jan-15 Feb-15 Mar-15 Apr-15 May-15 Jun-15
Source: Terradatum, July 6, 2015. Sales price as % of original price (including adjustments) for single-family homes under contract in Napa County.
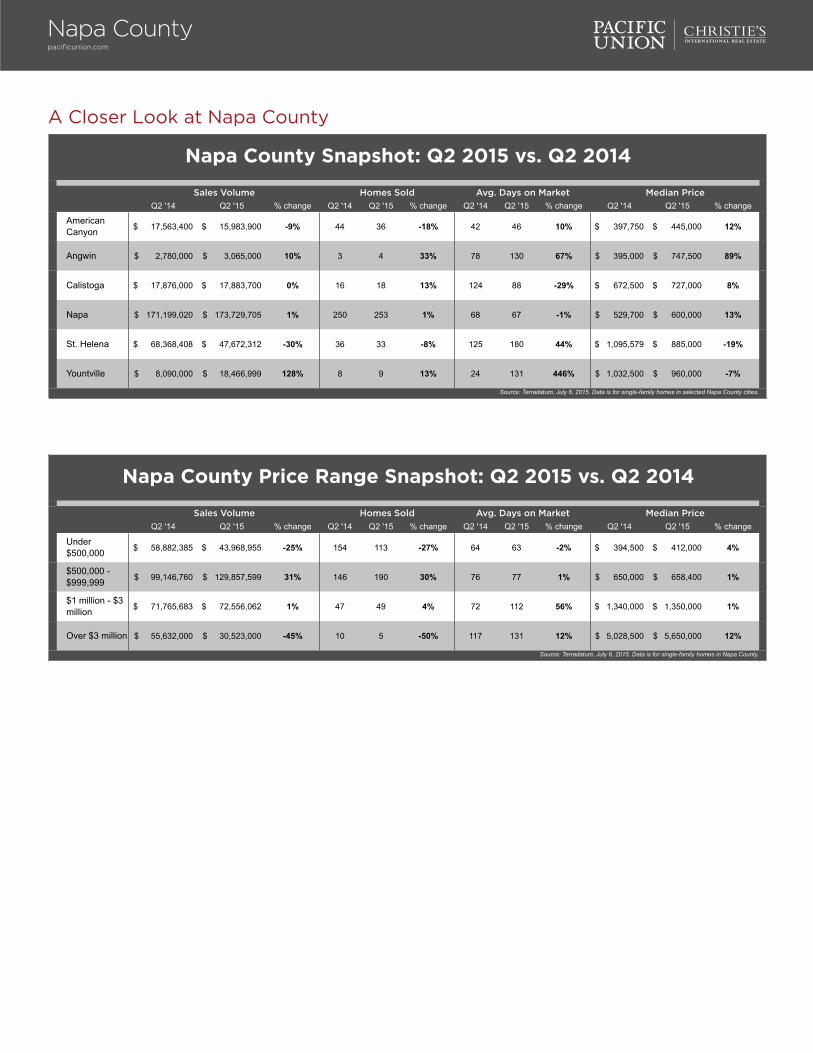
A Closer Look at Napa County
Q2 '14 Q2 '15 % change Q2 '14 Q2 '15 % change Q2 '14 Q2 '15 % change Q2 '14 Q2 '15 % change
American Canyon 17,563,400$ 15,983,900$ -9% 44 36 -18% 42 46 10% 397,750$ 445,000$ 12%
Angwin 2,780,000$ 3,065,000$ 10% 3 4 33% 78 130 67% 395,000$ 747,500$ 89%
Calistoga 17,876,000$ 17,883,700$ 0% 16 18 13% 124 88 -29% 672,500$ 727,000$ 8%
Napa 171,199,020$ 173,729,705$ 1% 250 253 1% 68 67 -1% 529,700$ 600,000$ 13%
St. Helena 68,368,408$ 47,672,312$ -30% 36 33 -8% 125 180 44% 1,095,579$ 885,000$ -19%
Yountville 8,090,000$ 18,466,999$ 128% 8 9 13% 24 131 446% 1,032,500$ 960,000$ -7%
Source: Terradatum, July 6, 2015. Data is for single-family homes in selected Napa County cities.
Napa County Snapshot: Q2 2015 vs. Q2 2014
Sales Volume Homes Sold Avg. Days on Market Median Price
Q2 '14 Q2 '15 % change Q2 '14 Q2 '15 % change Q2 '14 Q2 '15 % change Q2 '14 Q2 '15 % change
Under $500,000 58,882,385$ 43,968,955$ -25% 154 113 -27% 64 63 -2% 394,500$ 412,000$ 4%
$500,000 - $999,999 99,146,760$ 129,857,599$ 31% 146 190 30% 76 77 1% 650,000$ 658,400$ 1%
$1 million - $3 million 71,765,683$ 72,556,062$ 1% 47 49 4% 72 112 56% 1,340,000$ 1,350,000$ 1%
Over $3 million 55,632,000$ 30,523,000$ -45% 10 5 -50% 117 131 12% 5,028,500$ 5,650,000$ 12%
Median Price
Source: Terradatum, July 6, 2015. Data is for single-family homes in Napa County.
Napa County Price Range Snapshot: Q2 2015 vs. Q2 2014
Sales Volume Homes Sold Avg. Days on Market
Napa Countypacificunion.com

Patrick [email protected] Van Ness Avenue | San Francisco, CA 94109
San FranciscoQuarterly Real Estate ReportQ2 2015
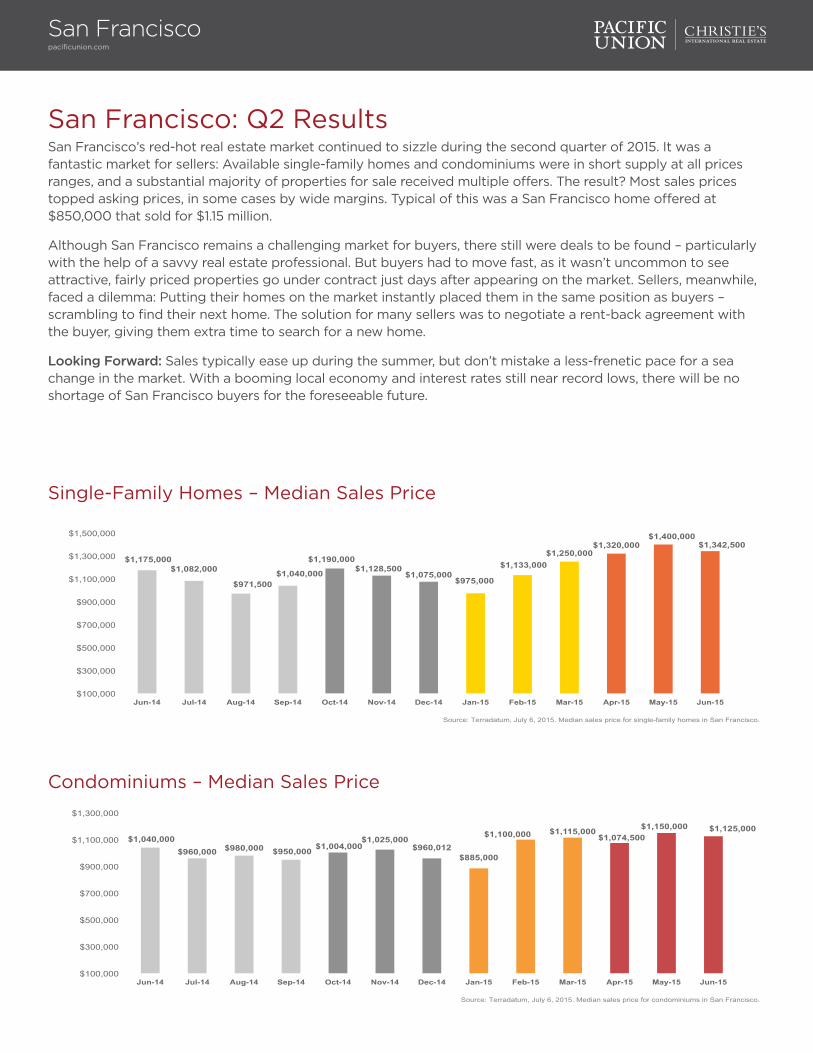
San Francisco: Q2 ResultsSan Francisco’s red-hot real estate market continued to sizzle during the second quarter of 2015. It was a fantastic market for sellers: Available single-family homes and condominiums were in short supply at all prices ranges, and a substantial majority of properties for sale received multiple offers. The result? Most sales prices topped asking prices, in some cases by wide margins. Typical of this was a San Francisco home offered at $850,000 that sold for $1.15 million.
Although San Francisco remains a challenging market for buyers, there still were deals to be found – particularly with the help of a savvy real estate professional. But buyers had to move fast, as it wasn’t uncommon to see attractive, fairly priced properties go under contract just days after appearing on the market. Sellers, meanwhile, faced a dilemma: Putting their homes on the market instantly placed them in the same position as buyers – scrambling to find their next home. The solution for many sellers was to negotiate a rent-back agreement with the buyer, giving them extra time to search for a new home.
Looking Forward: Sales typically ease up during the summer, but don’t mistake a less-frenetic pace for a sea change in the market. With a booming local economy and interest rates still near record lows, there will be no shortage of San Francisco buyers for the foreseeable future.
San Franciscopacificunion.com
Single-Family Homes – Median Sales Price
Condominiums – Median Sales Price
$1,175,000 $1,082,000
$971,500 $1,040,000
$1,190,000 $1,128,500
$1,075,000 $975,000
$1,133,000 $1,250,000
$1,320,000 $1,400,000
$1,342,500
$100,000
$300,000
$500,000
$700,000
$900,000
$1,100,000
$1,300,000
$1,500,000
Jun-14 Jul-14 Aug-14 Sep-14 Oct-14 Nov-14 Dec-14 Jan-15 Feb-15 Mar-15 Apr-15 May-15 Jun-15
Source: Terradatum, July 6, 2015. Median sales price for single-family homes in San Francisco.
$1,040,000 $960,000 $980,000 $950,000 $1,004,000
$1,025,000 $960,012
$885,000
$1,100,000 $1,115,000 $1,074,500
$1,150,000 $1,125,000
$100,000
$300,000
$500,000
$700,000
$900,000
$1,100,000
$1,300,000
Jun-14 Jul-14 Aug-14 Sep-14 Oct-14 Nov-14 Dec-14 Jan-15 Feb-15 Mar-15 Apr-15 May-15 Jun-15
Source: Terradatum, July 6, 2015. Median sales price for condominiums in San Francisco.
San Franciscopacificunion.com
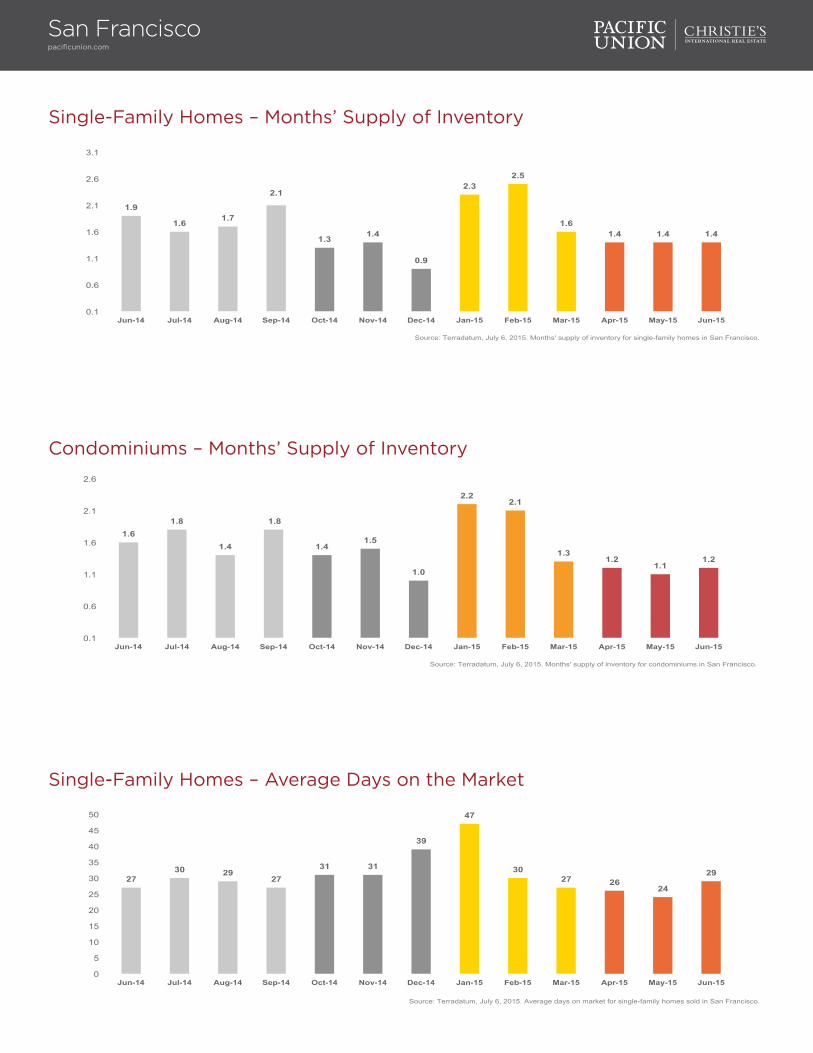
Single-Family Homes – Months’ Supply of Inventory
1.9
1.6 1.7
2.1
1.3 1.4
0.9
2.3 2.5
1.6 1.4 1.4 1.4
0.1
0.6
1.1
1.6
2.1
2.6
3.1
Jun-14 Jul-14 Aug-14 Sep-14 Oct-14 Nov-14 Dec-14 Jan-15 Feb-15 Mar-15 Apr-15 May-15 Jun-15
Source: Terradatum, July 6, 2015. Months' supply of inventory for single-family homes in San Francisco.
Single-Family Homes – Average Days on the Market
27 30 29
27 31 31
39
47
30 27 26
24
29
0
5
10
15
20
25
30
35
40
45
50
Jun-14 Jul-14 Aug-14 Sep-14 Oct-14 Nov-14 Dec-14 Jan-15 Feb-15 Mar-15 Apr-15 May-15 Jun-15
Source: Terradatum, July 6, 2015. Average days on market for single-family homes sold in San Francisco.
Condominiums – Months’ Supply of Inventory
1.6 1.8
1.4
1.8
1.4 1.5
1.0
2.2 2.1
1.3 1.2
1.1 1.2
0.1
0.6
1.1
1.6
2.1
2.6
Jun-14 Jul-14 Aug-14 Sep-14 Oct-14 Nov-14 Dec-14 Jan-15 Feb-15 Mar-15 Apr-15 May-15 Jun-15
Source: Terradatum, July 6, 2015. Months' supply of inventory for condominiums in San Francisco.
San Franciscopacificunion.com
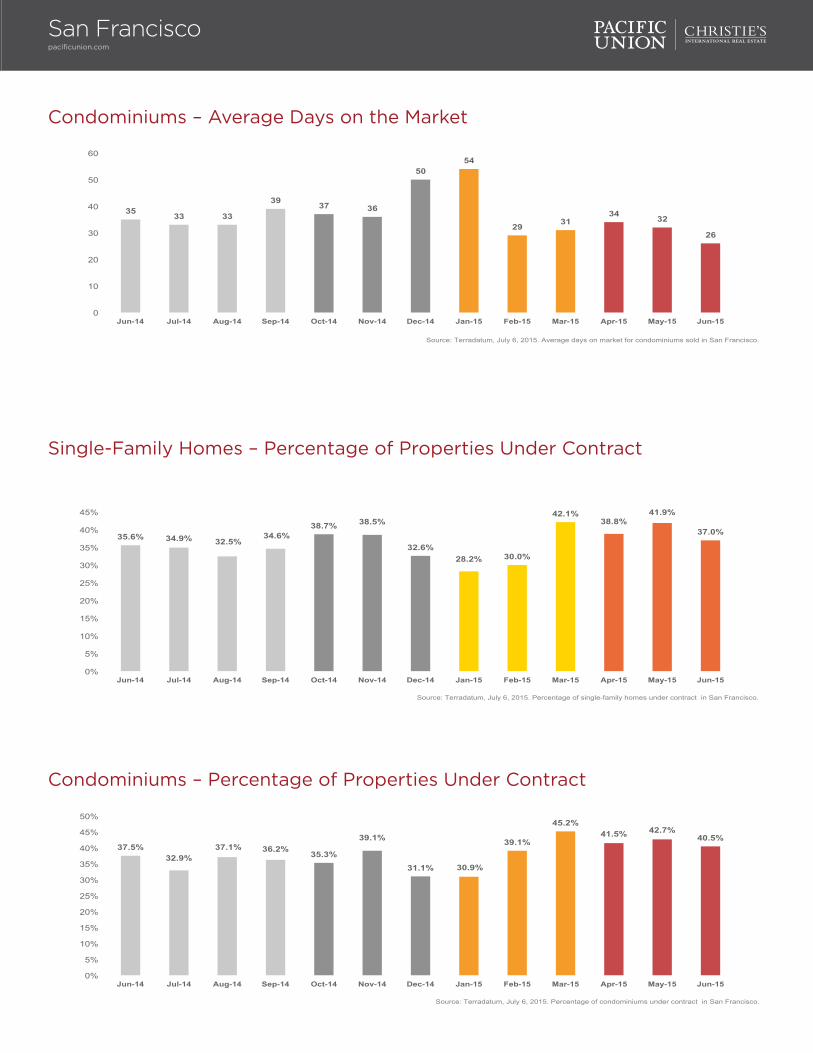
Condominiums – Average Days on the Market
35 33 33
39 37 36
50 54
29 31 34 32
26
0
10
20
30
40
50
60
Jun-14 Jul-14 Aug-14 Sep-14 Oct-14 Nov-14 Dec-14 Jan-15 Feb-15 Mar-15 Apr-15 May-15 Jun-15
Source: Terradatum, July 6, 2015. Average days on market for condominiums sold in San Francisco.
Condominiums – Percentage of Properties Under Contract
37.5% 32.9%
37.1% 36.2% 35.3%
39.1%
31.1% 30.9%
39.1%
45.2% 41.5% 42.7%
40.5%
0%
5%
10%
15%
20%
25%
30%
35%
40%
45%
50%
Jun-14 Jul-14 Aug-14 Sep-14 Oct-14 Nov-14 Dec-14 Jan-15 Feb-15 Mar-15 Apr-15 May-15 Jun-15
Source: Terradatum, July 6, 2015. Percentage of condominiums under contract in San Francisco.
Single-Family Homes – Percentage of Properties Under Contract
35.6% 34.9% 32.5% 34.6%
38.7% 38.5%
32.6% 28.2% 30.0%
42.1% 38.8%
41.9%
37.0%
0%
5%
10%
15%
20%
25%
30%
35%
40%
45%
Jun-14 Jul-14 Aug-14 Sep-14 Oct-14 Nov-14 Dec-14 Jan-15 Feb-15 Mar-15 Apr-15 May-15 Jun-15
Source: Terradatum, July 6, 2015. Percentage of single-family homes under contract in San Francisco.
San Franciscopacificunion.com
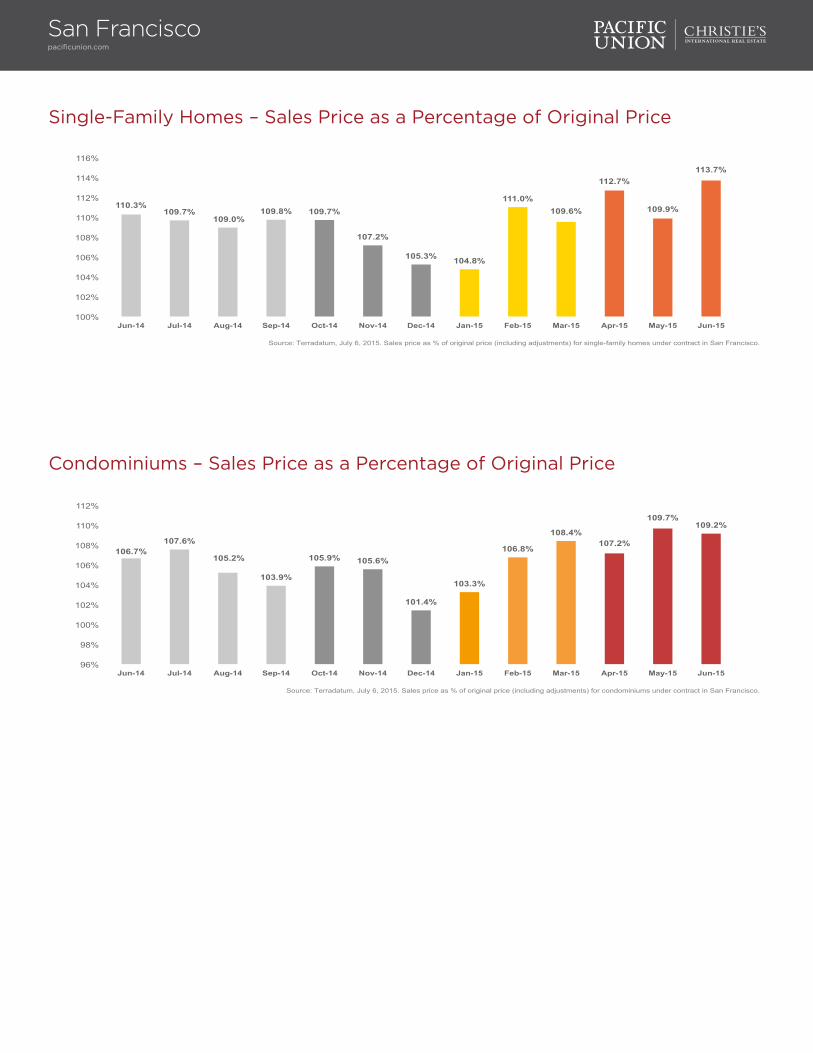
Single-Family Homes – Sales Price as a Percentage of Original Price
110.3% 109.7%
109.0% 109.8% 109.7%
107.2%
105.3% 104.8%
111.0% 109.6%
112.7%
109.9%
113.7%
100%
102%
104%
106%
108%
110%
112%
114%
116%
Jun-14 Jul-14 Aug-14 Sep-14 Oct-14 Nov-14 Dec-14 Jan-15 Feb-15 Mar-15 Apr-15 May-15 Jun-15
Source: Terradatum, July 6, 2015. Sales price as % of original price (including adjustments) for single-family homes under contract in San Francisco.
Condominiums – Sales Price as a Percentage of Original Price
106.7% 107.6%
105.2%
103.9%
105.9% 105.6%
101.4%
103.3%
106.8%
108.4% 107.2%
109.7% 109.2%
96%
98%
100%
102%
104%
106%
108%
110%
112%
Jun-14 Jul-14 Aug-14 Sep-14 Oct-14 Nov-14 Dec-14 Jan-15 Feb-15 Mar-15 Apr-15 May-15 Jun-15
Source: Terradatum, July 6, 2015. Sales price as % of original price (including adjustments) for condominiums under contract in San Francisco.
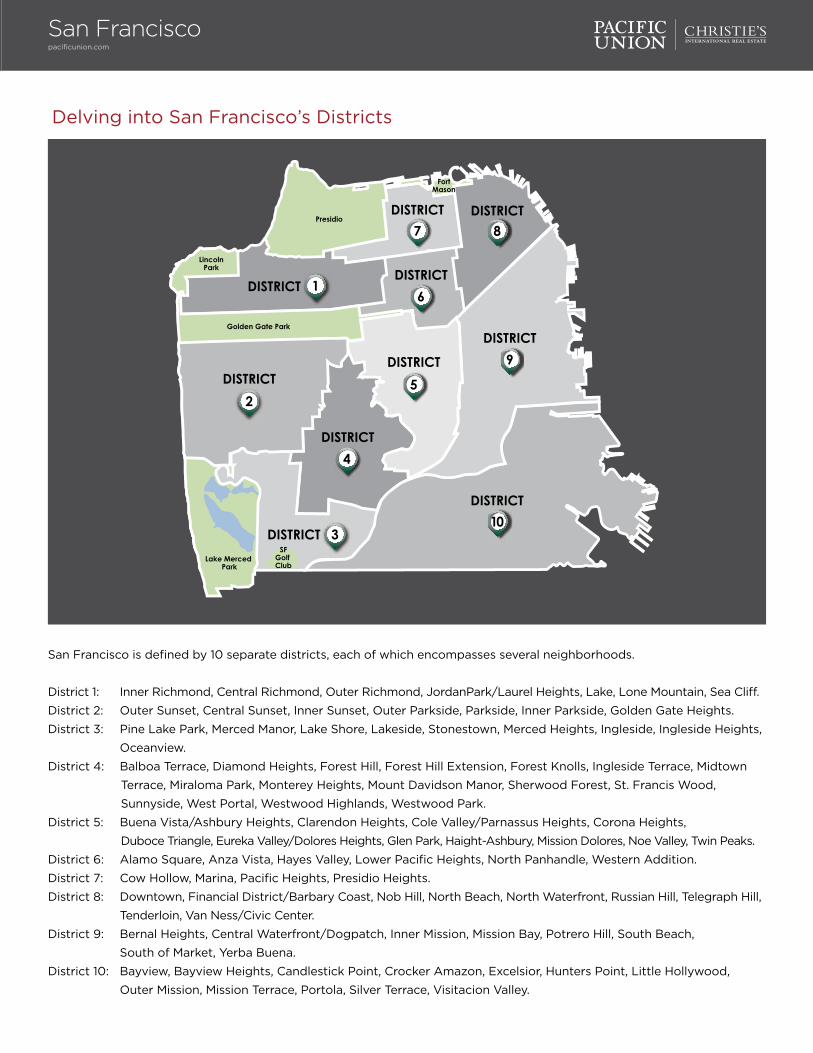
Delving into San Francisco’s Districts
San Francisco is defined by 10 separate districts, each of which encompasses several neighborhoods.
District 1: Inner Richmond, Central Richmond, Outer Richmond, JordanPark/Laurel Heights, Lake, Lone Mountain, Sea Cliff.
District 2: Outer Sunset, Central Sunset, Inner Sunset, Outer Parkside, Parkside, Inner Parkside, Golden Gate Heights.
District 3: Pine Lake Park, Merced Manor, Lake Shore, Lakeside, Stonestown, Merced Heights, Ingleside, Ingleside Heights,
Oceanview.
District 4: Balboa Terrace, Diamond Heights, Forest Hill, Forest Hill Extension, Forest Knolls, Ingleside Terrace, Midtown
Terrace, Miraloma Park, Monterey Heights, Mount Davidson Manor, Sherwood Forest, St. Francis Wood,
Sunnyside, West Portal, Westwood Highlands, Westwood Park.
District 5: Buena Vista/Ashbury Heights, Clarendon Heights, Cole Valley/Parnassus Heights, Corona Heights,
Duboce Triangle, Eureka Valley/Dolores Heights, Glen Park, Haight-Ashbury, Mission Dolores, Noe Valley, Twin Peaks.
District 6: Alamo Square, Anza Vista, Hayes Valley, Lower Pacific Heights, North Panhandle, Western Addition.
District 7: Cow Hollow, Marina, Pacific Heights, Presidio Heights.
District 8: Downtown, Financial District/Barbary Coast, Nob Hill, North Beach, North Waterfront, Russian Hill, Telegraph Hill,
Tenderloin, Van Ness/Civic Center.
District 9: Bernal Heights, Central Waterfront/Dogpatch, Inner Mission, Mission Bay, Potrero Hill, South Beach,
South of Market, Yerba Buena.
District 10: Bayview, Bayview Heights, Candlestick Point, Crocker Amazon, Excelsior, Hunters Point, Little Hollywood,
Outer Mission, Mission Terrace, Portola, Silver Terrace, Visitacion Valley.
San Franciscopacificunion.com
San Franciscopacificunion.com
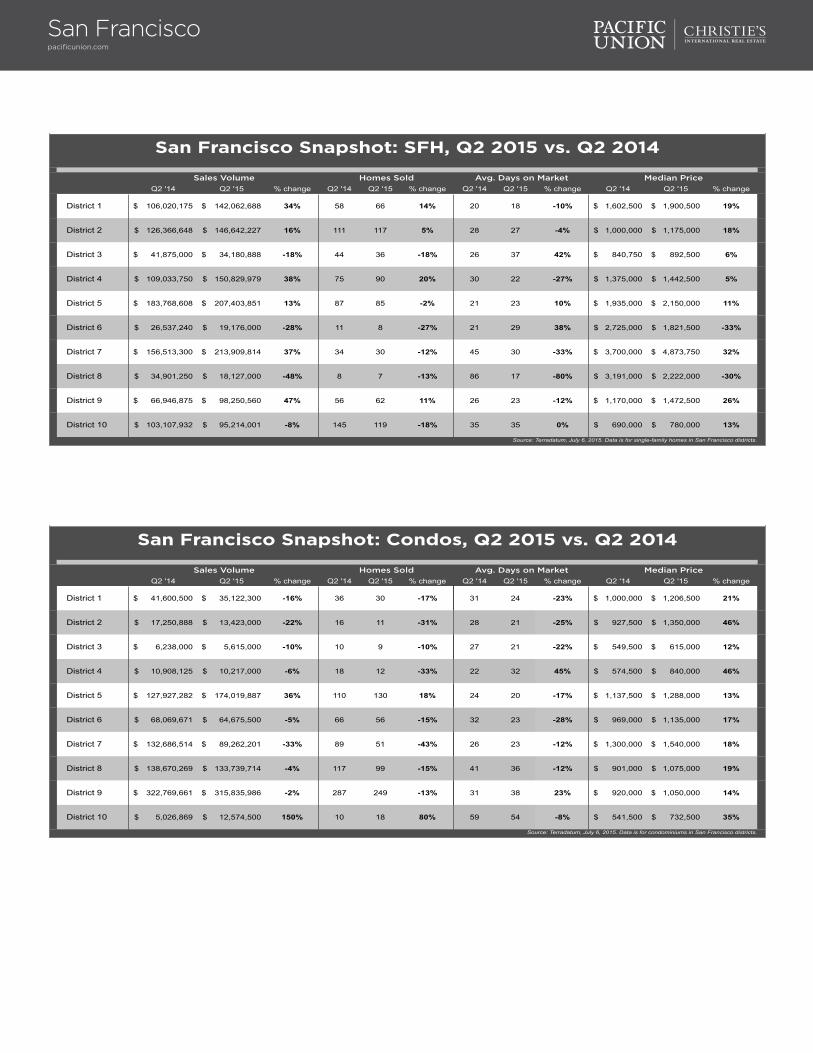
Q2 '14 Q2 '15 % change Q2 '14 Q2 '15 % change Q2 '14 Q2 '15 % change Q2 '14 Q2 '15 % change
District 1 106,020,175$ 142,062,688$ 34% 58 66 14% 20 18 -10% 1,602,500$ 1,900,500$ 19%
District 2 126,366,648$ 146,642,227$ 16% 111 117 5% 28 27 -4% 1,000,000$ 1,175,000$ 18%
District 3 41,875,000$ 34,180,888$ -18% 44 36 -18% 26 37 42% 840,750$ 892,500$ 6%
District 4 109,033,750$ 150,829,979$ 38% 75 90 20% 30 22 -27% 1,375,000$ 1,442,500$ 5%
District 5 183,768,608$ 207,403,851$ 13% 87 85 -2% 21 23 10% 1,935,000$ 2,150,000$ 11%
District 6 26,537,240$ 19,176,000$ -28% 11 8 -27% 21 29 38% 2,725,000$ 1,821,500$ -33%
District 7 156,513,300$ 213,909,814$ 37% 34 30 -12% 45 30 -33% 3,700,000$ 4,873,750$ 32%
District 8 34,901,250$ 18,127,000$ -48% 8 7 -13% 86 17 -80% 3,191,000$ 2,222,000$ -30%
District 9 66,946,875$ 98,250,560$ 47% 56 62 11% 26 23 -12% 1,170,000$ 1,472,500$ 26%
District 10 103,107,932$ 95,214,001$ -8% 145 119 -18% 35 35 0% 690,000$ 780,000$ 13%
Source: Terradatum, July 6, 2015. Data is for single-family homes in San Francisco districts.
San Francisco Snapshot: SFH, Q2 2015 vs. Q2 2014
Sales Volume Homes Sold Avg. Days on Market Median Price
Q2 '14 Q2 '15 % change Q2 '14 Q2 '15 % change Q2 '14 Q2 '15 % change Q2 '14 Q2 '15 % change
District 1 41,600,500$ 35,122,300$ -16% 36 30 -17% 31 24 -23% 1,000,000$ 1,206,500$ 21%
District 2 17,250,888$ 13,423,000$ -22% 16 11 -31% 28 21 -25% 927,500$ 1,350,000$ 46%
District 3 6,238,000$ 5,615,000$ -10% 10 9 -10% 27 21 -22% 549,500$ 615,000$ 12%
District 4 10,908,125$ 10,217,000$ -6% 18 12 -33% 22 32 45% 574,500$ 840,000$ 46%
District 5 127,927,282$ 174,019,887$ 36% 110 130 18% 24 20 -17% 1,137,500$ 1,288,000$ 13%
District 6 68,069,671$ 64,675,500$ -5% 66 56 -15% 32 23 -28% 969,000$ 1,135,000$ 17%
District 7 132,686,514$ 89,262,201$ -33% 89 51 -43% 26 23 -12% 1,300,000$ 1,540,000$ 18%
District 8 138,670,269$ 133,739,714$ -4% 117 99 -15% 41 36 -12% 901,000$ 1,075,000$ 19%
District 9 322,769,661$ 315,835,986$ -2% 287 249 -13% 31 38 23% 920,000$ 1,050,000$ 14%
District 10 5,026,869$ 12,574,500$ 150% 10 18 80% 59 54 -8% 541,500$ 732,500$ 35%
Source: Terradatum, July 6, 2015. Data is for condominiums in San Francisco districts.
San Francisco Snapshot: Condos, Q2 2015 vs. Q2 2014
Sales Volume Homes Sold Avg. Days on Market Median Price

San Franciscopacificunion.com
Q2 '14 Q2 '15 % change Q2 '14 Q2 '15 % change Q2 '14 Q2 '15 % change Q2 '14 Q2 '15 % change
Under $1 million 195,963,030$ 135,312,201$ -31% 261 173 -34% 34 36 6% 750,000$ 800,000$ 7%
$1 million - $3 million 498,568,173$ 634,016,993$ 27% 312 385 23% 23 22 -4% 1,462,500$ 1,500,000$ 3%
Over $3 million 260,539,575$ 356,467,814$ 37% 56 62 11% 40 28 -30% 3,690,000$ 4,137,500$ 12%
San Francisco Price Range Snapshot: SFH, Q2 2015 vs. Q2 2014
Source: Terradatum, July 6, 2015. Data is for single-family homes in San Francisco County.
Sales Volume Homes Sold Avg. Days on Market Median Price
Q2 '14 Q2 '15 % change Q2 '14 Q2 '15 % change Q2 '14 Q2 '15 % change Q2 '14 Q2 '15 % change
Under $1 million 287,601,419$ 210,918,200$ -27% 399 272 -32% 35 34 -3% 750,000$ 810,000$ 8%
$1 million - $2 million 400,835,564$ 451,679,811$ 13% 295 327 11% 25 26 4% 1,315,000$ 1,345,000$ 2%
Over $2 million 182,710,796$ 191,887,077$ 5% 65 66 2% 35 44 26% 2,500,000$ 2,719,650$ 9%
Source: Terradatum, July 6, 2015. Data is for condominiums in San Francisco County.
San Francisco Price Range Snapshot: Condos, Q2 2015 vs. Q2 2014
Sales Volume Homes Sold Avg. Days on Market Median Price
David BarcaVice President, Silicon [email protected] El Camino Real, Suite 220 | Menlo Park CA 94025
Silicon ValleyQuarterly Real Estate ReportQ2 2015
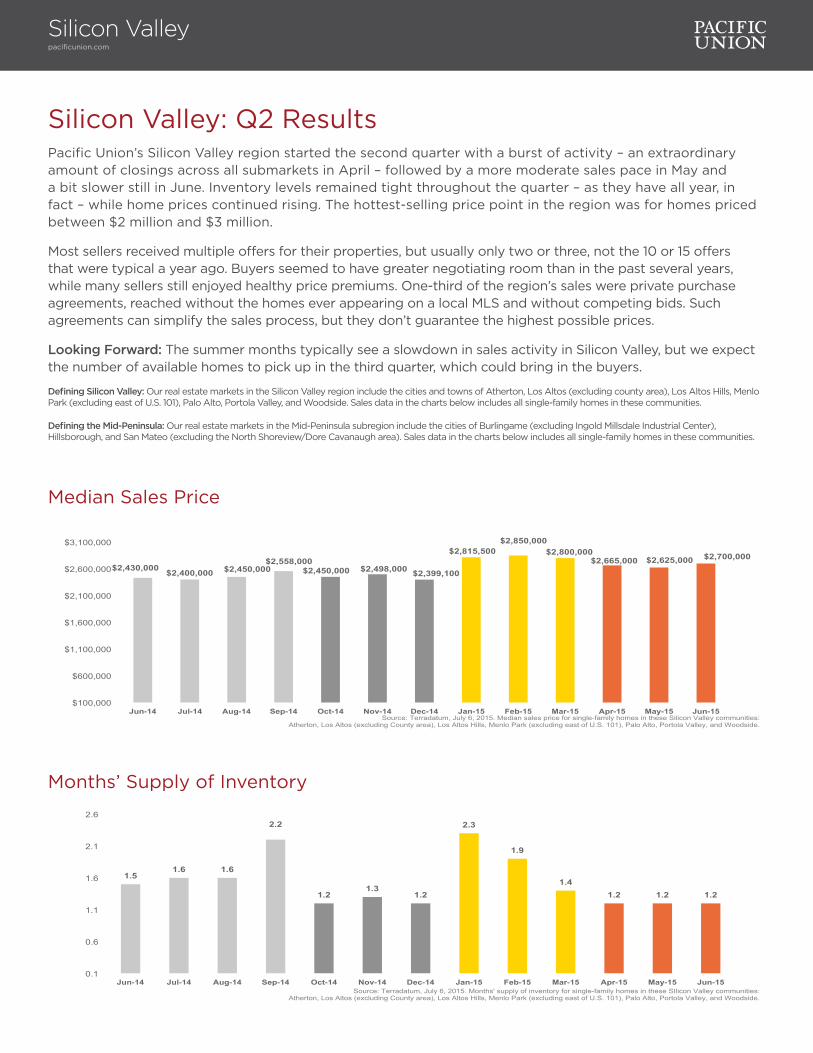
Silicon Valley: Q2 ResultsPacific Union’s Silicon Valley region started the second quarter with a burst of activity – an extraordinary amount of closings across all submarkets in April – followed by a more moderate sales pace in May and a bit slower still in June. Inventory levels remained tight throughout the quarter – as they have all year, in fact – while home prices continued rising. The hottest-selling price point in the region was for homes priced between $2 million and $3 million.
Most sellers received multiple offers for their properties, but usually only two or three, not the 10 or 15 offers that were typical a year ago. Buyers seemed to have greater negotiating room than in the past several years, while many sellers still enjoyed healthy price premiums. One-third of the region’s sales were private purchase agreements, reached without the homes ever appearing on a local MLS and without competing bids. Such agreements can simplify the sales process, but they don’t guarantee the highest possible prices.
Looking Forward: The summer months typically see a slowdown in sales activity in Silicon Valley, but we expect the number of available homes to pick up in the third quarter, which could bring in the buyers.
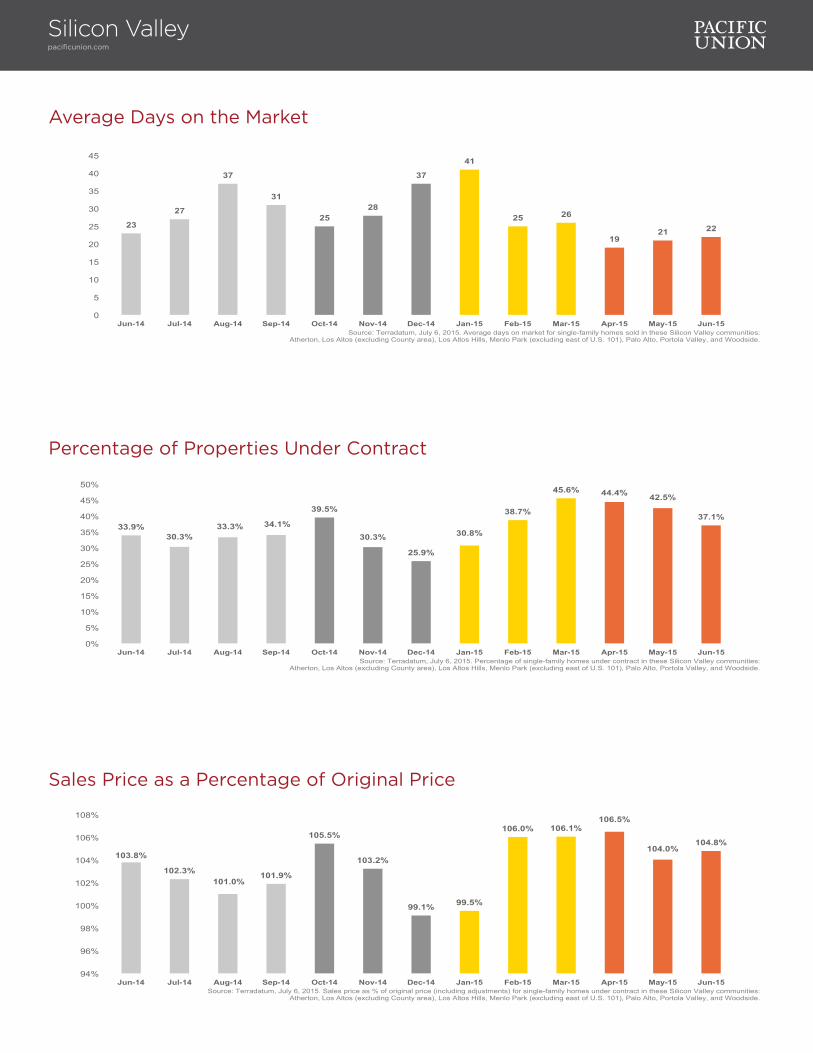
Defining Silicon Valley: Our real estate markets in the Silicon Valley region include the cities and towns of Atherton, Los Altos (excluding county area), Los Altos Hills, Menlo Park (excluding east of U.S. 101), Palo Alto, Portola Valley, and Woodside. Sales data in the charts below includes all single-family homes in these communities.
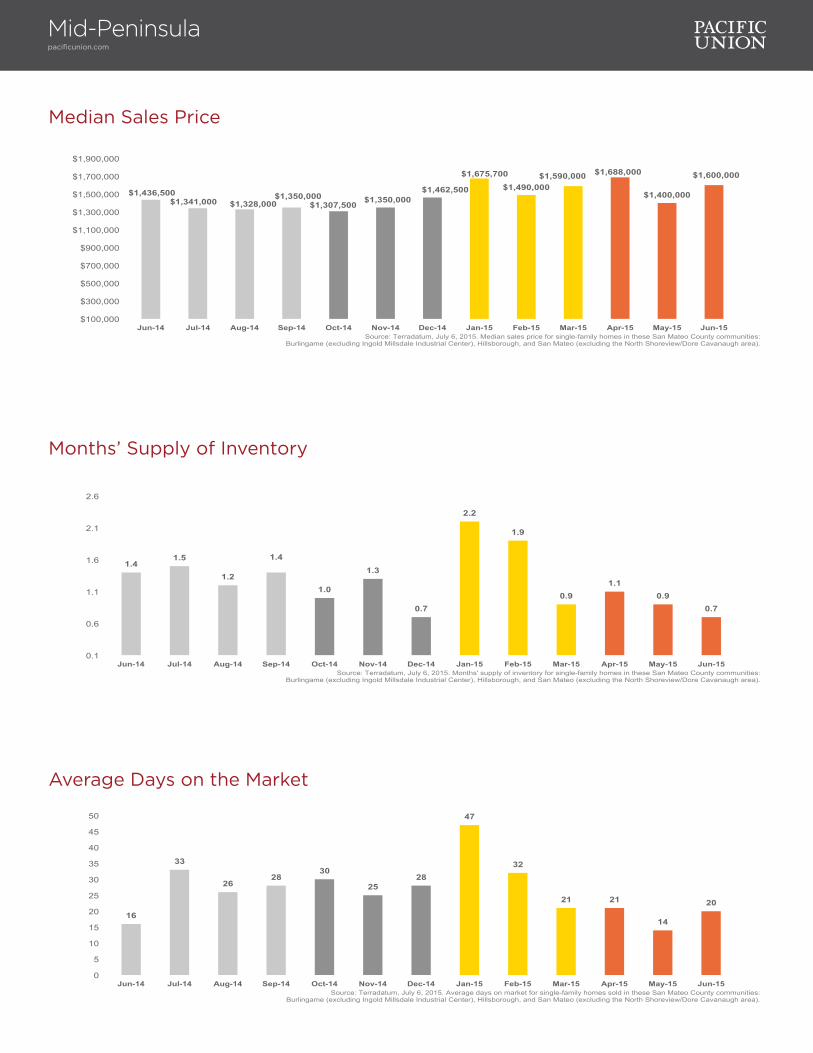
Defining the Mid-Peninsula: Our real estate markets in the Mid-Peninsula subregion include the cities of Burlingame (excluding Ingold Millsdale Industrial Center), Hillsborough, and San Mateo (excluding the North Shoreview/Dore Cavanaugh area). Sales data in the charts below includes all single-family homes in these communities.
Silicon Valleypacificunion.com
Median Sales Price
Months’ Supply of Inventory
$2,430,000 $2,400,000 $2,450,000 $2,558,000
$2,450,000 $2,498,000 $2,399,100
$2,815,500 $2,850,000
$2,800,000 $2,665,000 $2,625,000 $2,700,000
$100,000
$600,000
$1,100,000
$1,600,000
$2,100,000
$2,600,000
$3,100,000
Jun-14 Jul-14 Aug-14 Sep-14 Oct-14 Nov-14 Dec-14 Jan-15 Feb-15 Mar-15 Apr-15 May-15 Jun-15 Source: Terradatum, July 6, 2015. Median sales price for single-family homes in these Silicon Valley communities:
Atherton, Los Altos (excluding County area), Los Altos Hills, Menlo Park (excluding east of U.S. 101), Palo Alto, Portola Valley, and Woodside.
1.5 1.6 1.6
2.2
1.2 1.3
1.2
2.3
1.9
1.4 1.2 1.2 1.2
0.1
0.6
1.1
1.6
2.1
2.6
Jun-14 Jul-14 Aug-14 Sep-14 Oct-14 Nov-14 Dec-14 Jan-15 Feb-15 Mar-15 Apr-15 May-15 Jun-15 Source: Terradatum, July 6, 2015. Months' supply of inventory for single-family homes in these SIlicon Valley communities:
Atherton, Los Altos (excluding County area), Los Altos Hills, Menlo Park (excluding east of U.S. 101), Palo Alto, Portola Valley, and Woodside.
Silicon Valleypacificunion.com
Average Days on the Market
23
27
37
31
25 28
37
41
25 26
19 21 22
0
5
10
15
20
25
30
35
40
45
Jun-14 Jul-14 Aug-14 Sep-14 Oct-14 Nov-14 Dec-14 Jan-15 Feb-15 Mar-15 Apr-15 May-15 Jun-15 Source: Terradatum, July 6, 2015. Average days on market for single-family homes sold in these Silicon Valley communities:
Atherton, Los Altos (excluding County area), Los Altos Hills, Menlo Park (excluding east of U.S. 101), Palo Alto, Portola Valley, and Woodside.
Sales Price as a Percentage of Original Price
103.8%
102.3% 101.0%
101.9%
105.5%
103.2%
99.1% 99.5%
106.0% 106.1% 106.5%
104.0% 104.8%
94%
96%
98%
100%
102%
104%
106%
108%
Jun-14 Jul-14 Aug-14 Sep-14 Oct-14 Nov-14 Dec-14 Jan-15 Feb-15 Mar-15 Apr-15 May-15 Jun-15 Source: Terradatum, July 6, 2015. Sales price as % of original price (including adjustments) for single-family homes under contract in these Silicon Valley communities:
Atherton, Los Altos (excluding County area), Los Altos Hills, Menlo Park (excluding east of U.S. 101), Palo Alto, Portola Valley, and Woodside.
Percentage of Properties Under Contract
33.9% 30.3%
33.3% 34.1%
39.5%
30.3%
25.9%
30.8%
38.7%
45.6% 44.4% 42.5%
37.1%
0%
5%
10%
15%
20%
25%
30%
35%
40%
45%
50%
Jun-14 Jul-14 Aug-14 Sep-14 Oct-14 Nov-14 Dec-14 Jan-15 Feb-15 Mar-15 Apr-15 May-15 Jun-15 Source: Terradatum, July 6, 2015. Percentage of single-family homes under contract in these Silicon Valley communities:
Atherton, Los Altos (excluding County area), Los Altos Hills, Menlo Park (excluding east of U.S. 101), Palo Alto, Portola Valley, and Woodside.
Silicon Valleypacificunion.com
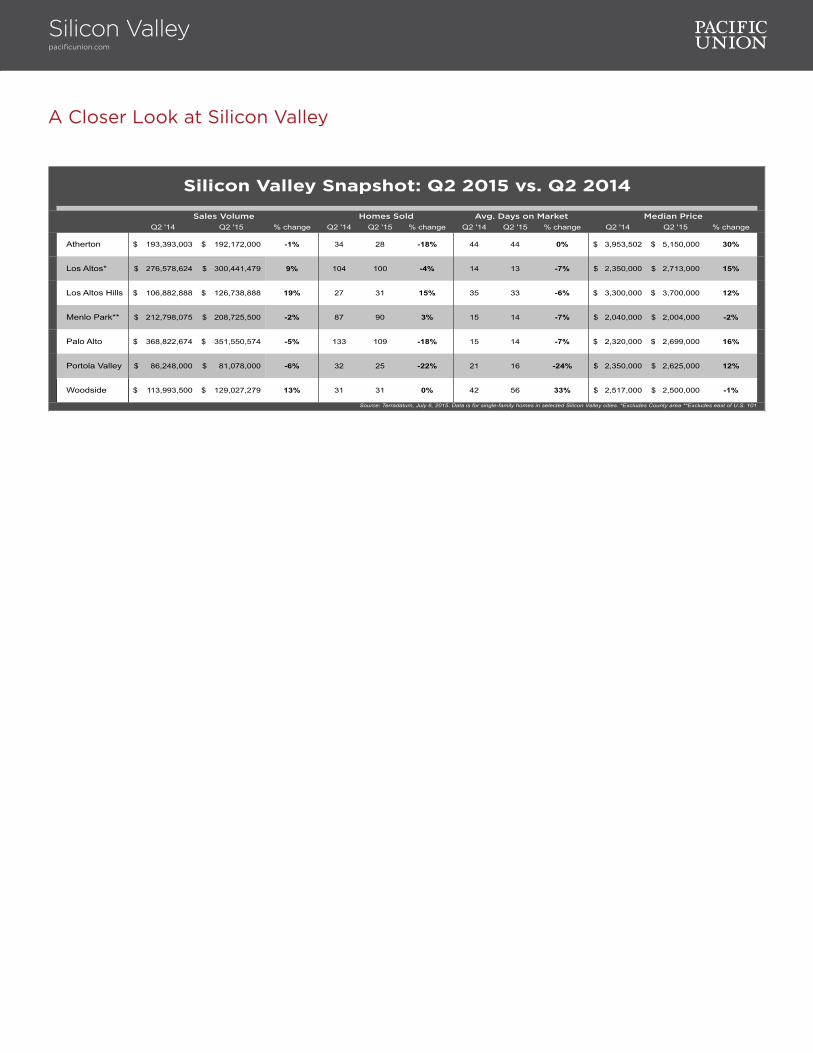
A Closer Look at Silicon Valley
Q2 '14 Q2 '15 % change Q2 '14 Q2 '15 % change Q2 '14 Q2 '15 % change Q2 '14 Q2 '15 % change
Atherton 193,393,003$ 192,172,000$ -1% 34 28 -18% 44 44 0% 3,953,502$ 5,150,000$ 30%
Los Altos* 276,578,624$ 300,441,479$ 9% 104 100 -4% 14 13 -7% 2,350,000$ 2,713,000$ 15%
Los Altos Hills 106,882,888$ 126,738,888$ 19% 27 31 15% 35 33 -6% 3,300,000$ 3,700,000$ 12%
Menlo Park** 212,798,075$ 208,725,500$ -2% 87 90 3% 15 14 -7% 2,040,000$ 2,004,000$ -2%
Palo Alto 368,822,674$ 351,550,574$ -5% 133 109 -18% 15 14 -7% 2,320,000$ 2,699,000$ 16%
Portola Valley 86,248,000$ 81,078,000$ -6% 32 25 -22% 21 16 -24% 2,350,000$ 2,625,000$ 12%
Woodside 113,993,500$ 129,027,279$ 13% 31 31 0% 42 56 33% 2,517,000$ 2,500,000$ -1%
Source: Terradatum, July 6, 2015. Data is for single-family homes in selected Silicon Valley cities. *Excludes County area **Excludes east of U.S. 101
Silicon Valley Snapshot: Q2 2015 vs. Q2 2014
Sales Volume Homes Sold Avg. Days on Market Median Price
Mid-Peninsulapacificunion.com
Median Sales Price
$1,436,500 $1,341,000 $1,328,000
$1,350,000 $1,307,500 $1,350,000
$1,462,500
$1,675,700 $1,490,000
$1,590,000 $1,688,000
$1,400,000
$1,600,000
$100,000
$300,000
$500,000
$700,000
$900,000
$1,100,000
$1,300,000
$1,500,000
$1,700,000
$1,900,000
Jun-14 Jul-14 Aug-14 Sep-14 Oct-14 Nov-14 Dec-14 Jan-15 Feb-15 Mar-15 Apr-15 May-15 Jun-15 Source: Terradatum, July 6, 2015. Median sales price for single-family homes in these San Mateo County communities:
Burlingame (excluding Ingold Millsdale Industrial Center), Hillsborough, and San Mateo (excluding the North Shoreview/Dore Cavanaugh area).
Average Days on the Market
16
33
26 28
30
25 28
47
32
21 21
14
20
0
5
10
15
20
25
30
35
40
45
50
Jun-14 Jul-14 Aug-14 Sep-14 Oct-14 Nov-14 Dec-14 Jan-15 Feb-15 Mar-15 Apr-15 May-15 Jun-15 Source: Terradatum, July 6, 2015. Average days on market for single-family homes sold in these San Mateo County communities:
Burlingame (excluding Ingold Millsdale Industrial Center), Hillsborough, and San Mateo (excluding the North Shoreview/Dore Cavanaugh area).
Months’ Supply of Inventory
1.4 1.5
1.2
1.4
1.0
1.3
0.7
2.2
1.9
0.9 1.1
0.9 0.7
0.1
0.6
1.1
1.6
2.1
2.6
Jun-14 Jul-14 Aug-14 Sep-14 Oct-14 Nov-14 Dec-14 Jan-15 Feb-15 Mar-15 Apr-15 May-15 Jun-15 Source: Terradatum, July 6, 2015. Months' supply of inventory for single-family homes in these San Mateo County communities:
Burlingame (excluding Ingold Millsdale Industrial Center), Hillsborough, and San Mateo (excluding the North Shoreview/Dore Cavanaugh area).
Mid-Peninsulapacificunion.com
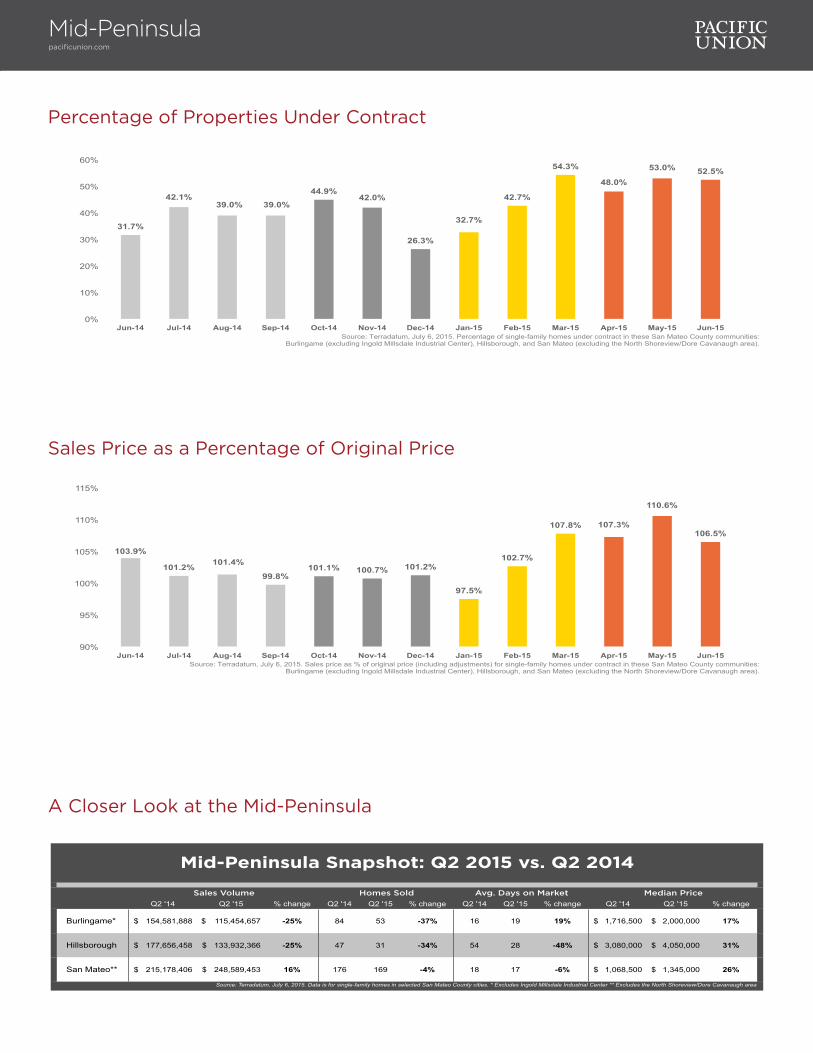
Percentage of Properties Under Contract
31.7%
42.1% 39.0% 39.0%
44.9% 42.0%
26.3%
32.7%
42.7%
54.3%
48.0%
53.0% 52.5%
0%
10%
20%
30%
40%
50%
60%
Jun-14 Jul-14 Aug-14 Sep-14 Oct-14 Nov-14 Dec-14 Jan-15 Feb-15 Mar-15 Apr-15 May-15 Jun-15 Source: Terradatum, July 6, 2015. Percentage of single-family homes under contract in these San Mateo County communities:
Burlingame (excluding Ingold Millsdale Industrial Center), Hillsborough, and San Mateo (excluding the North Shoreview/Dore Cavanaugh area).
A Closer Look at the Mid-Peninsula
Q2 '14 Q2 '15 % change Q2 '14 Q2 '15 % change Q2 '14 Q2 '15 % change Q2 '14 Q2 '15 % change
Burlingame* 154,581,888$ 115,454,657$ -25% 84 53 -37% 16 19 19% 1,716,500$ 2,000,000$ 17%
Hillsborough 177,656,458$ 133,932,366$ -25% 47 31 -34% 54 28 -48% 3,080,000$ 4,050,000$ 31%
San Mateo** 215,178,406$ 248,589,453$ 16% 176 169 -4% 18 17 -6% 1,068,500$ 1,345,000$ 26%
Source: Terradatum, July 6, 2015. Data is for single-family homes in selected San Mateo County cities. * Excludes Ingold Millsdale Industrial Center ** Excludes the North Shoreview/Dore Cavanaugh area
Mid-Peninsula Snapshot: Q2 2015 vs. Q2 2014
Sales Volume Homes Sold Avg. Days on Market Median Price
Sales Price as a Percentage of Original Price
103.9%
101.2% 101.4%
99.8% 101.1% 100.7% 101.2%
97.5%
102.7%
107.8% 107.3%
110.6%
106.5%
90%
95%
100%
105%
110%
115%
Jun-14 Jul-14 Aug-14 Sep-14 Oct-14 Nov-14 Dec-14 Jan-15 Feb-15 Mar-15 Apr-15 May-15 Jun-15 Source: Terradatum, July 6, 2015. Sales price as % of original price (including adjustments) for single-family homes under contract in these San Mateo County communities:
Burlingame (excluding Ingold Millsdale Industrial Center), Hillsborough, and San Mateo (excluding the North Shoreview/Dore Cavanaugh area).

Rick LawsSenior Vice President, Sonoma [email protected] Mendocino Avenue, Suite 210 | Santa Rosa, CA 95403
Sonoma CountyQuarterly Real Estate ReportQ2 2015

Sonoma County: Q2 ResultsAfter a slow first quarter, home sales picked up in Pacific Union’s Sonoma County region during the second quarter. The number of available homes rose above first-quarter levels but still lagged behind totals recorded one year earlier. The tight supply kept buyers scrambling and guaranteed multiple offers for the most attractive homes on the market, helping to drive the median sales price up moderately.
Fewer lower-priced homes were available than in past quarters: The short sales and foreclosures that dominated the market several years ago have all been sold, and price appreciation moved the market higher. Homes selling for $900,000 to $2 million had the highest increase in sales during the second quarter, while the number of homes priced below $400,000 shrunk by almost one-half.
Looking Forward: July and August typically see fewer sales, but we expect real estate activity to once again pick up by mid-September. Sellers will still have the upper hand in the third quarter, but Sonoma County will continue to move toward a more balanced market, and buyers will have increased negotiating room. Home shoppers will be plentiful, spurred by the probability of rising mortgage rates. Sellers who put their homes on the market at a fair price will likely see multiple offers and a quick sale.
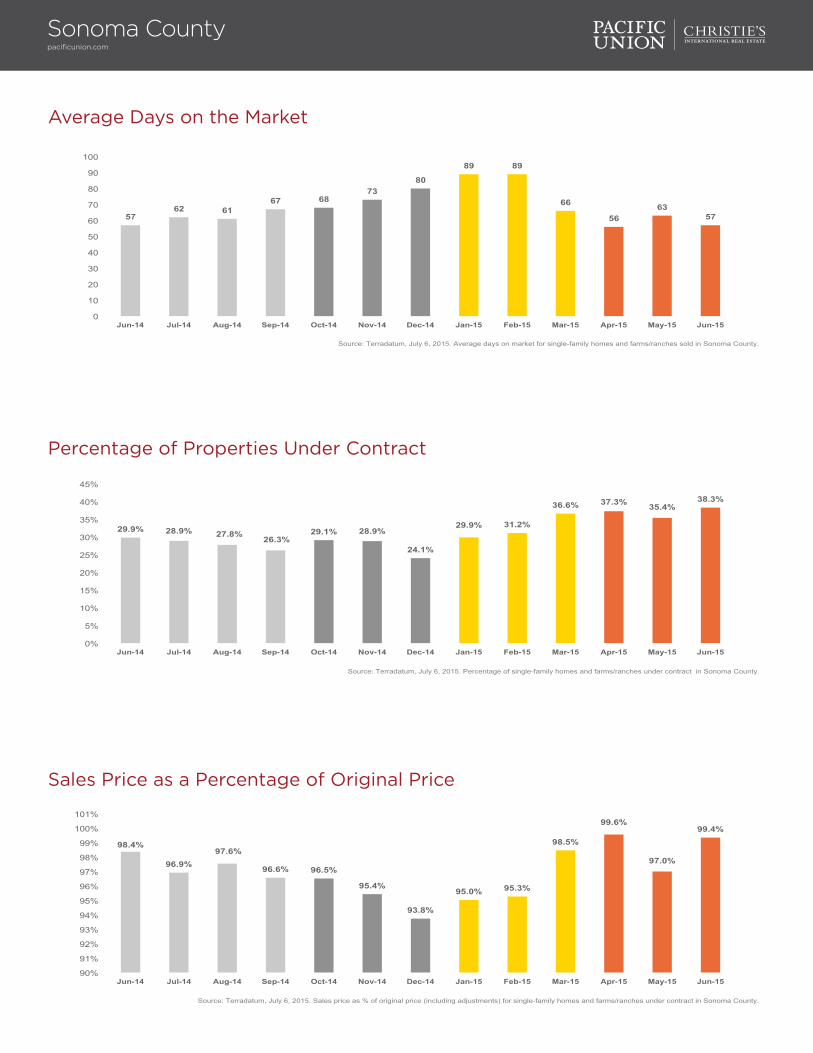
Defining Sonoma County: Our real estate markets in Sonoma County include the cities of Cotati, Healdsburg, Penngrove, Petaluma, Rohnert Park, Santa Rosa, Sebastopol, and Windsor. Sales data in the charts below includes all single-family homes and farms and ranches in Sonoma County.
Sonoma Countypacificunion.com
Median Sales Price
Months’ Supply of Inventory
$495,000 $507,000
$475,000 $496,000 $490,000 $481,250
$515,000 $479,000 $492,000 $510,000
$536,000 $545,000 $550,000
$100,000
$150,000
$200,000
$250,000
$300,000
$350,000
$400,000
$450,000
$500,000
$550,000
$600,000
Jun-14 Jul-14 Aug-14 Sep-14 Oct-14 Nov-14 Dec-14 Jan-15 Feb-15 Mar-15 Apr-15 May-15 Jun-15
Source: Terradatum, July 6, 2015. Median sales price for single-family homes and farms/ranches in Sonoma County.
2.2 2.1
2.4 2.2 2.3 2.1
1.6
2.5 2.5 2.3
1.8 1.9
1.6
0.1
0.6
1.1
1.6
2.1
2.6
3.1
Jun-14 Jul-14 Aug-14 Sep-14 Oct-14 Nov-14 Dec-14 Jan-15 Feb-15 Mar-15 Apr-15 May-15 Jun-15
Source: Terradatum, July 6, 2015. Months' supply of inventory for single-family homes and farms/ranches in Sonoma County.
Sonoma Countypacificunion.com
Average Days on the Market
57 62 61
67 68 73
80
89 89
66
56 63
57
0
10
20
30
40
50
60
70
80
90
100
Jun-14 Jul-14 Aug-14 Sep-14 Oct-14 Nov-14 Dec-14 Jan-15 Feb-15 Mar-15 Apr-15 May-15 Jun-15
Source: Terradatum, July 6, 2015. Average days on market for single-family homes and farms/ranches sold in Sonoma County.
Sales Price as a Percentage of Original Price
98.4%
96.9% 97.6%
96.6% 96.5%
95.4%
93.8%
95.0% 95.3%
98.5%
99.6%
97.0%
99.4%
90%
91%
92%
93%
94%
95%
96%
97%
98%
99%
100%
101%
Jun-14 Jul-14 Aug-14 Sep-14 Oct-14 Nov-14 Dec-14 Jan-15 Feb-15 Mar-15 Apr-15 May-15 Jun-15
Source: Terradatum, July 6, 2015. Sales price as % of original price (including adjustments) for single-family homes and farms/ranches under contract in Sonoma County.
Percentage of Properties Under Contract
29.9% 28.9% 27.8% 26.3%
29.1% 28.9%
24.1%
29.9% 31.2%
36.6% 37.3% 35.4% 38.3%
0%
5%
10%
15%
20%
25%
30%
35%
40%
45%
Jun-14 Jul-14 Aug-14 Sep-14 Oct-14 Nov-14 Dec-14 Jan-15 Feb-15 Mar-15 Apr-15 May-15 Jun-15
Source: Terradatum, July 6, 2015. Percentage of single-family homes and farms/ranches under contract in Sonoma County.
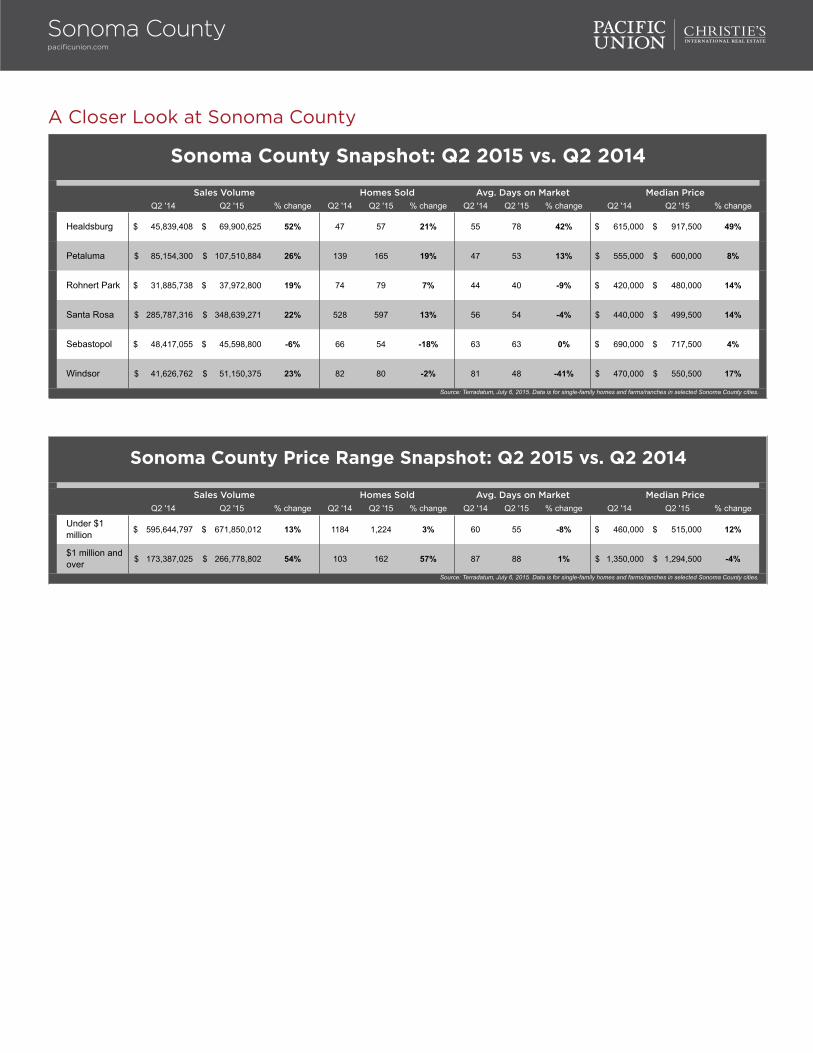
A Closer Look at Sonoma County
Q2 '14 Q2 '15 % change Q2 '14 Q2 '15 % change Q2 '14 Q2 '15 % change Q2 '14 Q2 '15 % change
Healdsburg 45,839,408$ 69,900,625$ 52% 47 57 21% 55 78 42% 615,000$ 917,500$ 49%
Petaluma 85,154,300$ 107,510,884$ 26% 139 165 19% 47 53 13% 555,000$ 600,000$ 8%
Rohnert Park 31,885,738$ 37,972,800$ 19% 74 79 7% 44 40 -9% 420,000$ 480,000$ 14%
Santa Rosa 285,787,316$ 348,639,271$ 22% 528 597 13% 56 54 -4% 440,000$ 499,500$ 14%
Sebastopol 48,417,055$ 45,598,800$ -6% 66 54 -18% 63 63 0% 690,000$ 717,500$ 4%
Windsor 41,626,762$ 51,150,375$ 23% 82 80 -2% 81 48 -41% 470,000$ 550,500$ 17%
Source: Terradatum, July 6, 2015. Data is for single-family homes and farms/ranches in selected Sonoma County cities.
Sonoma County Snapshot: Q2 2015 vs. Q2 2014
Sales Volume Homes Sold Avg. Days on Market Median Price
Q2 '14 Q2 '15 % change Q2 '14 Q2 '15 % change Q2 '14 Q2 '15 % change Q2 '14 Q2 '15 % change
Under $1 million 595,644,797$ 671,850,012$ 13% 1184 1,224 3% 60 55 -8% 460,000$ 515,000$ 12%
$1 million and over 173,387,025$ 266,778,802$ 54% 103 162 57% 87 88 1% 1,350,000$ 1,294,500$ -4%
Source: Terradatum, July 6, 2015. Data is for single-family homes and farms/ranches in selected Sonoma County cities.
Sonoma County Price Range Snapshot: Q2 2015 vs. Q2 2014
Sales Volume Homes Sold Avg. Days on Market Median Price
Sonoma Countypacificunion.com
Jill SilvasRegional Executive, Sonoma [email protected] West Napa Street, Suite 200 | Sonoma, CA 95476
Sonoma ValleyQuarterly Real Estate ReportQ2 2015
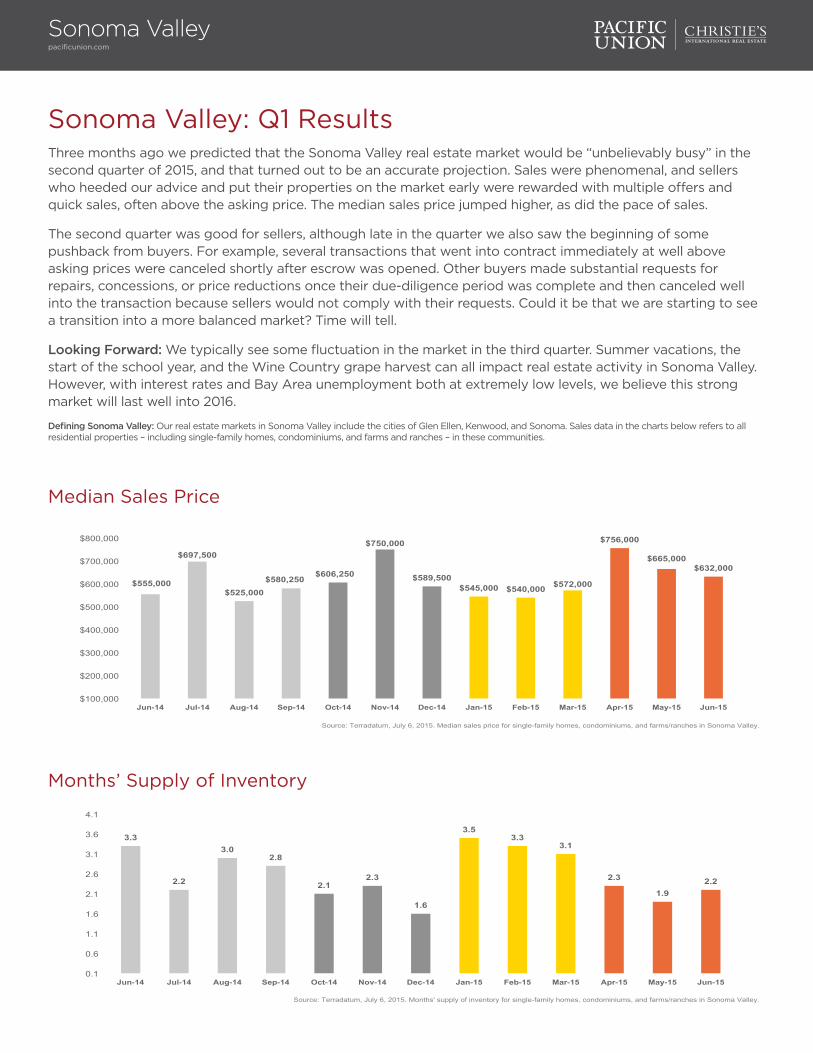
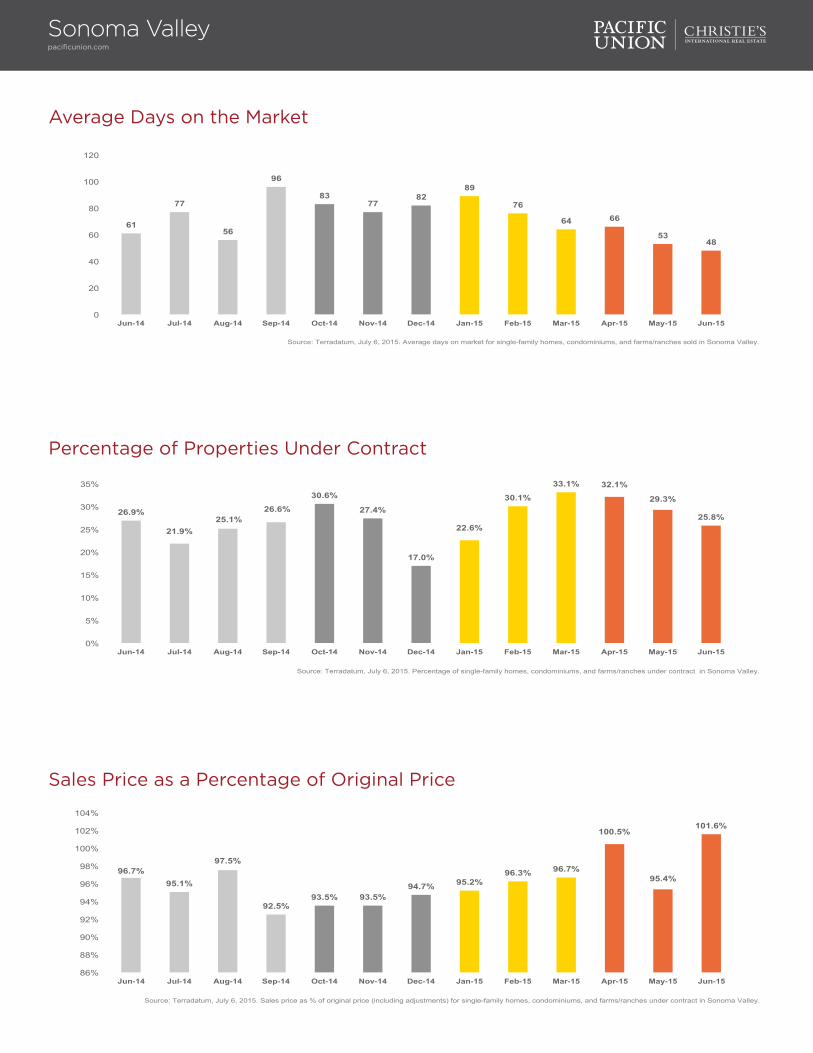
Sonoma Valley: Q1 ResultsThree months ago we predicted that the Sonoma Valley real estate market would be “unbelievably busy” in the second quarter of 2015, and that turned out to be an accurate projection. Sales were phenomenal, and sellers who heeded our advice and put their properties on the market early were rewarded with multiple offers and quick sales, often above the asking price. The median sales price jumped higher, as did the pace of sales.
The second quarter was good for sellers, although late in the quarter we also saw the beginning of some pushback from buyers. For example, several transactions that went into contract immediately at well above asking prices were canceled shortly after escrow was opened. Other buyers made substantial requests for repairs, concessions, or price reductions once their due-diligence period was complete and then canceled well into the transaction because sellers would not comply with their requests. Could it be that we are starting to see a transition into a more balanced market? Time will tell.
Looking Forward: We typically see some fluctuation in the market in the third quarter. Summer vacations, the start of the school year, and the Wine Country grape harvest can all impact real estate activity in Sonoma Valley. However, with interest rates and Bay Area unemployment both at extremely low levels, we believe this strong market will last well into 2016.
Defining Sonoma Valley: Our real estate markets in Sonoma Valley include the cities of Glen Ellen, Kenwood, and Sonoma. Sales data in the charts below refers to all residential properties – including single-family homes, condominiums, and farms and ranches – in these communities.
Sonoma Valleypacificunion.com
Median Sales Price
Months’ Supply of Inventory
$555,000
$697,500
$525,000 $580,250
$606,250
$750,000
$589,500 $545,000 $540,000 $572,000
$756,000
$665,000 $632,000
$100,000
$200,000
$300,000
$400,000
$500,000
$600,000
$700,000
$800,000
Jun-14 Jul-14 Aug-14 Sep-14 Oct-14 Nov-14 Dec-14 Jan-15 Feb-15 Mar-15 Apr-15 May-15 Jun-15
Source: Terradatum, July 6, 2015. Median sales price for single-family homes, condominiums, and farms/ranches in Sonoma Valley.
3.3
2.2
3.0 2.8
2.1 2.3
1.6
3.5 3.3
3.1
2.3
1.9 2.2
0.1
0.6
1.1
1.6
2.1
2.6
3.1
3.6
4.1
Jun-14 Jul-14 Aug-14 Sep-14 Oct-14 Nov-14 Dec-14 Jan-15 Feb-15 Mar-15 Apr-15 May-15 Jun-15
Source: Terradatum, July 6, 2015. Months' supply of inventory for single-family homes, condominiums, and farms/ranches in Sonoma Valley.
Sonoma Valleypacificunion.com
Average Days on the Market
61
77
56
96
83 77
82 89
76
64 66
53 48
0
20
40
60
80
100
120
Jun-14 Jul-14 Aug-14 Sep-14 Oct-14 Nov-14 Dec-14 Jan-15 Feb-15 Mar-15 Apr-15 May-15 Jun-15
Source: Terradatum, July 6, 2015. Average days on market for single-family homes, condominiums, and farms/ranches sold in Sonoma Valley.
Sales Price as a Percentage of Original Price
96.7% 95.1%
97.5%
92.5% 93.5% 93.5%
94.7% 95.2% 96.3% 96.7%
100.5%
95.4%
101.6%
86%
88%
90%
92%
94%
96%
98%
100%
102%
104%
Jun-14 Jul-14 Aug-14 Sep-14 Oct-14 Nov-14 Dec-14 Jan-15 Feb-15 Mar-15 Apr-15 May-15 Jun-15
Source: Terradatum, July 6, 2015. Sales price as % of original price (including adjustments) for single-family homes, condominiums, and farms/ranches under contract in Sonoma Valley.
Percentage of Properties Under Contract
26.9%
21.9% 25.1%
26.6%
30.6%
27.4%
17.0%
22.6%
30.1%
33.1% 32.1%
29.3%
25.8%
0%
5%
10%
15%
20%
25%
30%
35%
Jun-14 Jul-14 Aug-14 Sep-14 Oct-14 Nov-14 Dec-14 Jan-15 Feb-15 Mar-15 Apr-15 May-15 Jun-15
Source: Terradatum, July 6, 2015. Percentage of single-family homes, condominiums, and farms/ranches under contract in Sonoma Valley.
A Closer Look at Sonoma Valley
Q2 '14 Q2 '15 % change Q2 '14 Q2 '15 % change Q2 '14 Q2 '15 % change Q2 '14 Q2 '15 % change
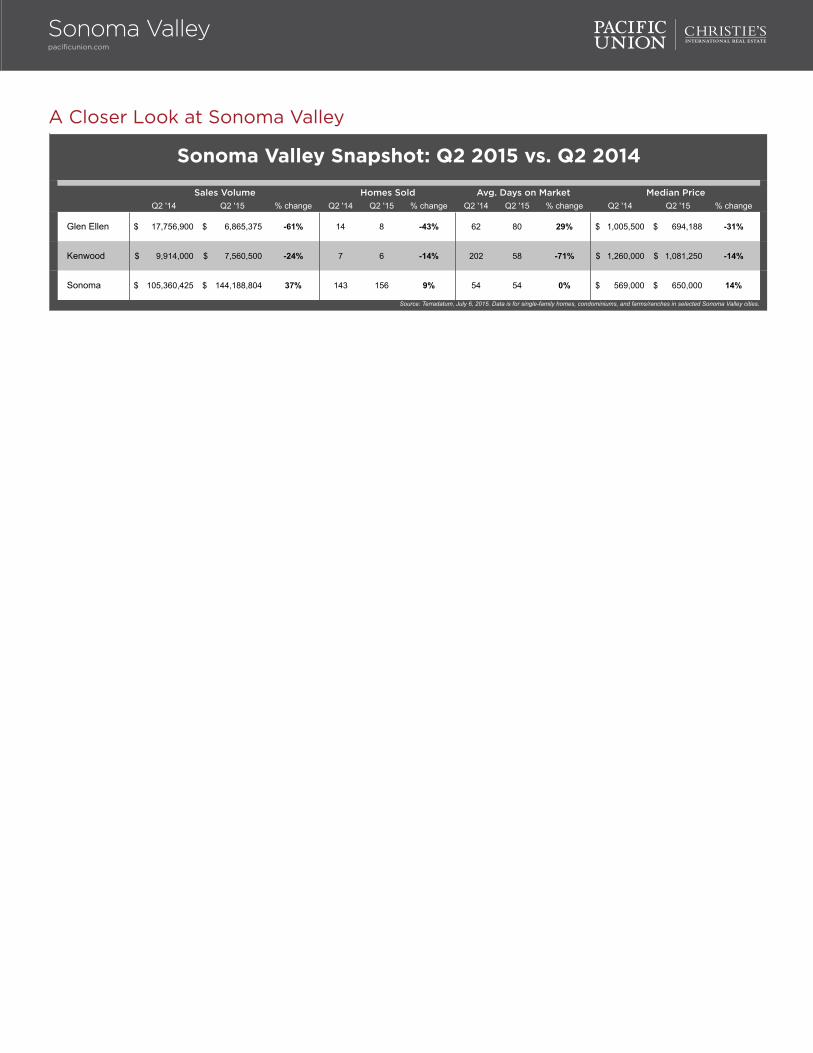
Glen Ellen 17,756,900$ 6,865,375$ -61% 14 8 -43% 62 80 29% 1,005,500$ 694,188$ -31%
Kenwood 9,914,000$ 7,560,500$ -24% 7 6 -14% 202 58 -71% 1,260,000$ 1,081,250$ -14%
Sonoma 105,360,425$ 144,188,804$ 37% 143 156 9% 54 54 0% 569,000$ 650,000$ 14%
Source: Terradatum, July 6, 2015. Data is for single-family homes, condominiums, and farms/ranches in selected Sonoma Valley cities.
Sonoma Valley Snapshot: Q2 2015 vs. Q2 2014
Sales Volume Homes Sold Avg. Days on Market Median Price
Sonoma Valleypacificunion.com

Sally GardnerRegional Executive, Tahoe/TruckeeTahoe City 530.581.1882 | Truckee 530.587.7098 | Squaw Valley [email protected]
Lake Tahoe/TruckeeQuarterly Real Estate ReportQ2 2015

Lake Tahoe/Truckee: Q2 ResultsPacific Union’s Lake Tahoe/Truckee region is mostly a vacation-home market, so it’s no surprise that sales depend heavily on tourism. And with precious little snow amid California’s drought, tourist numbers have been down significantly. The result? Sales volume in the second quarter of 2015 was down from the levels posted one year earlier.
There were several bright spots, however. Sales were brisk in communities near Lake Tahoe, and many sellers in the region were flexible in pricing and eager to make a deal. Also, construction resumed in several developments – the first major residential building activity in quite a few years outside of Martis Camp, Schaffer’s Mill, and Gray’s Crossing. By the end of the second quarter, sales started climbing again as winter activities gave way to summer in the Sierras, bringing a new round of visitors from the Bay Area and Sacramento.
Looking Forward: The summer months will be busy in beautiful Lake Tahoe/Truckee, bringing plenty of new buyers to the region. Home prices in many areas of Lake Tahoe still haven’t reached their prerecession peaks, so there will be plenty of bargains to be found. Looking to the fourth quarter and beyond, we are heartened by numerous forecasts of an El Nino winter ahead, bringing welcome snow (and tourists) to the Sierras, and plenty of rain elsewhere in the state.
Defining Lake Tahoe/Truckee: Our real estate markets in Tahoe/Truckee include the communities of Alpine Meadows, Donner Lake, Donner Summit, Lahontan, Martis Valley, North Shore Lake Tahoe, Northstar, Squaw Valley, Tahoe City, Tahoe Donner, Truckee, and the West Shore of Lake Tahoe. Sales data in the charts below includes single-family homes and condominiums in these communities.
Lake Tahoe/Truckeepacificunion.com
Single-Family Homes – Median Sales Price
Condominiums – Median Sales Price
$529,277 $595,000
$665,000
$589,000 $607,342
$740,000
$572,000
$725,000
$611,250 $650,000
$535,000 $530,500 $560,000
$100,000
$200,000
$300,000
$400,000
$500,000
$600,000
$700,000
$800,000
Jun-14 Jul-14 Aug-14 Sep-14 Oct-14 Nov-14 Dec-14 Jan-15 Feb-15 Mar-15 Apr-15 May-15 Jun-15
Source: Terradatum, July 6, 2015. Median sales price for single-family homes in the Lake Tahoe/Truckee region.
$350,000
$445,000
$345,000
$385,000
$416,000 $392,500
$370,250
$290,000
$359,500 $362,500
$281,000
$339,000
$389,000
$100,000
$150,000
$200,000
$250,000
$300,000
$350,000
$400,000
$450,000
$500,000
Jun-14 Jul-14 Aug-14 Sep-14 Oct-14 Nov-14 Dec-14 Jan-15 Feb-15 Mar-15 Apr-15 May-15 Jun-15
Source: Terradatum, July 6, 2015. Median sales price for condominiums in the Lake Tahoe/Truckee region.
Lake Tahoe/Truckeepacificunion.com
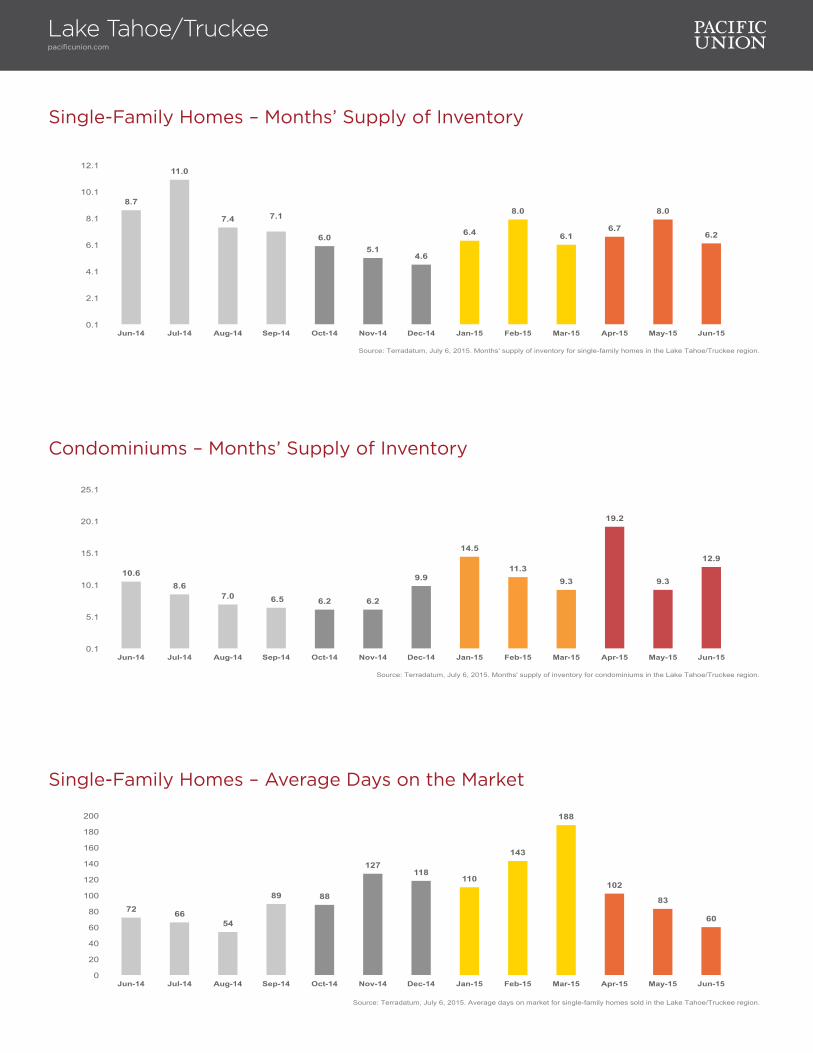
Single-Family Homes – Months’ Supply of Inventory
8.7
11.0
7.4 7.1
6.0 5.1
4.6
6.4
8.0
6.1 6.7
8.0
6.2
0.1
2.1
4.1
6.1
8.1
10.1
12.1
Jun-14 Jul-14 Aug-14 Sep-14 Oct-14 Nov-14 Dec-14 Jan-15 Feb-15 Mar-15 Apr-15 May-15 Jun-15
Source: Terradatum, July 6, 2015. Months' supply of inventory for single-family homes in the Lake Tahoe/Truckee region.
Single-Family Homes – Average Days on the Market
72 66 54
89 88
127 118
110
143
188
102
83
60
0
20
40
60
80
100
120
140
160
180
200
Jun-14 Jul-14 Aug-14 Sep-14 Oct-14 Nov-14 Dec-14 Jan-15 Feb-15 Mar-15 Apr-15 May-15 Jun-15
Source: Terradatum, July 6, 2015. Average days on market for single-family homes sold in the Lake Tahoe/Truckee region.
Condominiums – Months’ Supply of Inventory
10.6 8.6
7.0 6.5 6.2 6.2
9.9
14.5
11.3 9.3
19.2
9.3
12.9
0.1
5.1
10.1
15.1
20.1
25.1
Jun-14 Jul-14 Aug-14 Sep-14 Oct-14 Nov-14 Dec-14 Jan-15 Feb-15 Mar-15 Apr-15 May-15 Jun-15
Source: Terradatum, July 6, 2015. Months' supply of inventory for condominiums in the Lake Tahoe/Truckee region.
Lake Tahoe/Truckeepacificunion.com
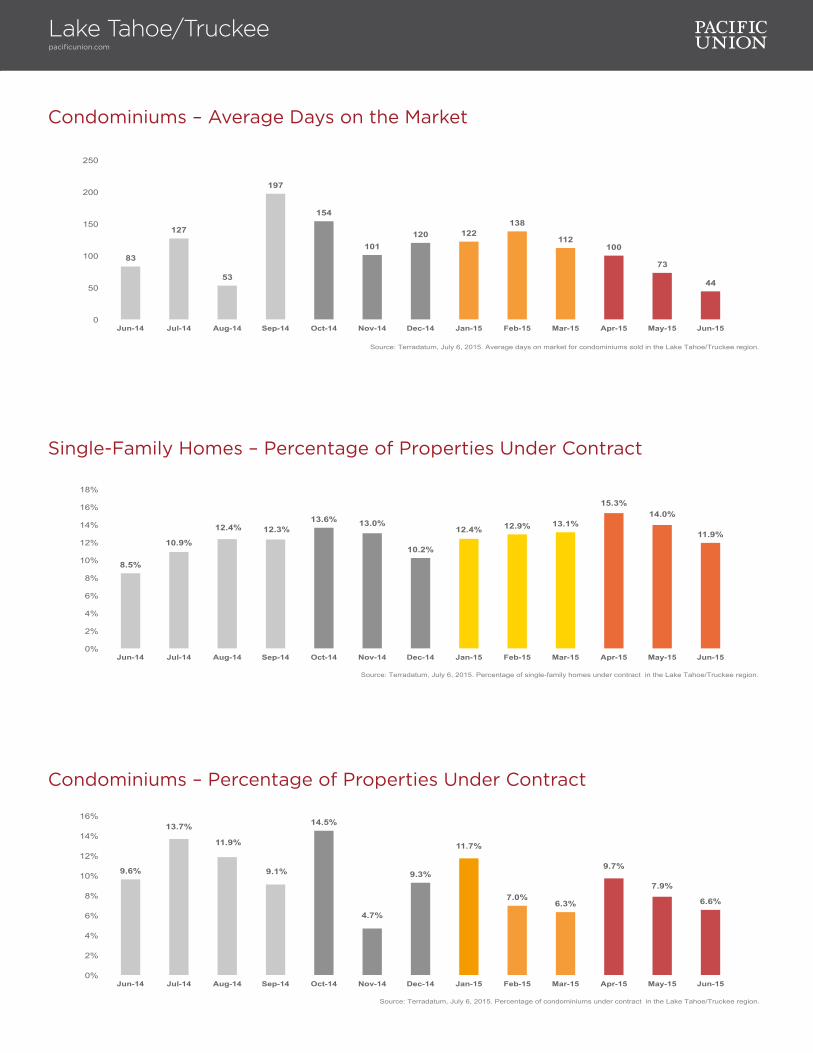
Condominiums – Average Days on the Market
83
127
53
197
154
101 120 122
138
112 100
73
44
0
50
100
150
200
250
Jun-14 Jul-14 Aug-14 Sep-14 Oct-14 Nov-14 Dec-14 Jan-15 Feb-15 Mar-15 Apr-15 May-15 Jun-15
Source: Terradatum, July 6, 2015. Average days on market for condominiums sold in the Lake Tahoe/Truckee region.
Condominiums – Percentage of Properties Under Contract
9.6%
13.7%
11.9%
9.1%
14.5%
4.7%
9.3%
11.7%
7.0% 6.3%
9.7%
7.9%
6.6%
0%
2%
4%
6%
8%
10%
12%
14%
16%
Jun-14 Jul-14 Aug-14 Sep-14 Oct-14 Nov-14 Dec-14 Jan-15 Feb-15 Mar-15 Apr-15 May-15 Jun-15
Source: Terradatum, July 6, 2015. Percentage of condominiums under contract in the Lake Tahoe/Truckee region.
Single-Family Homes – Percentage of Properties Under Contract
8.5%
10.9%
12.4% 12.3% 13.6% 13.0%
10.2%
12.4% 12.9% 13.1%
15.3% 14.0%
11.9%
0%
2%
4%
6%
8%
10%
12%
14%
16%
18%
Jun-14 Jul-14 Aug-14 Sep-14 Oct-14 Nov-14 Dec-14 Jan-15 Feb-15 Mar-15 Apr-15 May-15 Jun-15
Source: Terradatum, July 6, 2015. Percentage of single-family homes under contract in the Lake Tahoe/Truckee region.
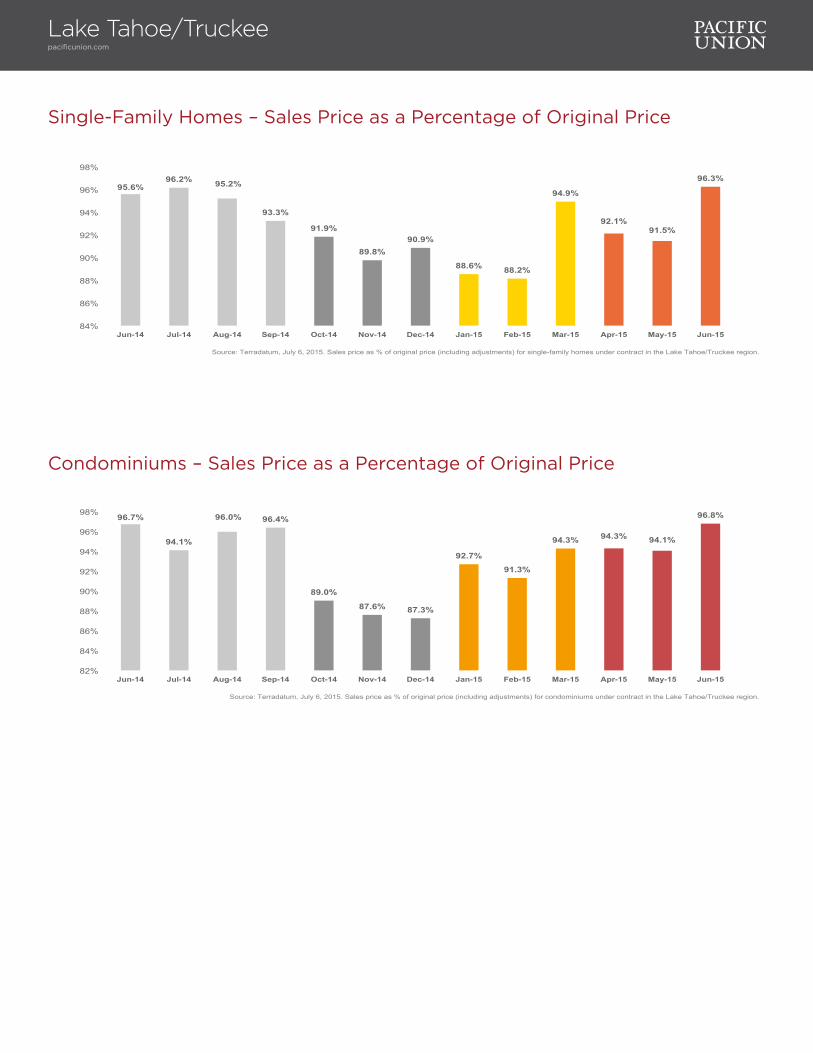
Single-Family Homes – Sales Price as a Percentage of Original Price
95.6% 96.2% 95.2%
93.3%
91.9%
89.8% 90.9%
88.6% 88.2%
94.9%
92.1% 91.5%
96.3%
84%
86%
88%
90%
92%
94%
96%
98%
Jun-14 Jul-14 Aug-14 Sep-14 Oct-14 Nov-14 Dec-14 Jan-15 Feb-15 Mar-15 Apr-15 May-15 Jun-15
Source: Terradatum, July 6, 2015. Sales price as % of original price (including adjustments) for single-family homes under contract in the Lake Tahoe/Truckee region.
Condominiums – Sales Price as a Percentage of Original Price
96.7%
94.1%
96.0% 96.4%
89.0%
87.6% 87.3%
92.7%
91.3%
94.3% 94.3% 94.1%
96.8%
82%
84%
86%
88%
90%
92%
94%
96%
98%
Jun-14 Jul-14 Aug-14 Sep-14 Oct-14 Nov-14 Dec-14 Jan-15 Feb-15 Mar-15 Apr-15 May-15 Jun-15
Source: Terradatum, July 6, 2015. Sales price as % of original price (including adjustments) for condominiums under contract in the Lake Tahoe/Truckee region.
Lake Tahoe/Truckeepacificunion.com

A Closer Look at Lake Tahoe/Truckee
Q2 '14 Q2 '15 % change Q2 '14 Q2 '15 % change Q2 '14 Q2 '15 % change Q2 '14 Q2 '15 % change
Alpine Meadows 4,270,000$ 2,682,600$ -37% 5 4 -20% 127 48 -62% 545,000$ 673,800$ 24%
Donner Lake 10,821,000$ 5,647,180$ -48% 14 8 -43% 100 154 54% 532,500$ 562,500$ 6%
Donner Summit 6,396,300$ 5,753,625$ -10% 10 12 20% 118 98 -17% 542,500$ 457,000$ -16%
Martis Valley 48,118,709$ 22,662,000$ -53% 25 22 -12% 122 53 -57% 1,735,000$ 492,000$ -72%
North Lake Tahoe 42,773,450$ 44,563,612$ 4% 55 60 9% 94 111 18% 515,000$ 560,000$ 9%
Northstar 5,869,000$ 4,727,500$ -19% 6 6 0% 376 167 -56% 839,500$ 745,000$ -11%
Squaw Valley 8,288,000$ 2,219,000$ -73% 4 3 -25% 35 214 511% 2,026,500$ 680,000$ -66%
Tahoe City 14,453,700$ 13,294,500$ -8% 16 17 6% 103 38 -63% 552,750$ 675,000$ 22%
Tahoe Donner 32,865,350$ 31,943,300$ -3% 51 51 0% 27 55 104% 595,000$ 555,000$ -7%
Truckee 59,333,922$ 37,732,051$ -36% 48 51 6% 77 52 -32% 524,639$ 477,000$ -9%
West Shore 36,194,426$ 14,794,000$ -59% 38 22 -42% 146 103 -29% 508,250$ 567,500$ 12%
Source: Terradatum, July 6, 2015. Data is for single-family homes in the Lake Tahoe/Truckee region.
Lake Tahoe/Truckee Snapshot: SFH, Q2 2015 vs. Q2 2014
Sales Volume Homes Sold Avg. Days on Market Median Price
Q2 '14 Q2 '15 % change Q2 '14 Q2 '15 % change Q2 '14 Q2 '15 % change Q2 '14 Q2 '15 % change
Alpine Meadows 1,009,000$ 595,000$ -41% 3 2 -33% 46 115 150% 334,000$ 297,500$ -11%
Donner Lake 55,000$ -$ n/a 1 0 n/a 76 0 n/a 55,000$ -$ n/a
Donner Summit 115,000$ -$ n/a 1 0 n/a 274 0 n/a 115,000$ -$ n/a
North Lake Tahoe 9,257,969$ 7,828,425$ -15% 21 14 -33% 88 44 -50% 350,000$ 309,500$ -12%
Northstar 6,512,340$ 4,387,250$ -33% 13 11 -15% 50 63 26% 350,000$ 325,000$ -7%
Squaw Valley 4,927,000$ 1,815,000$ -63% 8 4 -50% 224 249 11% 611,500$ 290,000$ -53%
Tahoe City 3,150,100$ 5,685,425$ 80% 7 8 14% 51 49 -4% 393,000$ 349,500$ -11%
Tahoe Donner 3,792,970$ 2,525,000$ -33% 15 9 -40% 53 50 -6% 256,000$ 292,000$ 14%
Truckee 3,863,000$ 6,027,808$ 56% 8 11 38% 99 78 -21% 439,500$ 499,000$ 14%
West Shore -$ -$ n/a 0 0 n/a 0 0 n/a -$ -$ n/a
Lake Tahoe/Truckee Snapshot: Condos, Q2 2015 vs. Q2 2014
Source: Terradatum, July 6, 2015. Data is for condominiums in the Lake Tahoe/Truckee region.
Sales Volume Homes Sold Avg. Days on Market Median Price
Lake Tahoe/Truckeepacificunion.com
