pacific islands - world banksiteresources.worldbank.org/.../wdr09-pacific-islands-booklet.pdf ·...
TRANSCRIPT
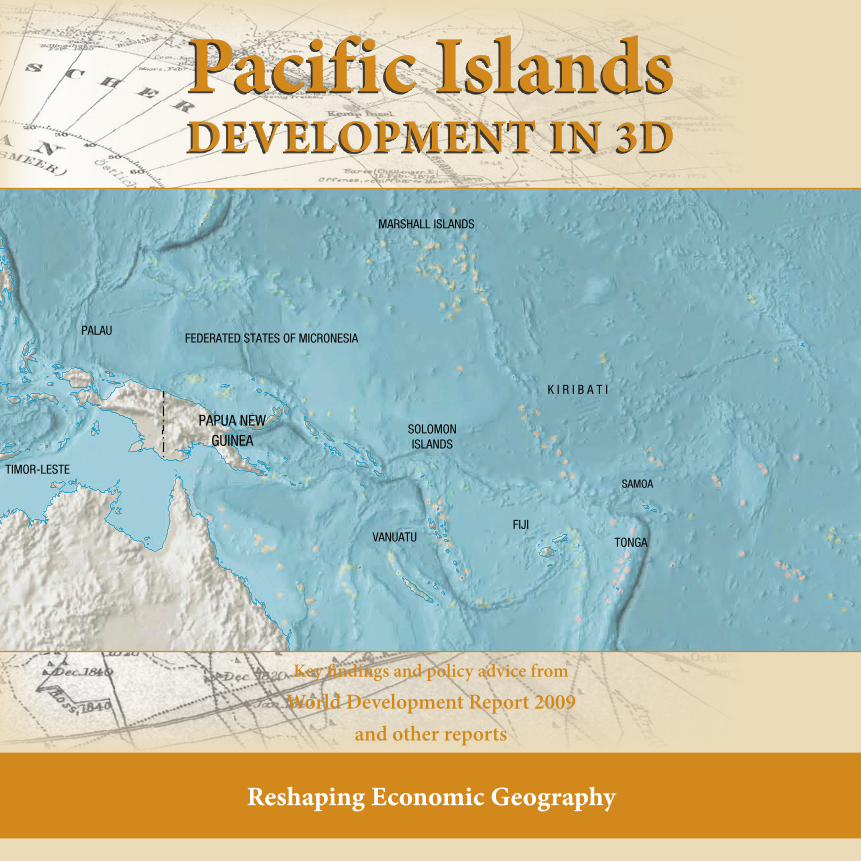
Reshaping Economic Geography
PAPUA NEWGUINEA
TIMOR-LESTE
MARSHALL ISLANDS
SOLOMONISLANDS
K I R I B A T I
SAMOA
VANUATUFIJI
TONGA
PALAU
NEWZEALAND
FEDERATED STATES OF MICRONESIA
AUGUST 2008
IBRD 36454
Pacific IslandsDeveloPment In 3D
Key findings and policy advice from
World Development Report 2009and other reports
© 2009 The International Bank for Reconstruction and Development / The World Bank 1818 H Street NW Washington DC 20433 Telephone: 202-473-1000 Internet: www.worldbank.org E-mail: [email protected]
This booklet is a product of the staff of the International Bank for Reconstruction and Development / The World Bank. It draws on World Development Report 2009: Reshaping Economic Geography, and “Pacific Islands — At Home & Away: Expanding Job Opportunities for Pacific Islanders Through Labor Mobility,” 2006 which were prepared by the staff of the World Bank. The findings, interpretations, and conclusions expressed in these pages do not necessarily reflect the views of the Executive Directors of The World Bank or the governments they represent.
AcknowledgmentsThis booklet was edited by Kavita Watsa and designed and desktopped by Roula Yazigi of the World Bank’s Development Economics Vice Presidency, under the supervision of Indermit S. Gill, Director, World Development Report 2009: Reshaping Economic Geography.
Photos© Leaf / Dreamstime.com (A traditional mountain village in Papua New Guinea), © Aleta Moriarty / World Bank (houses on stilts, Solomon Islands), © Aleta Moriarty / World Bank (girl selling fruit in the market, Solomon Islands), © Alex Baluyut / World Bank (Children studying at a Salesian run private school, Timor-Leste), © Alex Baluyut / World Bank (Children sit for a moment while playing in ruined houses in Dili, Timor-Leste).
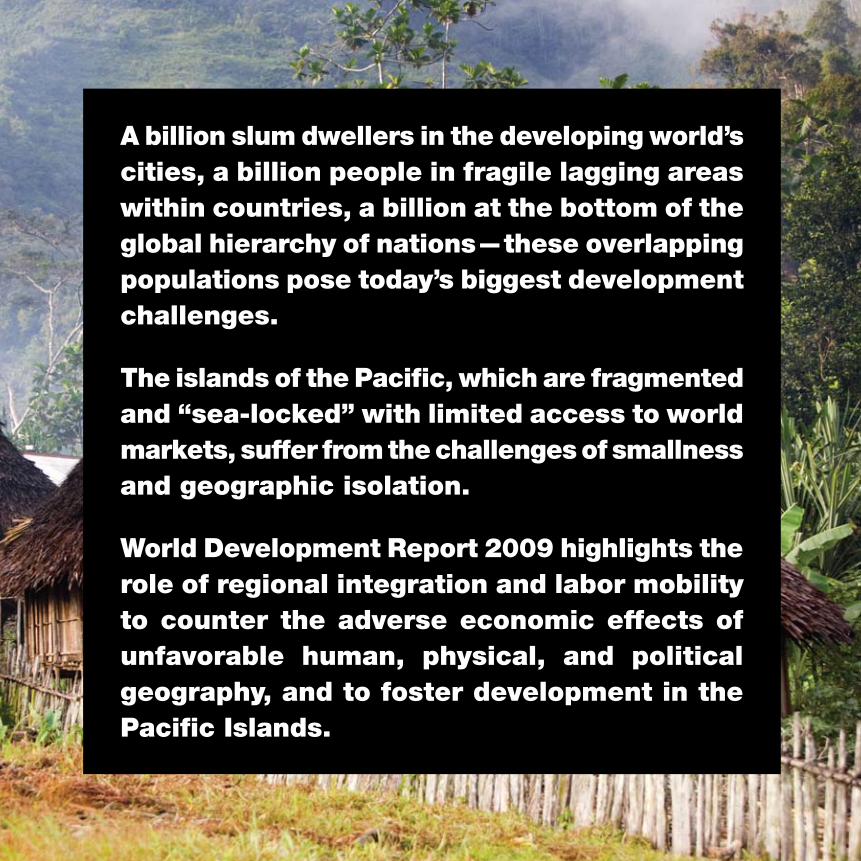
A billion slum dwellers in the developing world’s cities, a billion people in fragile lagging areas within countries, a billion at the bottom of the global hierarchy of nations — these overlapping populations pose today’s biggest development challenges.
The islands of the Pacific, which are fragmented and “sea-locked” with limited access to world markets, suffer from the challenges of smallness and geographic isolation.
World Development Report 2009 highlights the role of regional integration and labor mobility to counter the adverse economic effects of unfavorable human, physical, and political geography, and to foster development in the Pacific Islands.
2
The small and remote Pacific Islands belong to a larger group of countries that the economist Paul Collier called “the bottom billion” in 2007. This group — which
also includes Central Africa, Central Asia and Caucasus, East Africa, and West Africa — has fallen behind in the global hier-archy of nations as countries are often trapped in conflict, suffer from a natural resources curse, are small with poor governance, and are landlocked with bad neighbors or oth-erwise isolated from the rest of the world. Collectively, they pose one of the most urgent and daunting development chal-lenges of our time.
The Pacific challenge
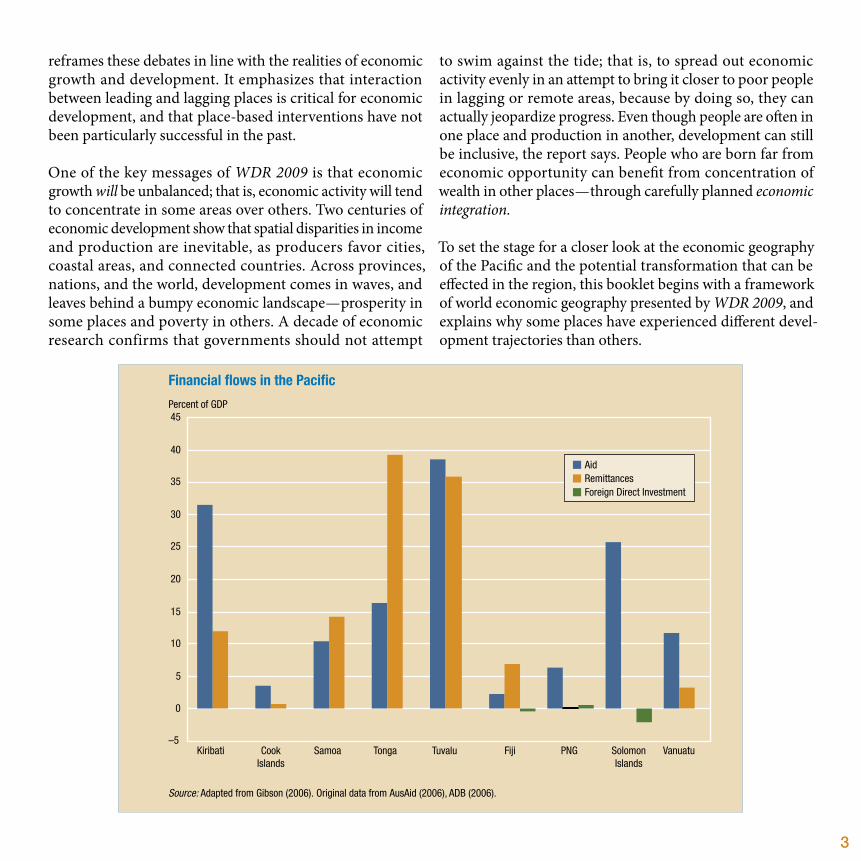
Being geographically fragmented and “sea-locked,” the Pacific Island nations have long been distanced from world markets, and heavily reliant on foreign aid for their development. In fact, they are among the most aid-dependent countries in the world, with aid per capita ranging from about $69 in Fiji to $1,108 in Palau in 2007.
Yet development results have not matched up, while the strong economic growth that is essential for prosperity remains elu-sive in many of these economies. Unfortunately, studies have shown that there is likely to be a permanent wedge between the cost of production in the Pacific and the world price in both manufacturing and services, making it difficult for the islands to compete in all but a few niche markets.
In analyzing this long-standing problem, perhaps one of the most important factors to consider is that the Pacific Islands are unique in their remoteness. The islands rank 207 out of 218 countries on population and income weighted distance measures. The average Pacific Island is the 197th most remote country out of this group, while the average Caribbean island country is only the 100th most remote (Gibson, 2006).
As this policy booklet will explain, economic geography mat-ters for development, and “reshaping” it to overcome the
disadvantages of location is critical for long-term growth and poverty reduction. New development thinking in the twenty-first century outlines potential solutions for small and remote countries seeking to improve their development results and break out of the bottom billion.
New development thinking
In December 2008, Paul Krugman received the Nobel Prize for economics for his work on the role of geography in influ-encing a country’s economic growth. His work explained the effects of free trade and globalization, and the driving forces behind worldwide urbanization. At the same time, the World Bank published World Development Report (WDR) 2009: Reshaping Economic Geography, which demonstrates the usefulness of these ideas for policymakers in different contexts.
Across the world, policy debates on urbanization, area devel-opment, and globalization have tended to overemphasize the role of geographic targeting — what to do in rural areas or slums, what to do in lagging states or remote areas, and what to do in the poorest and most isolated countries. WDR 2009
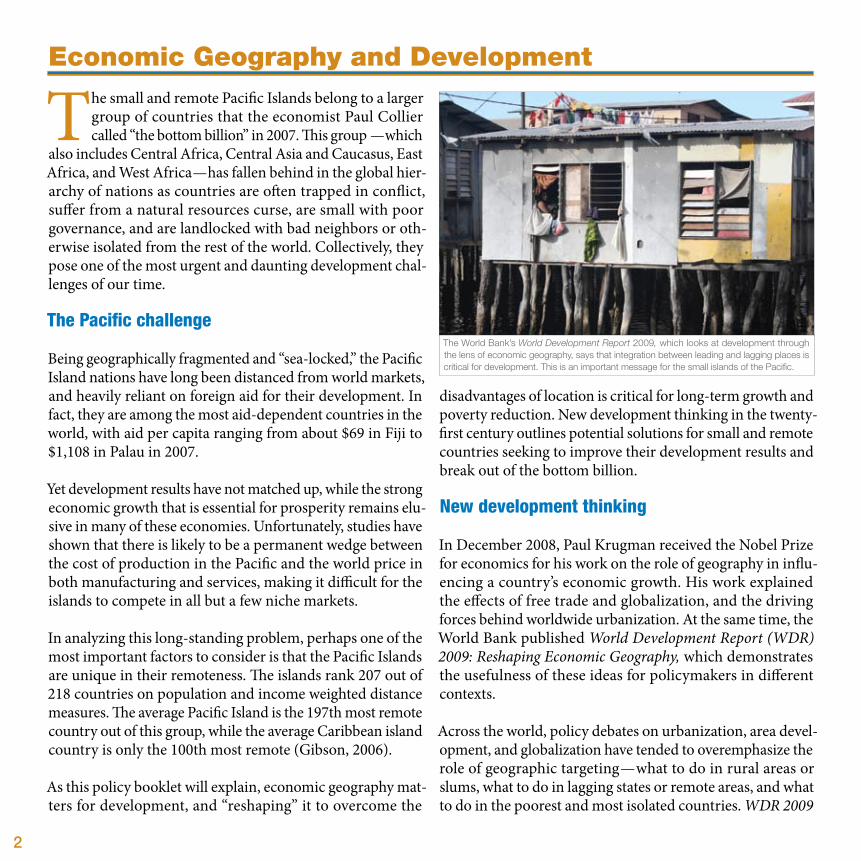
Economic Geography and Development
The World Bank’s World Development Report 2009, which looks at development through the lens of economic geography, says that integration between leading and lagging places is critical for development. This is an important message for the small islands of the Pacific.
3
reframes these debates in line with the realities of economic growth and development. It emphasizes that interaction between leading and lagging places is critical for economic development, and that place-based interventions have not been particularly successful in the past.
One of the key messages of WDR 2009 is that economic growth will be unbalanced; that is, economic activity will tend to concentrate in some areas over others. Two centuries of economic development show that spatial disparities in income and production are inevitable, as producers favor cities, coastal areas, and connected countries. Across provinces, nations, and the world, development comes in waves, and leaves behind a bumpy economic landscape — prosperity in some places and poverty in others. A decade of economic research confirms that governments should not attempt
to swim against the tide; that is, to spread out economic activity evenly in an attempt to bring it closer to poor people in lagging or remote areas, because by doing so, they can actually jeopardize progress. Even though people are often in one place and production in another, development can still be inclusive, the report says. People who are born far from economic opportunity can benefit from concentration of wealth in other places — through carefully planned economic integration.
To set the stage for a closer look at the economic geography of the Pacific and the potential transformation that can be effected in the region, this booklet begins with a framework of world economic geography presented by WDR 2009, and explains why some places have experienced different devel-opment trajectories than others.
Financial flows in the Pacific
Source: Adapted from Gibson (2006). Original data from AusAid (2006), ADB (2006).
Kiribati
45
40
35
30
25
15
10
–5
5
0
20
Percent of GDP
Samoa Tonga Tuvalu Fiji PNG VanuatuSolomonIslands
CookIslands
Foreign Direct InvestmentRemittancesAid
4
Production tends to concentrate in big cities, leading provinces, and wealthy nations. Half of the world’s production fits onto just 1.5 percent of its land. North
America, the European Union, and Japan — with fewer than a billion people — account for three-quarters of the world’s wealth.
Across the world, growing cities, more mobile people, and more specialized products have been integral to develop-ment, most noticeably in North America, Western Europe, and Northeast Asia. Countries in East and South Asia and Eastern Europe are now experiencing similar changes.
WDR 2009 uses three dimensions of economic geography — density, distance, and division — to describe the transformation of economies as they develop, and the conditions to keep in mind when formulating policies.
The examples below, of Tokyo, the United States, and Western Europe, three of the most prosperous places in the world, illustrate how transformations have occurred along these three dimensions, but not without a measure of sacrifice.
While it is useful to examine how these dimensions play out in different contexts, policies need to be refined to match the unique features of smaller, more remote economies. Integration is hardest in countries in regions that are divided, distant from world markets, and lack the economic density pro-vided by a large local economy, the report says.
For countries such as these, including the small islands of the Pacific, which are poor and isolated from world markets, WDR 2009 discusses promis-ing approaches to regional integration that combine institutional cooperation to make borders thin-ner, shared infrastructure that connects countries,
and special incentives such as preferential access to world markets.
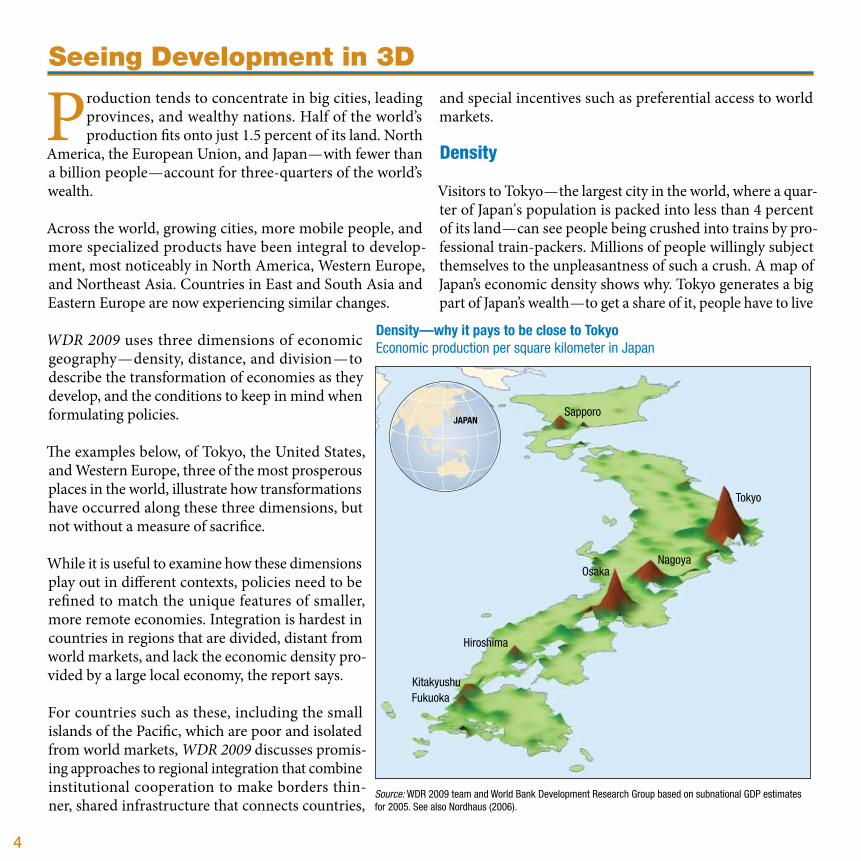
Density
Visitors to Tokyo — the largest city in the world, where a quar-ter of Japan's population is packed into less than 4 percent of its land — can see people being crushed into trains by pro-fessional train-packers. Millions of people willingly subject themselves to the unpleasantness of such a crush. A map of Japan’s economic density shows why. Tokyo generates a big part of Japan’s wealth — to get a share of it, people have to live
Seeing Development in 3D
Sapporo
Tokyo
NagoyaOsaka
Hiroshima
KitakyushuFukuoka
JAPAN
Density—why it pays to be close to TokyoEconomic production per square kilometer in Japan
Source: WDR 2009 team and World Bank Development Research Group based on subnational GDP estimates for 2005. See also Nordhaus (2006).
5
close by. Unlike in the Pacific Islands, where there is low eco-nomic density, the most striking feature of the map on the left is the concentration of wealth in Tokyo and Osaka.
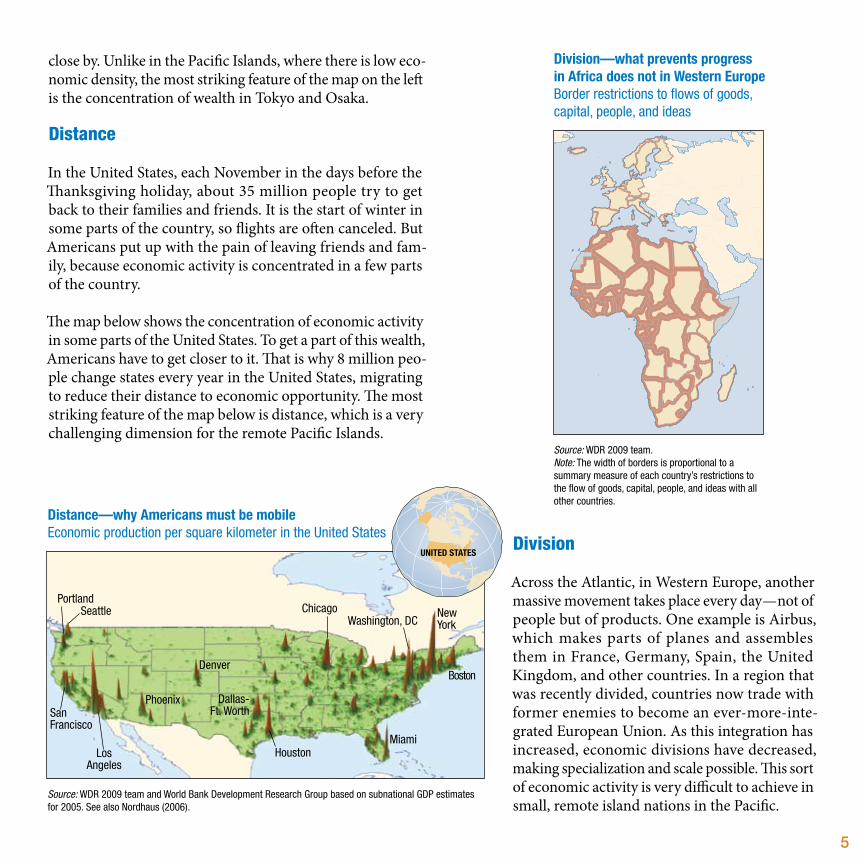
Distance
In the United States, each November in the days before the Thanksgiving holiday, about 35 million people try to get back to their families and friends. It is the start of winter in some parts of the country, so flights are often canceled. But Americans put up with the pain of leaving friends and fam-ily, because economic activity is concentrated in a few parts of the country.
The map below shows the concentration of economic activity in some parts of the United States. To get a part of this wealth, Americans have to get closer to it. That is why 8 million peo-ple change states every year in the United States, migrating to reduce their distance to economic opportunity. The most striking feature of the map below is distance, which is a very challenging dimension for the remote Pacific Islands.
Division
Across the Atlantic, in Western Europe, another massive movement takes place every day — not of people but of products. One example is Airbus, which makes parts of planes and assembles them in France, Germany, Spain, the United Kingdom, and other countries. In a region that was recently divided, countries now trade with former enemies to become an ever-more-inte-grated European Union. As this integration has increased, economic divisions have decreased, making specialization and scale possible. This sort of economic activity is very difficult to achieve in small, remote island nations in the Pacific.
LosAngeles
SanFrancisco
SeattlePortland
Phoenix
Denver
HoustonMiami
Dallas-Ft. Worth
Chicago
Boston
NewYorkWashington, DC
Source: WDR 2009 team and World Bank Development Research Group based on subnational GDP estimates for 2005. See also Nordhaus (2006).
UNITED STATES
Distance—why Americans must be mobileEconomic production per square kilometer in the United States
Division—what prevents progressin Africa does not in Western EuropeBorder restrictions to flows of goods, capital, people, and ideas
Source: WDR 2009 team. Note: The width of borders is proportional to a summary measure of each country’s restrictions to the flow of goods, capital, people, and ideas with all other countries.

6
The Pacific Islands in 3D
The small islands of the Pacific, when seen along the three dimensions of economic geography described in WDR 2009, are at a particular disadvantage as they
grapple with the challenges of smallness and geographic iso-lation. They have low economic density but rapidly growing populations; great distance from neighboring centers of eco-nomic activity; and acute divisions from being sea-locked and remote.
Low economic density, growing populations
These small and scattered islands have low economic den-sity and small markets. The smaller the market, the less the potential for taking advantage of economies of scale or being able to specialize. Investments in physical and human capi-tal and in marketing channels are difficult when the scale of economic activity is so small.
TROPIC OF CAPRICORNTROPIC OF CAPRICORN
SOUTH PACIFIC OCEAN
NORTH PACIFIC OCEANFEDERATED STATESOF MICRONESIA
PALAU
NEWZEALAND
AUSTRALIA
TONGAFIJI
VANUATU
SAMOA
TUVALUSOLOMONISLANDS
PAPUANEWGUINEA
INDONESIA
NAURU
MARSHALLISLANDS
KIR IBATI
NewCaledonia
(Fr)
Lord Howe(Aus)
Norfolk (Aus) KermadecIslands (NZ)
French Polynesia(Fr)
AmericanSamoa (US)
PalmyraAtoll (US)
Jarvis (US)
Millenium I.
Howland (US)Baker (US)
CookIslands
(NZ)
Niue(NZ)
Tokelau (NZ)
Guam (US)
NorthernMariana Is. (US)
Wallis andFutuna Is. (Fr)
Pacific Islands
Source: Adapted from Gibson (2006). Original data from AusAid (2006), ADB (2006).
Gross national income per capita (USD) and population distribution
560−970
971−1860
1861−2720
2721−4667
4668−4838
Population Distribution
Urban
Rural
Per Capita GNI (US$)
7
However, steadily growing populations, with high — and only slowly declining — fertility rates, especially in the Melanesian and Micronesian country groups, imply an increasing need for jobs in an environment that is unlikely to meet this demand. There will likely be strong population growth for years in the Pacific Islands, mainly because of momentum in countries where fertility rates have stayed high while mortal-ity rates have declined.
Formal sector employment is very low in the Pacific islands, and, except for Fiji, is expected to grow very slowly. Countries with high fertility rates and low formal sector employment, such as Papua New Guinea, Solomon Islands, and Vanuatu, will generate the most excess supply of labor. By 2029, Vanuatu is projected to double its working-age population from what it was in 2004.
Distance from economic density
Distance is not just a physical concept, but also an economic one. It is the ease or difficulty with which goods, services, labor, capital, information, and ideas move between places. Locations close to markets have a natural advantage over those that are distant from them. Besides their own small market size, distance from markets or main centers of eco-nomic activity has hampered progress in the Pacific islands. The correlation between access to markets and economic growth is strong.
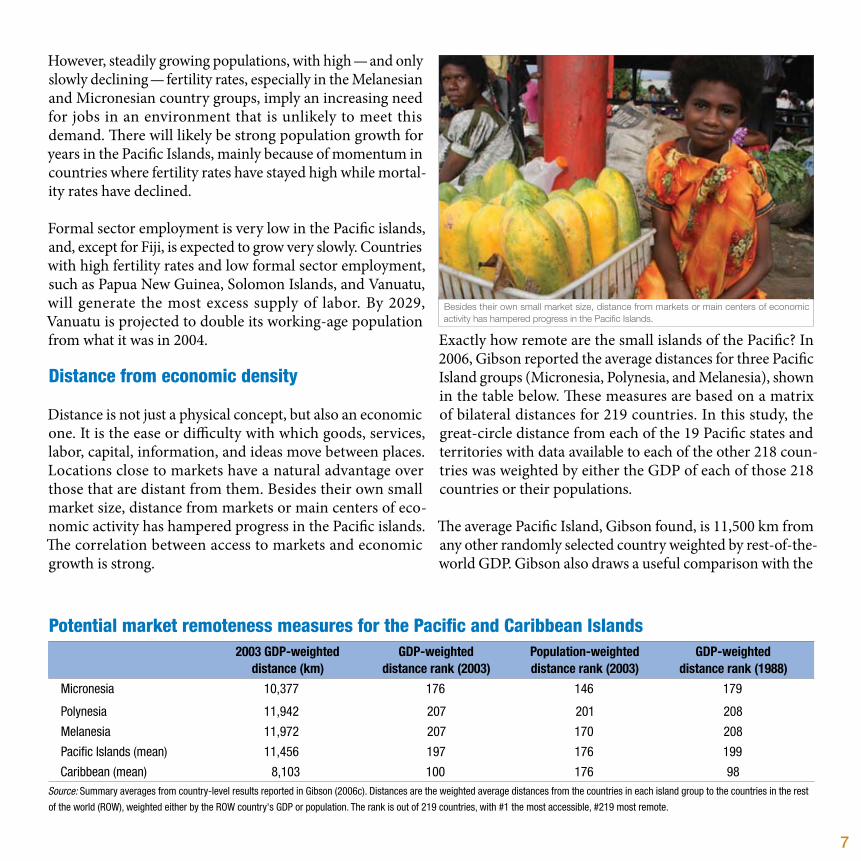
Exactly how remote are the small islands of the Pacific? In 2006, Gibson reported the average distances for three Pacific Island groups (Micronesia, Polynesia, and Melanesia), shown in the table below. These measures are based on a matrix of bilateral distances for 219 countries. In this study, the great-circle distance from each of the 19 Pacific states and territories with data available to each of the other 218 coun-tries was weighted by either the GDP of each of those 218 countries or their populations.
The average Pacific Island, Gibson found, is 11,500 km from any other randomly selected country weighted by rest-of-the-world GDP. Gibson also draws a useful comparison with the
Potential market remoteness measures for the Pacific and Caribbean Islands2003 GDP-weighted
distance (km)GDP-weighted
distance rank (2003)Population-weighteddistance rank (2003)
GDP-weighteddistance rank (1988)
Micronesia 10,377 176 146 179
Polynesia 11,942 207 201 208
Melanesia 11,972 207 170 208
Pacific Islands (mean) 11,456 197 176 199
Caribbean (mean) 8,103 100 176 98Source: Summary averages from country-level results reported in Gibson (2006c). Distances are the weighted average distances from the countries in each island group to the countries in the rest
of the world (ROW), weighted either by the ROW country's GDP or population. The rank is out of 219 countries, with #1 the most accessible, #219 most remote.
Besides their own small market size, distance from markets or main centers of economic activity has hampered progress in the Pacific Islands.
8
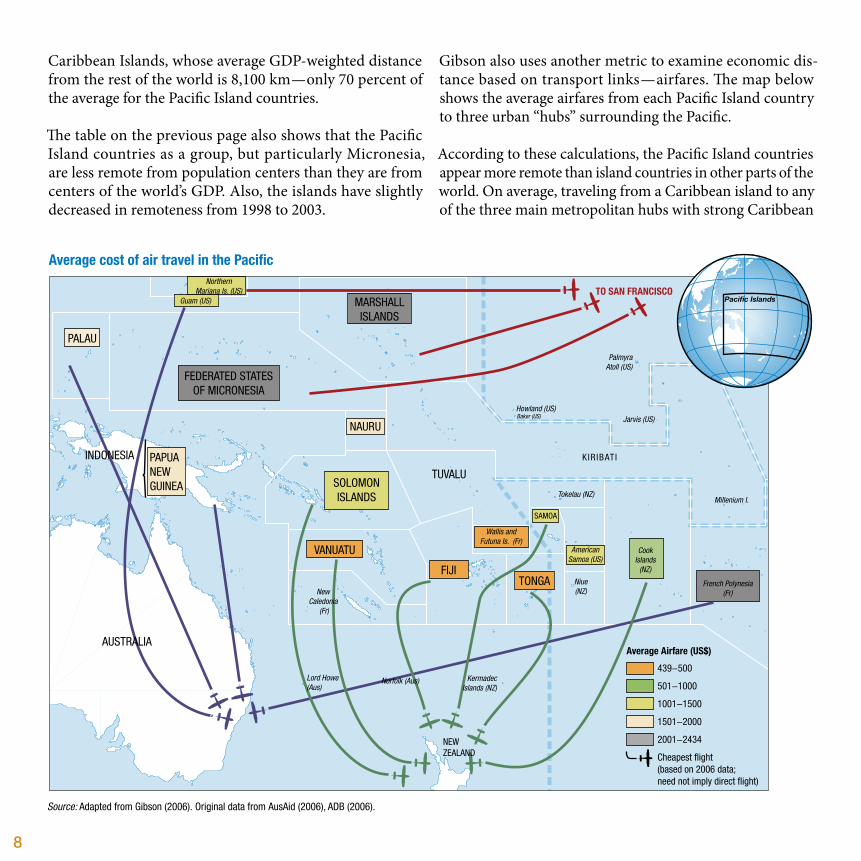
Caribbean Islands, whose average GDP-weighted distance from the rest of the world is 8,100 km — only 70 percent of the average for the Pacific Island countries.
The table on the previous page also shows that the Pacific Island countries as a group, but particularly Micronesia, are less remote from population centers than they are from centers of the world’s GDP. Also, the islands have slightly decreased in remoteness from 1998 to 2003.
Gibson also uses another metric to examine economic dis-tance based on transport links — airfares. The map below shows the average airfares from each Pacific Island country to three urban “hubs” surrounding the Pacific.
According to these calculations, the Pacific Island countries appear more remote than island countries in other parts of the world. On average, traveling from a Caribbean island to any of the three main metropolitan hubs with strong Caribbean
TO SAN FRANCISCO
FEDERATED STATESOF MICRONESIA
PALAU
NEWZEALAND
AUSTRALIA
TONGAFIJI
VANUATU
SAMOA
TUVALUSOLOMONISLANDS
PAPUANEWGUINEA
INDONESIA
NAURU
MARSHALLISLANDS
KIR IBATI
NewCaledonia
(Fr)
Lord Howe(Aus)
Norfolk (Aus) KermadecIslands (NZ)
French Polynesia(Fr)
AmericanSamoa (US)
PalmyraAtoll (US)
Jarvis (US)
Millenium I.
Howland (US)Baker (US)
CookIslands
(NZ)
Niue(NZ)
Tokelau (NZ)
Guam (US)
NorthernMariana Is. (US)
Wallis andFutuna Is. (Fr)
Pacific Islands
Source: Adapted from Gibson (2006). Original data from AusAid (2006), ADB (2006).
Average cost of air travel in the Pacific
Average Airfare (US$)
439−500
501−1000
1001−1500
1501−2000
2001−2434
Cheapest flight (based on 2006 data; need not imply direct flight)
9
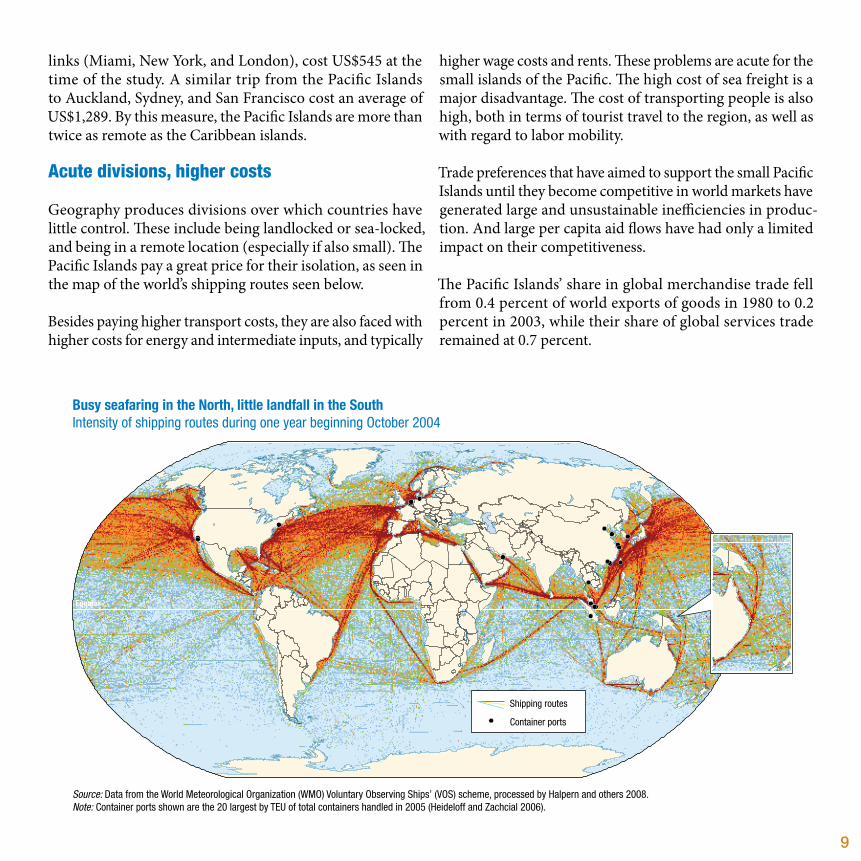
higher wage costs and rents. These problems are acute for the small islands of the Pacific. The high cost of sea freight is a major disadvantage. The cost of transporting people is also high, both in terms of tourist travel to the region, as well as with regard to labor mobility.
Trade preferences that have aimed to support the small Pacific Islands until they become competitive in world markets have generated large and unsustainable inefficiencies in produc-tion. And large per capita aid flows have had only a limited impact on their competitiveness.
The Pacific Islands’ share in global merchandise trade fell from 0.4 percent of world exports of goods in 1980 to 0.2 percent in 2003, while their share of global services trade remained at 0.7 percent.
links (Miami, New York, and London), cost US$545 at the time of the study. A similar trip from the Pacific Islands to Auckland, Sydney, and San Francisco cost an average of US$1,289. By this measure, the Pacific Islands are more than twice as remote as the Caribbean islands.
Acute divisions, higher costs
Geography produces divisions over which countries have little control. These include being landlocked or sea-locked, and being in a remote location (especially if also small). The Pacific Islands pay a great price for their isolation, as seen in the map of the world’s shipping routes seen below.
Besides paying higher transport costs, they are also faced with higher costs for energy and intermediate inputs, and typically
Equator
Shipping routes
Container ports
Busy seafaring in the North, little landfall in the SouthIntensity of shipping routes during one year beginning October 2004
Source: Data from the World Meteorological Organization (WMO) Voluntary Observing Ships’ (VOS) scheme, processed by Halpern and others 2008.Note: Container ports shown are the 20 largest by TEU of total containers handled in 2005 (Heideloff and Zachcial 2006).

10
Integrating the Islands with World Markets
The small islands of the Pacific face a great risk of mar-ginalization in the global economy because of their small size, remoteness from large markets, and vul-
nerability to economic and natural shocks. And with their fragile ecosystems, they are highly vulnerable to domestic pollution and rising seas. Not much can be done to over-come these inherent geographic disadvantages, but there are concrete policy actions that will go a long way to encourage economic growth and development in the islands.
Preparing for the end of SPARTECA
One effort to deal with the special problems of small islands is the South Pacific Regional Trade and Economic Cooperation Agreement (SPARTECA), a nonreciprocal trade agreement for which Australia and New Zealand offer duty-free, unre-stricted, or concessional access for almost all products originating from the countries of the Pacific Islands Forum.
To qualify for preferential access, goods exported to Australia and New Zealand must meet the rules of origin set out in
SPARTECA. The textiles, clothing and footwear industry has been a major beneficiary from this agreement.
However, this agreement is not open-ended. Australia and New Zealand are planning to adopt free trade by 2010, ending this preferential access to their markets. Without significant trade preferences, the Pacific Islands will need to find other ways, such as increasing labor mobility, to integrate with their large neighbors.
Negotiating greater labor mobility
WDR 2009, as well as another World Bank report, Pacific Islands: At Home and Away (2006) suggests that greater migration of Pacific Islanders toward centers of economic activity in other countries will likely have to form part of the solution. Analysis by Walmsley and others (2005) using eco-nomic models shows that an increase in labor outflows from the Pacific Islands would raise welfare both in the Pacific Island countries as well as in large neighbors such as Australia and New Zealand.
In general, remittances sent home by migrant workers have been found to have a positive effect on income distribution in two Pacific Island states, Fiji and Tonga. Remittances also contributed to increased saving, especially in indige-nous Fijian households. And in Fiji, remittances have been found to stimulate business investment.
However, perhaps the most interesting finding from Fiji is that when at least one family member intended to migrate in the near future, the likelihood of other family members acquiring tertiary education increased significantly. This trend is important from a policy perspective, as it could counter, to some extent, the potentially negative effects of the “brain drain” on island countries.
The impact of money sent home by migrants
11
Children in island families receiving remittances from migrant family members show strong improvements in edu-cation and health outcomes, suggesting that enhanced labor mobility could be a powerful driver for longer-term welfare in these countries.
Migration of labor from the islands — particularly through seasonal worker programs — benefits neighboring developed countries with rapidly aging populations. For example, grow-ers in Australia and New Zealand need a reliable and legal supply of workers who will remain in fields and orchards until time-sensitive harvests are completed. Currently, seasonal labor shortages are resulting in relatively high rates of ille-gal employment, causing problems for both employers, who face stiff penalties if raided; and for undocumented workers, who are vulnerable to exploitation, and possible arrest and
detention. Legal seasonal worker programs could transform this into a “win-win” situation, provided they ensure basic rights and protections to workers from the islands. In the last two years, a new scheme has given over 8,000 workers access to New Zealand’s labor market, each taking home an aver-age of NZ$5,000 at the end of four to six months. This is just the beginning of successful labor market integration — an important way of improving economic outcomes and stabil-ity in the Pacific Islands.
The Pacific Islands would benefit from aid-supported invest-ments that reduce distance and increase the mobility of people. A combination of common institutions, connective infrastructure, and selective interventions can help countries in the region overcome low densities, long distances, and stubborn divisions.
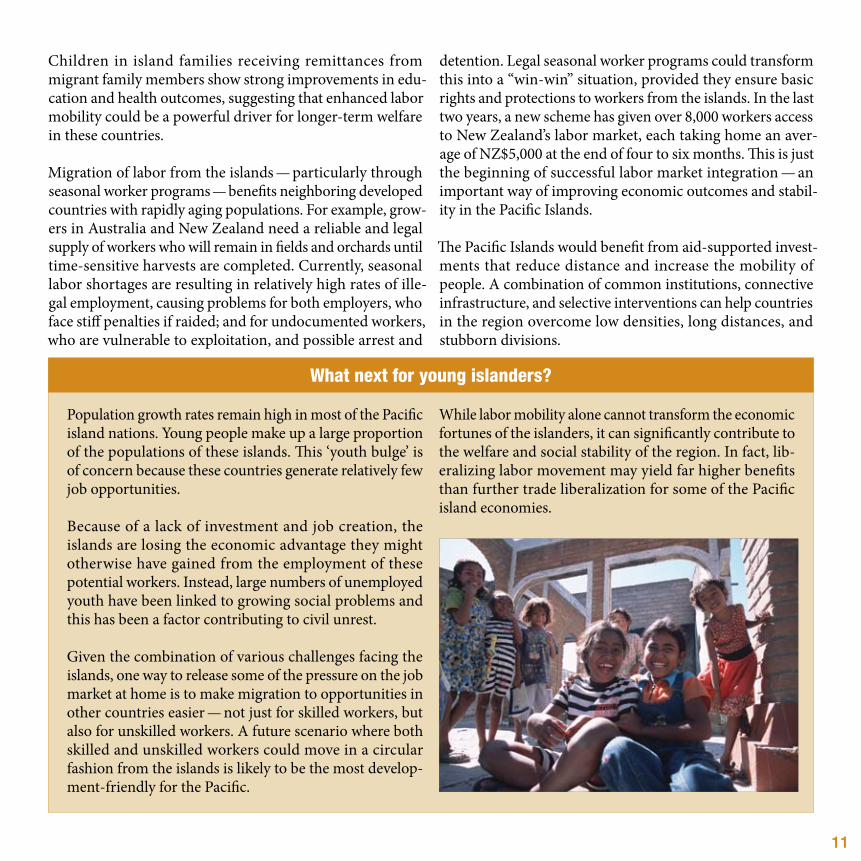
Population growth rates remain high in most of the Pacific island nations. Young people make up a large proportion of the populations of these islands. This ‘youth bulge’ is of concern because these countries generate relatively few job opportunities.
Because of a lack of investment and job creation, the islands are losing the economic advantage they might otherwise have gained from the employment of these potential workers. Instead, large numbers of unemployed youth have been linked to growing social problems and this has been a factor contributing to civil unrest.
Given the combination of various challenges facing the islands, one way to release some of the pressure on the job market at home is to make migration to opportunities in other countries easier — not just for skilled workers, but also for unskilled workers. A future scenario where both skilled and unskilled workers could move in a circular fashion from the islands is likely to be the most develop-ment-friendly for the Pacific.
While labor mobility alone cannot transform the economic fortunes of the islanders, it can significantly contribute to the welfare and social stability of the region. In fact, lib-eralizing labor movement may yield far higher benefits than further trade liberalization for some of the Pacific island economies.
What next for young islanders?
12
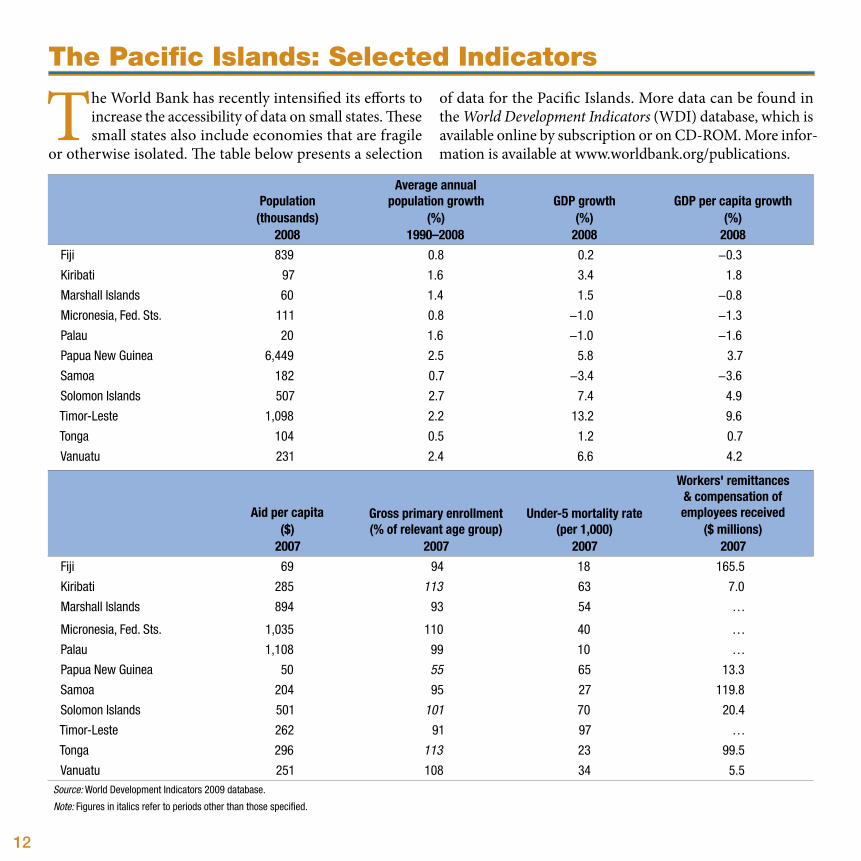
The Pacific Islands: Selected Indicators
The World Bank has recently intensified its efforts to increase the accessibility of data on small states. These small states also include economies that are fragile
or otherwise isolated. The table below presents a selection
of data for the Pacific Islands. More data can be found in the World Development Indicators (WDI) database, which is available online by subscription or on CD-ROM. More infor-mation is available at www.worldbank.org/publications.
Population(thousands)
2008
Average annual population growth
(%) 1990–2008
GDP growth(%)
2008
GDP per capita growth (%)
2008
Fiji 839 0.8 0.2 −0.3
Kiribati 97 1.6 3.4 1.8
Marshall Islands 60 1.4 1.5 −0.8
Micronesia, Fed. Sts. 111 0.8 −1.0 −1.3
Palau 20 1.6 −1.0 −1.6
Papua New Guinea 6,449 2.5 5.8 3.7
Samoa 182 0.7 −3.4 −3.6
Solomon Islands 507 2.7 7.4 4.9
Timor-Leste 1,098 2.2 13.2 9.6
Tonga 104 0.5 1.2 0.7
Vanuatu 231 2.4 6.6 4.2
Aid per capita ($)
2007
Gross primary enrollment (% of relevant age group)
2007
Under-5 mortality rate (per 1,000)
2007
Workers' remittances & compensation of employees received
($ millions)2007
Fiji 69 94 18 165.5
Kiribati 285 113 63 7.0
Marshall Islands 894 93 54 …
Micronesia, Fed. Sts. 1,035 110 40 …
Palau 1,108 99 10 …
Papua New Guinea 50 55 65 13.3
Samoa 204 95 27 119.8
Solomon Islands 501 101 70 20.4
Timor-Leste 262 91 97 …
Tonga 296 113 23 99.5
Vanuatu 251 108 34 5.5Source: World Development Indicators 2009 database.
Note: Figures in italics refer to periods other than those specified.
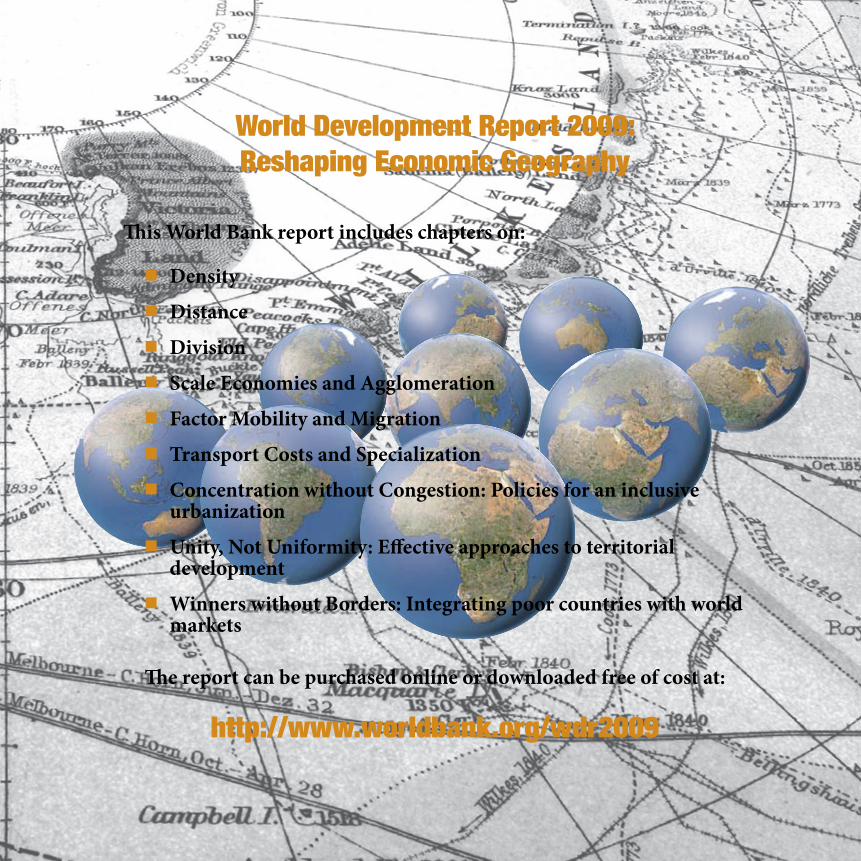
World Development Report 2009: Reshaping Economic Geography
This World Bank report includes chapters on:
Density
Distance
Division
Scale economies and Agglomeration
Factor mobility and migration
transport Costs and Specialization
Concentration without Congestion: Policies for an inclusive urbanization
Unity, not Uniformity: effective approaches to territorial development
Winners without Borders: Integrating poor countries with world markets
The report can be purchased online or downloaded free of cost at:
http://www.worldbank.org/wdr2009
“I expect that Reshaping Economic Geography will stimulate a much-needed discussion on the desirability of “balanced growth,” which has proved elusive. And by informing some important policy debates, it will point the way toward more inclusive and sustainable development.”
—Robert B. ZoellickPresident
The World Bank Group