ozawa laboratory, department of human support systems
TRANSCRIPT

1
Ozawa laboratory, Department of Human Support Systems, Graduate
School of Symbiotic Systems Science and Technology, Fukushima
University
DEVELOPMENT OF C/C COMPOSITES WITH BACTERIAL
CELLULOSE AND TRIBOLOGY PROPERTIES
バクテリア・セルロースを用いた C/C コンポジットの開発と摩
擦・摩耗特性
PHD thesis for 2016
by
Lkhagvasuren Uugansuren
Student ID: 211171009
Adviser: Ozawa Yoshihito
2016

2
TABLE OF CONTENTS
CHAPTER 1. RESEARCH BACKGROUND
1.1. Situation of present study and problems…………………………………………………….1
1.2. Research objective……………..……………………………………………………………2
1.3. Thesis outline………………………………………………………………………………. 3
CHAPTER 2. BACTERIAL CELLULOSE PROPERTIES AND EARLY RESEARCH WORKS
2.1. Introduction to Bacterial Cellulose …………………………………………...…………......4
2.2. Research works on the Bacterial Cellulose and fabrication methods ………………………..8
2.3. Bacterial Cellulose as a reinforcement on the nano-composites………………………….....10
2.4. Current products with Bacterial Cellulose…………………………………………..........…12
2.5. Research works on Bacterial Cellulose at laboratory……… ……………………… ……. .14
Summary…………………………………………………………………………………….17
CHAPTER 3. THE FABRICATION METHOD OF C/C COMPOSITES WITH
BACTERIAL CELLULOSE
3.1. Introduction
3.1.1. Introduction to C/C composites………………………………………………………..18
3.1.2. Fiber bridging effect and model……..……………………………………………… ..19
3.2. Fabrication method of the C/C composites with Bacterial Cellulose
3.2.1. Materials and methods ….……………………………………………………………..21
3.2.2. Impregnation process ……….……………..….……………………………………….23
3.2.3. Hot press process …………….………………. ………………………………………24
3.2.4. Carbonizing process …………………………………….……………………………..25
Summary………………………………………………..……………………………………..28
CHAPTER 4. THE EFFECT OF CARBONIZING TEMPERATURE ON THE TRIBOLOGY
AND MECHANICAL PROPERTIES OF THE NANO-C/C COMPOSITES
4.1. Tribology and tribology test result
4.1.1. Introduction to tribology……………………………………………………………….29

3
4.1.2. Measurement of the specific factors of wear element loss and results..……………….33
4.1.3. Measurement of the dynamic friction coefficient and results ………………...……….36
4.2. The morphology analysis
4.2.1. Surface roughness analysis and results…………………………………..……………..39
4.2.2. Sliding surface analysis of composites and drum surface SUS304 .…………………...41
4.3. The mechanical properties
4.3.1. Vickers hardness test and results……..………..………………………………………44
4.3.2. Three point bending test and results…………….…………………………..………...45
Summary………………………………………………………………………………………46
CHAPTER 5. DEVELOPMENT OF Si-C/C COMPOSITES WITH BACTERIAL
CELLULOSE BAMBOO CHARCOAL PARTICLES, AND TRIBOLOGY PROPERTIES
5.1. Introduction………………………………………………………………………………………47
5.1.1. Materials………………………………………………………………………………..48
5.1.2. Fabrication method of the Si-C/C composites………………………..………………...49
5.2. Tribology test and results
5.2.1. Measurement of specific factors of wear element loss and results………………….…..52
5.2.2. Measurement of the dynamic friction coefficient and results……………………...……54
5.2.3. Surface roughness test and results………………………………………………………56
5.2.4. The effect of the carbonizing temperature on the wear and friction properties…………57
5.2.5. The effect of BP% on the wear and friction properties ………………..……….……….61
5.3. Mechanical properties
5.3.1. Vickers hardness test and results………………………………………………………....64
5.3.2. Three point bending test and results………………………………………………….......65
Summary……………………………………………………………………………….…….....66
CHAPTER 6. SUMMARY AND DISCUSSION
6.1. Comparison on the wear and friction properties of developed composites……..……….. ….……67
6.2. Comparison on the mechanical properties of developed composites………………………………71
6.3. Conclusion………………………………………………………………….……………….……...75
Literature………………………………………………………………………….………….….....76

1
CHAPTER 1. RESEARCH BACKGROUND
1.1. Situation of present study and problems
Carbon - Carbon composites are structures in which both the matrix and reinforcement are carbon.
They offer many advantages in high temperature applications over composites fabricated with other
matrix material [1-2]. Nowadays, carbon carbon composites (in abbreviation c/c composites) have been
well recognized and gradually improved due to their advanced properties, such as low density, excellent
wear resistance and heat resistance. Among all of these superior properties, the wear resistance of C/C
composites has attracted lots of attentions in the field of tribology. Carbon fiber reinforced carbon
matrix (C/C) composites are often used for structural and frictional applications at a wide range of
temperatures due to their excellent mechanical and thermal properties [2-3].
Over the last few years increasing effort has been devoted to the use of nano particles and cellulose
obtained from natural sources as reinforcing elements for polymeric matrices [4-6]. In this sense,
cellulose microfibrils are interesting alternative to mineral fillers in multi-component polymer systems:
their low cost, low density, high stiffness, consumable property and biodegradability.
Composites materials reinforced with natural fibers, i.e. “Green composites”, have enhanced
biodegradability, combustibility, light weight, non-toxicity, reducing of environmental pollution, low cost,
simplicity of recycle and others [7-9]. Environmental concerns are driving demand for bio-degradable
materials such as plant-based natural fiber reinforced polymer composites. These composites are fast
replacing conventional materials in many applications, especially in automobiles, where tribology
(friction, lubrication and wear) is important. There are many situations where components made of fiber
reinforced polymer composites are under tribology loading conditions.
Literature shows that tribology performance evaluation of synthetic fiber based polymer composites
has been made for a long time and a good quality work is available on friction and wear properties of
these composites [10-14]. Recently, research attention has been focused on studying friction and wear
properties of natural fiber reinforced plastics (NFRPs). The work is progressing towards improving the
wear and friction properties of these composites as 90% of the failure in mechanical parts are due to
tribology loading condition. Tribology properties of polymers may improve or deteriorate due to
incorporation of reinforcement. Various studies have been made on tribology analysis of NFRPs like
betelnut fiber-reinforced polyester, sugarcane fiber-reinforced polyester (SCRP), kenaf/ epoxy,
cotton/polyester, sisal/phenolic resin etc [6, 12-17].
Observing the tremendous advantages and opportunities associated with natural fibers, there is a need
to further investigate the tribology behavior of natural fiber based polymer composites. Hence, the
present work aims to explore the possibility of using Bacterial cellulose in phenol resin matrix as a new
candidate for tribology applications. Bacterial Cellulose (BC) has received substantial interest owing to
its unique structural features and impressive physic-mechanical properties.
BC has a variety of applications in biomedical fields, including use as biomaterial for artificial skin,
artificial blood vessels, vascular grafts, scaffolds for tissue engineering, and wound dressing [18-21].

2
However, pristine BC lacks certain properties, which limits its applications in various fields; therefore,
synthesis of BC composites has been conducted to address these limitations [22-27].
A variety of BC composite synthetic strategies have been developed based on the nature and relevant
applications of the combined materials [28-34]. BC composites have been synthesized using numerous
materials ranging from organic polymers to inorganic nanoparticles. In medical fields, these composites
are used for tissue regeneration, healing of deep wounds, enzyme immobilization, and synthesis of
medical devices that could replace cardiovascular and other connective tissues. Various electrical
products, including biosensors, biocatalysts, E-papers, display devices, electrical instruments, and
optoelectronic devices, are prepared from BC composites with conductive materials [35-45]. This study
will increase interest in BC composites and the development of new ideas in this work.
1.2. Research objective
In this study, the fabrication method of the nano-C/C composites and Si-C/C composites with Bamboo
charcoal powder, and the wear and friction properties were investigated. Main objective of research is
to investigate the fabrication method of the carbon-carbon composite with lower friction and wear
properties using BC. The composites were prepared by using the Direct Impregnation method (DIM)
[46-47], and BC microfibrils network of the three dimensional nano-structure remained in the C/C
composites. The dry sliding wear test on composites had been carried out against SUS304 counter face
using pin on drum apparatus for constant sliding conditions. The friction coefficient and specific wear
rate were calculated from the experimental results. The detailed objectives are:
- To develop the C/C composites using BC;
- To improve of the fabrication method (Impregnation, drying, hardening, hot press, carbonizing);
- To decrease the fabrication duration, dynamic friction coefficient and specific factors of wear element
loss;
- To improve wear resistance and other mechanical properties (Density, Bending strength, Hardness);
- To determine friction and wear behavior.
By using BC in the fabrication of C/C composites offers a prospect of lightweight, ultra-fine
reinforcement as well as lower manufacturing costs. It has been reported that, average dynamic friction
coefficient and wear rate depended on the heat treatment temperature and carbon fiber orientation.
Therefore, in this thesis, the effect of heat treatment and third ingredient (BP) content on the friction and
wear behavior of composites against SUS304 stainless steel were investigated. Ultimately, research
work relates to for the fabrication method of C/C composites suited for use as bearing and sliding
materials and a part of robot hand system where wear and friction occur.

3
1.3. Thesis outline
The present thesis describes and proposes for producing four types composites. The first study is
concerned with the fabrication method and tribology behavior of BC based c/c composites with BC and
phenol resin. The second is concerned with the tribology properties of the Si-C/C composites with BC,
Bamboo charcoal powder and phenol resin. Moreover, in this study in order to clarify BC microfibril
effect on the wear and friction mechanism, the BP/Phenol composites with BP 5wt% and phenol resin
was developed. Finally, the Phenol composites with phenol was developed and wear and friction
properties were compared to these composites.
Chapter 2 discusses a general introduction on BC such as synthesis, morphology and cultivation
methods.
Chapter 3 contains previous research works and most relevant applications of BC are briefly presented.
Further this chapter discusses the previous research works in our laboratory.
Chapter 4 In this discuss the fabrication method of C/C composites using BC, Bamboo charcoal
Particle (BP) and phenol resin.
Chapter 5 This chapter presents the effect of carbonizing and heating rate temperature on mechanical
and tribology properties of nano-C/C composites.
Chapter 6 In this chapter the development and tribology properties of Si-C/C composites using BC,
BP and phenol resin are addressed.
Chapter 7 contains comparison studies on nano-C/C composites, Si-C/C composites, BP/Phenol
composites and Phenol composites, Conclusion and Literature.

4
CHAPTER 2. BACTERIAL CELLULOSE PROPERTIES AND
PREVIOUS RESEARCH WORKS
2.1. Introduction to Bacterial Cellulose
Bacterial cellulose (BC) is one of the eco-friendly materials, and is synthesized by the acetic bacterium
Acetobacter xylinium[46-47]. BC is produced by several species of bacteria including
Gluconacetobacter (formerly Acetobacter), Agrobacterium, Aerobacter, Achromobacter, Rhizobium and
Salmonell [46,48]. As a materials, the most important of these is Acetobacter xylinum, now renamed
Gluconacetobacter xylinus (G. xylinus), discovered in 1886 by A.J.Brown. There were found wherever
the fermentation of sugars and plant carbon hydrates takes place, for example on the surfaces of rotting
fruits and unpasteurized or unsterilized juice, beer and wine.
In its native hydrated state, BC gel consists of more than 99wt% water and less than 1wt% cellulose.
Figs. 1and 2 show BC gel and SEM observation of microfibril structure. BC is quite different from
wood cellulose: high purity, high crystallinity, high water content to 99%, and high mechanical stability.
The degree of polymerization BC is usually between 2000 and 6000, but can reach 16000 to 20000 [20,46].
Therefore, with the increased degree of polymerization, aspect ratio increases, the bonding position of
each nano fibers in the whole network increases, resulting in higher mechanical properties [8,9].
Moreover, BC possesses an array of unique properties, including high tensile strength, ultra-lightweight,
good permeability, adjustable aperture and good biocompatibility. Fibrils of BC are about 100 times
thinner than plant cellulose and form of three-dimensional network that provides unique mechanical
properties.
The fibrous structure of BC consists of a three-dimensional non-woven network of nanofibrils, which
is held together by hydrogen bonding [20,27,33-35]. Microfibrillar structure of BC responsible for most
of its properties such as high tensile strength, low density, high degree of polymerization and crystallinity
index. This fibrous structure of BC was first described by Muhlethaler in 1949.
Brown et al., studied microscopic studies of bacterial cells producing cellulose show the presence of
cellulose ribbons attached to the longitudinal axis of the cell, and freeze fracture analysis allowed the
identification of a linear array of pores in the cell envelope of G. xylinus. The mechanism of BC
formation is shown in Fig.2, and implements as follows by Brown. The pores represent the cellulose-
Fig. 1 BC gel Fig. 2 SEM observation of BC

5
synthesizing sites and a number of glucan chains arise from a single pore forming sub-elementary fibril.
These sub-elementary fibrils assemble with adjoining other sub-elementary fibrils giving rise to
microfibrils that assemble into 50-100nm width and 1-9μm in length. Brown described that, a single
bacterium cell produces a ribbon of cellulose with 10-100 microfibrils.
The 3~4 sub-elementary fibrils from TC subunits aggregate into an assembly called a ribbon, and
finally these BC ribbon are assembled together into a BC microfibril, as shown in Fig. 3. The BC
microfibrils produce a gelatinous membrane known as a pellicle [20]. This membrane of pure cellulose,
and cells entrapped within it can be cleaned and dried and the product used for many exciting new
applications.
The bacteria first secreted a structurally homogeneous slimy substance within which, after a short time,
the cellulose fibers were formed.
The molecular formula (C6H10O5)n, is composed of repeating β(1→4) linked D-glucose units, as shown
in Fig. 4. The fibrous structure of BC consist of a 3D non-woven network of microfibrils, which held
together by inter and intra hydrogen bonding, resulting in a hydrogel and dry state with high mechanical
strength. Dashed lines show inter-chain hydrogen bonding, while dotted lines show intra-chain hydrogen
bonding, as shown in Fig.5.
Fig. 4 Representation of the structural unit of the cellulose polymer.
Fig. 5 Representation of the inter- and intra-chain hydrogen bonding network.
Terminal complex
(TC)
4nm
Intra-chain
hydrogen bond
Fig. 3 Schematic of microfibril formation of BC [20].
Sub elementary
fibril <1-2nm BC microfibril<100nm
()
Outer membrane
Inner membrane
Inter-chain
hydrogen bond
Gluconacetobacter cell

6
Morphology and basic properties of Bacterial Cellulose
BC in its native hydrated state is a hydrogel with low modulus of elasticity and fracture toughness [18-
20]. The mechanical properties strongly depend on the properties of the network, in brief morphology
of BC. The morphology of BC is quite different in the culture condition and bacterial strain.
In its native hydrated state, BC consists of more than 99% water and less than 1% cellulose [20,49-,50].
Due to extremely small volume fraction of the cellulose nanofibers, the porosity of BC ranges from 92%
to 94% (void volume in relation to total volume). Nevertheless, the meshes of the texture vary between
1 to 20 µm, and dimensions of meshes vary within the BC hydrogel of its layered, non-homogeneous
structure, preconditioned by the BC biosynthesis, as shown in Fig. 6.
In static culture, the middle layer is relatively homogeneous and the dimensions of meshes range from
1 to 10µm, bottom part shows a wide meshed up to 10µm with lower mechanical properties, whereas the
upper surface is denser about 1µm. This mesh is necessary to support cell ingrowth, allow for efficient
nutrition and gas exchange, and have a suitable degradation rate, able to cope with the formation new
material in order to maintain the mechanical stability [20,50].
Many research work have been reported concerning mechanical properties and density of BC.
Mechanical properties of BC have been studied mainly testing material in sheet form. The first
mechanical tests on BC were conducted by Yamanaka et al. in 1989, and the dried material was tested in
sheet form, with Young’s modulus up to 15GPa. The main reason for the high aspect of the BC sheet is
due to continuity if the fibres, which are not necessarily linear, but possesses “three way branching points”,
as observed by Yamanaka et al. [21-23].
Later on values of modulus of around 30~40GPa were reported by Nishi et al. in 1990 by treatment of
the sheets in alkaline and oxidative [24]. Author concluded that, in drying process of BC, the nano-
fibers arrange parallel to each other and form layered sheets. These give the dried cellulose sheets high
stability and strength, as there is the formation of more hydrogen bonds among the fibers [23,24].
In terms of direct measurement of BC microfibrils has been reported very little. To date, two methods
have been used to estimate Young’s modulus of a single BC microfibril. Guhados et al. measured
Young's modulus of BC with diameters ranging from 35 to 90 nm at a value of 78±17GPa (same as glass
fiber) and strength in order of 2GPa by using AFM tip to record force-deflection curves on single
Gap (<10µm)
p
BC microfibril
Fig. 6 Microstructure of BC microfibril.

7
filaments [25].
Nishino T. et al., accepted value of 138GPa (130-145GPa) for the crystal modulus of Cellulose I, found
using an X-ray diffraction method [26]. Y.C.Hsieh and H.Yano et al. estimated the modulus of a single
fibril to be of 114 GPa, using a Raman spectroscopic technique [27]. This value is higher than
previously reported values, but lower than estimates of the crystal modulus of Cellulose-I (130-145GPa).
Authors concluded that, the reason for these discrepancies are given in terms of the crystallinity and
structural composition of the sample. In order to obtain better estimates, oriented sheets of fibres may be
required.
Disadvantages of BC
Some of the disadvantages associated with BC as a structural material refer to: High price for producing
(about 100 times more than plant cellulose), because of high priced substrates and medium sterilization.
- Low volumetric yields.
- Lack of large scale production capacity, and commercialize
- Long time expansion and maintenance of the cell culture for production.
- Large quantities of water used for treatment and large quantities of caustic residual waters resulted
after washing the BC.

8
2.2. Research works on the Bacterial Cellulose and fabrication methods
As a material, the discovery of BC was accredited to A.J. Brown in 1886. In the last few years
growing worldwide activity can be observed regarding extensive scientific investigation and increasing
efforts for the practical use of the BC materials. There is an increasing annual publication activity on
BC since 2000. In recent years, the investigation and utilization of BC in functional materials have been
the focus of research, and a growing number of works have been included in this field.
The functional BC-based nano materials are especially an attractive topic because they enable the
creation of materials with improved or new properties by mixing multiple constituents and exploiting
synergistic effects, such as electronic, optical, magnetic, catalytic properties and bioactivity. Different
composites with BC have already been synthesized to increase its mechanical properties, biological
activities, conductivity, magnetic properties and biomedical application.
BC composites have been formed using a reinforcement material such as Chitosan(Ch), Gelatin, Poly
aniline, Collagen, Aloe vera gel, Silver nanoparticle, Palladium Gold particle, CNT and Silica a lot many
materials [30]. BC composites are primarily synthesized through in situ addition of reinforcement
materials to BC synthetic media or the ex situ penetration of such materials into BC microfibrils and
synthesized from dissolved BC solution.
The schematic diagram showing the synthesis of BC composites in Figs. 7-9. The in situ method
utilizes the addition of reinforcement material to the polymer during its synthesis, which then becomes
part of the polymer structure. For example, Saibuatong et al. synthesized BC-Aloe composite film by
adding aloe component and resulting composite had superior mechanical properties [48].
Fig. 7 Schematic representation of BC composites synthesized through an in situ method.
Fig. 8 Schematic representation of BC composites synthesized through an ex situ method [30].
Culture media for
BC production
Addition of
reinforcement
Media containing
reinforcement
Production of
BC sheets
Composite of
BC sheets
BC gel Reinforcement
(particles) or (resins)
matrix
Preparation of
BC -composites BC -composites

9
Fig. 9 Schematic representation of BC composites synthesized from dissolved BC [30].
Similarly, Yan et al. CNTs added to synthetic media and incubated for 2 weeks, and Won-II Park et al.
dispersed a multi-walled carbon nanotube (MWCNT) HS medium by shaking incubation. These result
show that, CNT and MWCNT are non-toxic to bacteria and well dispersed and attached to the surface of
BC microfibrils [29,49].
Ex situ synthesis, the polymer matrix is impregnated with reinforcement materials to produce
composites. BC composites with BC-Ag, BC-Pd, BC-CNT, BC-MMT, PLLA/BC were synthesized
through the ex situ production method. The formation of BC composites from solutions of dissolved
BC is a better approach that can be utilized to produce a broad range of BC composites with a variety of
materials.
BC composites can be classified into organic and inorganic materials, and these 2 main classes can be
further divided into sub-classifications.
Polymers
BC-Ch
BC-PAni
Nano materials
BC-CNT
BC-GO
Metals
BC-Ag
BC-Au
Metal oxides
BC-TiO2
BC-FeO
Solid particles
BC-Si
BC-MMt
BC composites with
Organic materials Inorganic materials
Solvent
Powdered
BC
Stirring Solution of dissolved
BC and addition
reinforcement
Composite
solution
Film casting
Stirring
Wet compo-
site films
Drying and
peeling
Dried composite
films

10
2.3. Bacterial Cellulose as a reinforcement in composites
There are several examples of BC composites with bio polymers that have led to improvements in
biomedical applications, physic-mechanical properties and conducting capabilities of BC.
Mazur UI-Islam et al. synthesized of BC-Ch composites is based on the active role of Chitosan in
biomedical field. Chitosan has been recognized for its broad spectrum of activates, which include
absorption of wound exudates, wound healing effects, tissue-engineering scaffolds, drug delivery, anti-
microbial, anti-fungal an anti-viral properties [29].
H.J.Lee et al. reported BC-PANI (Poly aniline) composite prepared by in situ polymerization of PAni
formed a layer on the surface. It was found that the PANI nanoparticles deposited on the surface of BC
connected to form a continuous nano sheath by taking along the BC template, and the conductivity could
be enhanced when PANI is doped by protonic acids. The resulting PANI-coated BC nanofibrils exhibit
excellent electrical conductivity of 5.0×0−2S/cm and good mechanical properties with Young's modulus
of 5.6GPa and tensile strength of 95.7MPa [30].
Several other biopolymers have been combined with BC to increase its biomedical applications,
including BC-COL, BC-Alginate and Novo aloe vera etc.
Metal and metallic oxides have been extensively used in polymer composites to introduce electrical,
optical, conducting and antimicrobial properties in polymers [20,47]. BC-Ag nanocomposites are
primary synthesized to incorporate antibacterial into BC. Maneerung et al. prepared BC-Ag
nanocomposites by impregnation of BC sheets in AgNO3 solution. BC-Ag nanocomposite produced very
strong antibacterial effect against bacteria and microorganisms [32].
Gold NPs (nano particles) have received immense attention owing to their potential for use in sensors,
catalysis, and several related fields. BC-Au composites have been prepared through specific techniques
are utilized for bio-sensing and in bio-devices. Moreover, BC-Pd and BC-Pt composites were produced
to increase conducting properties.
Various clays clay have been utilized as reinforcing materials in polymer clay composites due to its
enriched in minerals. Among these, members of the spectate family, which includes bentonite and
montmorrilonite (MMT) have been popular owing to their biomedical applications and reinforcing
properties.
Yano et al. prepared BC composites with silica particles through both in situ and ex situ impregnation
method. Both methods ensured the formation of composites and the presence of silica particles inside
the BC fibers. However, the effect on structural features and mechanical properties were different for
each type of composite. In situ impregnation of silica had lower mechanical properties.
Nishino T. et al, prepared BC/ND (nano-diamond) composite by in situ biosynthesis [33]. Authors
concluded that, BC can be cultivated in the presence of ND and the resulting composite possesses high
mechanical properties and low thermal expansion coefficient down to 1 ppm.
According to various literature sources, BC has been utilized as reinforcement for composite material
its high mechanical characteristics and morphology feature. In 2004, Gindl reports the result of a set of
tensile tests performed on BC pellicles in a CAB (cellulose acetate butyrate) solution to produce BC-

11
CAB composites [34]. They produced the composite by solvent evaporation casting. Their composite
material contained 10% and 32% volume cellulose, and revealed a Young’s modulus of 3.2GPa, 5.8GPa,
and strength of 52.6 and 128.9 MPa.
Nakagaito, Yano et al. produced a high-strength composites were produced using BC sheets
impregnated with phenolic and epoxy resin and compressed at 100MPa [35,36]. Young’s modulus of
BC composites with epoxy resin was reported to be 28 GPa, and tensile strength is 325MPa, which was
higher than that of MFC-based composites (19 GPa).
Nishino et al. developed BC/Poly (L-lactic acid) composite by the in situ method. This composite
shows excellent mechanical and thermal properties [37].
Zhijiang Cai describes the preparation and characterization of new BC/gelatin scaffold for tissue
regeneration using BC hydro-gel by freeze-drying method [20]. They observed that after incorporation
of gelatin in BC, Young’s modulus increased from 3.7 to 3.9GPa, and tensile stress decreased from
170MPa to 114MPa.
Bacterial Cellulose on Tribology
Data and research work on the tribological properties of BC and BC-based materials is very scarce.
Nakayama et al. developed a double-network (DN) hydrogels synthesized using the natural polymers BC
and gelatin [20]. BC-based DN gel materials have great potential for application as an artificial cartilage
because they are viscoelastic, strong, durable to repetitive stress, and have low friction on the order of 10-
3(µ=0.001). Authors developed 2 kinds of DN gel such as PAMPS-PAAm and PAMPS-PDMAAm and
pin-on-flat type wear test is evaluated. Table 1 shows testing result.
Table.1 Maximum wear depth and roughness.
BC-PDMAAm BC-Gelatin UHMWPE
Maximum depth (µm)
Roughness (Ra) (µm)
7.8±8.67
0.09±0.03
1302.4±867.5
Not measurable
3.33±5.77
10.0±0
They concluded that, these hydrogels could open a new era soft and wet materials as substitutes for
bio-tissue such as articular cartilage, ligament, tendon etc and could be a potential candidate for drug
delivery systems in the living body.
Moreover, J.L.Lopes et al. describes the tribological properties of BC against bovine articular cartilage
(BAC) in the presence of a saline solution [41].
Researchers concluded that BC evidenced a notable wear resistance assisted by compact structure of
highly mechanically resistant nano-fibers, revealing non-measurable wear from the release of soluble
substances in the lubricating medium by the total glucose determination method.

12
2.4. Current products
As described above, since 1988, BC has properties like high purity, high degree of crystallinity, high
density, good shape retention, high water binding capacity and higher surface area as compared to the
native cellulose. It can be used in various areas including textile industry, paper, food, pharmaceutical,
waste treatment, and as reinforcement in nano-composites. Due to its many unique properties, for the
last 2 decades, chemical and physical properties of BC have been an interesting topic in the field of
research and development, specifically in biomedical field, and likely to continue to be in the future.
Currently, BC is used in dessert foods, high quality paper, speaker membrane and biomedical application
such as wound dressings and artificial skin.
Food products
Generally, BC is famous as a Nata de coco originating from Philippines, is a traditional dessert in
Southwest Asia. Nata de coco can be consumed in many types of food items, such as desserts and
candies, salads, fruit cocktails, ice cream, juices, dairy products, sauces etc. Because it is rich in dietary
fiber, matter of fact, the Nata De Coco when absorb is not-digestible. Meaning the fiber can act as a
cleanser to the digestive tract.
Low calorie, only 80 kilo-calorie per 100 grams serving. Due to its high purity, BC is used in dietary
food and dessert almost, moreover BC have potential uses for thickening and gelling stabilizing, water-
binding, as a food packing materials. Based on the tensile strength, low oxygen transmission (barrier
property) rate and its hydrophilic nature, the processed cellulose membrane appears to be of great
relevance for its application as packaging material in food packaging, where continuous moisture removal
and minimal oxygen transmission properties play an important role.
BC can serve as a primary material in food industry as a heat-stable suspension agent as well as a filler
to reinforce fragile food hydrogels. It can improve the quality of pasty foods by reducing their
stickiness; it can be applied to meat products as a fat substitute and to jam as a non-caloric bulking agent.
One of the commercial food stabilizer and thickener on the market is Cellulon® [42].
Okiyama et al. investigated the function of BC in modifying the rheology food [10]. They reported
that, BC is can use as a thickening agent, stabilizing agent, gelling agent and suspending agent in food
application.
Xiao et al. developed the food packaging combining BC with PLA, which has improved properties for
food packaging, because of its better mechanical properties. Tubular BC can be produced using direct
shaping procedures during cultivation process, it has a great potential application of food casing [43-46].
Technical products
The unique dimensional stability of microbial cellulose gives rise to a sound transducing membrane
which maintains high sonic velocity over a wide frequency ranges, thus being the best material to meet

13
the rigid requirements for optimal sound transduction. Sony Corporation, in conjunction with
Ajinomoto developed the first audio speaker diaphragms using microbial cellulose. The first
headphones were very expensive, over $3,000 for one pair. The price recently has dropped, and the
microbial cellulose headphones are available worldwide as an upper end audio product.
In the recent years BC was proposed as a transparent nano-composite support for organic light-emitting
diode (OLED). From the papers, Iguchi M. (2000) has stated that fragmented BC has promising
prospects in papermaking, so test pieces of flexure durable papers and high filler content papers, which
are ideal for banknote paper. Electronic paper was first put into practice by Shan and Brown (2005),
who created a dynamic display on BC [20].
Yano et al.(2005) developed transparent BC/epoxy resin and BC/acrylic resin composites which
showed a high transparency, high tensile strength with 325MPa [35], and in 2008 developed foldable
transparent composite reinforced with BC. Based on its flexible BC membrane, Yano et al., in
collaboration with Mitsubishi Chemical Corporation and Pioneer Corporation demonstrated organic light
emitting diode (OLED) devices [36].
Nishino et al., developed new type all-cellulose, high optical transparency composite material made of
BC, cellulose acetate [37,38].
The surface of cellulose fibers was acetylated under super critical carbon dioxide (sc-CO2) condition.
The display device is undertaken by of joint research Ricoh Co., Ltd., Agri Bio Industry Inc. and
Associate Professor Kenji Tajima of Hokkaido University Graduate School of Engineering [39].
By infusing BC paper with an electrolyte solution containing dissolved electro chromic compounds
that undertake a reversible transition from a blank state to a colored state when voltage is applied, and
then forming electrodes on both sides of the paper, the paper display device has been created.
Ummartyotin et al. fabricated a nano composite film composed of bacterial cellulose (10–50 wt%) and
poly-urethane (PU) based resin was fabricated and utilized as a substrate for flexible OLED display [40].
Various electrical products, including bio-sensors, biocatalysts, E-papers, display devices, electrical and
optoelectronic devices are prepared from BC composites with conductive materials.
Biomedical products
BC is natural nano-structured polymer characterized by numerous advantageous attributes that make
it applicable in many areas, including health care and cosmetics. From the materials [20, 30, 41], BC
has found several applications in the medical field as wound and burn dressing and high potential for
development as medical implant and scaffold for tissue engineering.
In fact, BC-based commercial products, such as BioFill (BioFill® Produtos Biotecnlolgicos, Brazil),
Bionext® (BioNext Produtos Biotecnologicos, Brazil), and XCell® (Xylos Corporation, PA, USA) have
been shown to effectively accelerate the wound healing process [42].
In addition, Fabula Biofiber Nano-Cellulose Mask is produced by reserved bacterial fermentation
approved by US FDA and is made in Taiwan.

14
2.5. Research works on Bacterial Cellulose at laboratory
Following development and studies were investigated such as; The mechanical behavior of BC
composites with various reinforcement in order to establish the fabrication methods of two different types
of BC composites; BC composite materials of sheet type and BC wad [51-53].
Development of BC sheet
Mechanical behavior of BC composite materials of sheet type with various reinforcements is
investigated [7]. The matrix of composites is BC and their reinforcements are powdered paper (PP),
CaCO3, and clay. BC composite materials were prepared with various contents of reinforcement, that
is, 20%, 35%, 60% and 70% weight in the composites. Table 2 shows reinforcements of BC composites
are powdered paper (PP), calcium carbonate (CaCO3), and clay (Montmorillonite).
Table 2 Reinforcements of BC composite material
Name Dimension Manufacture
Powdered paper
Calcium carbonate (CaCO3)
Clay (Montmorillonite)
Length 10~100μm
Mean diameter 1.5μm
Mean diameter 1μm
Sankyo Seifun Co., Ltd
Sankyo Seifun Co., Ltd
Kunimine Industries Co., Ltd
Fabrication method of BC composites:
1. BC Slurry
2. BC Slurry + Powdered paper PP/BC composite
+ CaCO3 CaCO3/BC composite
+ Clay Clay/BC composite
3. Filtration and drying of composites an oven
4. Press process
5. Eco-Friendly Composites
For the experiments, BC composites were cut into tension specimens of coupon type (JIS K7113)
115mm×25mm×1mm as shown in Fig. 10. Young's modulus E of BC composites in each case are
summarized and shown versus the contents of reinforcements in Fig. 11. In the cases of CaCO3/BC
composites and Clay/BC composites, it is found that the composites have a maximum value of Young’s
modulus at an optimum value of reinforcement contents. For the composites of 20wt% reinforcement,
Young’s modulus of Clay/BC composites is higher than that of CaCO3/BC composites and PP/BC
composites. The mean value of diameter of clay particle is about 1μm, and that of CaCO3 particle is
about 1.5μm. In the case of PP/BC composite specimen, the inter laminar de-bonding was observed in

15
the fracture surface and the maximum load takes a small value. The fiber length of powdered paper is
about 1~2 mm, and it is much longer than that of BC microfibrils. From these considerations, in the
case that the reinforcements have same size of the BC microfibrils, the BC composites have a maximum
value of Young’s modulus at an optimum value of reinforcement contents.
Fig. 12 shows the comparison of the mechanical properties of BC composites with those of other
engineering plastic materials such as Polyethylene terephthalate (PET), Polystyrene (PS), Polypropylene
(PP), and Polyethylene (PE). From this figure, by comparing the results of pure BC material, Young’s
modulus of CaCO3/BC (CaCO3 35wt%) composites take twice higher value than that of pure BC material
while the E of Clay/BC (Clay 35wt%) composites take three times higher.
Development of 3D form of BC composites
In this study, the fabrication method of BC form, in which BC microfibril network of three dimensional
structure and their bonding conditions remains was developed. Using a mixer, the BC slurry was break
into fine pieces with a small amount of water. Adding reinforcements into it, the slurry was blended
well into a source of BC mixture. After pouring the BC slurry into a container of cup type, it was frozen
in a freezer.
Frozen samples were dehydrated in a vacuum chamber, and then we had BC forms in which three-
dimensional network of BC microfibrils and their bonding conditions remain (Fig. 13). Specific volume
of 3D-BC forms developed was 100 - 200cm3/g.
0
10
20
30
40
50
60
70
2.0 4.0 6.0 8.0
σ[M
Pa
]
E [GPa]
BC
Fig. 11 Young modulus of BC composite
materials versus filler contents.
Fig. 10 BC composites specimen of coupon type.
Thickness: t =1mm
0
2
4
6
8
10
0 20 40 60 80 100
E [
GP
a]
Filler content [wt%]
Clay
CaCO3
Powdered
paper
Fig. 12 Comparison of mechanical
properties of BC composites.
PET
PS
PE

16
Fabrication method of 3D form of BC composites:
1. BC Slurry
2. BC Slurry + Reinforcement ( CaCO3 ,Clay)
3. Freeze in a freezer
4. Dehydrate in vacuum chamber
Fig. 14 shows photographs of SEM for observation of BC form with three-dimensional microfibril
network and CaCO3 fillers. It is found from the photograph that thin BC sheets of several micrometer
thickness are layered and making a unit cell of stacked BC sheets with hundred micrometer order. In
the observation at high magnification, BC microfibrils of nano-scale are randomly entangled each other,
and CaCO3 fillers are well dispersed in the three-dimensional network of BC microfibrils. This BC
network with reinforcement fillers could give the high Young’s of BC composite materials.
By using 3D BC form, 3D-BC form/epoxy composite is fabricated by using new method and bending
test was performed. From Fig. 15 (a), the material consists of BC unit cells in contact with each other.
It is found from Fig. 15 (b) at high magnification that the epoxy resin was impregnated into structure of
BC cell.
Measurement of BC density
The measurement of BC’s density is difficult, because of containing about 99wt% of water. In this
experiment, BC gel insert into water to measure total mass and volume by using measuring cylinder.
After taking this procedure, BC samples were dried in vacuum oven and measured mass. As a result, it
can be determined total mass and volume of containing water and also BC density. As resulting, BC
has very low density of 0.25~0.49g/cm3.
Measurement method as following:
1. Insert into measuring cylinder BC gel with water, and measure total mass (m) and volume (V)
BC gel + Water V wtBC+water and m wtBC+water
2. Take out only BC gel, frozen in a freezer and BC samples were dried in vacuum oven.
3. Measure mass of BC (mBC), and determine mass of water (mwater)
Fig. 13 BC form. Fig. 14 Surfaces of BC
form.
(a) (b)
Fig. 15 SEM photographs of fracture surfaces
of BC-3D form/ Epoxy composite material.
17
(mwater=m wtBC+water-m BC)
4. From the mass of water, can found the volume of water. (0.9982g/cm3 (20℃)≒ mwater/ Vwater)
5. Find the volume of BC from the volume of the water (V BC = V wtBC+water- Vwater)
6. From the volume and mass of BC, can find the density of BC. ρBC= m BC / V BC
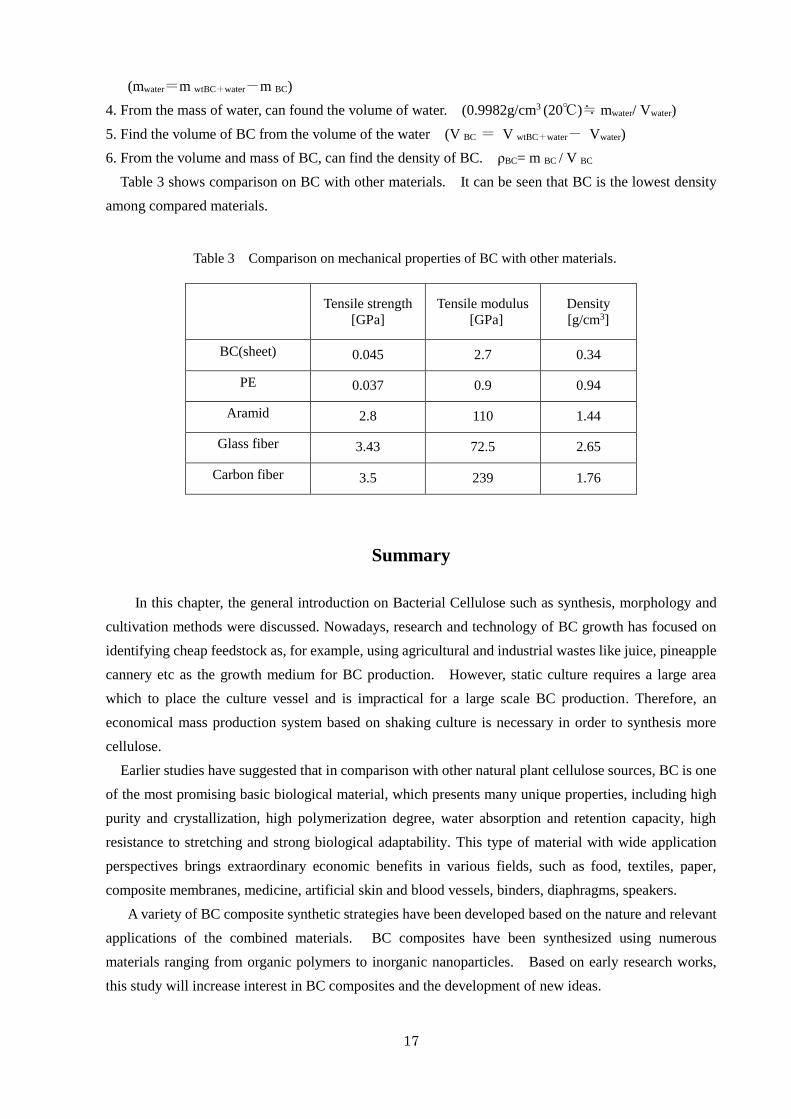
Table 3 shows comparison on BC with other materials. It can be seen that BC is the lowest density
among compared materials.
Table 3 Comparison on mechanical properties of BC with other materials.
Tensile strength
[GPa]
Tensile modulus
[GPa]
Density
[g/cm3]
BC(sheet) 0.045 2.7 0.34
PE 0.037 0.9 0.94
Aramid 2.8 110 1.44
Glass fiber 3.43 72.5 2.65
Carbon fiber 3.5 239 1.76
Summary
In this chapter, the general introduction on Bacterial Cellulose such as synthesis, morphology and
cultivation methods were discussed. Nowadays, research and technology of BC growth has focused on
identifying cheap feedstock as, for example, using agricultural and industrial wastes like juice, pineapple
cannery etc as the growth medium for BC production. However, static culture requires a large area
which to place the culture vessel and is impractical for a large scale BC production. Therefore, an
economical mass production system based on shaking culture is necessary in order to synthesis more
cellulose.
Earlier studies have suggested that in comparison with other natural plant cellulose sources, BC is one
of the most promising basic biological material, which presents many unique properties, including high
purity and crystallization, high polymerization degree, water absorption and retention capacity, high
resistance to stretching and strong biological adaptability. This type of material with wide application
perspectives brings extraordinary economic benefits in various fields, such as food, textiles, paper,
composite membranes, medicine, artificial skin and blood vessels, binders, diaphragms, speakers.
A variety of BC composite synthetic strategies have been developed based on the nature and relevant
applications of the combined materials. BC composites have been synthesized using numerous
materials ranging from organic polymers to inorganic nanoparticles. Based on early research works,
this study will increase interest in BC composites and the development of new ideas.

18
CHAPTER 3. FABRICATION METHOD OF C/C COMPOSITES WITH
BACTERIAL CELLULOSE
3.1. Introduction
3.1.1. Introduction to C/C composites
Carbon fiber-reinforced carbon-matrix composites, so called carbon/carbon (C/C) composites are of
great importance since they possess a variety of unique engineering properties [1-5]. C/C composites
have some characteristics of high specific strength and specific modulus as well as excellent functional
characteristics such as high thermal conductivity and thermal activity, low density (ranging from 1.8 to 2
g/cm3), good wear resistance, self-lubricating capability.
The combination of desirable engineering properties makes C/C composites useful for special
applications such as exit nozzles for rockets, nose caps and leading edges for missiles and space shuttle,
sporting goods, racing car components, disk brakes for racing cars, military and civilian aircrafts.
Currently ~81% of C/C composites are used in aircraft brake discs, ~18% are used in space rocket
technology, and only 1% is used in the rest of application. The extreme tribology requirements for brake
pads have been the impetus for low density of C/C composites, which exhibit a high and stable coefficient
of friction at high sliding speeds.
In addition, C/C composites are lighter compared with the conventional brake pads contribute to the
weight saving the aircraft. Wear processes, which reduce service life of C/C composites, are very
complex, involving the interaction of multiple damage modes that may combine in a variety of ways to
produce various failure modes. It has been reported that, the environment and temperature play a
significant role in determining the tribology behavior of the of the C/C composites as in the case of
carbons and graphite [61-62].
As mentioned above, the purpose of this study is, to develop the nano-C/C composites and Si-C/C
composites with natural fiber and to clarify the effect of heating temperature and third ingredient content
on the tribology and mechanical properties.
Typical fabrication method of the C/C composites
In general, fabrication method of C/C composites is shown Fig. 16, reinforcement (carbon fiber etc.)
and matrix resin (thermosetting resin) are added to mixture, and impregnation is performed in hot press
process for holding [10]. This molded mixture is subjected to heat treatment to carbonize and/or
graphitize to form the composite. However, when carbonizing by heat treatment, matrix resin decomposed
thermally and gasified, so pores are generated in matrix. These pores bring not only a decrease in the
strength of composite, but also a generation of introductory pits for oxygen when the composite is used
as a friction material for brakes to cause oxidation wear at high temperature resulting in deterioration and
further decrease in strength [54]. For solving this problem, at present, such procedure that same kind of

19
thermosetting resin is impregnated into pores and the carbonization repeated 3 to7 times to decrease the
porosity of composites. In the present friction materials with c/c composites, in order to high density
and excellent adhesion between fibers and matrix, CVD (chemical vapor deposition) method is adopted,
wherein hydrocarbon gases are decomposed thermally at 1000°C to 1200°C in a furnace under vacuum
or reduced pressure. Therefore, the decomposed atomic carbon is allowed to intrude into remaining pores
of composites. For this reason, it takes a term of 3 to 4 months to fabricate c/c composites.
Fig. 16 Fabrication process of typical C/C composites.
3.1.2. Fiber bridging effect and model
The most common toughening mechanism that is associated with the incorporation of fibers into a
matrix is fiber bridging [55]. Fig. 17 shows a schematic of fiber bridging mechanism. In fibre reinforced
materials with both brittle fibres and brittle matrices, toughness is derived from two sources. First, if the
crack can be made to run up and down every fibre in its path the there will be a large amount of new
surface created for a very small increase in crack area perpendicular to the maximum principal stress-
interfacial energy - and in order to get the fibres to break they have to be loaded to their fracture strength
and this often requires additional local elastic work, and secondly If the fibres do not break and therefore
bridge the gap then work must be done to pull the fibres out of the matrix – fiber pull-out.
The fibres will bridge the crack and for the crack to extend it is necessary to pull the fibres out of the
matrix. Thus the stored elastic strain energy must do work pulling out the fibres against friction or by
shearing the matrix parallel to the fibres as well as driving the crack through the matrix. In a continuous
fibre composite it is unlikely that all the fibres will have to be pulled out from the matrix since the fibres
Matrix
(resin)
C/C composite
Reinforcement
(fiber)
BC ribbon 3-
Cellulose II
Cellulose I
500~1500°C
Linerly-arranged
Impregnation
CVD
(1000~1200°C
)

20
often fracture. Due to the statistical nature of the defect distribution in the surface of the fibres, not all
fibres will wish to break in the plane of the crack.
Model of fiber bridging effect
The fibers bridge the crack surfaces, when generate stress such as closing the crack surface during the
progress of the crack [55]. Such toughening mechanisms as fiber bridging shown schematically in Fig.
18. First stage the crack will generate in the matrix, and propagate gradually. When a fiber is subjected
to a pullout force, it must first de-bond from surrounding matrix. After de-bonding is completed, fiber
is in the pull-out stage. Then stress is propagated and dispersed to the fiber, and occurs fracture and
pull-out of fiber.
Crack propagation
(a) fiber rupture followed by pull-out, (b) de-bonding and fiber pull-out, (c) fiber
bridging in crack wake (d) crack deflection along fiber-matrix boundary
Fig. 17 Schematic of fiber bridging mechanism.
a. b. c.
d.
BC fiber
Matrix
1. Pull-out bridging
2. Frictional bridging
Fig. 18 Schematic of fiber bridging.
BC fiber
Crack

21
3.2. Fabrication method of the C/C composites with Bacterial Cellulose
3.2.1. Materials and method
a) Bacterial Cellulose (BC)
The reinforcement used in this study is BC which is industrial waste provided by Japanese traditional
vinegar maker []. After removing impurities, the BC gel was washed by water, bleached and sterilized
as shown in Fig. 1. In its native hydrated state, BC gel consists of more than 99wt% water and less than
1wt% cellulose (). By using BC in the fabrication of the c/c composites offers a prospect of lightweight,
ultra-fine reinforcement as well as lower fabrication costs.
In order to reinforce composite materials with BC, the effective processing method is required for
keeping the hydrogen bond between BC and fillers, and physical entanglement of three-dimensionally
oriented BC microfibril networks of nano-scale [56,57].
BC has unique micro-nano porous three dimensional network and micro level layered structures due
to bacteria’s motion. BC microfibril is about 100 times thinner than plant cellulose and artificial carbon
fiber, and Young’ modulus of single BC microfibril with diameters ranging from 35 to 90 nm attains at a
value of 78±17GPa [27]. Nevertheless, the gap size of the texture varied less than about 2µm, and
dimensions of meshes vary within the BC hydrogel of its layered structure.
The structure of BC microfibril consists of gaps with sparse and dense distribution (Fig. 2). This
irregular gap distribution of BC microfibril will effect on mechanical properties of BC based composite
materials.
The structural differences lead to physical property variation, mainly mechanical strength of cellulose
fibres [23,24]. Studies have demonstrated the potential for manipulating the biogenesis of BC in order
to produce modified BC nanofibers with a controlled composition, morphology, and properties [25,26].
Therefore, in this study, in order to improve the gap distribution of BC microfibril and the dispersion of
BP into the BC microfibril gap, BC gel were milled by mixer for 60 seconds to get the fine structure of
BC microfibril.
Fig. 19 shows SEM observations of BC sheet before and after milling. The BC sheet before milling
displayed the coherent morphologies that a small size of gaps and porosities between the microfibril’s, as
shown in Fig. 19 (a). In the cross section observation, BC microfibrils were bound together in the layers.
As seen from Fig. 19 (b), BC sheet possesses the sparse and layered microfibrils structure. It is considered
as, by the milling process, BC gel was milled by less than 1mm, and placed in various direction. As
resulted, the microstructure of microfibrils was changed into specific size and space of network structure,
and much compatible with other nano particle for reinforcing the composites.
As seen from Fig. 19 (c), BC fibers’ morphology was disordered. Based on this results, the milled
BC could be effective in reinforcing the C/C composites.
Sparse

22
b) Phenol resin.
In present study we used an alcohol- soluble, Showa High Polymer Co., LTD , SHONOL, BRS-330
resol type phenol resin. Constitutions of phenolic resin are: non volatile content 60.6%; amount of water
1.3%.
PR are a good source of carbon, therefore the C-yields allow the conversion of phenolic resin resins
based Carbon Fiber Reinforced Plastics (CFRP) to high temperature C-Fiber Ceramics [58].
a) Typical BC
b) BC sheet milled by mixer
c) BC sheet milled by ball-miller
Fig. 19 SEM observations of BC sheet .

23
3.2.2. Impregnation process
Impregnation process of BC and Phenol resin (nano-C/C composites)
After getting a BC from vinegar maker Ota suten, washed with water repeatedly, and keep dipped in
alcohol. Following, mixing the same volume of resol type phenol resin diluted with 50% ethyl alcohol,
and hydrous BC gel. In using the BC as reinforcement, the water in BC gel badly affects to processing
of the composites, especially in the case that the polymer resin is used as a matrix of composites. In this
study used a new method of phenol resin directly immersing into BC gel, called as the Direct
Impregnation Method (DIM) [51,53]. By the DIM method, phenol resin is impregnated into BC
microfibrils gradually, when alcohol had evaporated with water.
In the first stage, mixing the same volume of resol type phenol resin (Shonol BRS-330, manufactured
by Showa high polymer Co., LTD) diluted 50% in ethyl alcohol, and hydrous BC gel.
Fig. 20 shows the schematic diagram of impregnation and drying process on the DIM method. In the
initial stage of impregnation process, phenol resin (Shonol BRS-330, manufactured by Showa high
polymer Co., LTD) were separated from BC microfibril and BP as water and ethyl alcohol. The degree
of this separation reduces with increasing the weight loss of the mixture during the impregnation and
drying processes. The mixture was dried at the room condition less than 25°C for a week in order to
prevent the quick drying of the mixture surface.
Fig. 21 shows the change of mixture weight % against time (day). At the initial stage, the mixture
weight % decreased at about 55% due to the quick evaporation of ethyl alcohol with water.
In the second stage, the mixture was heated in an oven to obtain the desired shape of Si-BC/Phenol
resin pre-impregnation (pre-preg) with BP in the BC microfibril network of three dimensional nano-
structure. To regulate the evaporation of water with ethyl alcohol and drying of the mixture, the heating
temperature was increased from 25°C to 50°C gradually with decreasing the mixture weight %, as shown
in Fig. 21.
The mixture was often dried and hardened on the surface, while the inner interior of the mixture
remains water. Therefore, the stabilization of heating temperature is very important factor to eliminate
remaining water from the mixture.
Finally, the phenol resin is fully exchanged with water in BC gel. By controlling the heating
temperature condition, the impregnation, drying and hardening process became one process of the
fabrication at same time, as resulted, duration of the fabrication process could be shortened.

24
0
10
20
30
40
50
60
70
80
90
100
1 3 5 7 9 1113151719212325272931333537394143454749515355575960
Mix
ture
wei
ght
%
Time (Day)
Mixture weight %
Stage 1. Mixing the matrix and reinforcements
and dry at the room temperature at 25°C. Stage 2. Heat in an oven at 25°C~50°C.
Phenol resin penetrated and impregnated
into BC gel gradually when ethyl alcohol
is evaporated with water molecule.
took out
mixture
from the
holder
BP and phenol resin separated
from BC microfibril by water
and ethyl alcohol.
BC gel
BP
BC microfibril
Phenol resin diluted
with ethyl alcohol
Phenol resin
exchanged
with water.
Fig. 21 Relationship between mixture weight % against time (day).
.
Fig. 20 Schematic of impregnation of Si-C/C composites.
Stage 1. Dry at the room
condition less than 25°C. Stage 2. Heat in an oven at
25°C~50°C.
2
1

25
3.2.3. Hot press process
The hot press provides the thermal energy and mechanical force of compression to consolidate the mat.
Press processing parameters such as temperature, pressure, heating time, cooling system significantly
influences the properties and interfacial characteristics of composites. Therefore, suitable processing
parameters must be carefully selected in order to yield the optimum composite products. Most important
hot press forming parameters that influence the mechanical properties are temperature, pressure and
heating time. The phenolic resin generates water as a reaction by-product via condensation and
chemical reactions such as thermal decomposition, adhesive polymerization during curing at elevated
temperatures. The gas (which also contains water vapor) that resides in the voids of the mat increases
and, evaporated in to mating surface during press process. Material were pressurized and heated,
thereby the binder is allowed to decompose thermally and the reaction of condensation polymerization is
caused to make molded object.
In this study the Lab press machine of P2-30T Toyo Seiki Seisakusho used for hot press process. The
pre-impregnation (pre-preg) was pressed at 160°C, and with 1MPa for 1-2 minutes to degassing several
times, and finally pressed for 30 minutes. Then, FRP plate of brown color is completed (Fig. 22). The
weight loss is about 1~2% after hot press process. The hot press process is performed in Fukushima
Technology Center.
The procedure of hot press process:
1. Weigh and calculate an area of sample [S]
2. Calculate of molding pressure
3. Place a sample with frame into Press machine plate
4. Press at 160°C, and with 1MPa for 1-2 minutes to degassing several times
5. Next press for 30 minutes
6. Take out sample, cool it room temperature
7. Weigh and calculate a sample.
Calculation of molding pressure is given by Eq. [1]
P = 1.08× S × Required pressure ÷ 98.52 [kgf/cm2] (1)
where P= pressure [kgf/cm2], 1.08= loss factor, S= area of samples [cm2 ], 98.52 = Area of the ram
diameter [ cm2]. Samples were weighed before and after press molding, and weight loss is about 1%.
Fig. 22 Samples of before and after press molding.

26
3.2.4. Carbonizing process
Carbonization of phenol resin (C6H5OH)
The phenol resin is a good source of carbon, therefore, used as a carbon source to make carbon/carbon
composite materials. Direct pyrolysis of neat phenolic resins can lead to glassy carbon and micro porous
activated carbons [59]. Fig. 23 shows carbonization mechanism of phenol resin. Above 250°C, cured
phenolic resins begin to decompose.
Decomposition continues up to 600°C, the by products are mostly H2O, CO, CO2 and phenol. T h e
first stage of decomposition produces a porous structure having minimal shrinkage. The second stage
begins near 600°C, and is accompanied by shrinkage and substantial evolution of CO2, H2O,
methane, and aromatics [59-60].
Further heating to about 900°C converts in to a glassy form of carbon that can serve as a binder
for the other carbon forms. The carbon yield from the phenolic resins can be in the range of 60–70%
of the initial weight.
Carbonization of cellulose (C6H10O5)n
Fig. 24 shows the schematic of carbonization of cellulose. The stages of carbonization of cellulose:
1st stage 23°C ~ 240°C formation of H2O.
2nd stage 240°C ~ 400°C formation of H2O, CO, CO2 and occurred a thermal cleavage.
500°C 800°C 1000°C 1500°C
CO2, H
2O H
2O H
2 H
2
H
2
O
H2
Fig. 23 Carbonization schematic of phenol resin.

27
3rd stage 400°C ~ 700°C formation H2 and aromatization.
In this study, in order to clarify the effect of carbonizing and heating rate difference on tribological
properties, the testing specimens were carbonized at various carbonizing and heating rate temperature.
Fig. 25 shows the change of the carbonizing temperature against carbonizing time. The specimen was
heated to 160°C for 1 hour initially, and held for 1 hour to reach the state of thermal equilibrium. After
reaching at carbonizing temperature, and held it for 1 hour again, and cooled down gradually. In this
case, it takes about 109h.
By the carbonizing process, BC microfibrils changed into the carbon fibers of nano-scale, and the
phenol resin became the glassy carbon, which means the composite is a kind of carbon/carbon composites,
that is “nano-C/C composites” (Fig. 35). Method of carbonization as following:
0
200
400
600
800
1000
1200
0 20 40 60 80 100 120
Carb
on
izin
g t
emp
eratu
re
[°C
]
Carbonizing time (h)
2
43
5
1
Stage 1 Stage 3
Stage 2
Fig. 25 Graphic of carbonizing time at example of 1000°C /10°C /h.
Fig. 24 Schematic of carbonization of cellulose.
Fig. 26 C/C composites with BC.
1. Heat to at 160°C for 1 hour.
2. Hold at 160°C for 1 hour to reach
the state of thermal equilibrium.
3. Rise at carbonizing temperature.
4. After reaching at carbonizing
temperature, and hold it for 1 hour
again.
5. Cool down gradually.

28
Summary
In order to reinforce composite materials with BC, the effective processing method is required for
keeping the hydrogen bond between BC and fillers, and physical entanglement of three-dimensionally
oriented BC microfibril networks of nano-scale.
The fabrication method of nano-C/C composites with BC microfbril network of three dimensional
structure remain, was developed and BC gel its applicability to impregnation of phenol resin were
considered in order to apply to the high performance structural components. At each fabrication process,
the parameters such as heating temperature, time and processing method are significantly influence on
the tribology and mechanical properties of the composites. Therefore, suitable processing parameters
must be carefully selected in order to yield the optimum composite products. In this chapter, most
important fabrication parameters which influence on the mechanical properties were developed at each
fabrication stage.

29
CHAPTER 4. THE EFFECT OF CARBONIZING TEMPERATURE ON
MECHANICAL AND TRIBOLOGY PROPERTIES OF NANO-C/C
COMPOSITES
4.1. Tribology and tribology test result
4.1.1. Introduction to tribology
Tribology is the science and technology of interacting surfaces in relative motion and of related subjects
and practices [61]. The word is derived from the Greek word tribos, meaning rubbing, so the literal
translation would be “the science of rubbing”. Its popular English language equivalent is friction and
wear or lubrication science, alternatively used. The latter term is hardly all-inclusive. Main target of
tribology was tabulated in Table 4.
Tribology is the art of applying operational analysis to problems great economics significance, namely,
reliability, maintenance, and wear of technical equipment, ranging from spacecraft to household
appliances [62]. The surface interactions in a tribology interface are highly complex, and their
understanding requires knowledge of various disciplines, including physics, chemistry, applied
mathematics, solid mechanics, fluid mechanics, material science, rheology etc [61,62].
Main target and controls of tribology are: friction, wear and emission. Wear and friction are a
phenomenon that causes damage to surfaces sliding relative to each other and, its level depending on
numerous parameters such as temperature, surface roughness, relative velocity, material, contact pressure,
sliding length, and lubrication [63]. Due to its complexity, it is extremely difficult to formulate
relationships between parameters and the wear and friction process.
In this study, in order to clarify the effect of carbonizing and heating rate difference on tribology
properties, the testing specimens were carbonized at various carbonizing and heating rate temperature, as
shown in Table 5. Fig. 28 shows the schematic of experimental procedure of nano-C/C composites .
1. Control of friction
- Reduce of friction:
- High friction
-Reduction of friction losses due to low friction such as a
cylinder and piston.
- Implementation of high coefficient of friction stable and
friction drive and brake.
2. Control of wear
- Improving wear resistance
- Promotion of wear
-Improving reliability of sliding parts and wear reduction
for long life.
- Removal processing of the work piece on the surface.
3. Control of emission and
lubrication
-Inhibition of emission
-Usage of emission
-Wear particle size, vibration, Lubricant leakage, friction
charge, elimination of environmental burden
substances.
-Frictional noise of instruments, the earthquake
prediction by ground current and frictional heat.
Table 4. Main target of tribology.

30
Results of XRD analysis.
In order to determine a crystallization degree of nano-c/c composites, XRD analysis was performed.
Testing conditions are tabulated in Table 6, and the diffraction pattern was shown in Fig. 27. In this test,
3 types of samples at 700°C, 1000°C and 1100°C were analyzed by XRD analysis. There are 2
diffraction peaks were observed (Fig. 27). The first diffraction peak was observed at 25.4°, and next
diffraction peak at 43.5°. As shown in Table 7, the intensity of diffractions was increased with the
increasing the carbonizing temperature, and the most peak value was observed at 1100°C.
X-Ray, 40kV/40mA
Divergence slit 2/3°
Divergence slit vertical limit 2mm
Scattering slit, 2/3 °
Receiving slit 0.3mm
0
50
100
150
200
250
300
350
400
450
10 20 30 40 50 60 70 80 90
Inte
nsi
ty
2𝜃
700℃
1000℃
1100℃
Carbonizing temperature [°C] Heating rate temperature [°C /h]
800, 900, 1000,1100 10
700, 1000
15
10
5
Temp. 2𝜽
25.4°
2𝜽
43.5°
700°C 258.2 88.2
1000°C 299.6 114.8
1100°C 409.9 172.2
Table 5. Carbonizing and heating rate temperature of nano-C/C composites.
Table 6. Testing condition. Table 7. Result of XRD analysis.
Fig. 27 XRD analysis of nano-c/c composites.

31
Experimental flow
Testing specimen for tribology tester
Test specimens were prepared by using diamond saw initially, and basic geometries of 3.5mm x 3.5mm
x 2.0mm were made by using grinding machine. Fig. 29 shows testing specimen. A fine scale
polishing is the prevailing wear mechanism, flattening both mating surfaces, and which improves their
load-carrying capability. Therefore, the sliding surface of specimens was polished with grinding papers
with 600 grit, and gradually advancing to 800 and 1200 grit. At second stage specimens were performed
with 3.0µ, 1.0µand 0.3µ of grinding polishing. Finally, specimens were cleaned at ethanol cleaning 3
times for 10 min at 50°C by using the Ultrasonic cleaner.
Fig. 29 Testing specimen for tribology tester.
1. SAMPLE PREPARATION
Sample preparation
Surface polishing
2. TRIBOLOGY TEST
Wear rate
Dynamic friction coefficient
3. SURFACE PROFILE MEASUREMENT
Surface roughness test
Worn surface analysis
5. MECHANICAL PROPERTIES
3 point bending test
Hardness test
4. MICROSCOPIC OBSERVATION AND ANALYSIS
SEM observation
EDS analysis
Fig. 28 Schematic of experimental procedure of nano-C/C composites .

32
Pin-on-Drum type tribology tester
In order to examine the wear and friction properties, the wear tests were conducted using the pin-on-
drum type tribology tester, as shown in Fig. 30. The specimen of 3.5mm×3.5mm×2mm square was
sliding on surface of SUS304 drum.
The mechanical properties of SUS304 : Tensile strength 520 MPa, Young's modulus 197GPa, Hardness
327HV, Chemical components C (0.08%), Ni (8~10%), Cr (18~20%).
Sliding conditions were as follows: sliding speed 1.5m/sec, sliding distance 130 km, and contact
pressure 1MPa. Fig. 31 shows the schematic of tribology tester. The torque converter detects by strain
gauge of twisting deformation of the metal shaft (axis). The strain gage is designed to convert
mechanical motion into an electronic signal.
Torque meter
Weight
Sliding drum Motor
A/D converter
Fig. 30 Pin-on drum type tribology tester.
STRAIN
MEASUREMENT
A/D
CONVERTOR
SUS
304 MOTOR
Torque meter Drum
Strain
gauge PC
=
Fig. 31 Schematic of the tribology tester.

33
5.1.2. Measurement of the specific factors of wear elements loss and results
Wear is the surface damage or removal of material from one or both of two solid surfaces in a sliding,
rolling, or impact motion relative to one another. In most cases, wear occurs through surface interactions
at asperities. During relative motion, first, material on the contacting surface may be displaced so that
properties of the solid body, at least at or near the surface, are altered, but little or no material is actually
lost. Later, material may be removed from a surface and may result in the transfer to the mating surface
or may break loose as a wear particle.
Wear is not a material property, it is a system response [61,62]. Wear occurs by mechanical and/or
chemical means and is generally accelerated by frictional heating. Wear includes 6 principals.
1. Adhesive
2. Abrasive
3. Fatigue
4. Impact by erosion and percussion
5. Chemical (corrosive)
6. Electrical arc- induced wear.
There are not distinct mechanisms, but rather combinations of the adhesive, corrosive and abrasive
forms of wear. Wear by all mechanisms, expect by fatigue mechanism, occurs by gradual removal of
material. In many cases, wear is initiated by one mechanism and it may proceed by other wear
mechanisms, thereby complicating failure analysis.
Adhesive wear occurs because of adhesion at asperity contact at the interface. These contacts are
sheared by sliding which may result in the detachment of the fragment from the one surface to another
surface. During sliding, surface asperities plastic deformation and/or fracture.
Abrasive wear occurs when the asperities of a rough, hard surface or hard particles slide on a softer
surface, and damage the interface by plastic deformation or fracture in the case of ductile and brittle
materials, respectively. In many cases, there are 2 general situations for abrasive wear. In the first case,
the hard particle is the harder of two rubbing surface (two-body abrasion); and in the second case, the
hard particle is a third body, generally a small particle of abrasive, caught between the two surfaces and
sufficiently harder that it is able to abrade either one or both of mating surfaces (three-body abrasion).
In many cases, wear mechanism at the start is adhesive, which generates wear particles that get trapped
at the interface, resulting in a three-body abrasive wear. In most abrasive wear situations, scratching is
observed with a series of grooves parallel to the direction sliding.
Wear is expressed in specified units (length, volume, or mass). Wear process is often described by
wear rate. Wear rate can be expressed as:
1. Volume of material removed per unit time, per unit sliding distance, per revolution of a component, or
per oscillation of a body.
2. Volume loss per unit normal force at unit sliding distance [mm3/(N/m)], which is called wear factor.
3. Mass loss per unit time
4. Change in a certain dimension per unit time.

34
5. Relative change in dimension or volume with respect to the same changes in another substance.
In order to determine the wear volume, thickness of the specimen was measured by a micrometer before
and after test. The specific factors of wear element loss [mm2/N] is given by the Eq. (2).
(2)
where W is the wear volume [mm3], P is the normal load [N] and the sliding distance [mm].
The mean value specific factors wear elements loss of the nano-C/C composites at each carbonizing
temperatures are shown in Table 8 and Fig. 32. As seen from Table 8, the mean specific factors of wear
element loss varied between 1.936×10⁻¹⁰ ~ 1.292×10⁻⁹ mm2/N. The mean specific factors of wear
element loss tend to decrease as the carbonizing temperature was increased, as shown in Fig. 32. It is
observed that the specific factors wear elements loss were related to carbonizing temperature. In this
study, in order to clarify the heating rate effect on tribology properties, the testing specimens were
carbonized at heating rate temperatures, such as 5°C,10°C and 15°C at 700°C.
Fig. 33 shows the mean specific factors of wear element loss against heating rate temperature at 700°C.
The lower value was obtained at 10°C/h. It can be seen that the optimum heating rate temperature was
at 10°C/h. The difference in the specific wear rate must be due to the influence of the reinforcement
materials and the difference in the microstructure caused by carbonizing temperature. The wear and
friction mechanism will be explained by SEM observation and EDS analysis of worn surface for
composites and drum SUS304.
Table 8. Mean value of specific factors of wear element loss at carbonizing temperatures.
Carbonizing
temperature [°C]
Heating rate
[°C / h]
Specific factors of wear element loss [mm2/N]
Max val. Min val. Mean val.
700
5 2.01E-9 9.08E-10 1.29E-9
10 9.91E-10 2.36E-10 6.42E-10
15 1.41E-9 1.33E-10 7.6E-10
800
10
1.26E-9 1.75E-10 6.39E-10
900 7.44E-10 1.06E-10 5.01E-10
1000
5 1.01E-10 1.01E-10
10 7.71E-10 9.85E-11 4.36E-10
15 2.23E-9 6.85E-10 1.59E-9
1100 10 2.21E-10 1.9E-10 1.94E-10
LP
WK

35
Mass loss measurement
The samples were measured before and after wear test. Table 9 shows result of mass loss measurement.
The mean mass loss varied between 1.4µg-8.2µg. The higher value of mean mass loss obtained at
700°C/15°C/h, and lower value was obtained at 1100°C/10°C/h.
Carbonizing
temperature [°C]
Heating rate
[°C / h]
Mass loss [µg]
Min val. Max val. Mean val.
700°C
5 2.4 3.9 2.8
10 2 2.4 2.2
15 4.2 17 8.2
800°C 10 1.9 8.4 3.9
900°C 10 2.3 7.9 3.8
1000°C
5 3.3 3.3
10 1.23 5.4 3.6
15 1.95 6.3 4.2
1100°C 10 1.51 1.6 1.6
0.0E+00
2.0E-10
4.0E-10
6.0E-10
8.0E-10
1.0E-09
1.2E-09
1.4E-09
700℃ 800℃ 900℃ 1000℃ 1100℃
Sp
ecif
ic f
act
ors
of
wea
r
elem
ent
loss
[m
m2/N
]
Carbonizing temperature
0.0E+00
5.0E-10
1.0E-09
1.5E-09
2.0E-09
2.5E-09
5℃/h 10℃/h 15℃/hSp
ecif
ic f
act
ors
of
wea
r
elem
ent
loss
[m
m2/N
]
Heating rate temperature
Fig. 32 Specific factors of wear element loss against carbonizing temperature.
Fig. 33 Specific factors wear element loss against heating rate temperature at 700°C.
Table 9. Mass loss of nano-c/c composites.

36
4.1.3. Measurement of the dynamic friction coefficient and results
During the wear test, the friction coefficient was monitored as a function time. The converter has
been established to testing machine, and friction torque [T] can be found that internal coefficient
multiplied by to a value of converter output (Eq. 2). The friction coefficient (µ) can be determined with
a friction torque. The testing condition: Sliding speed 1.5m/sec, Sliding distance 130km, Contact
pressure 1MPa, Mating surface roughness of SUS304 Ra= 0.3~0.5μm, Surface roughness of composites
and contact drum SUS304 Ra= 0.3~0.5μm, and Radius of drum 50mm.
𝐹 = µ × 𝑃 , 𝑇 = 𝑅 × 𝐹 µ =𝑇
𝑃×𝑅 (3)
where P is normal load [N] and R is radius of drum [mm].
The result of dynamic friction coefficients is tabulated in Table 10. The mean friction coefficient of
composites varied between 0.16 ~ 0.21 depending upon the carbonizing temperature and heating rate
temperature. As a testing results, the lower friction coefficient was obtained at 800°C with 0.16, and
higher value at 700°C/15°C/h with 0.27.
Fig. 34 shows the change of mean friction coefficient against carbonizing temperature. From this
figure, the mean friction coefficient tended to decrease until 900°C and increased up to 0.21 at the 1100°C.
The mean value of friction coefficient against heating rate temperature at 700°C shows in Fig. 35. The
mean friction coefficient exhibited higher value at 700°C/5°C/h and 700°C/15°C/h. Therefore, it was
found that the optimal heating rate for the lower friction coefficient is 10°C/h.
The change of friction coefficient against sliding distance is shown in Fig. 36. It is suggested that the
friction coefficient was independent on the carbonizing temperature. Fig. 37 shows the change of
friction coefficient against sliding distance. For the samples at 15°C/h exhibited same frictional
behavior and obtained higher value with 0.27. In the case of 5°C/h, friction coefficient decreased at the
beginning from test until 0.15, after that varied at 0.15~0.19. It can conclude that friction coefficient
and friction behavior were related to not only carbonizing temperature, but also heating rate temperature.
P
F
T
R

37
Carbonizing
temperature [°C]
Heating rate
[°C / h]
Friction coefficient μ
Min. value Max. value Mean value
700
5 0.170 0.230 0.194
10 0.150 0.260 0.181
15 0.171 0.274 0.215
800 10 0.136 0.206 0.175
900 10 0.150 0.183 0.163
1000 5 0.256 0.256
10 0.145 0.187 0.170
15 0.165 0.375 0.231
1100 5 0.203 0.229 0.212
0
0.05
0.1
0.15
0.2
0.25
0.3
700°C 800°C 900°C 1000°C 1100°C
Fri
ctio
n c
oef
fcie
nt
µ
Carbonizing temperature
Mean value
0
0.05
0.1
0.15
0.2
0.25
0.3
5°C 10°C 15°C
Fri
ctio
n c
oef
fici
ent
Heating rate temperature
Mean value
Fig. 34 Friction coefficient against carbonizing temperature.
Fig. 35 Friction coefficient against heating rate temperature at 700°C.
Table. 10 Mean dynamic friction coefficient at each carbonizing temperatures.

38
0.1
0.15
0.2
0.25
0.3
0 10 20 30 40 50 60 70 80 90 100 110 120 130
Fri
ctio
n c
oef
fici
ent
μ
Sliding distance L [km]
700℃(0.195) 800℃(0.170) 900℃(0.166)
1000℃(0.179) 1100℃(0.21)
0.1
0.15
0.2
0.25
0.3
0 10 20 30 40 50 60 70 80 90 100 110 120 130
Fri
ctio
n c
oef
fici
ent µ
Sliding distance L [km]
5℃ 10℃ 15℃
Fig. 37 The change of dynamic friction coefficient against sliding distance with
parameters of heating rate temperature at 700°C.
Fig. 36 The change of dynamic friction coefficient against sliding distance with parameters
of carbonizing temperature.

39
4.2. Morphology analysis
4.2.1. Surface roughness analysis and results
The geometry of contact surface changed as a result of wear behavior. Wear is expressed in amount
of volumetric material removed and can be measured by several methods with different accuracies: mass
loss measurements, two dimensional (2D) and three dimensional (3D) topographical analysis.
The surface roughness parameters and surface topographical features are strongly correlate with
friction coefficient and wear volume. The surface roughness of the specimens was measured by using
Mitutoyo surface roughness tester, before and after completing each one of the wear tests for morphology
analysis. Testing conditions are : Sliding distance: 2.5mm, Speed :0.5mm/s, Testing score: 5600, Testing
standard : JIS2001. Ra (roughness average), and Ry (maximum height of profile), as shown in Fig. 38
were used in this experiment,.
Surface roughness measurement
Worn track measurement
In order to determine the wear mechanisms and worn surface topography on each sample as well as to
measure the wear track thickness, surface roughness tester was performed. Fig. 39 shows the wear track
of specimen after wear test. Ry is Scratch depth. Result of wear track measurement show in Table 10.
Ra
Reference length L
Ry
Ra=1
𝐿∫ [𝑓(𝑥)]𝑑𝑥
𝐿
0
Sliding
sample
SUS
304
Fig. 39 Wear track of sliding sample.
Ry = Wear track depth
[µm]
Sliding
sample
SUS30
4
Ry
Fig. 38 Schematic of surface roughness measurement.

40
Temp. Surface roughness graphic Wear track graphic
70
0℃
/5℃
/h
70
0℃
/10℃
/h
70
0℃
/15℃
/h
800℃
/10℃
/h
900℃
/10℃
/h
10
00℃
/10℃
/h
11
00℃
/10℃
/h
Fig. 39 Surface roughness and wear track profile after wear test.
Ra=0.41μm; Ry=4.64 μm
Ra=0.54 μm; Ry=4.58 μm
Ra=0.88 μm; Ry=5.56 μm
Ra=1.55 μm; Ry=12.95μm
Ra=1.23 μm; Ry=6.75 μm
Ra=0.51 μm; Ry=5.05μm
Ra=2.1μm; Ry=9.94μm
Ra=1.83 μm; Ry=15.12 μm
Ra=0.42μm; Ry=3.39μm
Ra=0.69μm; Ry=4.64μm
Ra=2.21 Ry=11.61
Ra=2.25 μm; Ry=12.95 μm
Ra=2.29μm; Ry=19.26μm
Ra=2.07 μm; Ry=18.48μm

41
4.2.2. Surface analysis of the composites and drum surface SUS304
Wear and friction are a complex process of material removal from the interface of drum surfaces under
sliding motion. In order to understand wear and friction behavior, worn surfaces of composites and
drum surface of SUS 304 were observed by using SEM after wear test. Figs. 40 and 41 show the SEM
observation of worn surfaces.
The worn surface of 700°C/10°C (Fig. 40) reveals typical abrasive wear with shallow scratches about
1~2µ (Ra=1.8µ) produced by scuffing of wear debris powder. On the drum surface 700°C/10°C (Fig.
41), a large amount of wear debris generated during sliding and adherent to mating surface, as resulting
leading to high wear rate. In Fig. 40, worn surface of 700°C/10°C was relatively smooth, where the Ra
is 0.54µm. It is considered as pits and pores are totally filled with wear particles, therefore a coherent
debris layer giving a relatively flat surface. Result of EDS analysis, as shown in Fig. 41, a lot of amount
of Carbon (35.6%) detected in drum surface.
On the worn surface of 800°C/10°C observed a few wear scars/damages, and depth micro crack about
15µm, as shown in Fig. 40. In addition, result of EDS analysis (Fig. 41), 37.85% of Carbon detected on
drum surface. It is considered that wear particles at the sliding surface were dramatically changed
friction and wear behavior and surface morphology.
On the sliding surface of 900°C, pitting and cracks of few micron meter in length occurred in several
places, and the surfaces show the highest roughness with Ra=1.55µm. It shows that a rough surface
accompanied by lot wear debris beside the wear groove. On the drum surface of 900°C, the surface
damage was observed due to hard particle. According to the EDS analysis of SUS304, the lower content
of Carbon (10.9 %) detected on the drum surface. It is confirmed that wear behavior of 900°C is the
abrasive wear mechanism.
As shown in Fig. 40, for the worn surface of nano-C/C composites at 1000℃, the several deep scratches
and cracks of few micrometers in length were observed. At the high magnification observation, the
cracks with several micrometers in length were induced on the worn surface, and many BC microfibril
were observed inside the crack. The cause of the extremely low appearance of crack is due to a
contribution of nano scale BC fiber bridging. From the fundamental aspects, if the interaction between a
growing crack and the BC microfibril can absorb a fraction of the energy available at the crack tip stress
field, then crack propagation will be affected. In other words, BC played important role to reduce crack
opening displacement, and as a result, the crack propagation will be blunted.
Many wear scars observed on the worn surface of 1100°C, and wear behavior was similar to sample
1000°C. The decrease in the specific factors of wear elements loss is mainly due to the abrasive wear
particles. It is considered as the adhesive wear mechanism occurred in lower temperature (700°C,
800°C), and it tends to change into abrasive wear mechanism gradually with increasing carbonizing
temperature.
The surface morphology strongly depends on the mechanism on the wear process, and which also
depends on the both material properties such as hardness etc. It was found that the wear mechanism
tended to change from adhesive to abrasive wear mode with increasing carbonizing temperature.

42
Temp. (a) (b) (c)
700°C
/5°C
700°C/
10°C
700°C
/15°C
800°C
900°C
1000°C
1100°C
Ra=1.55μm
Ra=1.23μm
Ra=0.51μm
Ra=0.41μm
Ra=0.88μm Ra=1.83μm
Fig. 40 SEM observation of sliding surface of nano-C/C composites.
Ra=0.15μm

43
40.1%
700°C/10°C 800°C/10°C 900°C/10°C
a)
b)
c)
d)
Wear debris Wear debris Wear debris
35.16% 37.85% 10.9%
54.1%
Fig. 41 SEM observation of SUS304 of carbonizing temperature at 700°C/10°C, 800°C/10°C and
900°C/10°C; a) worn surface b) worn surface and adherent debris c) EDS analysis of carbon
distribution and d) EDS analysis of iron distribution.
34.58%

44
4.3. Mechanical properties of the nano-c/c composites
4.3.1. Vickers hardness test and results
Hardness defines the load concentration at the asperities and whether material removal can occur by
fracture depends on toughness. In this study, Vickers hardness of nano-C/C composites was measured
by using Vickers hardness testing machine. The Vickers hardness is determined by measuring the size
of an indentation made by a sharp diamond pressed strongly onto a material specimen. The Vickers
hardness is a resistance value obtained by pressing a diamond indenter onto a test specimen, and given
by Eq. (6).
The Vickers hardness testing conditions are: Apply load 19.61N, Load holding time 20s, Surface
roughness 0.1µ, and Sample size 3.5×3.5mm.
𝐻𝑉 = 0.102𝐹
𝑠= 0.102
2𝐹𝑠𝑖𝑛𝜃
2
𝑑2 = 0.18909𝐹
𝑑2
where F is allowed load , and d is the mean diagonal length d = (d1+d2) / 2
The Hardness test results were shown in Fig. 42. Hardness tests were performed 5 times in each
samples, and mean value varied in 216~416HV.
The results indicated that as increasing the carbonizing temperature, the specific factors of wear
elements loss decreases monotonically, whether the friction coefficient indicates the almost constant
against carbonizing temperature, as shown in Fig. 43. Holm formulated the wear equation of the volume
of the material removed (W) is directly proportional to the sliding distance, the normal pressure and the
wear coefficient, and inversely proportional to the hardness of the surface.
𝑊 =𝑘𝑃𝐿
𝐻 (7)
where k is the value of coefficient, P is the contact load[N], L is the sliding distance[mm], H is the
Hardness [HV]. The agreement between values estimated by Holm’s equation (3) and the experimental
ones are fairly good as shown in Fig. 43.
100
150
200
250
300
350
400
450
700/5 700/10 700/15 800/10 900/10 1000/10 1100/10
Vic
ker
s h
ard
nes
s [H
v]
Carbonizing temperature/Heating rate temperature
(6 )
Fig. 42 Vickers hardness value against carbonizing temperature.

45
4.3.2. Three point bending test result
Three point bending test of nano-C/C composites was performed using Instron 5543 testing machine.
The sliding conditions were as follows: Close velocity 0.2mm/min, Span length 48mm, Data
measurement frequency 10Hz, Indenter radius as 5mm, Room temperature 25℃. The geometry of the
bending specimen was 80×20×4mm. The bending strength calculated from Eq. (4), and bending strain
calculated from Eq. (5).
𝜎𝑓 =3𝐹𝐿
2𝑏ℎ2 ( 4) 𝜀 =
6𝑠ℎ
𝐿2 (5)
where L is the support distance, F is the bending load, h is the thickness of specimen and b is width of
specimen.
Although mean flexural strength varied at 3~10MPa, but the specific bending strength displayed high
value around 4400~10000MPa because of low density. As seen from Fig. 44, specific bending strength
increased with increasing carbonizing temperature. Figs. 45 and 46 show the fracture surface of
specimens. As shown these figures, in a brittle material a propagating crack can depart from its original
straight trajectory and curve or split into two or more branches. Under very high states of stress, the
propagating crack will divide into a river delta crack pattern [67].
It was found that all fracture surfaces exhibited brittle fracture cleavage with a chevron pattern
pointing toward fracture origin. In a comparison these images, by the increasing carbonizing
temperature cross section tend to smooth and more shrinkage.
Moreover, on the fractured surface, uniformly distribution of BC microfibrils, BC pull-outs and
debonding were observed. It is considered that the cause of the high specific bending strength is due to
the contribution of nano-scale carbonized BC fibres.
200
250
300
350
400
450
1 2 3 4 5 6 7 8
Vic
ker
s h
ard
nes
s [H
v]
Specific factors of wear elements loss x10-10 [mm2/N]
Vickers
hardness
Fig. 43 Specific factors of wear elements loss against Vickers hardness.
Holm’s eq.
Holm’ eq.

46
Summary
The wear characteristic of nano-C/C composites is related to the heating rate, in addition to the
carbonizing temperature. The heating rate temperature at 10°C/h was the excellent on the wear
characteristic. From the experimental results, the mean friction coefficient took the values in the range
0.16 ~ 0.19, and the specific factors of wear element loss was 3.38×10⁻¹⁰~ 7.74×10⁻¹⁰ mm2/N during tests.
The Vickers hardness test result indicated that as increasing the carbonizing temperature, the specific
factors of wear elements loss decreases monotonically, whether the dynamic friction coefficient indicates
the almost constant against carbonizing temperature. It can be concluded that from the point view of
friction, nano-C/C composites can be used as composite materials for sliding of mechanical elements, for
example, a motor bearing, and a robot-hand system of humanoid robots.
Fig. 45 Microscope images of fractured surface at 25-X magnification.
(a) 700°C/10°, (b) 800°C/10°, (c) 900°C/10° and ( d) 1100°C/10°C
(a)
Fig. 46 Fractured surface of sample at 1000ºC.
(b) (c) (d)
Fig. 44 Specific bending strength against carbonizing temperature.
0
2000
4000
6000
8000
10000
12000
700/10 800/10 900/10 1000/10 1100/10
Sp
ecii
fc b
end
ing
str
en
gth
[Nm
/kg
]
Carbonizing temperature
Mean value

47
CHAPTER 5. DEVELOPMENT OF THE Si-C/C COMPOSITES WITH
BAMBOO CHARCOAL PARTICLES AND TRIBOLOGY PROPERTIES.
5.1. Introduction
“Green tribology” is a new, separate research area that is emerging, and it is defined as the science and
technology of the tribological aspects of ecological balance and of environmental and biological impacts.
In recent years, we have a problem that the depletion of natural resources causes by large consumption
of energy, and global warming cause by greenhouse gases. Therefore, effective utilization of biomass
resources friendly to natural environment is attracting wide attention [9-11,64].
The ceramic matrix composites (CMC), based on reinforcements of carbon fibers and matrices of
silicon carbide represent a relatively new class of structural materials. Besides high mass specific
properties and high thermal stability, functional properties like low thermal expansion and good
tribological behavior play an increasing importance for new commercial applications like brake disks and
pads, clutches, calibration plates or furnace charging devices.
Bamboo is another abundant and renewable natural resource. Bamboo charcoal particle is often used
to make BC fibers used extensively in making clothes, socks, and towels in Taiwan and China. Because
these BC fibers maintain their functional ability as effective adsorption media, they eliminate odors,
improve air quality, exhibit bacteriostatic properties, block electromagnetic radiation, and regulate
temperature and humidity effects [64].
Bamboo charcoal contains many pores and gaps in its structure, making it excellent for absorption,
electromagnetic shielding and infrared emission. The bamboo charcoal also contains ions, such as the
anions calcium, Si, sodium and iron, and is of use in water and air purification and improving the acidity
condition. Si based materials have been widely used in the sliding and friction application for their high
mechanical properties. Si based materials such as silicon and silicon carbide are well known for their
high mechanical properties (Young’s modulus >185GPa, Mohs’ hardness >7) [16,64,65].
Fillers can improve tribology properties of polymers and one of the fillers that is used to reinforce
polymers is SiO2 [66]. In order to improve the mechanical properties of natural-fiber based composites,
one of the method is to produce hybrid composites by combining several types of reinforcements/filler
with polymers [12]. Both BC and bamboo are plentiful, relatively cheap, renewable, biodegradable, and
relatively non-toxic and sustainable products. Therefore, the aim of this research is to evaluate if the
incorporation of bamboo charcoal would lead to a high-performance sliding composite material.
In this chapter, to improve the tribological properties of nano-C/C composites, the Si-C/C composites
with Bamboo charcoal particles (BP) and Bacterial cellulose (BC) is developed. In order to clarify the
effect of BP content and carbonizing temperature on the tribological and mechanical properties, the
testing specimens were carbonized at temperatures 700°C/10°C~1000°C/10°.

48
5.1.1. Materials
1. Bacterial Cellulose (BC)
In order to improve the dispersion of BP into the BC microfibril gap and to get fine structure of BC
microfibril, BC gel was milled by mixer for 60 seconds.
Fig. 47 shows SEM observations of BC sheet after milling. The BC sheet before milling displayed
the coherent morphologies that a small size of gaps and porosities between the microfibril’s, as shown in
Fig. 47 (a). In the cross section observation, BC microfibrils were bound together in the layers (Fig. 47
(c)). It was found that the milling by mixer BC gel, the microstructure of microfibrils was changed into
specific size and space of network structure, and much compatible with other nano particle for reinforcing
the composites.
2. Bamboo Charcoal Particle (BP)
The secondary reinforcement of composites is Bamboo charcoal (Mousou bamboo), which is produced
in the Chikutan Kougei Miyabi Co., LTD, Fukushima prefecture. In order to reinforce composite
materials with BC, the effective processing method is required for keeping the hydrogen bond between
BC and fillers, and physical entanglement of three dimensionally oriented BC microfibril networks of
nano-scale [51,53]. Bamboo charcoal contains hydrophobic macro-particles that are subject to
aggregation in an aqueous environment, and this characteristic may make bamboo charcoal difficult to
be uniformly dispersed in the matrix [64].
To start with, by using a ball-miller, the Bamboo charcoal was milled in size of less than 2µ to fill and
impregnate into gap of BC microfibril. Fig. 48 shows SEM observation of milled Bamboo charcoal
particle (BP). The average BP particle size were as less than 2µm.
Fig. 47 SEM image of BC sheet milled by mixer.
Fig. 48 SEM observations of milled Bamboo charcoal Particle (BP).
a) b) c)

49
Fig. 49 shows BC sheet in presence of the milled BP. As seen from this figure, BP were entrapped
into BC microfibrils network, and formed a stable structure. Further, it can be observed that with the
comparison of BC microfibril and BP size, and BP is able to entrap into the BC microfibril network.
5.1.2. The fabrication method of the Si-C/C composites
In this chapter, the fabrication method of Si-C/C composites and the effect of BP content on tribology
and mechanical properties were investigated. The experimental flow chart of the Si-C/C composites is
shown in Fig 50.
.
1. BP was milled by using a ball-miller in size of less than 1µ
by using ball-miller.
2. To improve dispersion of the BC microfibril into phenol resin, BC gel
was milled by using mixer for 60 sec.
3. BC gel and BP were mixed into the resol type phenol resin diluted
with the same volume of ethyl alcohol as the phenol resin.
Milled
BC gel
4. Then the mixture was degassed in a vacuum dryer and
dried and hardened at set temperature.
5. Hot press process of pre-preg
6. Carbonizing process of FRP.
Fig. 50 The fabrication process of the Si-C/C composites.
Fig. 49 BC sheet with milled BP and BC.

50
By using the BC as reinforcement, the water in BC gel badly affects to processing of the composites,
especially in the case that the polymer resin is used as a matrix of composites. The function BC-based
nanocomposites can also be formed through the ex situ and in situ introduction of different components
by the solution impregnation method.
In this study, the phenol resin (Shonol BRS-330, Showa high polymer Co., LTD) with BP were
impregnated into BC gel by using the Direct Impregnation Method (DIM) [51,53]. BC gel and BP were
mixed into the resol type phenol resin diluted with the same volume of ethyl alcohol as the phenol resin.
Then the mixture was degassed in a vacuum dryer at the earlier stage of drying.
In order to clarify the effect of BP microfibril wt% content on tribology properties, BP with 1wt%,
5wt% and 8wt% were impregnated where the weight content of BC microfibril was constant of 1wt% in
phenol resin. The detailed impregnation and drying process of the C/C composites were discussed in
chapter 3.2.2.
In order to obtain a void free composite material, a pre-preg was pressed a pressure of 1MPa at 160°C.
FRP degassed several times for 1~2 minutes, and then pressed for 30 minutes which resulted in the Si-
BC/Phenol resin FRP plate. Finally, the FRP plates were carbonized in an inactive gas environment at
a heating rate of 10ml/min of nitrogen, then we had the “Si-C/C composites” with a new structure using
natural fibers. In this study, in order to clarify the temperature effect on tribology properties of the Si-
C/C composites, the test specimens were carbonized at 700°C to 1000°C, and the heating rate was 10°C·h-
1. Total 12 kinds of samples were prepared and BP content and carbonizing temperature effect on the
tribology and mechanical properties were investigated, as shown in Table 11.
Carbonizing temperature BP wt%
700°C
1wt% 5wt% 8wt%
800°C
900°C
1000°C
Result of XRD analysis.
In order to determine the crystallization degree of nano-C/C composites, XRD analysis was
performed. Testing result tabulated in Table 12, and the diffraction pattern shown in Fig. 51. There
are 2 diffraction peaks were observed. The first diffraction peak observed at 24~25°, and next
Table 11. Carbonizing temperature and BP wt% content of Si-C/C composites.

51
diffraction peak at 43~44°. The most peak intensity observed 431 in sample of 1000°C, and pattern was
sharped to comparison other samples. In comparison with nano-C/C composites, the crystallization
degree was improved in 700°C and 1000°C, and intensity of diffractions was tending to increase with the
increasing carbonizing temperature.
Preparing testing specimen for tribology test
The preparing process and geometry of testing specimen for tribology test are same to nano-C/C
composites, as discussed in Chapter 4.1.1. Testing specimens were prepared by using diamond saw
initially, and basic geometries of 3.5mm x 3.5mm x 2.0mm were made by using grinding machine.
A fine scale polishing is the prevailing wear mechanism, flattening both mating surfaces, and which
improves their load-carrying capability. Therefore, the sliding surface of specimens was polished with
grinding papers with 600 grit, and gradually advancing to 800 and 1200 grit. At the second stage
specimens were performed with 3.0µ, 1.0µand 0.3µ of grinding polishing. Finally, specimens were
cleaned at ethanol cleaning 3 times for 10 min at 50°C by using the Ultrasonic cleaner.
0
50
100
150
200
250
300
350
400
450
500
10 20 30 40 50 60 70 80 90
Inte
nsi
ty
𝟐𝜽
700°C
800°C
900°C
1000°C
Temp. 2𝜽
24~25°
2𝜽
43~44°
700°C 314 116
800°C 275 120
900°C 370 155
1000°C 431 172
Table 12. Result of XRD analysis.
Fig. 51 Result of XRD analysis.

52
5.2. Tribology test and results.
5.2.1. Measurement of the specific factors of wear element loss and results
To examine the wear and friction properties of the Si-C/C composites, wear test was conducted with
pin on drum type tribology tester according to the ASTM D7788 standard. In order to determine the wear
volume, thickness of the specimen was measured by a micrometer before and after test. The specific
factor of wear element loss [mm2/N] is given by the Eq. (2) discussed in Chapter 4.1.2.
where W is the wear volume [mm3], P is the normal load [N] and L is the sliding distance [m].
The data of specific factors of wear element loss and mean dynamic friction coefficient against BPwt%
tabulated in Table 13. Wear test was performed 4~5 times at each sample. As seen from Table 13, the
mean specific factors of wear element loss varied between 2.25×10⁻¹⁰ ~ 1.39×10⁻⁹ mm2/N. For
specimens carbonized at 700°C with 8wt% BP, valid results could not be obtained from the wear test due
to high friction coefficient. This might be caused by because of the high weight content of BP and low
carbonizing temperature.
Fig. 52 shows the specific factors of wear elements loss against carbonizing temperature as parameters
of BP wt%. The composites with 5wt% BP had the lower wear rate of 2.25×10⁻¹⁰ ~ 6.02×10⁻¹⁰ mm2/N,
while the sample with 8wt% BP exhibited high wear rate in ranges 4.40×10⁻¹⁰ ~ 1.39×10⁻⁹ mm2/N. In
this experiment, the optimum temperature was 1000°C, and the optimum BP content was 5wt% to obtain
lower wear rate.
As clearly shown in Fig. 53, the lower specific factors of wear element loss with smaller scatter were
also observed for specimens of 5wt% BP. This means that the specific factors of wear element loss of
Si-C/C composites were closely correlated with not only BP wt%, but also carbonizing temperature. It
was considered that carbonization degree and microstructure of composites were changed, and can have
the higher bonding strength between reinforcements and matrix. In this experiment, the specimen at
1000°C with BP 5wt% exhibited the lowest specific wear rate, therefore we performed the EDS analysis
of the worn surface.
Fig. 54 shows the SEM observation and EDS analysis of Silicon (Si) and Carbon (C) distribution on
the worn surface. A fine uniform distribution of Si was observed over the worn surface, and relatively
high intensity of Si was detected on the scratched region. This confirmed that the existence and fine
distribution of BP, and Si could improve the wear resistance of the Si-C/C composites at 900°C with BP
5wt%, as resulted, lower wear rate was exhibited.
LP
WK
(2)

53
Temp. 1wt% 5wt% 8wt%
700°C 4.40×10⁻¹⁰ 4.05×10-10 x
800°C 9.66×10⁻¹⁰ 5.20×10⁻¹⁰ 1.39×10⁻⁹
900°C 6.74×10⁻¹⁰ 3.08×10⁻¹⁰ 4.40×10⁻¹⁰
1000°C 8.27×10⁻¹⁰ 2.85×10⁻¹⁰ 1.12×10⁻⁹
0.0E+00
2.0E-10
4.0E-10
6.0E-10
8.0E-10
1.0E-09
1.2E-09
1.4E-09
BP1wt% BP5wt% BP8wt%
Sp
ecif
ic f
acto
rs o
f w
ear
elem
ent
loss
[m
m2/N
]
BP wt%
Mean value
0.0E+00
2.0E-10
4.0E-10
6.0E-10
8.0E-10
1.0E-09
1.2E-09
7 0 0°C 8 0 0°C 9 0 0°C 1 0 0 0°CSpec
ific
fac
tors
of
wea
r el
emen
t
loss
[m
m2/N
]
Carbonizing temperature
BP 1wt% BP 5wt%
BP 8wt%
Table 13. Mean specific factors of wear element loss of Si-C/C composites.
Fig. 52 Mean specific factors of wear elements loss against BP wt% with
parameters at different carbonizing temperatures.
Fig. 53 Specific factors of wear element loss against BP wt% carbonized at 1000°C.

54
5.2.2. Measurement of dynamic friction coefficient and results
The data of mean dynamic friction coefficient μ is shown with parameters of BP wt% and carbonizing
temperatures in Table 13. For specimens carbonized at 700°C with 8wt% BP, no valid results could be
obtained from the wear test due to high friction condition. This might be caused because of the bad
fabrication due to high weight content of filling BP and low carbonizing temperature. As seen in Table
13, the mean dynamic friction coefficient varied between 0.15 ~ 0.29 and these depend upon carbonizing
temperature and BP wt%.
Fig. 55 shows mean dynamic friction coefficients against BP wt% at different carbonizing temperatures.
The lowest friction coefficient of 0.15 was obtained for the specimens at 900°C with BP 5wt%, and a
higher value of 0.29 was obtained at BP 8wt%. These results show that the Si-C/C composites with BP
5wt% and carbonizing temperatures at 900°C and 1000°C showed low wear rates and dynamic friction
coefficients among the investigated composites. The difference in the friction coefficient must be due
to the influence of the reinforcement materials and the difference in the microstructure caused by
carbonizing temperature.
Fig. 56 shows the changes of dynamic friction coefficient of the sample carbonized at 900°C. As
seen from this figure, the specimens with BP 1wt% and 5wt% showed steady curves with plateau, and
exhibited low friction coefficients of 0.16, 0.17 and 0.14, respectively. On the other hand, specimens
with BP 8wt% exhibited fluctuation in range of 0.18 ~ 0.32. This was due to microstructural changes and
related BP wt%. In this experiment, all samples with 5wt% BP were exhibited lower friction coefficients,
and showed the steady-state sliding curve during the wear test. These results show that the Si-C/C
Fig. 54 EDS analysis of worn surface of Si-C/C composites with BP 5wt%
carbonized at 1000°C.
BP wt% carbonized at 1000°C.
Ca
Si

55
composites with BP 5wt% and carbonizing temperatures at 900°C and 1000°C displayed low wear rates
and dynamic friction coefficients among the investigated composites. The wear and friction mechanism
must be explained by observing the worn surface by SEM.
Carbonizing
temperature
BP wt% content
1wt% 5wt% 8wt%
700°C 0.288 0.17
800°C 0.266 0.165 0.223
900°C 0.18 0.154 0.201
1000°C 0.185 0.17 0.210
0
0.05
0.1
0.15
0.2
0.25
0.3
0.35
700°C 800°C 900°C 1000°C
Fri
ctio
n c
oef
fici
ent
Carbonizing temperature
1wt% 5wt% 8wt%
0.1
0.15
0.2
0.25
0.3
0.35
0 10 20 30 40 50 60 70 80 90 100 110 120 130
Fri
ctio
n c
oef
fici
ent
Sliding distance [km]
1wt%(0.174) 5wt%(0.145)
8wt%(0.223)
Table 13 The mean value of dynamic friction coefficient.
Fig. 55 Mean dynamic friction coefficient against carbonizing temperature.
Fig. 56 The changes of dynamic friction coefficient μ for specimen against
sliding distance with parameters of different BP wt%.

56
5.2.3. Surface roughness test results
The surface roughness of the specimens was measured by using Mitutoyo surface roughness tester
before and after wear tests for sliding surface profile analysis. Testing condition same to the nano-C/C
composites testing condition, discussed in Chapter 4.3.1. The mean roughness surface parameters (Ra,
Ry) of sample (BP 5wt%) after wear test were shown in Fig. 57. The mean surface roughness average
Ra varied at 0.90~3.1µm, and the mean scratch depth Ry varied at 7.4 ~ 38µm. The mean Ra values of
wear track is varied at 1.98~2.17µm, and Ry varied at 10.1~14.7µm. The surface roughness graphic
and wear track graphic are shown in Fig. 57.
Surface roughtness profile Wear track profile
70
0°C
800°C
900°C
1000°C
Ra=3.34µm; Ry=30.8µm
Ra=0.86µm; Ry=8.2 µm
Ra=1.72 µm; Ry=16.9 µm
Ra=1.02µm; Ry=25.1µm
Ra=2.1µm; Ry=9.94µm
Ra=2.2µm; Ry=15.8µm
Ra=2.14µm; Ry=11.1 µm
Ra=2.01µm; Ry=10.7µm
Fig. 57 Surface roughness and wear track profile of Si-C/C composites (BP 5 wt%)

57
5.2.4. The effect of carbonizing temperature on wear and friction properties
In order to clarify the effect of carbonizing temperatures, the worn surface of the composites with
different carbonizing temperature was examined. Fig. 58 shows SEM images of worn surface Si-C/C
composites with BP 5 wt%. In this experiment, the Si-C/C composites with BP 5wt% exhibited good
results on tribology test, therefore, worn surface observed after wear and bending test. In order to examine
wear and friction mechanism, the worn surfaces of Si-C/C composite (BP 5wt%) sliding drum SUS304,
and EDS analysis were performed. Fig. 59 shows SEM observations and EDS analysis of drum surface
SUS304.
Moreover, wear debris observation and EDS analysis were shown in Fig. 60. The worn surface of the
specimen at 700°C was rough with the plough and surface delamination. A lot of wear debris particles
were observed over the sliding surface of the specimen carbonized at 800°C. With the temperature
increased to 900°C, it was observed that worn surface seems to be dense and that the surface also had
abrasive wear track caused by the hard particles. For the worn surface 1000°C, the smooth surface and
cracks with several micrometers in length were observed. Further, many BC microfibril bundles and
BC fiber bridging were observed around the cracks. It considered that the wear and friction
phenomenon were occurred on the ends of BC microfibril bundle, and it caused for obtaining the lowest
wear rate of the Si-C/C composites.
Fig. 59 shows SEM observation of the drum surface SUS304. Viewing the contacting surface of
700°C, there were a large amounts of wear debris such as black film and grooves formed by the adhesive
wear along the sliding direction, as resulting high wear rate was exhibited. In the case of 900°C, the
adherent wear debris particles were observed relatively small and the little surface damage caused by the
hard particles were occurred on the drum surface as a result of sliding. For the specimen at 900°C, since
during the sliding, the wear debris could be formed, which can provide the self-lubricant during the wear
test, and decreased the friction coefficient.
T. Dugarjav et al. reported the tribology properties of the Rice Husk (RH) ceramics with rice husk
and phenol resin against SUS304 stainless. The RH ceramics which carbonized at 900°C exhibited
superior tribology behavior under dry sliding condition. The improved wear and friction is attributed by
the transferred film formed on counterpart surfaces [68]. It can be understood that as the carbonizing
temperature increased, the amount of wear debris become lower, resulting in lower wear rates being
exhibited.
Based on the observations of worn surfaces, it suggested that the wear mechanisms of the specimens
at 700°C and 800°C showed mixed mode of abrasive-adhesive wear due to the formation of wear debris
at low carbonizing temperatures, consequently, leaded to high wear rate. For specimens at 900°C and
1000°C, as the carbonizing temperature increased, the number of wear debris decreased and the worn
surface was getting smooth and dense. These could be attributed to the difference of microstructural
features and bonding strength between the matrix and reinforcements caused by carbonization
temperatures. Result of EDS analysis were detected 37.38% of carbon, therefore, the wear mechanism
is a mode of adhesive wear, consequently, leading to high wear rate.

58
Fig. 60 shows the SEM observation and EDS analysis of iron (Fe) and Carbon (C) of the wear debris
particles. Wear debris particles of 700°C consist of rolls formed from inside the wear track. The particle
size varies significantly between the sub-micron to several micron particulates, and according to the EDS
analysis observed small value of Fe. On the drum surface, the wear debris particles were observed lower
compared to 700°C. As result of the EDS analysis carbon content was detected as 30.22%.
For the surface of 900°C/10°C (Fig. 58), an abrasive wear grooves were produced by scuffing of wear
debris caused by the hard particles. In the case of mating surface, wear debris particles were observed
relatively small, and a brittle surface damages occurred during sliding. The wear mechanism is a mixed
mode of abrasive- adhesive wear mode, consequently, leading to low wear rate (3.08×10⁻¹⁰ mm2/N).
Wear track depth is relatively shallow, and not occurs micro crack into wear track (Fig. 58), due to
high hardness value (389.5HV) comparison with nano-C/C composites. The debris particles of 900°C
have the shape of flakes-what indicates that the loss of the material delamination. In the result of EDS
analysis, many high lights of Fe removed from the contacting drum SUS304 were observed. It means
that as increasing carbonizing temperature, composites exhibit a high hardness, as a result, it tends to
attack to the drum surface. All of these such as mechanical properties, surface roughness and
carbonization degree were contributed to the wear and friction mechanism.
Combining with worn surface analysis, we assumed the schematic model of wear mechanism for the
specimens at carbonizing temperature 700°C and 900°C (Fig. 61). The difference in the wear behavior
between two composites appears to be correlated to the density and microstructure of the composites due
to carbonizing temperature. For the Si-C/C composites with BP5wt%, the density increased gradually
with increasing carbonizing temperature. This has a relationship to the volume fraction of reinforcement
within matrix.
As seen Fig. 61 (b), the volume fraction of BC and BP on the contact surface is found to be very little
due to low density at 700°C. Hence, the crack and wear debris might be generated on the contacting
surfaces due to low bonding strength between reinforcement and matrix during sliding.
On the Fig. 61 (c), the volume fraction of BP and BC increased within matrix on the contact surface of
composites at 900°C. It is suggested that bonding strength between reinforcement and matrix was
increased due to high density and structure change. Furthermore, it was observed that with increasing
carbonizing temperature, the hardness of composites was increased monotonically.
The Vickers hardness test results are also shown in Table 14. The hardness of SUS 304 drum (324HV)
is lower than that of the Si-C/C composites with 5wt% BP (417HV), and then it makes the hard asperities
on composites easy to make damage on the drum surface. Therefore, the abrasive wear occurred on the
sliding surface of composites due to hard asperity’s fracture. While the drum surface was covered with
a thin transferred film, and this film could effectively prevent composites and drum surface from severe
wear. From the above results, it can be concluded that the addition of nano-sized BP in the composite
played an important role on the wear resistance of composites.

59
b) 700°C
c) 800°C
d) 900°C
Fig. 58 SEM images of worn surface Si-C/C composites with BP 5wt%.
a) before wear test

60
a) 700°C
a) 700°C
b) 800°C
c) 900°C
Fig. 59 SEM observations and EDS analysis of drum surface SUS304.
C=37.38%
C=30.22%
C=21.07%
Fe=37.69%
Fe=43.24%
Fe=49.11%
C Fe
b) 900℃
Fig. 60 EDS analysis of the wear debris.
Fe C

61
5.2.5. The effect of BP% on the wear and friction properties
In order to clarify the effect of BP wt% contents on the wear and friction mechanism, we observed the
worn surfaces of specimens carbonized at 1000°C with BP 1wt%, 5wt% and 8wt%, as shown in Fig. 62.
The worn surface of the Si-C/C composites displayed quite different characteristics at the same
carbonizing temperature due to difference in BP wt%.
As shown in Fig. 62 (a), for the worn surface of specimen with BP 1wt%, the cracks and pits were
observed partly and some small wear particles can be seen in the pits and cracks. The worn surface of
specimen with BP 5wt% was smooth and intact, that is almost no groove and void exist on the surface,
and then it contributed to the lowest wear rate. When the BP content reached at 8wt%, the surface
became rough, and severe abrasive wear occurred on the worn surface, as shown in Fig. 62 (c). Based
on these results, it clearly appeared that when the composite have high BP content over 8%, the surface
fractures and the formation of the wear debris tend to increase on worn surfaces due to lower bonding
strength between BP and matrix, as resulted, higher wear rate was exhibited.
In addition to this, in order to investigate the effect of BP wt% content on the wear and friction
properties, we conducted three points bending tests and observed the fracture surface. Fig. 63 shows
SEM observation for fracture surface of the Si-C/C composites with different BP contents carbonized at
1000°C. In Fig. 63 (a) of BP 1wt% composites, the several randomly dispersed BC microfibril bundles
can be observed on the surface, and the surface was rougher. It is considered that BP could not be
effectively dispersed into BC network due to pour BP content. In this case, neither BP nor BC had a
Fig. 61 Schematic diagram of wear mechanism a) sliding drum and Si-C/C composites
b) adhesive wear mechanism at 700°C and c) abrasive wear mechanism at 900°C.
Si-C/C composites

62
role of reinforcements, and therefore higher wear rates and higher friction coefficients were displayed
than nano-C/C composites. For the BP 5wt% composites, BC microfibrils were uniformly dispersed
over the fracture surface compared to other composites. This could be because of the milling of BC gel,
consequently the Si-C/C composites with BP 5wt% exhibited the significantly improved wear and friction
properties than other composites.
The wear and friction properties of composites with BP 8wt% could not been improved by increasing
BP content. The higher mass content of BP filler made the composites brittle, as shown in Fig. 63 (c).
This suggested that the BP were agglomerated each other at the initial stage of impregnation due to rich
mass content of BP, therefore, BP were not fully dispersed into the network of BC microfibrils. For this
reason, the dispersion of BP in the matrix was insufficient, and then many defects were appeared in the
composites and resulted in high wear rates and friction coefficients.
From the experimental results, it is found that the optimum BP content was BP 5wt% for low wear rate
and friction coefficient, and the optimum carbonizing temperatures were 900°C for the lower friction
coefficient, and 1000°C for the lower specific factors of wear element loss, respectively.
In addition to this, in order to investigate the effect of BP wt% content on the wear and friction
properties, we conducted three points bending tests and observed the fracture surface. Fig. 64 shows
SEM observation for fracture surface of the Si-C/C composites with different BP contents carbonized at
1000°C.
In Fig. 64 (a) of BP 1wt% composites, the several randomly dispersed BC microfibril bundles can be
observed on the surface, and the surface was rougher. It was considered that BP could not be effectively
dispersed into BC network due to poor BP content. In this case, neither BP nor BC had a role of
reinforcements, and therefore higher wear rates and higher friction coefficients were displayed than nano-
C/C composites.
For the BP 5wt% composites, BC microfibrils were uniformly dispersed over the fracture surface
compared to other composites. This could be because of the milling of BC gel, consequently the Si-C/C
composites with BP 5wt% exhibited the significantly improved wear and friction properties than other
composites.
The wear and friction properties of composites with BP 8wt% could not been improved by increasing
BP content. The higher mass content of BP filler made the composites brittle, as shown in Fig. 64 (c).
This suggested that BP was agglomerated each other at the initial stage of impregnation due to rich mass
content of BP, therefore, BP was not fully and homogeneously dispersed into the BC microfibrils’s
network and matrix. For this reason, the dispersion of BP on the matrix was insufficient, and then many
defects were appeared in the composites and resulted in high wear rates and friction coefficients.
From the experimental results, it is found that the optimum BP content was BP 5wt% for low wear rate
and friction coefficient, and the optimum carbonizing temperatures were 900°C for the lower friction
coefficient, and 1000°C for the lower specific factors of wear element loss, respectively.

63
c) BP 8wt%
Fig. 62 Worn surface of Si-C/C composites with different BP wt%.
a) BP 1wt% b) BP 5wt% c) BP 8wt%
Fig. 64 Fracture surface of Si-C/C composites with different BP wt%.
a) BP 1wt%.
b) BP 5wt%.
a) BP 1wt% b) BP 5wt% c) BP 8wt%
Fig. 63 Worn surface of Si-C/C composites with different BP wt%. at carbonized 1000℃.

64
5.3. Mechanical properties
5.3.1. Hardness test and results
In general, surface hardness is one of important factors that govern materials’ wear resistance [ ].
Thus, hardness measurement was also performed using micro Vickers hardness testing machine. The
Vickers hardness measurements were performed using the Mitsutoyo HM-125 testing machine under the
code of JIS B7725. A load with 19.6N was used for the indenter, and with a dwell time of 20 seconds.
The hardness test condition is same to condition of nano-C/C composites discussed in Chapter 4.3.1.
The experimental results tabulated in Table 14.
Fig. 65 shows the Vickers hardness against carbonizing temperature as a parameter of BP wt%. The
hardness test was performed 5~10 times in each samples, and mean hardness values varied in 291~494Hv
depending upon carbonizing temperature and BP content. The highest value of hardness obtained at the
specimen at 1000°C with BP 5wt%. For the Si-C/C composites, the addition of BP significantly
improved the hardness which played the main role in increasing the wear resistance, consequently, lower
wear rate was exhibited compared to nano-C/C composites.
Temperature. Vickers Hardness [Hv]
1wt% 5wt% 8wt%
700°C 291.5 299.3 345.5
800°C 356 365.7 380.6
900°C 378.7 410 401
1000°C 380 417 399
200
250
300
350
400
450
7 0 0°C 8 0 0°C 9 0 0°C 1 0 0 0°C
Vic
ker
s h
ard
nes
s [H
v]
Carbonizing temperature
1wt% 5wt% 8wt%
Table 14 Mean Vickers hardness value of Si-C/C composites.
Fig. 65 Vickers hardness against carbonizing temperature.

65
5.3.2. Three point bending test and results
In order to determine the bending strength and to have some knowledge for materials construction, we
conducted the three point bending test for the composites. The composites specimen
(80mm×10mm×4mm) was performed using Instron 5543 type testing machine as following the code of
JIS K7171. The test conditions were as follows: cross-head speed 0.2mm/min, span length 48mm, and
indenter radius as 5mm.
Fig. 66 shows the three point testing result. Although mean bending strength varied at 5~18MPa, but
the specific bending strength displayed high value around 4.1~ 14.240 [kN·m/kg] because of low density
of Si-C/C composites. As seen from Fig. 66, the specific bending strength of BP 5wt% composites
displayed higher value at all carbonizing temperature. The sample of BP 8wt% showed lower specific
bending strength than sample of 5wt% BP. It caused by the changing of carbonization degree and
microstructure of the composites, and the composites could the higher bonding strength between matrix
and reinforcements at high carbonizing temperature.
SEM observation of fracture surface at 900°C and 1000°C is shown in Fig. 67. On the fracture surface
at 900°C, the uniform distribution of BC microfibrils was observed. Moreover, BC pull-outs and BC
de-bonding were observed. It is considered that the cause of the high specific bending strength at 900°C
is due to a contribution of nano scale carbonized BC fibres and BP.
Viewing in the fracture surface at 1000°C, the nano-scale’s BC fiber bridging and cracks of hundred
nm length can be found. Generally, during heat treatment, the deflections and cracks usually occur on the
interface of matrix/ reinforcement. In this case, it tends to occur on the interface of matrix/BP at high
temperature, however, crack propagation could be suppressed due to the effect of BC fiber bridging.
From experimental results, the optimum BP content was 5wt%, and optimum carbonizing temperature is
1000°C to obtain higher strength composites. The bending strength of Si-C/C composites was strongly
depended on BP content expect temperature. It is considered that although the cracking locally occurred
on the sliding surface of the Si-C/C composites with BP 5wt%, the carbonized nano-scale’s BC
microfibrils prevented the propagation and extension of the cracking during wear test.
0
2
4
6
8
10
12
14
7 0 0°C 8 0 0°C 9 0 0°C 1 0 0 0°C
Sp
ecif
ic b
end
ing
str
en
gth
[kN
m/k
g]
Carbonizing temperature
1wt% 5wt% 8wt%
Fig. 66 Mean specific bending strength against carbonizing temperature.

66
Summary
In this chapter, Si-C/C composites with new structure was developed. From experimental results,
mean dynamic friction coefficient showed the values in the range 0.15 ~ 0.30 during the wear tests, and
the mean specific factors of wear element loss were varied in 2.16×10⁻¹⁰ ~ 1.12×10⁻⁹ mm2/N. Experimental
results have shown that the specific wear rates and friction coefficients were dependent on BP wt%
content and carbonizing temperature.
Among those four carbonizing temperatures and different BP contents for obtaining lower wear rates
and friction coefficients, the optimum BP content was 5wt% BP, and optimum carbonizing temperatures
were 900°C for the lowest friction coefficient, and 1000°C for the lowest specific factors of wear element
loss, respectively.
The effect of BC fiber bridging and high rigidity of BC fiber network with BP were operated
simultaneously during crack propagation in wear process of the Si-C/C composites with BP 5wt%, and
then resulted in lower wear rates being exhibited compared with the nano-C/C composites. For the
possible mechanism in wear resistance of the Si-C/C composites, nano BC fibers with BPs can be
restrained the propagation of micro cracks among bamboo charcoal particles, carbonized fibers and
matrix.
It can be concluded that the Bamboo charcoal particle combined with carbonized BC fibres played an
important role in increasing the bonding strength between BP and carbonized fibers and matrix, and had
an effect on the wear resistance of the Si-C/C composites.
a) 900℃ (BP 5wt%)
b) 1000℃ (BP 5wt%)
Fig. 67 Fracture surface of Si-C/C composites with 5wt%.

67
CHAPTER 6. SUMMARY AND DISCUSSION
6.1. Comparison on the wear and friction properties of developed composites
In this study, in order to clarify BC microfibril and BP effect on the wear and friction mechanism,
BP/Phenol composites with phenol resin and BP 5wt%, and Phenol composites were developed, and the
wear and friction properties were compared to these for nano-C/C composites and Si-C/C composites (BP
5wt%). Table 15 shows developed composites and materials. In order to clarify the wear and friction
properties were developed four types of C/C composites as following:
1. nano-C/C composites (BC and phenol resin)
2. Si-C/C composites (BC, BP and phenol resin)
3. BP/Phenol composites (BP and phenol resin)
4. Phenol
Developed composites
and materials
Bacterial Cellulose
(BC) Phenol resin
Bamboo charcoal
Particle (BP)
nano-C/C composites ○ ○
Si-C/C composites ○ ○ ○
BP/Phenol composites ○ ○
Phenol composites ○
In this experiment, the Si-C/C composites with BP 5wt% exhibited good results on tribology test.
Therefore, BP/Phenol composites was developed with BP 5wt% and phenol resin, and compared with Si-
C/C composites with 5 wt% nano-C/C composites, and Phenol.
a) Comparison on specific factor wear elements loss of the composites
Fig. 68 and shows the comparison on specific factors of wear element loss against carbonizing
temperature of Si-C/C composites with BP 5wt%, nano-C/C composites and BP/Phenol composites.
The Si-C/C composites have excellent wear properties in comparison with nano-C/C composites and
BP/Phenol composites. It was observed that in the case of nano-C/C composites and Si-C/C composites,
the values of specific factors of wear element loss decreased as carbonizing temperature increased. On
the other hand, BP/Phenol composites exhibited reverse behavior of wear, that is, the specific wear
element loss increased with increasing carbonizing temperature. Therefore, it considered that the
interaction between BC microfibril and BP led to increase in the wear resistance. The difference in the
wear rate must be due to the influence of the reinforcement materials and the difference in the
microstructure caused by carbonizing temperature.
Table 15 List of developed composites with materials.

68
b) Comparison on the dynamic friction coefficient of the composites
The comparison on dynamic friction against carbonizing temperature of Si-C/C composites with BP
5wt%, nano-C/C composites, BP/Phenol composites and Phenol is shown in Fig. 69. All composites
showed lower friction coefficients at 900°C compared to the composites at 700°C, 800°C and 1000°C.
For the Si-C/C composites exhibited the lowest friction coefficient of 0.15. The wear and friction
mechanism must be explained by observing the worn surface by SEM observations.
1.0
2.0
3.0
4.0
5.0
6.0
7.0
8.0
700℃ 800℃ 900℃ 1000℃
Sp
ecif
ic f
act
ors
of
wea
r el
emen
t lo
ss
x1
0-1
0m
m2/N
]
Carbonizing temperature
Si-C/C composites nano-C/C composites
BP/Phenol composites Phenol
Fig. 68 Comparison on specific factors of wear element loss against carbonizing
temperature of the developed composites.
Fig. 69 Comparison on friction coefficient against carbonizing temperature of the developed
composites.
0.1
0.2
0.3
0.4
700℃ 800℃ 900℃ 1000℃
Fri
ctio
n c
oef
fici
ent
Carbonizing temperature
Si-C/C composites nano-C/C composites
BP/Phenol composites Phenol

69
Fig. 70 shows the specific factors of wear element loss against friction coefficient of developed
composites. BP/Phenol composites and Phenol were exhibited the higher specific factors of wear element
loss and friction coefficient with larger scatter. For the BP 5wt% of Si-C/C composites, the specific
factors of wear element loss and friction coefficient were significantly lower than other composites.
To clarify the morphology and microstructure of specimen with BP 5wt%, a further observation of
the fracture surface of three point bend test had been carried out. Fig. 71 shows the fracture surface
morphology and it can be seen that the BC microfibrils network of nano-scale remained in the matrix.
Furthermore, BP fillers, which were located in the network of BC microfibrils, were observed at high
magnification observation. This figure shows that BP fillers were successfully dispersed into the
network of BC microfibrils, resulted in, the Si-C/C composites with BP 5wt% exhibited better wear
resistance. From this observation, it can be understood that BC microfibril can prevent the unwanted
agglomeration phenomenon and ensure the effective dispersion of BP in the matrice.
On the other hand, BP could improve the BC microfibril network rigidity in the composites, and also
prevented the deflection of fiber network. It suggests that specimen with BP 5wt% had also stable
microstructure due to interaction between BC and BP, and could tolerate higher shearing stress during
sliding, and then it led to improve in wear resistance.
1.0
2.0
3.0
4.0
5.0
6.0
7.0
8.0
0.1 0.15 0.2 0.25 0.3 0.35Sp
ecif
ic f
act
ors
of
wea
r el
emen
t lo
ss
x10
-10
[mm
2/N
]
Friction coefficient
nano-C/C composites Si-C/C composites BP/Phenol composites Phenol
PhenolSi-C/C composites
(BP 5wt%)
nano-C/C composites
BP
Fig. 71 Fracture surface of Si-C/C composites with BP 5wt% carbonized at 1000℃.
BP/Phenol
composites
Fig. 70 Friction coefficient against specific factors of wear element loss of the developed composites.
2μm

70
In order to clarify wear and friction mechanism, the worn surfaces of specimens carbonized at 1000°C
were observed by SEM, as shown in Fig. 72. On the worn surface of the nano-C/C composites, the
several deep scratches and cracks of few micrometers in length were observed. Moreover, many BC
microfibrils were observed inside and around of the cracks, and the crack propagation was suppressed
due to the BC fiber bridging, as shown at high magnification observation. As mentioned above, BC
consists of three-dimensional non-woven network of microfibrils due to motion of the bacteria, as shown
in Fig. 2. This structure it selves played an important role for the crack propagation resistance, and
resulted in lower specific wear rate of the nano-C/C composites. When the wear element loses by sliding
force in the tests, the fracture pass was affected by nano-scale BC microfibrils, and large energy was
absorbed during micro crack propagation [4-7, 46].
Further observation of worn surface of the Si-C/C composites (5wt% BP) in Fig. 72 (b), the worn
surface seems to be smooth. The crack was observed on the worn surface, and the nano-scale’s BC
microfibril can be found.
Viewing the worn surface BP/Phenol composites, the severe abrasive wear and many cracks were
observed on the worn surface. Because of these cracks, the size of wear debris was getting larger. A
large amounts of wear debris and voids by removed wear particles were generated on the worn surface,
as shown in the figure at high magnification. In the absence of BC microfibril in the matrix, the
debonding and crack easily occur between BP and matrix. Therefore, as generating a large amounts of
wear debris through sliding between specimen and sliding drum, and it brought the three-body abrasive
wear, which led to higher wear rate. On the worn surface of Phenol composites, the deep scratches
were uniformly occurred on the worn surface due to less of reinforcements. The experimental results
suggest that in the case of reinforcing with BP filler only, in the lack of BC microfibril, both of frictional
coefficient and wear resistance could be decreased.
a) nano-C/C composites
b) Si-C/C composites (with BP5wt%)
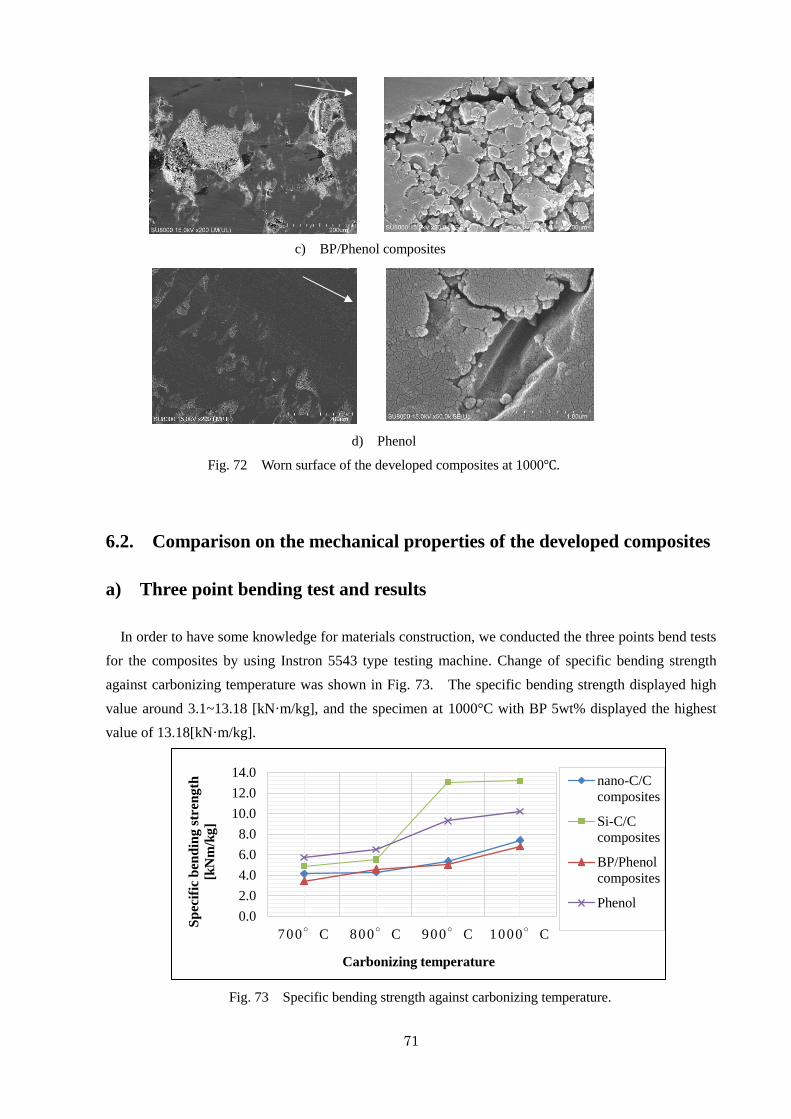
71
6.2. Comparison on the mechanical properties of the developed composites
a) Three point bending test and results
In order to have some knowledge for materials construction, we conducted the three points bend tests
for the composites by using Instron 5543 type testing machine. Change of specific bending strength
against carbonizing temperature was shown in Fig. 73. The specific bending strength displayed high
value around 3.1~13.18 [kN·m/kg], and the specimen at 1000°C with BP 5wt% displayed the highest
value of 13.18[kN·m/kg].
0.0
2.0
4.0
6.0
8.0
10.0
12.0
14.0
700°C 800°C 900°C 1000°C
Sp
ecif
ic b
end
ing s
tren
gth
[kN
m/k
g]
Carbonizing temperature
nano-C/C
composites
Si-C/C
composites
BP/Phenol
composites
Phenol
c) BP/Phenol composites
d) Phenol
Fig. 72 Worn surface of the developed composites at 1000℃.
Fig. 73 Specific bending strength against carbonizing temperature.

72
As mentioned above, it caused by the carbonization degree and microstructure of the composites were
changed, and the composites can have the higher bonding strength between matrix and reinforcements.
SEM observation of the fracture surface of the nano-C/C composites, Si-C/C composites (BP 5wt%)
and BP/Phenol composites were shown in Fig. 74. On the observation of nano-C/C composites, BC
microfibrils and BC microfibril pull-outs were observed and BC were non-uniformly dispersed on the
fracture surface. It could be due to the fabrication method of the nano-C/C composites. For nano-C/C
composites, BC gel was not milled by mixer, therefore it influenced on the distribution of BC microfibril
in the matrice.
Further observation of the Si-C/C composites (BP 5wt%), the debonding and/or cracking were
observed on the interface between phenol resin and the inclusion of BP, and the nano-scale’s BC fiber
bridging can be found. The debonding and/or cracking could be suppressed due to the effect of BC
microfibril fiber bridging. It is considered that although the cracking locally occurred on the sliding
surface of the Si-C/C composites with BP 5wt%, the carbonized nano-scale’s BC microfibrils prevented
the propagation and extension of the cracking during wear test.
The fracture surface of the BP/Phenol composites reveals that the debonding and/or cracking appeared
on interface between phenol resin and inclusions of BP, as shown in Fig. 74 (c). This behavior could be
mainly due to the difference in the coefficient of thermal expansion of BP and phenol resin. In order to
reduce the mismatch in the thermal expansion, it will be necessary to clarify the effect of thermal
expansion behavior of BC, BP and phenol resin in our future work.
Viewing the fracture surface of Phenol composites, surface was almost flat and displayed the brittle
fracture behavior.
It can be seen from the SEM observations that BC microfibril network makes not only uniform
distribution of BP, but also improved interfacial strength between the matrix and BP.
a) nano-C/C composites
b) Si-C/C composites (BP 5wt%)

73
b) Vickers hardness test and results
The hardness test of the composites was performed using micro Vickers hardness testing machine.
Hardness test result was shown in Fig. 75. The highest value of hardness obtained at the specimen at
1000°C with BP 5wt%. For the Si-C/C composites, the addition of BP significantly improved the
hardness which played the main role in increasing the wear resistance, consequently, exhibited lower
specific factors of wear element loss compared to nano-C/C composites.
Fig. 75 shows the relationship among the Vickers hardness, specific bending strength and specific
factors of wear element loss. It is seen in this figure that the specific factors of wear element loss
decreases monotonically as increasing carbonizing temperature. The agreement between values estimated
by Holm’s equation (7) and the experimental ones is fairly good as shown in Fig. 76. Further, the
specific wear rate tended to decrease with increasing the specific bending strength.
Finally, it can be concluded that there exists optimum BP wt% content with which the composites had
the good structure as BP were well dispersed in three-dimensional structure of BC network and located
at the gap in the BC network. The effect of BC fiber bridging and high rigidity of BC fiber network with
BP were operated simultaneously during crack propagation in wear process of the Si-C/C composites
with BP 5wt%, and then resulted in lower wear rates being exhibited than other two composites. For
the possible mechanism in wear resistance of the Si-C/C composites, nano BC fibers with BPs can be
restrained the propagation of micro cracks among bamboo charcoal particles, carbonized fibers and
matrices.
c) BP/Phenol composites
d) Phenol
Fig. 74 Fracture surface of developed composites at 1000℃.

74
200
250
300
350
400
450
700°C 800°C 900°C 1000°C
Vic
ker
s h
ard
nes
s [H
v]
Carbonizing temperature
nano-C/C
composites
Si-C/C
composites
BP/Phenol
composites
Phenol
0
2
4
6
8
10
12
0
100
200
300
400
500
0.0 2.0 4.0 6.0 8.0 10.0 12.0
Sp
ecif
ic b
end
ing s
tren
gth
Vic
ker
s h
ard
nes
s
Specific factors of wear element loss ×10-10 mm2/N
Vickers
hardness
Specific
bending
strength
Fig. 75 Vickers hardness against carbonizing temperature.
Fig. 76 Vickers hardness and specific bending strength against specific factors
of wear element loss of Si-C/C composites (BP 5wt%).
Holm’s Eq.

75
6.3. Conclusion
The following conclusion obtained:
1. In this study, the fabrication method and tribology properties of the nano-C/C composites, Si-C/C
composites and BP/Phenol composites with a new structure by using BC microfibril and BP were
investigated. The DIM method and milling of BC gel by mixer were most effective method for the
uniformly dispersing of BC and BP in the matrix.
2. The effect of carbonizing temperature and heating rate on the wear properties of C/C composites is
clarified. Wear characteristics were examined by the tribology test, surface roughness test, SEM
observation and EDS analysis, and the effect of three-dimension network, and fiber bridging of BC
on the tribology and mechanical properties of the developed composites were considered.
3. The wear property of nano-C/C composites was related to the heating rate, in addition to the
carbonizing temperature. The results of the heating rate temperature 10°C/h were obtained
excellent in wear characteristic. The experimental results of wear characteristics were shown for the
nano-C/C composites. The mean friction coefficient took the values in the range 0.16 ~ 0.19, and
the specific factors of wear element loss was 2.91×10⁻¹⁰ ~ 8.91×10⁻¹⁰ mm2/N during tests.
4. For the Si-C/C composites, the frictional coefficient took the low values of 0.15 ~ 0.30µ during wear
tests, and the specific factors of wear element loss varied 2.16×10⁻¹⁰ ~ 1.12×10⁻⁹ mm2/N.
Experimental results have shown that the specific wear rates and friction coefficients were dependent
on BP wt% content and carbonizing temperature. Among those four carbonizing temperatures and
different BP contents for obtaining lower wear rates and friction coefficients, the optimum BP
content was 5wt%, and optimum carbonizing temperatures were 900°C for the lowest dynamic
friction coefficient, and 1000°C for the lowest specific factors of wear element loss, respectively.
5. Si-C/C composites exhibited the better wear and frictional properties compared with nano-C/C
composites, BP/Phenol composites and Phenol composites. It was revealed from the experimental
results that with an increase in the carbonizing temperature, Si-C/C composites with BP 5wt%
exhibited better wear resistance, higher hardness and specific bending strength. It can be concluded
that the bamboo charcoal particle combined with carbonized BC fibres played an important role in
increasing the bonding strength between BP and carbonized fibers and matrices, and had an effect
on the wear resistance and mechanical properties of the Si-C/C composites.

76
Literature
[1] P.S. Nail et al., “Synthesis and Characterization of C/C composites”, Inter. Journal of Engineering
Science Invention Research& Development, Vol. 1, (2015).
[2] S. Ozsan et al., “Microstructure and Elastic properties of individual components of C/C
composites”, Carbon, (2009), pp. 3403-3414.
[3] J.T. Lee, M.W. Kim, Y.S. Song, T.J. Kang, J.R. Youn, “Mechanical properties of denim fabric
reinforced poly (lactic acid)”, Fibers and Polymers, 11 (2010), pp. 60–66.
[4] P.K. Bajpai et al., “Development and characterization of PLA based ‘Green’ composites: a review”,
Journal of Thermoplastic Composite Materials DOI: 10.1177/ 0892705712439571.
[5] P.K. Bajpai, I. Singh, J. Madaan, “Joining of natural fiber reinforced composites using microwave
energy: experimental and finite element study”, Materials & Design, 35 (2012), pp. 596–602.
[6] M.S. Huda et al., “Effect of fiber surface- treatments on the properties of laminated biocomposites
from poly (lactic acid) (PLA) and kenaf fibers”, Composites Science and Technology, 68 (2008),
pp. 424–432.
[7] U. Nirmal et al, “Effect of betelnut fibres treatment and contact conditions on adhesive wear and
frictional performance of polyester composites”, Wear, 268 (2010), pp.1354–1370.
[8] K. Kitagawa, T. Semba, T. Shimamura, H. Okumura, L. Suryanegara and H. Yano, “Development
of cellulose nano-fiber reinforced nano-composites with high content of renewable resources,”
Proceedings of Symposium of the Japan Society of Polymer Processing, Japan, (2006), pp.171-172,
(In Japanese).
[9] S. Sahoo, U.S. Ishiaku, A. Nakai and H. Hamada, “Study on the interfacial properties of natural
fiber composites,” Proceedings of 4th International Workshop on Green Composites, 2006, pp. 54-
59.
[10] J.R. Mohanty, S. N. Das and H. C. Das, “Effect of fiber content on abrasive wear behavior of date
palm leaf reinforced polyvinyl pyrrolidone composites,” Hindawi, Tribology, 2014.
[11] I. Ide, S. Ishihara, H. Higuchi and M. Nishikawa, “Carbon-based composites from bamboo
charcoal and its applications,” Journal of the Society of Material Science Japan, vol. 43, no. 485,
pp. 152-157,1994. (In Japanese).
[12] A. Yaghmaei, S. M. Zebarjad and M. Kashefi, “On the wear behavior of cyanoacrylate in presence
of nano-sized SiO2,” Engineering, no. 4, pp.245-251, 2012.
[13] N. Saba, P.M. Tahir and M. Jawaid, “A Review om potentially of nano filler/natural fiber filled
polymer hybrid composites,” Polymers, vol. 6, pp. 2247-2273, 2014.
[14] W. Hu, S. Chen, J. Yang, Z. Li and H. Wang “Functionalized bacterial cellulose derivatives and
nanocomposites,” Carbohydrate polymers, no.101, pp. 1043-1060, 2014.
[15] S. Vitta and V. Thiruvengadam, “Multifunctional bacterial cellulose and nano-particle-embedded
composites,” Current, vol. 102, no10, pp.1398-1405, 2012.
[16] C. Tang, Y. Tian and S. Hsu, “Poly (vinyl alcohol) nanocomposites reinforced with bamboo

77
charcoal nanoparticles: Mineralization behavior and characterization,” Materials, vol. 8, pp. 4895-
4911, 2015.
[17] T. Dugarjav, T. Yamaguchi, K. Shibata and K. Hokkirigawa, “Friction and wear properties of rice
husk ceramics under dry and water lubricated conditions,” Tribology online, no.4, pp. 78-81, 2009.
[18] R. M. Brown Jr, “Bacterial Cellulose”, Cellulose (1989), pp. 145-151.
[19] K. Tajima et al., “Structure of Bacterial cellulose subunit D octamer with four inner passageways”,
Proc. Academic Sci. 107(42), (2010), pp. 17957-61, (Japanese).
[20] Miguel Gama, Paul Gatenholm and Dieter Klemm, “Bacterial NanoCellulose, A Sophisticated
Multifunctional Material”, CRC Press, 2012.
[21] Klemm, D., et al., “Bacterial synthesized cellulose, artificial blood vessels for microsurgery”,
Progress in Polymer Science,( 2001), 26(9), pp.1561-1603.
[22] Giuseppe Scionti, “Mechanical properties Bacterial cellulose implant”, Master of Science Thesis
in Biomedical Engineering, (2010).
[23] Yamanaka S, Watanabe K and Nishi Y., “The structure and mechanical properties of sheets
prepared from bacterial cellulose”, Journal Material Sci, 1989, 24, pp. 3141–3145.
[24] Nishi Y. Uryu M, and Yamanaka S., “The structure and mechanical-properties of sheets prepared
from bacterial cellulose”, Journal Material Sci., 25, 1990, pp. 2997–3001.
[25] G. Guhados et al., “Measurement of the elastic modulus of single bacterial cellulose fibers using
atomic force microscopy”, Langmuir, 21, (2005), pp. 6642–6646.
[26] T. Nishino et al., “Elastic Modulus of the Crystalline Regions of Cellulose Polymorphs,” Journal
of Polymer Science , Part B, Polymer Physics ,33, (1995), pp. 1647-1651.
[27] Hsieh,Y.-C., Yano,H., Nogi, M., Eichhorn, S.J., “An estimation of the Young’s modulus of bacterial
cellulose filaments”, Cellulose, 2008, 15, pp. 507–513.
[28] Won-Il Park et al., “Synthesis of bacterial celluloses in multiwalled carbon nanotube-dispersed
medium”, Carbohydrate Polymers, 77 (2009), pp. 457–463.
[29] Zhiyong Yan, et al., “Cellulose synthesized by Acetobacter xylinum in the presence of multi-
walled carbon nanotubes”, Carbohydrate Research, 343 (2008), pp. 73–80.
[30] Nasrullah.Shah et al., “Overview of bacterial cellulose composites: A multipurpose advanced
material”, Carbonhydrate Polymers, Vol. 98 (2013) , pp.1585-1598.
[31] H. J. Lee, et al., “Fabrication and evaluation of bacterial cellulose-polyaniline composites by
interfacial polymerization”, Cellulose, 19 (4) (2012), pp. 1251–1258.
[32] Hernane S. Barud et al., “Antimicrobial Bacterial Cellulose-Silver Nanoparticles Composite
Membranes”, Journal of Nanomaterilas, 2011.
[33] Nishino, T., Suetsugu, M., et al., “In situ Biosynthesis of Bacterial cellulose in the Presence of
Nanodiamonds”, Proceedings of the Seventh Workshop on Green Composites(IWGC-7), 2012, pp.
57-60.
[34] Gindl W. and Keckes J., "Tensile properties of cellulose acetate butyrate composites reinforced
with bacterial cellulose", Composites Science and Technology, Vol. 64, (2004), pp. 2407-2413.
[35] Yano H, et al., “Optically Transparent Composites Reinforced with networks of Bacterial

78
Nanofibers”, Advanced Materials, Vol.17, (2005), pp. 53–55.
[36] Masaya Nogi and Hiroyuki Yano, “Transparent Nanocomposites Based on Cellulose Produced by
Bacteria Offer Potential Innovation in the Electronics Device Industry”, Advanced Materials, 20
(2008), pp. 1849-1853.
[37] Takashi Nishino et al., “Chemical modification of Bacterial cellulose using Supercritical Carbon
Dioxide and Preparation of Cellulosic Nanocomposite”, Proceedings of the Fifth International
Workshop on Green Composites (IWGC-5), 2008, pp. 68-70.
[38] Takashi Nishino et al., “Bacterial cellulose/Poly (L-lactic acid) composite prepared by In situ
polymerization”, Proceedings of the Fifth International Workshop on Green Composites (IWGC-8),
(2008), pp. 68-70.
[39] http://www.ricoh.com/about/company/technology/tech/033_biopaper.html
[40] S. Ummartyotina, J. Juntarob, M. Sainb, H. Manuspiya, “Development of transparent bacterial
cellulose nanocomposite film as substrate for flexible organic light emitting diode (OLED)
display”, Industrial Crops and Products, 35(2012), pp. 92– 97.
[41] J. L. Lopeset al., “Friction and wear behavior of bacterial cellulose against articular cartilage”,
Wear , 271(2011), pp. 2328–2333.
[42] Lina Fu et al., “Present status and applications of bacterial cellulose-based materials for skin tissue
repair”, Carbon hydrate Polymers, Vol.92, (2013), pp. 1432-1442.
[43] Zhijun Shi et al., “Utilization of Bacterial cellulose in food”, Food Hydrocolloids, Vol.35 (2014),
pp. 539-545.
[44] E.J. Vandamme et al., “Improved production of bacterial cellulose and its application potential”,
Pol. Degrad. Stabil., 59 (1998), pp. 93–99.
[45] T. G. Chiciudean, “Production methods and Characteristics of Bacterial-Cellulose composites”,
Doctoral thesis, Editura Mesagerul Bistrita, 2011.
[46] Nasrullah Shah, Mazhar UI-Islam, Waleed Ahmad Khattak, Joong Kon Park, “Overview of
bacterial cellulose composites: A multipurpose advanced material”, Carbonhydrate Polymers, 98,
2013, pp. 1585-1598.
[47] Weili Hu, Shuiyan Chen, at al., “Functionalized bacterial cellulose derivatives and nano
composites”, Carbonhydrate Polymers, Vol.101, (2014), pp. 1043-1060.
[48] Ong-ard Saibuatong, Muenduen Phisalaphong, “Novo aloe vera–bacterial cellulose composite
film from biosynthesis”, Carbohydrate Polymers, 79, (2010), pp. 455–460
[49] N. Nakagaito et al ., "Bacterial cellulose: The ultimate nano-scalar cellulose morphology for the
production of high-strength composites", Applied Physics, Vol. 80, No. 1 (2005), pp. 93-97.
[50] T. Kikuchi, Y. Ozawa, “Development of Eco-Friendly Composite Materials with Bacterial
Cellulose”, J. Soc. Pol. Proc., Japan, 18, No. 9, ( 2006), 957. (in Japanese).
[51] Y. Ozawa and T. Kikuchi, Mechanical behavior of Eco-Friendly Composite Materials with
Bacterial Cellulose, Proceedings of 4th International Work shop on Green Composites (IWGC-4),
Tokyo, Japan (2006)116-119.
[52] Y. Ozawa, T. Kikuchi, M. Watanabe, “Development of Three-Dimensional BC Form for Advanced

79
Composite Materials”, Proceedings of 5th International Work shop on Green Composites (IWGC-
4), Tokyo, Japan (2006), pp. 116-119
[53] Y. Ozawa and T. Kikuchi., “Mechanical behavior of Eco-Friendly Composite Materials with
Bacterial Cellulose”, Proceedings of 4th International Work shop on Green Composites (IWGC-4),
Fukushima, Japan (2008), pp. 141-144.
[54] V.K. Srivastava, “Micro-Structural Characterization of Si-SiC Ceramic Derived from C/C-SiC
Composite”, American Journal of Materials Science, (2012), pp.1-4.
[55] Y. Kagawa, “Toughening mechanism of fiber – reinforced ceramics”, Seisan kenkyu, no3, pp.501-
507, 1990, (In Japanese).
[56] Y. Ozawa, L. Uugansuren and T. Kikuchi, “Development of C/C Composites with Bacterial
cellulose and Wear properties”, Proceedings of 7th International Work shop om Green Composites
(IWGC-7), Hamamatsu, Japan (2012), pp. 65-68.
[57] Lkhagvasuren, U., Ozawa. Y., and Kikuchi, T., Development of nano-C/C composites with
bacterial cellulose and tribology properties, Journal of the Society of Material Science Japan, Vol.
64, №12, (2015), pp. 1041-1046.
[58] 田中一義 et al., “炭素学, 基礎物性から応用展開まで”, 化学同人、2011.
[59] 船引恭平 et al., “フェノール樹脂の炭素化”, 熱硬化性樹脂, Vol. 2, No.4,(1981), pp.36-51.
[60] Haiyun Jiang et al., “The pyrolysis mechanism of phenol formaldehyde resin”, Polymer
Degredation and Stability, 97, (2012), pp. 1527-1533.
[61] B. Bhushan, “Principles and Applications to Tribology”, Willy, Second edition, pp.502-503, 2013.
[62] E. G. Totten, “Mechanical Tribology, Materials, Characterization, and Application”, Marcel
Dekker, 2005.
[63] 佐々木信也, 志摩政幸, et al., “始めてのトライボロジー”, 講談社, 2013.
[64] Z. You and D. Li, “Highly filled bamboo charcoal powder reinforced ultra-high molecular weight
polyethylene,” Material letters, vol. 122, pp.121-124, 2014.
[65] Uugansuren LKHAGVASUREN, Yoshihito OZAWA, and Tokio KIKUCHI, “Wear and friction
properties of BP/C/C composites with Bamboo charcoal particles and Bacterial Cellulose”,
Mechanical engineering Journal, Vol. 3, No.3, 2016.
[66] Shibata, K., Yamaguchi, T., and Hokkirigawa, K., “Tribological behavior of polyamide 66/rice bran
ceramics and polyamide 66/glass bead composites”, Wear, No.317, (2014), pp.1-7.
[67] 塩谷 義 et al., “最新フラクトグラフィ各種材料の破面解析とその事例”, テクノシステ
ム, 2010.
[68] T. Dugarjav, T. Yamaguchi, K. Shibata and K. Hokkirigawa, “Friction and wear properties of rice
husk ceramics under dry and water lubricated conditions,” Tribology online, no.4, pp. 78-81, 2009.

80
ACKNOWLEDGEMENTS
I would never have been able to finish my dissertation without the
guidance of my committee members, help from friends, and support from my
family.
First of all, I would like to express my adviser Prof. YOSHIHITO
OZAWA, for his excellent guidance and providing me with an excellent
atmosphere for doing research.
I would like to thank Prof. Takayuki Takahashi and Kazumasa
Nakamura for taking time to discuss my research work, and your advices and
kind comment are very well appreciated.
I would also like wish to thank Prof. Tsugiko Takase, Fukushima
University, Mr. Tokio Kikuchi, Fukushima Technology Centre, and Mr.
Minoru Oota, OOTA Vinegar Co Ltd., for the great support and helpful
discussion in this research.
To the students of BC group Ozawa laboratory, namely Ms. Matsumoto,
Ms. Nakakarumai, Mr. Kei Karino, Mr. Sasamori, Mr. Wataru Takahashi, Mr.
Hiroki Sato, Mr. Go Sasaki, Ms. Narisa Takahashi, Mr. Yuuta Asano, Mr.
Keita Takazawa and to other members not mentioned, I thank you for being
co-researchers.
I would also like to thank my parents and family. They were always
supporting me and encouraging me with their best wishes.