ownership structure, corporate governance, and fraud ... structure, corporate governance, and fraud:...
TRANSCRIPT
Journal of Corporate Finance 12 (2006) 424–448
www.elsevier.com/locate/jcorpfin
Ownership structure, corporate governance, and fraud:
Evidence from China
Gongmeng Chen a, Michael Firth b,*, Daniel N. Gao a,c, Oliver M. Rui d
a Antai School of Management, Shanghai Jiaotong University, Chinab School of Accounting and Finance, The Hong Kong Polytechnic University, Kowloon, Hong Kong, China
c Jinhe Centre for Economic Research, Xi’an Jiaotong University, Chinad Chinese University of Hong Kong, Hong Kong, China
Received 26 February 2005; received in revised form 7 September 2005; accepted 8 September 2005
Available online 2 November 2005
Abstract
Our study examines whether ownership structure and boardroom characteristics have an effect on
corporate financial fraud in China. The data come from the enforcement actions of the Chinese Securities
Regulatory Commission (CSRC). The results from univariate analyses, where we compare fraud and no-
fraud firms, show that ownership and board characteristics are important in explaining fraud. However,
using a bivariate probit model with partial observability we demonstrate that boardroom characteristics are
important, while the type of owner is less relevant. In particular, the proportion of outside directors, the
number of board meetings, and the tenure of the chairman are associated with the incidence of fraud. Our
findings have implications for the design of appropriate corporate governance systems for listed firms.
Moreover, our results provide information that can inform policy debates within the CSRC.
D 2005 Elsevier B.V. All rights reserved.
JEL classification: G34
Keywords: Ownership; Corporate governance; Fraud; China’s enforcement actions
1. Introduction
China began a process of economic restructuring in the late 1970s and these reforms continue
to this day. Principal aims of the reforms include the modernization of industry, stimulation of
0929-1199/$ -
doi:10.1016/j.
* Correspon
E-mail add
see front matter D 2005 Elsevier B.V. All rights reserved.
jcorpfin.2005.09.002
ding author. Tel.: +852 2766 7062; fax: +852 2330 9845.
ress: [email protected] (M. Firth).

G. Chen et al. / Journal of Corporate Finance 12 (2006) 424–448 425
growth, reduction of poverty, and improvements in economic efficiency. To implement these
reforms, China has moved towards a free-enterprise system that has included, among other
things, the privatization of many state owned enterprises (SOEs), the formation of joint stock
companies, and the development of stock markets. The trials and tribulations of the reform
process have been well documented (Cao et al., 1999; Gao, 1996; Groves et al., 1994; Lin and
Zhu, 2001) and analyses of the effectiveness of these reforms have begun to appear in the
literature (Allen et al., 2005; Chen et al., 1998, in press-a). In a detailed analysis of national
economic statistics, Allen et al. (2005) conclude that it is the private non-listed sector of the
economy that has driven China’s economic growth. They argue that poor governance has
constrained the performance of listed firms. Chen et al. (1998, in press-a) concur with the
arguments of Allen et al. and they further demonstrate that the performance of partially
privatized SOEs deteriorates in the years after the IPO.
China’s reform process has been gradual and contrasts with the wholesale and dovernightTreforms undertaken in many ex-Soviet-bloc countries. The reforms have borrowed concepts and
bbest practicesQ from the U.S. and other capitalist nations. For example, the governance of listed
firms follows, in many respects, practices from the U.K. and the U.S. Firms have boards of
directors who are charged with running the organization and the chairman of the board is the
main power and takes on an executive role. Boards are required to have outside directors
although, only recently, have they been required to be independent.1 Appointment committees,
compensation committees, and other committees are now becoming common in Chinese listed
firms. Although there is widespread adoption of western2 corporate governance practices, the
effectiveness of them has yet to be fully evaluated. The particular issue we examine in this study
is whether the style and form of corporate governance has an effect in deterring financial fraud.
Our research follows the line of enquiry of Beasley (1996) but does so in a major transition
economy, namely China.
The China Securities Regulatory Commission (CSRC) is charged with enforcing all aspects
of the securities laws in China and its powers and operations are not dissimilar to those of the
SEC in the U.S. The CSRC investigates allegations of corporate and securities fraud and makes
enforcement actions in cases where fraud and malpractices are proved. We examine these
enforcement actions and develop a model to explain why some firms succumb to financial fraud
while others do not. In particular, we examine whether the ownership and governance structures
of firms have an impact on the propensity to commit fraud.
Our study contributes to the literature in the following ways. First, China has a relatively
underdeveloped legal environment when compared to the U.S. and so the role and impact of
regulation and corporate governance differs across the two countries (we compare China to the
U.S. because most prior research has used data from American enforcement actions). La Porta et
al. (1998, 2002) and Roe (2002) show that the legal environment of a country has a significant
impact on firm performance and corporate governance.3 In China, civil litigation is very rare and
thus the regulator, in this case the CSRC, is the prime discipliner of firms and their
1 The China Securities Regulatory Commission (CSRC) issued Statement 102 dGuidelines for Establishing an
Independent Directors System for Listed CompaniesT in August 2001 and it stipulated that by June 2003, one-third of the
directors should be independent and non-executive.2 By bwesternQ we mean developed or capitalist countries such as Australia, the U.K., and the U.S.3 Supporting evidence comes from an international study by Haw et al. (2004) who find that well developed legal and
extra-legal institutions (such as the tax authorities) help reduce earnings management. Note, however, that they did not
include China in their sample countries.
G. Chen et al. / Journal of Corporate Finance 12 (2006) 424–448426
managements. In contrast, in the U.S., legal actions against firms can be criminal (e.g. the SEC)
and/or civil (e.g. shareholder class action lawsuits). The threat of civil litigation is a major factor
in influencing corporate behavior in the U.S. Second, the ownership structure of listed firms in
China is unique. For example, blockholders are usually the state and quasi-state institutions
(such as SOEs) and we investigate if they have an impact on corporate fraud. These blockholders
are very different from those in the U.S. or Europe and so they have different influences on the
firm. Third, while Chinese boardrooms have similar setups to those in western companies, their
dynamics are quite different. For example, chairmen are full-time executives and they wield
significant power. As another example, senior management typically started their careers as
government bureaucrats and so they may have different mindsets than top executives in U.S.
firms. We examine specific boardroom characteristics including outside directors, board size,
number of board meetings in a year, chairman tenure, and chairman/CEO duality to see if they
help explain the incidence of enforcement actions. Fourth, China’s auditing profession is
relatively new and it has faced a steep learning curve. We examine whether certain audit firms
are more likely to deter fraud. Fifth, we employ bivariate probit regression with partial
observability to model the multivariate relationships with fraud. One problem of the existing
approach to modeling corporate fraud is that we can only observe fraud that is detected.
Bivariate probit with partial observability allows us to model the observed outcome (detected
fraud) as a function of the joint realizations of the propensity to commit fraud and the probability
of detection. Our results provide some inputs for the deliberations of policy makers and
regulators as they review the effectiveness of current laws and procedures and as they consider
extensions and improvements to the regulations.
In the multivariate tests we find that firms that have a high proportion of non-executive
directors on the board are less likely to engage in fraud. This evidence is consistent with outside
directors monitoring the actions of managers and thus helping deter fraudulent acts. Firms that
have chairmen with shorter tenures are associated with higher incidences of fraud. Short-tenure
may imply the chairman lacks experience in the firm and so deterring fraud is more difficult.
Board meeting frequency is positively associated with fraud. This may imply that a firm’s
questionable or illegal activities where discussed by the board over a number of meetings. There
is weak evidence from the multivariate analysis that firms where one person occupies the
positions of both the chairman and the CEO have higher frequencies of fraud. This finding is
consistent with the argument that handing one person a lot of power (chairman and CEO
positions) makes it easier for that person to abuse their power and engage in fraudulent activities.
Duality of chairman and CEO positions reduces the checks and balances in the top management
of the firm.
Ownership characteristics appear to be less important in explaining fraud. Legal entity
stockholders are positively associated with fraud although only the univariate analysis, which
compares fraud and no-fraud firms, is statistically significant. Legal entity investors, such as
parent SOEs, are charged with making profits and so they may encourage listed firms in which
they are invested to falsify their financial statements and engage in fraud. We also find that firms
with foreign shareholders are less likely to have enforcement actions against them. We believe
foreigners monitor the firms they invest in and this helps deter fraud. However, the importance
of ownership characteristics disappears in the multivariate setting.
The paper proceeds as follows. First, we give a brief discussion of China’s enterprise reforms
and the workings of CSRC (Section 2). Section 3 describes our research design, introduces the
sample data, and develops testable hypotheses. The results are reported and discussed in Section
4 and our conclusions are presented in Section 5.
G. Chen et al. / Journal of Corporate Finance 12 (2006) 424–448 427
2. China’s economic restructuring, regulatory reforms, and prior research
2.1. Economic reforms
China’s enterprise reforms have been far-reaching. From a centrally planned economy where
managers of SOEs followed orders from government ministries, the reforms have devolved
powers to the restructured enterprises and given managers a lot of discretion over funding,
products, pricing, and labor practices. Managers are increasingly being appointed on merit rather
than political patronage and personal connections.
The enterprise reforms involve carving out the operational units of the SOEs4 and
reorganizing them as limited liability companies with share capital and with profit making
objectives. Many of these companies have subsequently listed on the stock market and raised
capital by IPOs. A major characteristic of China’s enterprise reforms is the state’s retention of a
controlling stake in listed firms.5 This stake is held directly by central government and its
associated ministries (including state asset management bureaus), and by city, regional, and local
government. On average, about 30% of the shares are owned by the state (central government),
its ministries, and local and regional government. Another 30% of the shares are owned by legal
entities and most of these entities are ultimately owned by the state. One type of legal entity is an
SOE. An SOE typically floats off part of its activities into a listed firm but it retains a majority or
controlling stake in it. The listed entity is often the profitable operations of the SOE. Legal
entities are required to maximize the return on their investments. The shares held by the state and
legal entities are not tradable on the two stock exchanges.6 The state and legal entity
shareholders are typically blockholders and the largest blockholder often controls the firm as
they have substantially larger investment stakes than the second largest blockholder (there might
not even be a second blockholder) (Xu, 2004). On average, about 40% of a listed firm’s shares is
owned by private individuals and private institutions, and these shares (called A-shares) are
actively traded on the exchanges.7 About 10% of listed firms have also issued shares to
foreigners (called B-, H-, and N-shares). All the shares, tradable and non-tradable, rank pari-
passu in terms of dividends and voting. In China, managerial and director stockholdings are very
small and executive stock option schemes are rare during the period we investigate. For this
reason we do not examine executive stock ownership in our analysis of corporate financial fraud.
The designation of shares into state, legal entity, and individual is enshrined in China’s
company law. Note that legal entities are ultimately owned by the state. However, legal entities
(such as SOEs) have somewhat different objectives than state stockholders. Legal entities are
usually charged with making profits, whereas for state stockholders profit may not be the sole
4 The SOE, itself, remains 100% owned by the central or regional government. The SOE has a number of social and
political objectives that go beyond the making of profits (Bai et al., 2000).5 Bortolotti and Faccio (2004) show that many governments keep a controlling or dominant ownership stake in
privatized SOEs. Thus China is not the only country where dpartial privatizationsT occur. Bortolotti and Faccio also find
that high state ownership in privatized SOEs results in superior financial performance (measured by the market to book
ratio). Gupta (2005) finds that partial privatizations in India have a positive impact on a firm’s sales, profits, and labo
productivity. These findings stand in contrast to the results from China’s privatizations (Chen et al., 1998, in press-a)
where high state ownership was found to be detrimental to financial performance.6 The Shanghai Securities Exchange (SHSE) opened in December 1990 and the Shenzhen Stock Exchange (SZSE
opened in July 1991.7 Shares owned by individuals are very actively traded. The average holding period has been estimated to be as little as
2 months (Poon et al., 1998).
r
,
)
G. Chen et al. / Journal of Corporate Finance 12 (2006) 424–448428
objective.8 There is a greater alignment of control rights and cash flow rights for legal entities
vis-a-vis the state, and so their influences on listed firms may be different (Xu, 2004). For this
reason we distinguish between the type of owner in our empirical tests.
The reform process is meant to give autonomy to managers and boards of directors to run the
firms without interference from the state. Although the state and its agencies often have voting
control of a listed firm, they are supposed to act as dispassionate profit maximizers rather than as
agents to force political or social agendas on the company.9 Individual shareholders and non-
state institutional investors are meant to monitor and discipline company managers in much the
same way as happens in capitalist countries. Institutional investors (not affiliated to the state) are
viewed as being major agents of change in the U.S., U.K., and other western nations (Chung et
al., 2002). In China, however, institutional investors (pension funds, insurance companies,
mutual funds) are very small and they provide little monitoring of company management.
The enterprise reforms have brought with them a change in agency problems. Under the old
system, shirking was a major problem as managers had little incentive to work hard and planning
and decision-making were deferred to central or regional government. Managers produced to the
budget and their salaries were fixed and were little different from the average worker although
benefits were higher. After privatization and listing, different agency problems emerged that are
similar to those in capitalist nations. Principal among the dnew’ agency problems are the
diversion of resources to managers and controlling shareholders, the manipulation of stock
prices, and the expropriation of minority stockholders.
As part of the reform process, China has written new commercial and securities laws, introduced
accounting and disclosure standards, and built regulatory agencies. These institutional changes were
designed to reduce uncertainty for investors and to deter or reduce the new agency problems. More
specifically, laws have been enacted that seek to establish property rights and protect investors’
interests.10 To help enforce the laws and to encourage good governance practices, the state
developed a number of regulatory agencies. In 1998 the state reorganized the regulatory agencies
that cover companies and the securities business into one ministry rank unit, the CSRC. In
general, the securities laws, accounting standards, disclosure requirements, and regulatory
agencies are modeled on those of other jurisdictions, most notably the U.S. and Hong Kong.
2.2. The China Securities and Regulatory Commission (CSRC)
At the beginning of the reform period China had few laws covering commercial transactions
and no laws relating to property rights. The lack of laws meant that the regulators made ad-hoc
and inconsistent decisions. This situation put in peril the economic reforms already underway.
Even after the establishment of the two stock exchanges in 1990 and 1991, there was confusion
over the roles of regulators as there were three regulatory agencies, the State Council Securities
Commission (SCSC), the People’s Bank of China (the de facto Central Bank), and the CSRC,
and they had overlapping duties.
8 Note that the state wants listed firms to be profitable but there may be other objectives that occasionally impinge on
the maximization of profit. Li and Zhou (2005) show that the state uses economic performance as a criterion in promoting
provincial leaders.9 The state deems some industries to be especially important to the national interest. In these cases the state exercises
close control over the enterprises. Typically firms in these industries are not listed and so they do not form part of our
study.10 Daouk et al. (2006—this issue) show how securities laws lead to different types of corporate governance and how this
affects company performance.

G. Chen et al. / Journal of Corporate Finance 12 (2006) 424–448 429
To remedy for this somewhat chaotic situation, the state in 1998 ruled that the CSRC was to
be the main regulator of securities markets in China (this role is stipulated in The Securities Law,
which was promulgated in 1998).11 The CSRC may delegate some work to the stock exchanges
but in these cases they must report back to the CSRC. The Securities Law also gave more power
to the CSRC to investigate and sanction firms and individuals over securities and corporate
fraud. The CSRC is also responsible for advising on changes to laws, formulating regulations for
the securities markets, vetting listing applications, and supervising companies, securities firms,
investment institutions, sponsors, stock exchanges, and professional bodies and persons
(auditors, securities lawyers, stockbrokers).
The CSRC investigates allegations of company and securities fraud and malpractice.
Examples include embezzlement by company officials and securities firms, expropriation of
assets that hurt minority investors, false and inadequate financial disclosures, and stock market
manipulation. The CSRC was modeled after the SEC in the U.S. and the Securities and Futures
Commission (SFC) in Hong Kong. Some very senior staff at the CSRC where recruited from
regulatory agencies in other jurisdictions, most notably Hong Kong. There is an aggressive
campaign to recruit and train accountants and lawyers to staff the mid-level and low-level of the
CSRC. Members of staff are also seconded to the CSRC from audit and law firms to help on
specific assignments.
The CSRC has a practice of regular reviews as well as random inspections of companies and
securities firms. It also has a division that surveys companies and securities firms by looking for
dred flagsT. The CSRC receives information and complaints from investors, current and former
employees, insiders, newspapers, stock exchanges, legal proceedings, and police investigations,
and all of these may lead to investigations.
The CSRC publishes information on its investigations if wrongdoing is found. However if the
infraction is deemed very minor, then the CSRC will give an internal warning or reprimand to
the offending party and this will not be disclosed to the outside world. The CSRC divides its
sanctions of companies into four categories: public criticism, public condemnation, official
warning, and monetary fines (Mao, 2002). Suspension of trading and withdrawal of licenses to
act as a securities firm are possible penalties. For individuals, the enforcement actions can lead to
criminal prosecution with significant penalties that include the death penalty.
Published reports on investigations vary from one page or less to those that are very lengthy
and go into substantial detail. Therefore the reporting of enforcement actions varies quite a lot
and makes analysis quite difficult. The reports are published in national newspapers.
The aim of our research is to examine whether ownership structure and governance
mechanisms have an influence on corporate fraud in China. Civil lawsuits against companies and
securities firms are a very recent development in China and to date there have been very few
successful prosecutions.12 Civil proceedings can only take place after a CSRC investigation and
so far they have provided limited remedies to investors. Unlike the U.S., the threat of civil
litigation is very weak and so the actions of the CSRC assume more importance as a deterrent to
corporate fraud. In the absence of civil litigation, we use enforcement actions of the CSRC as our
sample of corporate financial fraud. These enforcement actions are similar in spirit to those of
the SEC in the U.S.
11 The Ministry of Finance also has some jurisdiction over financial statements and so some confusion over the roles of
the regulators may still arise (Li, 2001).12 China’s first successful civil lawsuit against a listed company was concluded in November 2002.
G. Chen et al. / Journal of Corporate Finance 12 (2006) 424–448430
2.3. Prior research
Using data from SEC accounting and auditing enforcement releases, Beasley (1996) found
that financial statement fraud in the U.S. was lower for firms that had a higher proportion of
outside directors, longer tenure of outside directors, higher outside director share ownership, and
fewer other outside directorships held by the outside directors. He also found that the presence of
an audit committee did not significantly affect the likelihood of financial statement fraud. In
contrast, other U.S. research (Dechow et al., 1996; McMullen, 1996; Beasley et al., 2000) found
that audit committees were associated with lower levels of fraud. Dechow et al. (1996) report
that fraud was more likely in firms where the chairman doubled as the CEO, did not have a large
blockholder, and the inside directors had substantial share ownership.
Uzun et al. (2004) examined U.S. firms that were accused of fraud in the period 1978 through
2001. The source of the data was the Wall Street Journal and so many of the frauds were not
related to SEC enforcement actions. They examined the relationships between corporate fraud
and a long list of governance variables. Their major finding is that if the board (and audit
committee) had a high percentage of independent outside directors then corporate fraud is much
less likely. Other board characteristics (including size of the board, frequency of meetings, and
CEO/chairman duality) were not significant. In contrast to their expectations, the authors found
that firms with nomination committees were more likely to have corporate fraud. In another U.S.
study, Agrawal and Chadha (in press) examined firms that made earnings restatements that
involved the correction of prior period earnings errors or manipulations. They found that if the
outside directors had at least one member with an accounting or finance background then
earnings restatements were less likely. The absence of accounting or financial expertise rendered
the outside directors ineffective in curbing accounting errors and fraud. Similarly, they found
that the presence of an audit committee was associated with fewer earnings restatements only
when at least one of the committee’s independent members had an accounting or finance
background. Agrawal and Chadha conclude that it is only when outside directors and outside
audit committee members have accounting or finance expertise that the board and audit
committee become effective in deterring earnings misstatements. Denis et al. (2006—this issue)
show that executive stock options can lead managers to commit fraud. Here, managers may be
tempted to take actions that artificially inflate stock prices so that they can maximize their payoff
from the options.
There have also been studies that examine whether ownership and boardroom characteristics
are associated with earnings management. Although earnings management is not necessarily
illegal it is regarded as being opportunistic and it distorts financial statements (Chung et al.,
2002). Using data from Canada, Park and Shin (2004) find that it is only when the outside
directors have financial expertise that they are able to deter earnings management. Increasing the
proportion of outside directors per se does not deter earnings management; what is needed is the
presence of outside directors who have backgrounds in accounting or finance. Park and Shin’s
findings echo those of Agrawal and Chadha (in press). Interestingly, in the U.K., Peasnell et al.
(2000) find that outside directors only become effective in reducing earnings management after
the publication of the Cadbury Committee corporate governance guidelines; prior to the
publication of Cadbury, outside directors were ineffective. Thus it took the spur of an influential
quasi-government report to change the behavior of outside directors. Peasnell et al. (2005) find
that firms with a high proportion of outsiders on the board are less likely to engage in
opportunistic earnings management. They also find no evidence that the presence of audit
committees deters the use of earnings management.
G. Chen et al. / Journal of Corporate Finance 12 (2006) 424–448 431
China has unique ownership characteristics and governance structures (Clarke, 2003) and so
our hypotheses are somewhat different from those in the U.S. General hypotheses are developed
in the next section. There is little research on corporate and securities fraud in China and none
examines corporate governance issues. Two related papers that examine the CSRC’s
investigations are Chen et al. (in press-b) and Firth et al. (2004). Chen et al. (in press-b)
examines stock prices and finds that negative stock returns accompany announcements of
enforcement actions. Firth et al. (2004) analyse the CSRC’s implicit views on auditors’
responsibilities for detecting fraud; here, the main focus is on auditors.
3. Research design
3.1. Corporate governance in China and testable hypotheses
As mentioned earlier, China’s modern enterprise system reform has restructured former SOEs
along the lines seen in western countries. The main differences are the state retaining a large
investment stake and the rapid pace of change that places strains on top management resources and
institutional frameworks. Many SOEs were reformed into limited liability companies with share
capital and charters or articles of association. The boards of directors have similar structures and
responsibilities as those in capitalist societies. However, the appointment of top management and
directors is different from the U.S. and other developed countries. In the early years, the state, its
ministries, and local government appointed the directors, or had veto power over the appointment.
The Communist Party also had to approve senior level appointments. In more recent years, the state’s
role in appointing top managers and directors has diminished (the roles of ministries, local
government, and theCommunist Party have also declined). There is also a supervisory board although
this has little influence on a firm’s activities (Dahya et al., 2003; Tong, 2003). One of the functions of
the supervisory board is to review the financial statements and auditor’s report. The supervisory board
therefore has duties similar to an audit committee although the level of expertise may be lower.
A prime focus of our study is to see whether corporate governance (broadly defined) has an
impact on fraud. Three main aspects of corporate governance are examined, boardroom
characteristics, ownership, and audit. The board is responsible for making major policy decisions
as well as monitoring the day-to-day operations of the business. We believe the board has a
major responsibility to deter corporate fraud. Our first general hypothesis is:
H1. Boardroom characteristics have an impact on a firm’s propensity to commit fraud.
To examine this hypothesis we collect data on the make-up of the board. In particular, we
determine the proportion of outside directors, the number of directors, the number of board
meetings, the tenure of the chairman, and whether the same person occupies both the chairman
and CEO positions.
Boards can more effectively carry out their duties to safeguard the interests of shareholders
(especially minority shareholders) if there is a heavy presence of outside (or non-executive)
directors (Fama and Jensen, 1983). Using data from the U.K., Dahya and McConnell (2005)
conclude that boards with a greater proportion of outside directors make better decisions (in
particular, better decisions on the appointment of CEOs). During the time of our study there was
a requirement for firms to have non-executive directors but it was not until June 2003 that they
needed to be dindependentT. The non-executive directors are often representatives of the major
shareholders. Beasley (1996) and Uzun et al. (2004) found that firms with a high percentage of
outside directors had less financial fraud. They argued that outside directors have fewer

G. Chen et al. / Journal of Corporate Finance 12 (2006) 424–448432
incentives for firms to commit fraud and so the greater their number, the more likely they can
prevent or reduce the fraudulent behavior of the executive directors.
Jensen (1993) argued that large corporate boards are less effective and CEOs find it easier to
control them. Yermack (1996) provides support for Jensen when he found that firms with small
boards had superior financial performance. However, Uzum et al. (2004) found that board size
had no association with corporate fraud. The evidence from the U.S. is therefore mixed.
Some corporate boards may be more active and vigilant than others. However it is impossible to
directly measure activity and vigilance. What can be measured is the number of board meetings per year
and this can be used as an admittedly rough proxy for board activity. Frequent board meetings may be a
signal of increasedvigilance andoversight of the topmanagement of the firm.Alternatively, the frequency
of board meetings may increase in times of financial distress or in times of controversial decisions that
may involve illegal or questionable activities. Using U.S. data, Vafeas (1999) found that more frequent
board meetings followed poor performance and they heralded improvements in profitability.
The tenure of the company chairman or CEO may have an impact on corporate fraud
(Beasley, 1996).13 In China, the post of chairman is an executive position and it ranks higher
than the post of CEO. For this reason we focus our attention on company chairmen. On the one
hand, a new chairman may have limited knowledge of the firm and so fraud perpetrated by
others may be easier to accomplish. On the other hand, long tenure may lead to entrenchment
and over-confidence if the chairman feels he can get away with fraud.
In the Anglo-Saxon model of corporate governance, the dual appointment of chairman and
CEO is seen to give too much power to the individual (Jensen, 1993) and this can make it easier
to reach a decision that results in fraudulent actions and decisions that are not in the best interests
of the minority shareholders. However, an alternative view of corporate governance argues that
separating the roles of chairman and CEO can create paralysis if the two powerful positions do
not agree on decisions and strategies. Consequently, many American corporations have the same
person occupying the chairman and CEO positions. Beasley (1996) and Uzun et al. (2004) found
that the duality of CEO and chairman positions does not have an impact on fraud in the U.S.
although Dechow et al. (1996) found the opposite.
The broad ownership structure of a firm is exogenously determined by the state. For example,
the decision to divide shares into state shares, legal entity shares, and individual (or tradable)
shares is made by the central or regional authorities prior to listing and any transfers between
these categories are very rare. Transfers between different types of state stockholders (e.g.
between different government ministries or state asset management bureaus) and between
different legal entities (e.g. different SOEs) needs approval from the state. Tradable shares are
traded freely on the stock exchange. Our second general hypothesis is:
H2. Ownership structure has an impact on a firm’s propensity to commit fraud.
To examine this hypothesis we collect data on the proportion of shares held by the state (and
its ministries and asset management bureaus), the proportion of shares held by legal entities, the
proportion of shares held by individuals (tradable shares), the existence of foreign stockholders,
the proportion of shares held by the single largest stockholder,14 and the concentration of
ownership in the hands of the second to tenth largest stockholders.
3 Park and Shin (2004) find no association between the tenure of directors and earnings management in Canadian firms.
1We do not have data on the tenure of directors in Chinese firms.14 The proportion of shares held by the state (legal entities) is the total of shares held by all state stockholders (legal
entity stockholders) in a firm. A listed firm may have more than one state stockholder (legal entity stockholder), e.g.
several ministries and several state asset management bureaus may own shares in one firm.

G. Chen et al. / Journal of Corporate Finance 12 (2006) 424–448 433
Legal entities are charged with making profits and so they may have incentives to divert
resources from the listed firm in which they are invested,15 or to encourage firms to inflate their
earnings. In such cases, legal entity stockholders may influence a firm’s managers to engage in
questionable or unlawful practices that lead to enforcement actions against the firms they invest
in. In contrast, state stockholders have less motivation to persuade listed firms to engage in
fraud.
Individual investors have vested interests in guarding against corporate fraud and especially
those acts that expropriate wealth to the benefit of the major shareholders. Although individual
stockholders have limited influence on company managers because of the presence of a majority
or dominant owner, they may nevertheless be able to exert pressure to discourage fraud if the
combined individual ownerships are high. Companies that have a high percentage of tradable
shares are closely scrutinized by security analysts and by the financial media and so this may
help deter fraud.
Some listed firms have foreign stockholders (B-, H-, N-shares and others). B-shares are
issued to foreigners and these are traded on the domestic exchanges (shares quoted in U.S.
dollars on the SHSE, and shares quoted in Hong Kong dollars on the SZSE). H-shares are listed
in Hong Kong, N-shares in New York, and there are a few listings in London and Singapore.
Foreign-invested firms are likely to insist on higher standards of governance and protection of
minority rights (Khanna and Palepu, 2000) Note, however, that the foreign shares almost always
represent a minority stake in the business. We expect that foreign invested firms will be less
likely to engage in corporate fraud.
Chinese firms are characterized by having a dominant or block stockholder (invariably a state
bureau or ministry or a legal entity) whose stockholdings far exceed the second largest
stockholder (Xu, 2004). The larger the percentage of shares held by the blockholder the more
influence they have over the firm’s management. The dominant or block stockholder may have
incentives to either deter fraud or to encourage fraud. In addition to the largest stockholder, other
substantial investors may have an influence on a firm’s propensity to commit fraud. To test this,
we use a concentration ratio of the stockholdings of the stockholders ranked from the second
largest to the tenth largest. If the combined stockholdings of these investors is high this gives
them more influence on a firm’s strategies and decisions.
Auditors can have a profound effect on corporate fraud by deterring it (i.e. the fraud will be
reported) and by correcting it (by forcing the revision or restatement of financial statements).
Independent audits are quite new in China and although there has been rapid progress in
developing audit standards, the lack of trained personnel means the standards are not yet being
fully implemented. Audit quality is likely to be much more variable than in industrialized nations
and so it may help explain the incidence of fraud. Measuring audit quality is notoriously difficult
and this is especially so in China (Qiu, 2004). One approach we adopt is to use audit firm size as
a proxy for audit quality (see DeAngelo, 1981).16 Another possible approach is to categorize as
high quality those auditors that have joint ventures with the international Big 5. Our hypothesis
states that:
H3. Fraud is less likely if the firm has a high quality auditor.
15 We acknowledge that in some cases the reverse may be true. Legal entity stockholders may inject assets into the listed
firm at a cheap price so as to help the firm retain a listing (if it is in danger of losing it) or to otherwise help the firm.16 We inherently assume that audit quality depends on the audit firm. This assumption is used in most studies of audit
quality.
G. Chen et al. / Journal of Corporate Finance 12 (2006) 424–448434
3.2. Sample selection
We examine all published CSRC enforcement actions from 1999 to 2003. These cover all
cases where fraud is found, although, as noted before, cases of minor infractions are not publicly
disclosed. The starting date coincides with the implementation of The Securities Law
(promulgated in December 1998) that enshrined the CSRC as the sole regulator of listed
companies, stock exchanges, and securities firms. The original data are collected from the
newspapers Securities Times and Shanghai Securities Daily, annual reports, CSRC official news
releases, and stock exchange year books. The total sample is 169 regulatory enforcements over
the 5-year period. The yearly and industry distribution of firms is shown in Table 1. The industry
distribution of fraud is representative of the number of listed firms in an industry sector, except for
the property sector, which has a higher incidence of financial fraud. According to the enforcement
releases, the average length of time over which the fraud is committed is between 1 and 2 years.
In panel C we show the distribution of cases across provinces. Column 1 lists the province,
column 2 gives a development score to the province, column 3 shows the number of fraud cases,
and column 4 expresses the number of fraud cases as a proportion of the total number of listed
firms in the province. A strong characteristic of China’s reform process is the uneven distribution
of wealth and growth across the different provinces (Demurger et al., 2002). As the degree of
market development could have an effect on the propensity to commit corporate fraud, it is
important that we account for this in our model. To accomplish this we use a comprehensive
index compiled by Fan and Wang (2003) as a proxy of the market development of a province.17
The index captures the regional market development from the following aspects: (1) relationship
between government and markets, such as the role of markets in allocating resources and
enterprise burden in addition to normal taxes; (2) the development of non-state business, such as
the ratio of industrial output by the private sector to total industrial outputs; (3) development of
product markets, such as regional trade barriers; (4) development of factor markets such as FDI
and mobility of labor; (5) development of market intermediaries and legal environment such as
the protection of property rights. Higher scores equate to greater market development. According
to panel C, Guangdong, the province next door to Hong Kong, has the highest development
score of 8.41. During the period of our study 23 enforcement actions were made against firms
located in Guangdong and this represents about 20% of the listed firms in the province. There is
no obvious pattern in panel C. For example, Guangdong has a ratio of fraud firms of 20%, while
Zhejiang, another well-developed province, has a fraud ratio of only 4.5%. Fraud does not
appear to be confined to those provinces with high development scores nor to those with low
scores. To more formally test this, we use the index of market development (MINDEX) in our
univariate and multivariate analyses.
Our research design requires the creation of a control sample of firms that is not subject to an
enforcement action.18 Each fraud firm is matched with a no-fraud firm based on the following
requirements (these requirements are similar to those used by Beasley, 1996):
1. Stock Exchange: The common stock of a fraud firm and its matched no-fraud firm trade on
the same stock exchange (Shanghai stock exchange or Shenzhen stock exchange).
7 Demurger et al. (2002) also compile indices of regional development in China using data up to 1999. The Fan and
118 A matched firm control sample is also used by Agrawal and Chadha (in press), Beasley (1996), and Uzun et al. (2004)
in their studies of corporate fraud and earnings restatements in the U.S.
Wang index is more up to date and more appropriate for our needs.
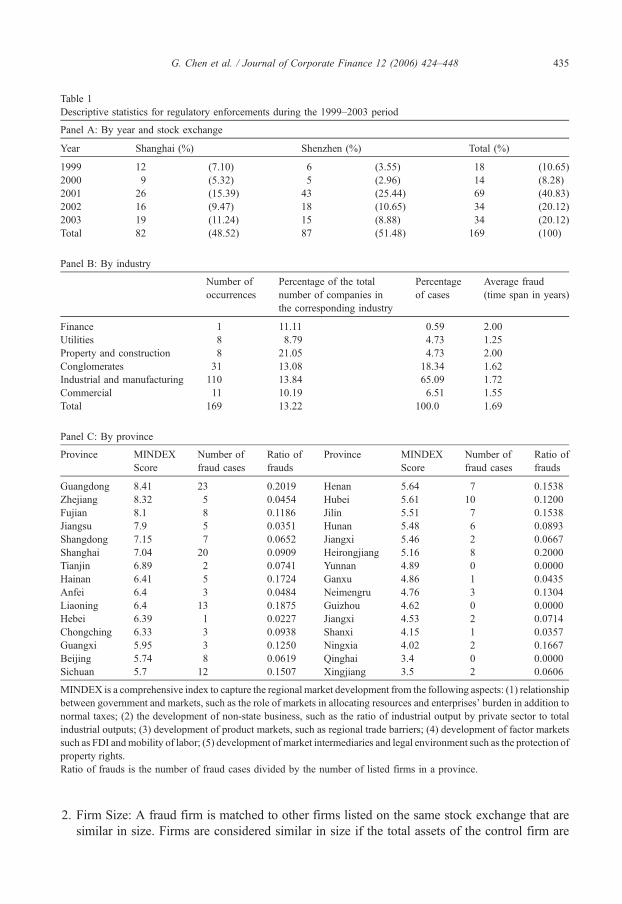
Table 1
Descriptive statistics for regulatory enforcements during the 1999–2003 period
Panel A: By year and stock exchange
Year Shanghai (%) Shenzhen (%) Total (%)
1999 12 (7.10) 6 (3.55) 18 (10.65)
2000 9 (5.32) 5 (2.96) 14 (8.28)
2001 26 (15.39) 43 (25.44) 69 (40.83)
2002 16 (9.47) 18 (10.65) 34 (20.12)
2003 19 (11.24) 15 (8.88) 34 (20.12)
Total 82 (48.52) 87 (51.48) 169 (100)
Panel B: By industry
Number of
occurrences
Percentage of the total
number of companies in
the corresponding industry
Percentage
of cases
Average fraud
(time span in years)
Finance 1 11.11 0.59 2.00
Utilities 8 8.79 4.73 1.25
Property and construction 8 21.05 4.73 2.00
Conglomerates 31 13.08 18.34 1.62
Industrial and manufacturing 110 13.84 65.09 1.72
Commercial 11 10.19 6.51 1.55
Total 169 13.22 100.0 1.69
Panel C: By province
Province MINDEX
Score
Number of
fraud cases
Ratio of
frauds
Province MINDEX
Score
Number of
fraud cases
Ratio of
frauds
Guangdong 8.41 23 0.2019 Henan 5.64 7 0.1538
Zhejiang 8.32 5 0.0454 Hubei 5.61 10 0.1200
Fujian 8.1 8 0.1186 Jilin 5.51 7 0.1538
Jiangsu 7.9 5 0.0351 Hunan 5.48 6 0.0893
Shangdong 7.15 7 0.0652 Jiangxi 5.46 2 0.0667
Shanghai 7.04 20 0.0909 Heirongjiang 5.16 8 0.2000
Tianjin 6.89 2 0.0741 Yunnan 4.89 0 0.0000
Hainan 6.41 5 0.1724 Ganxu 4.86 1 0.0435
Anfei 6.4 3 0.0484 Neimengru 4.76 3 0.1304
Liaoning 6.4 13 0.1875 Guizhou 4.62 0 0.0000
Hebei 6.39 1 0.0227 Jiangxi 4.53 2 0.0714
Chongching 6.33 3 0.0938 Shanxi 4.15 1 0.0357
Guangxi 5.95 3 0.1250 Ningxia 4.02 2 0.1667
Beijing 5.74 8 0.0619 Qinghai 3.4 0 0.0000
Sichuan 5.7 12 0.1507 Xingjiang 3.5 2 0.0606
MINDEX is a comprehensive index to capture the regional market development from the following aspects: (1) relationship
between government and markets, such as the role of markets in allocating resources and enterprises’ burden in addition to
normal taxes; (2) the development of non-state business, such as the ratio of industrial output by private sector to total
industrial outputs; (3) development of product markets, such as regional trade barriers; (4) development of factor markets
such as FDI andmobility of labor; (5) development of market intermediaries and legal environment such as the protection of
property rights.
Ratio of frauds is the number of fraud cases divided by the number of listed firms in a province.
G. Chen et al. / Journal of Corporate Finance 12 (2006) 424–448 435
2. Firm Size: A fraud firm is matched to other firms listed on the same stock exchange that are
similar in size. Firms are considered similar in size if the total assets of the control firm are
G. Chen et al. / Journal of Corporate Finance 12 (2006) 424–448436
within F 30% of the total assets of the fraud firm in the year preceding the year of the
financial statement fraud.
3. Industry: All firms identified in steps 1 and 2 are reviewed to identify a no-fraud firm within
the same industry as the fraud firm. The industry is defined by the stock exchanges and
follows the classification of the CSRC.
4. Listing age: All firms identified in the above 3 steps are scanned to identify a no-fraud firm
having a similar listing age (within 1 year) as the fraud firm.
5. Time Period: A no-fraud firm identified in steps 1 through 4 is included in the final sample if
financial statement data are available for the same time period used to collect the data from
the financial statements of the related fraud firm.
6. The identification of no-fraud firms will result in some misclassifications if a firm classified
as a no-fraud firm had an occurrence of financial fraud that had yet to be detected. To
minimize this likelihood, the annual reports of the selected no-fraud firms from 1995 (3 years
before the sample period) through 2003 are reviewed to verify that there is no report of a
fraud for each no-fraud firm.19 We also compared a control firm’s accruals (scaled by total
assets) to the industry median for all years up to 2004.20 Any control firm that had accruals
greater than 1.3 or less than 0.7 of the industry median were discarded and a new control firm,
that satisfied the conditions, was found. In this way we are assured that none of the control
firms had excessive earnings management. Substantial earnings management may indicate
financial statement misrepresentation or fraud.
The sample size for the univariate and multivariate analyses is 338 (169 pairs).
3.3. Variables
Data on boardroom characteristics are collected from firms’ annual reports. These
characteristics are the proportion of outside directors (OUT), the size of the board
(BOARDSIZE), number of board meetings (MEETING), and tenure of the chairman (CHATEN).
The duality of chairman and CEO positions (DUAL) is obtained by examining the names of the
individuals holding these positions. The boardroom variables are used to test hypothesis H1.
Hypothesis H2 relates to ownership. To test this hypothesis we collect stockholding data from
firms’ annual reports. We collect the percentage stock ownership by the state (GOVERN), legal
entities (LEGAL), and individuals (tradable shares) (INDIV). The state shareholdings are used in
the univariate analyses. A dummy variable is used to capture whether a firm has foreign
stockholders (FOR). The percentage ownership of the major stockholder is collected (TOP). The
stock ownership of the second through tenth largest owners is recorded as a Herfindahl index
(TOP10).
The auditing profession is relatively new in China and as yet there is no clearly defined set of
dwell-knownT or dprestigiousT auditors. Nevertheless we do attempt to partition auditors on the
basis of size and international brand name (AUDITOR). For the size measure, we rank Chinese
CPA firms by market share of clients’ assets and the 10 highest are coded one (1). Using market
share to measure audit quality is very common (DeAngelo, 1981). This generally manifests itself
in the use of the Big 8/6/5/4 partition in Australasia, Europe, the U.K., and the U.S. Chen et al.
19 Summers and Sweeney (1998) use a similar approach. They screen the litigation history of their control firms for 7
years after the sample period to ensure none of them were accused of fraud.20 We thank a referee for this suggestion.
G. Chen et al. / Journal of Corporate Finance 12 (2006) 424–448 437
(2001) and Qiu (2004) use a Big 10 classification (auditors with the 10 highest market shares) as
a proxy for high audit quality in China. We use the same proxy. An alternative measure of audit
quality is to use the international Big 5 name. Here auditors that are joint ventures with one of
the international Big 5 are coded one (1). In China the foreign audit firms cannot directly audit
domestic companies. However, many of the large international audit firms have joint ventures
with Chinese CPAs to which they provide training and inculcate western audit philosophies. It is
generally believed that Chinese CPAs that have joint ventures with the international Big 5 are
higher quality firms (Qiu, 2004). These two auditor quality variables (the domestic Big 10 and
auditors with affiliations with the international Big 5) are used to test H3. The names of auditors
are obtained from annual reports.
3.4. Univariate tests
To test the relation between fraud and ownership and governance structures we use both
univariate comparisons and a multivariate probit regression. For the univariate tests we compare
the experimental and control variables across the fraud firms and the no-fraud firms to see if
there are significant differences. We use t-tests and Z-tests to check for significant differences in
means and medians.
3.5. Multivariate tests
In addition to the univariate tests we also use a multivariate probit model to test our
hypotheses. Similar to Beasley (1996), Agrawal and Chadha (in press), and Uzun et al. (2004),
the estimation is based on a choice-based sample where half the firms have financial fraud and
half have not. This approach is acceptable as the aim of the model is to explain rather than to
predict (Maddala, 1991; Palepu, 1986). The simple probit regression model is as follows:
FRAUD ¼ b0 þ b1OUTþ b2BOARDSIZE þ b3MEETINGþ b4CHATEN
þ b5DUALþ b6LEGALþ b7INDIVþ b8FORþ b9TOPþ b10TOP10
þ b11AUDITORþ b12GROWTHþ b13LOSSþ b14LEV
þ b15RETURNþ b16MINDEX ð1Þ
where:
FRAUD A dummy variable taking the value one (1) if the firm is subject to an enforcement
action.
OUT Proportion of outside (or non-executive) directors on the board.
BOARDSIZE The number of directors on the board.
MEETING Number of board meetings held in a year.
CHATEN The number of years that the chairman has served in that position.
DUAL A dummy variable taking the value one (1) if the chairman and CEO positions are held
by the same person.
LEGAL Proportion of shares owned by legal entities.
INDIV Proportion of shares owned by individual stockholders.
FOR A dummy variable taking the value one (1) if the firm has foreign stockholders.

G. Chen et al. / Journal of Corporate Finance 12 (2006) 424–448438
TOP The percentage of shares held by the largest stockholder.
TOP10 A Herfindahl index that measures the concentration of shares held by the top 10
stockholders excluding the controlling one. It is computed asP10
n¼2SnS
� �2where Sn is the
number of shares held by the nth largest stockholder, and S is the number of total
outstanding shares.
AUDITOR A dummy variable coded one (1) if the auditor is one of the 10 biggest auditors by
market share.21
GROWTH Sales growth in the 2 years prior to the date of the financial fraud.
LOSS A dummy variable coded one (1) if the firm has recorded a loss in each of the 2 years
prior to the financial fraud. If a third year of losses is reported then trading of the shares
will be suspended on the stock exchange.
LEV Debt to total assets.
RETURN Annual stock return.
MINDEX A market development score.
The Big 10 auditors are Da Hua, Zhong Tian Qin,22 Zhongtian, Huaming, Shenzhen
Pengcheng, Shu Lun Pan, Beijing Jingdu, Shanghai Zhonghua Huyin, Shanghai Shanghui, and
Huaqiang. These auditors had the 10 largest market shares based on the assets of listed companies.
The independent variables are measured in the year before the fraud commences. GROWTH,
LOSS, LEV, and RETURN are used in the detection of fraud model (see below). In the U.S.,
Loebbecke et al. (1989) and Bell et al. (1991) contend that very rapid growth is an indicator of
fraud. They further argue that firms in financial trouble are more likely to be examined for
financial statement fraud.23 We use the existence of a loss and stock return to proxy for financial
distress. LEV is also a measure of financial difficulties and companies with high leverage are
more likely to be investigated by the CSRC.
The univariate and multivariate analyses compare a sample of fraud firms with a sample of
no-fraud firms. However, it is possible that the no-fraud firms have committed fraud but they
have not been caught. This identification problem will reduce the ability of our model to explain
fraud.24 The probability of a detected fraud is different from the probability of a fraud occurrence
(unless all frauds are detected, which is extremely unlikely). As Wang (2004) points out, the
identification problem can make it difficult to interpret the empirical results from a simple probit
model. A specific independent variable (e.g. a corporate governance variable) could have a
negative effect on committing fraud but a positive effect on detecting fraud. The simple probit
model will not catch such subtleties and the coefficient on the variable will be difficult to
interpret. To resolve the inherent problem of treating non-observed fraud as no-fraud, we make
use of a bivariate probit model with partial observability; see Poirier (1980) for details of the
technique. Here, we model detected fraud as a function of the joint realizations of two latent
variables (fraud and fraud detection):25
1 In an alternative formulation we code AUDITOR one (1) if the auditor has a joint-venture with one of the
ternational Big 5 auditors.
4 As previously described, we try to reduce the identification problem by insisting that the no-fraud control firms have
ot been the subject of an enforcement action throughout the period 1995 to 2003, and that they have no evidence of
3 Note, Beasley (1996) examined growth and financial health (losses) in his study but found they did not help predict
orporate fraud.
2 By way of note, the auditing license for Zhong Tian Qin was subsequently withdrawn given its role in the Yin
uangxia corporate scandal.
2
in
2
n
2
c
2
G
substantial earnings management.25 The following section draws heavily on Poirier (1980) and Wang (2004).

G. Chen et al. / Journal of Corporate Finance 12 (2006) 424–448 439
Fraud: Fj =1 if firm j commits fraud. Otherwise, Fj=0.
Fraud detection: Dj =1 if the CSRC detects the fraud of firm j. Otherwise Dj =0.
From this we have the following reduced form equations.
Fj ¼ x1jb1 þ uj ð2Þ
Dj ¼ x2jb2 þ vj ð3Þ
where x1j is the vector of corporate governance variables that helps explain a firm’s propensity to
commit fraud, and x2j is the vector of variables that helps explain why fraud is detected. uj and vjare the disturbance terms.
The interaction of Fj and Dj is denoted by Zj. Thus:
Zj ¼ Fj4Dj ð4Þ
Then Zj =1 indicates a detected fraud. The empirical model for Zj is
P Zj ¼ 1� �
¼ P Fj ¼ 1&Dj ¼ 1� �
¼ P Fj ¼ 1� �
P Dj ¼ 1jFj ¼ 1� �
¼ U x1jb1; x2jb2
� �ð5Þ
P Zj ¼ 0� �
¼ P Fj ¼ 0orDj ¼ 0� �
¼ P Fj ¼ 0� �
þ P Fj ¼ 1� �
P Dj ¼ 0jFj ¼ 1� �
¼ 1� U x1jb1; x2jb2
� �ð6Þ
The log-likelihood function for the model is
L b1; b2ð Þ ¼ R zj ln U x1jb1; x2jb2
� �þ 1� zj� �
ln 1� U x1jb1; x2jb2
� �� �� ��ð7Þ
Full identification of the model parameters requires that x1j and x2j do not contain exactly the
same variables.
Note that a simple probit model, which has been used in most prior fraud studies, is as follows
Zj ¼ Fj ¼ xjbþ ej
Pr Zj ¼ 1� �
¼ Pr Fj ¼ 1� �
¼ U x1jb� �
ð8Þ
If Dj is not always 1, the coefficients in the simple probit model will differ from those in the
bivariate probit model. Wang (2004) used a similar bivariate probit with partial observability
approach in her study of securities class action litigation in the U.S. Abowd and Farber (1982)
and Chidambaran and Prabhala (2003) are others who have used this method.
We use the variables OUT, BOARDSIZE, MEETING, CHATEN, DUAL, LEGAL, INDIV26,
FOR, TOP, TOP10, AUDITOR, and MINDEX to model the propensity to commit fraud. The
first 11 variables are use to test H1 to H3. The market environment where the firm is located may
have an effect on the propensity to commit fraud. For this reason we add MINDEX as a control
variable in the model. GROWTH, LOSS, LEV, RETURN, and AUDITOR are used to model the
detection of fraud. Poor financial performance often triggers an initial investigation by the
regulator. Additionally, we believe that poor financial performance may be a trigger for investor
complaints to the CSRC and these complaints may be followed up by an investigation. Wang
26 The third type of stockholder, the government (GOVERN), is not included in the model as GOVERN, LEGAL, and
INDIV sum to one (1) and hence there would be perfect collinearity.
G. Chen et al. / Journal of Corporate Finance 12 (2006) 424–448440
(2004) also used financial performance as a variable for the detection of fraud in her bivariate
probit model of corporate fraud in the U.S. AUDITOR is used as a variable in the propensity to
commit fraud model and in the detection of fraud model.
4. Results
4.1. Details of enforcement actions
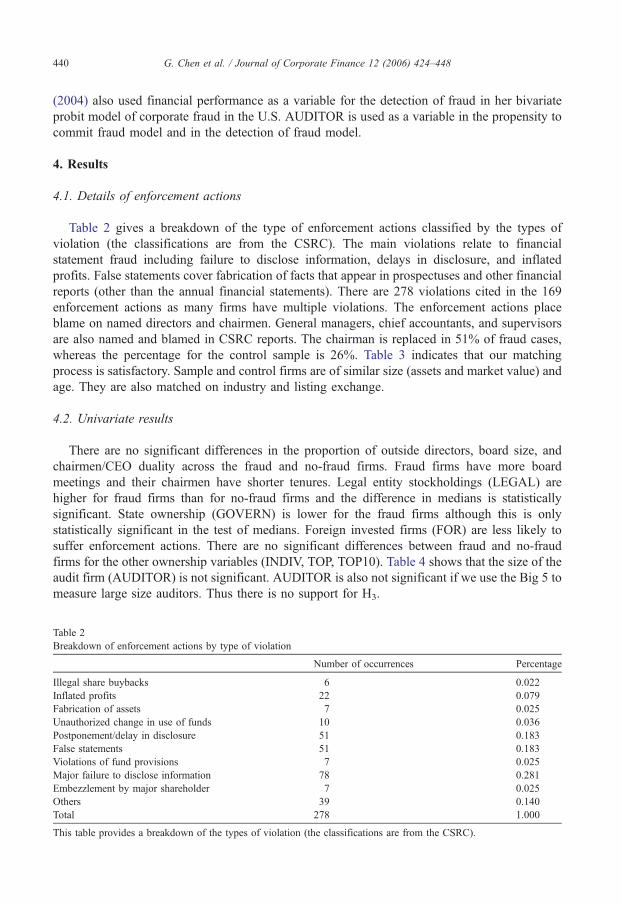
Table 2 gives a breakdown of the type of enforcement actions classified by the types of
violation (the classifications are from the CSRC). The main violations relate to financial
statement fraud including failure to disclose information, delays in disclosure, and inflated
profits. False statements cover fabrication of facts that appear in prospectuses and other financial
reports (other than the annual financial statements). There are 278 violations cited in the 169
enforcement actions as many firms have multiple violations. The enforcement actions place
blame on named directors and chairmen. General managers, chief accountants, and supervisors
are also named and blamed in CSRC reports. The chairman is replaced in 51% of fraud cases,
whereas the percentage for the control sample is 26%. Table 3 indicates that our matching
process is satisfactory. Sample and control firms are of similar size (assets and market value) and
age. They are also matched on industry and listing exchange.
4.2. Univariate results
There are no significant differences in the proportion of outside directors, board size, and
chairmen/CEO duality across the fraud and no-fraud firms. Fraud firms have more board
meetings and their chairmen have shorter tenures. Legal entity stockholdings (LEGAL) are
higher for fraud firms than for no-fraud firms and the difference in medians is statistically
significant. State ownership (GOVERN) is lower for the fraud firms although this is only
statistically significant in the test of medians. Foreign invested firms (FOR) are less likely to
suffer enforcement actions. There are no significant differences between fraud and no-fraud
firms for the other ownership variables (INDIV, TOP, TOP10). Table 4 shows that the size of the
audit firm (AUDITOR) is not significant. AUDITOR is also not significant if we use the Big 5 to
measure large size auditors. Thus there is no support for H3.
Table 2
Breakdown of enforcement actions by type of violation
Number of occurrences Percentage
Illegal share buybacks 6 0.022
Inflated profits 22 0.079
Fabrication of assets 7 0.025
Unauthorized change in use of funds 10 0.036
Postponement/delay in disclosure 51 0.183
False statements 51 0.183
Violations of fund provisions 7 0.025
Major failure to disclose information 78 0.281
Embezzlement by major shareholder 7 0.025
Others 39 0.140
Total 278 1.000
This table provides a breakdown of the types of violation (the classifications are from the CSRC).

Table 3
Comparison of fraud firms and control firms
Currency: RMB (mn=million)
Fraud-firms Control firms t-value Z-value
Total assets (mn)
Mean 2192.46 2301.44 � 0.4732 � 1.3521
Median 1584.69 1406.70
Standard deviation 1730.15 2614.79
Net sales (mn)
Mean 1110.46 1540.89 � 1.6874 � 1.3932
Median 696.90 507.72
Standard deviation 1314.14 3212.49
Current market value (mn)
Mean 4136.23 3919.07 0.5792 � 0.3892
Median 3116.42 2802.35
Standard deviation 3907.27 3328.42
Listing age (year)
Mean 6.04 6.31 � 0.8806 0.9023
Median 6.00 7.00
Standard deviation 2.87 3.13
Firm age (year)
Mean 8.34 8.53 � 0.4152 0.0339
Median 8.00 8.00
Standard deviation 4.20 4.84
This table compares the basic characteristics between fraud firms and control firms. The matching sample is selected
based on similar industry, listing exchange, and firm size.
G. Chen et al. / Journal of Corporate Finance 12 (2006) 424–448 441
It is apparent that fraud firms have poor financial performance when compared to the no-fraud
firms. Fraud firms have lower growth, suffer more losses, and have lower stock returns. Fraud
firms have a higher mean leverage, but lower median, than no-fraud firms. There is no difference
across fraud and no-fraud firms as regards the development index (MINDEX) of their locations.
4.3. Multivariate tests
The results of the probit regressions are shown in Table 5. The first column lists the variables.
The second and third columns show the coefficients and t-statistics of the simple probit model.
Columns 4 and 5 show the coefficients and t-statistics of the model of the propensity to commit
fraud and columns 6 and 7 show the coefficients and t-statistics of the model of the detection of
fraud.
The number of outside directors (OUT) has a negative sign in the P(Fj=1) regression and is
statistically significant at the 0.05 level (one tail test). Firms with a large proportion of outside
directors commit less fraud. Outside directors monitor a firm’s actions and they help deter fraud.
Agrawal and Chadha (in press) and Park and Shin (2004) find that outside directors only become
effective in deterring fraud and earnings management in the U.S. and Canada when at least one
of those directors has an accounting or finance background. Unfortunately we do not have this
type of data for our sample and so we cannot test whether it is the financial expertise of the
outside directors that helps prevent fraud. The number of board meetings (MEETING) is also
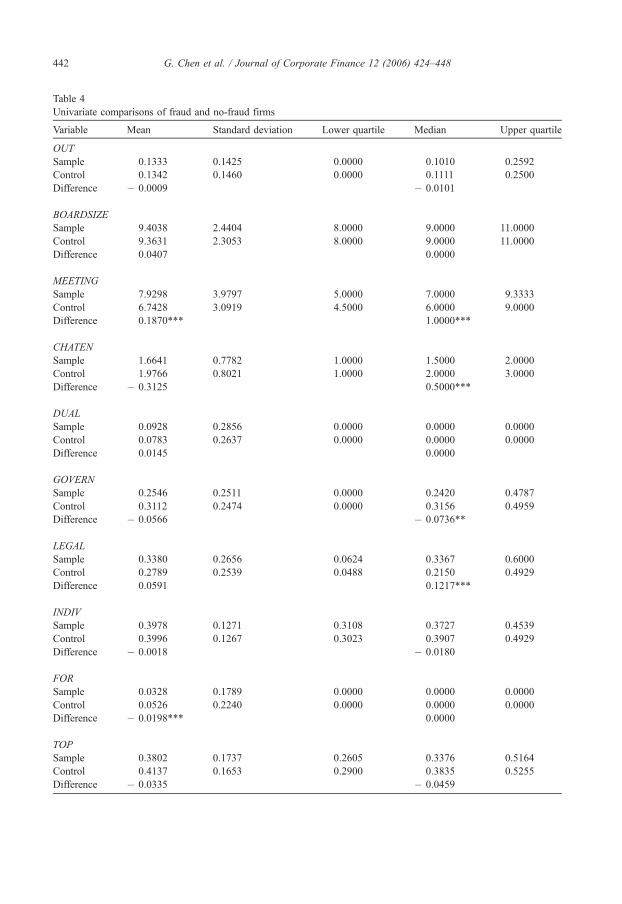
Table 4
Univariate comparisons of fraud and no-fraud firms
Variable Mean Standard deviation Lower quartile Median Upper quartile
OUT
Sample 0.1333 0.1425 0.0000 0.1010 0.2592
Control 0.1342 0.1460 0.0000 0.1111 0.2500
Difference � 0.0009 � 0.0101
BOARDSIZE
Sample 9.4038 2.4404 8.0000 9.0000 11.0000
Control 9.3631 2.3053 8.0000 9.0000 11.0000
Difference 0.0407 0.0000
MEETING
Sample 7.9298 3.9797 5.0000 7.0000 9.3333
Control 6.7428 3.0919 4.5000 6.0000 9.0000
Difference 0.1870*** 1.0000***
CHATEN
Sample 1.6641 0.7782 1.0000 1.5000 2.0000
Control 1.9766 0.8021 1.0000 2.0000 3.0000
Difference � 0.3125 0.5000***
DUAL
Sample 0.0928 0.2856 0.0000 0.0000 0.0000
Control 0.0783 0.2637 0.0000 0.0000 0.0000
Difference 0.0145 0.0000
GOVERN
Sample 0.2546 0.2511 0.0000 0.2420 0.4787
Control 0.3112 0.2474 0.0000 0.3156 0.4959
Difference � 0.0566 � 0.0736**
LEGAL
Sample 0.3380 0.2656 0.0624 0.3367 0.6000
Control 0.2789 0.2539 0.0488 0.2150 0.4929
Difference 0.0591 0.1217***
INDIV
Sample 0.3978 0.1271 0.3108 0.3727 0.4539
Control 0.3996 0.1267 0.3023 0.3907 0.4929
Difference � 0.0018 � 0.0180
FOR
Sample 0.0328 0.1789 0.0000 0.0000 0.0000
Control 0.0526 0.2240 0.0000 0.0000 0.0000
Difference � 0.0198*** 0.0000
TOP
Sample 0.3802 0.1737 0.2605 0.3376 0.5164
Control 0.4137 0.1653 0.2900 0.3835 0.5255
Difference � 0.0335 � 0.0459
G. Chen et al. / Journal of Corporate Finance 12 (2006) 424–448442

Table 4 (continued)
Variable Mean Standard deviation Lower quartile Median Upper quartile
TOP10
Sample 0.0218 0.0252 0.0011 0.0114 0.0371
Control 0.0185 0.0255 0.0009 0.0079 0.0241
Difference 0.0033 0.0035
AUDITOR
Sample 0.1182 0.3160 0.0000 0.0000 0.0000
Control 0.1155 0.3184 0.0000 0.0000 0.0000
Difference 0.0027 0.0000
GROWTH
Sample 0.0310 1.0583 � 0.6236 � 0.1105 0.3727
Control 0.4489 0.7992 � 0.0702 0.3272 0.7787
Difference � 0.4179*** � 0.4377***
LOSS
Sample 0.1176 0.3239 0.0000 0.0000 0.0000
Control 0.0305 0.1679 0.0000 0.0000 0.0000
Difference 0.0871** 0.0000
LEV
Sample 0.5510 0.1648 0.0000 0.1370 0.6466
Control 0.4770 0.0703 0.0000 0.2160 0.6450
Difference 0.0740*** � 0.0790
RETURN
Sample � 0.1701 0.3600 � 0.4143 � 0.2328 0.0581
Control � 0.0834 0.3525 � 0.3072 � 0.1726 0.0115
Difference � 0.0867 � 0.0602**
MINDEX
Sample 6.4787 1.2161 5.6100 6.3975 7.1500
Control 6.5062 1.3623 5.6100 6.4000 7.9000
Difference � 0.0275 � 0.0025
*** (**, *) statistically significant at the 0.01 (0.05, 0.10) levels.
OUT=proportion of outside directors on the board; BOARDSIZE=the number of board directors; MEETING=the
number of board meetings held per year; CHATEN=the number of years that the chairman has served in that position
DUAL=a dummy variable taking the value one (1) if the chairman and CEO positions are held by the same person
GOVERN=proportion of shares owned by government; LEGAL=proportion of shares owned by legal entities
INDIV=proportion of shares owned by individual stockholders; FOR=a dummy variable taking the value one (1) if the
firm has foreign stockholders; TOP=the percentage of shares held by the largest stockholder; TOP10=a Herfindahl index
that measures the concentration of shares held by the top 10 stockholders excluding the controlling one. It is computed
asP10
n¼2SnS
� �2where Sn is the number of shares held by the nth largest stockholder, and S is the number of tota
outstanding shares; AUDITOR=a dummy variable coded one (1) if the auditor was one of the 10 biggest auditors by
market share; GROWTH=sales growth in the 2 years prior to the date of the financial fraud; LOSS=a dummy variable
coded one (1) if the firm had recorded a loss in each of the 2 years prior to the financial fraud. If a third year of losses is
reported then trading of the shares will be suspended on the stock exchange; LEV=debt to total assets
RETURN=annual stock return; MINDEX=a comprehensive index to capture the regional market development from
the following aspects: (1) relationship between government and markets, such as the role of markets in allocating
resources and enterprises’ burden in addition to normal taxes; (2) the development of non-state business, such as the ratio
of industrial output by private sector to total industrial outputs; (3) development of product markets, such as regiona
trade barriers; (4) development of factor markets such as FDI and mobility of labor; (5) development of marke
intermediaries and legal environment such as the protection of property rights.
G. Chen et al. / Journal of Corporate Finance 12 (2006) 424–448 443
;
;
;
l
;
l
t
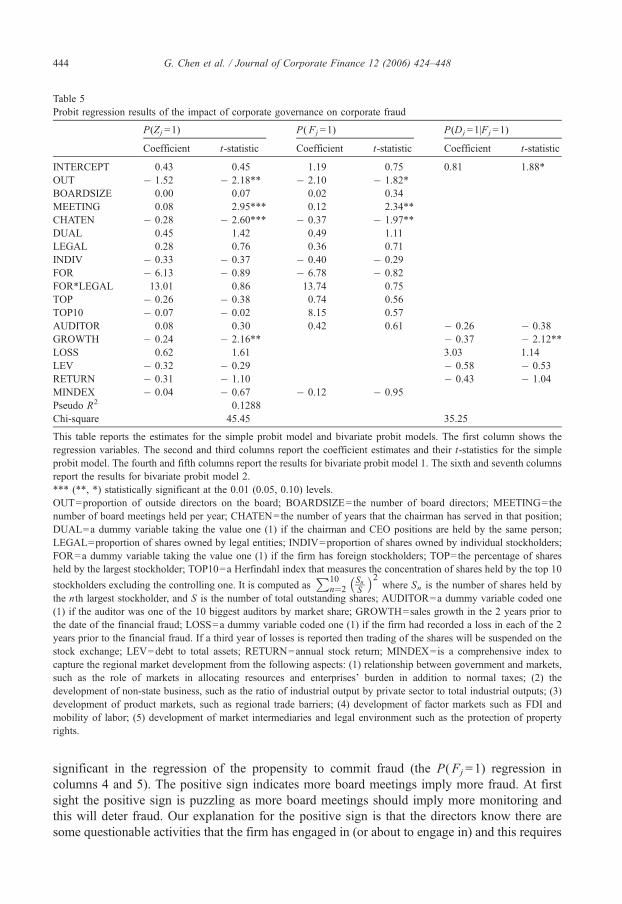
Table 5
Probit regression results of the impact of corporate governance on corporate fraud
P(Zj =1) P( Fj =1) P(Dj =1|Fj =1)
Coefficient t-statistic Coefficient t-statistic Coefficient t-statistic
INTERCEPT 0.43 0.45 1.19 0.75 0.81 1.88*
OUT � 1.52 � 2.18** � 2.10 � 1.82*
BOARDSIZE 0.00 0.07 0.02 0.34
MEETING 0.08 2.95*** 0.12 2.34**
CHATEN � 0.28 � 2.60*** � 0.37 � 1.97**
DUAL 0.45 1.42 0.49 1.11
LEGAL 0.28 0.76 0.36 0.71
INDIV � 0.33 � 0.37 � 0.40 � 0.29
FOR � 6.13 � 0.89 � 6.78 � 0.82
FOR*LEGAL 13.01 0.86 13.74 0.75
TOP � 0.26 � 0.38 0.74 0.56
TOP10 � 0.07 � 0.02 8.15 0.57
AUDITOR 0.08 0.30 0.42 0.61 � 0.26 � 0.38
GROWTH � 0.24 � 2.16** � 0.37 � 2.12**
LOSS 0.62 1.61 3.03 1.14
LEV � 0.32 � 0.29 � 0.58 � 0.53
RETURN � 0.31 � 1.10 � 0.43 � 1.04
MINDEX � 0.04 � 0.67 � 0.12 � 0.95
Pseudo R2 0.1288
Chi-square 45.45 35.25
This table reports the estimates for the simple probit model and bivariate probit models. The first column shows the
regression variables. The second and third columns report the coefficient estimates and their t-statistics for the simple
probit model. The fourth and fifth columns report the results for bivariate probit model 1. The sixth and seventh columns
report the results for bivariate probit model 2.
*** (**, *) statistically significant at the 0.01 (0.05, 0.10) levels.
OUT=proportion of outside directors on the board; BOARDSIZE=the number of board directors; MEETING=the
number of board meetings held per year; CHATEN=the number of years that the chairman has served in that position;
DUAL=a dummy variable taking the value one (1) if the chairman and CEO positions are held by the same person;
LEGAL=proportion of shares owned by legal entities; INDIV=proportion of shares owned by individual stockholders;
FOR=a dummy variable taking the value one (1) if the firm has foreign stockholders; TOP=the percentage of shares
held by the largest stockholder; TOP10=a Herfindahl index that measures the concentration of shares held by the top 10
stockholders excluding the controlling one. It is computed asP10
n¼2SnS
� �2where Sn is the number of shares held by
the nth largest stockholder, and S is the number of total outstanding shares; AUDITOR=a dummy variable coded one
(1) if the auditor was one of the 10 biggest auditors by market share; GROWTH=sales growth in the 2 years prior to
the date of the financial fraud; LOSS=a dummy variable coded one (1) if the firm had recorded a loss in each of the 2
years prior to the financial fraud. If a third year of losses is reported then trading of the shares will be suspended on the
stock exchange; LEV=debt to total assets; RETURN=annual stock return; MINDEX=is a comprehensive index to
capture the regional market development from the following aspects: (1) relationship between government and markets,
such as the role of markets in allocating resources and enterprises’ burden in addition to normal taxes; (2) the
development of non-state business, such as the ratio of industrial output by private sector to total industrial outputs; (3)
development of product markets, such as regional trade barriers; (4) development of factor markets such as FDI and
mobility of labor; (5) development of market intermediaries and legal environment such as the protection of property
rights.
G. Chen et al. / Journal of Corporate Finance 12 (2006) 424–448444
significant in the regression of the propensity to commit fraud (the P(Fj=1) regression in
columns 4 and 5). The positive sign indicates more board meetings imply more fraud. At first
sight the positive sign is puzzling as more board meetings should imply more monitoring and
this will deter fraud. Our explanation for the positive sign is that the directors know there are
some questionable activities that the firm has engaged in (or about to engage in) and this requires
G. Chen et al. / Journal of Corporate Finance 12 (2006) 424–448 445
a lot of debate, which results in more meetings.27 The chairman’s tenure (CHATEN) has a
negative sign and is statistically significant. Firms with chairmen with shorter tenure are more
likely to commit fraud. Chairmen with short tenures have less experience of the business and
they may be less able to deter fraud. BOARDSIZE and DUAL are not significant. The results
indicate that some board characteristics are important in explaining corporate fraud. The
evidence supports H1.
The ownership variables are not significant although LEGAL, INDIV, and FOR have their
expected signs. We also add an interactive term FOR*LEGAL to examine whether the presence
of a foreign investor affects the influence of legal entity stockholders.28 However the main
effects (LEGAL, FOR) and the interactive effect (FOR*LEGAL) are not significant. The
ownership variables results provide no support for H2.
We include AUDITOR in both the propensity to commit fraud model (P(Fj=1)) and the
fraud detection model (P(Dj =1|Fj =1)). In the fraud propensity model the sign on AUDITOR is
positive. In the detection model, the sign on AUDITOR is negative indicating that if there is
fraud then it is more likely to be detected if the auditor is not a prestige name. This suggests the
CSRC is more likely to launch an investigation if the auditor is not a major firm. Note, however,
that the coefficients on AUDITOR are not significant. Hence there is no statistical support for
H3. In additional regressions we use the international Big 5 as our measure of prestige auditors.
AUDITOR remains not significant in these regressions.
The fraud detection model uses AUDITOR and the financial performance measures as
independent variables. The signs on the coefficients are consistent with our expectations. Poor
financial performance is likely to trigger fraud detection. The CSRC uses reports of losses, low
growth, and poor stock returns as indicators of fraud and therefore launches investigations.
While the signs on the coefficients are consistent with our predictions, only GROWTH is
statistically significant.
For our sample, the simple probit model yields results that are similar to those of the
propensity to commit fraud model in the bivariate probit framework. Nevertheless, we believe
the bivariate probit model is the appropriate method when there is partial observation of the
event under examination. Using the bivariate probit approach gives us more confidence in the
results.
5. Conclusions
Transition economies provide much scope for corporate fraud. Controlling stockholders and
managers, newly freed from the constraints imposed by central planning, and faced with
opportunities to increase their personal wealth, may be tempted to engage in, or acquiesce to,
corporate fraud. The emphasis on making higher profits and increasing the stock price represent
new pressures on top managers and some of them may resort to fraud to meet these objectives.
There is also pressure to expropriate assets for the benefit of controlling stockholders or the
personal business interests of the managers. In an attempt to reduce egregious acts of fraud,
China has scrambled to introduce commercial and securities laws and, equally important,
strengthen the powers and effectiveness of the regulator, the CSRC. The enforcement actions of
the CSRC provide the fraud data for our study.
28 We thank a reviewer for suggesting this analysis.
27 Note the agendas and minutes of directors’ meetings are not available to us and so we have no way of knowing wha
discussions took place.
t

G. Chen et al. / Journal of Corporate Finance 12 (2006) 424–448446
The particular concern of our research is whether the ownership and governance
characteristics of firms play a role in the propensity to commit fraud. We use both univariate
analyses and bivariate probit models with partial observability to test our hypotheses. Based on
our multivariate results we find that boardroom characteristics are a factor in explaining fraud
while ownership patterns appear to be unimportant. Increasing the proportion of outsiders on the
board is one way to reduce fraud. Outsiders monitor management (including the executive
directors) and help deter fraud. The fact that firms that commit frauds have more board meetings
suggests the directors realize some acts or decisions are borderline legal and so there is more
debate about them resulting in more meetings. Chairmen with shorter tenure appear less able to
deter fraud.
The type of stockholder is significant in the univariate analysis with legal entities
encouraging fraud while foreign investors inhibit fraud. The significances of these variables
disappear in the multivariate analysis. In the probit model, the type of owner (legal entity,
individual, foreign) has little impact on the propensity for a firm to commit fraud. Prestige
auditors (based on size and based on the international Big 5) do not deter corporate fraud any
more than other auditors.
Corporate fraud is an unwelcome accompaniment to China’s modern enterprise reforms and
the China Securities Regulatory Commission is empowered to investigate and penalize fraud.
The make-up of the board of directors is important in monitoring top management. Increasing
the proportion of outside directors will help deter fraud and investors should factor this into their
investment decisions. The CSRC’s recent move to require more outside directors is a move in
the right direction.
Acknowledgements
We thank Jeffry Netter (the editor) and an anonymous referee for their helpful comments and
suggestions. We also thank Jenice Prather-Kinsey (the discussant) and seminar participants at the
2005 AAA meeting for providing constructive feedback. Daniel Gao acknowledges financial
support from a post-doctoral fellowship at the Hong Kong Polytechnic University, Chen and
Firth acknowledge financial support from the Hong Kong Polytechnic University, and Rui
acknowledges support from the APIB Fund at the Chinese University of Hong Kong.
References
Abowd, J., Farber, H., 1982. Job queues and union status of workers. Industrial and Labor Relations Review 35,
354–367.
Agrawal, A., Chadha, S., in press. Corporate governance and accounting scandals. Journal of Law and Economics.
Allen, F., Qian, J., Qian, M., 2005. Law, finance, and economic growth in China. Journal of Financial Economics 77 (1),
57–116.
Bai, C.E., Li, D.D., Tao, Z., Wang, Y., 2000. A multitask theory of state enterprise reform. Journal of Comparative
Economics 28, 716–738.
Beasley, M.S., 1996. An empirical analysis of the relation between the board of director composition and financial
statement fraud. The Accounting Review 71, 443–465 (October).
Beasley, M.S., Carcello, J.V., Hermanson, D.R., Lapides, P.D., 2000. Fraudulent financial reporting: consideration of
industry traits and corporate governance mechanisms. Accounting Horizons 14, 441–454 (December).
Bell, T.B., Szykowny, J., Willingham, J.J., 1991. Assessing the Likelihood of Fraudulent Financial Reporting: A
Cascaded Logit Approach. Working Paper. KPMG Peat Marwick, Montvale, NJ.
Bortolotti, B., Faccio, M., 2004. Reluctant Privatization. Working Paper. University of Torino.
Cao, Y., Qian, Y., Weingast, B.R., 1999. From federalism, Chinese style, to privatization, Chinese style. Economics of
Transition 7, 103–131.
G. Chen et al. / Journal of Corporate Finance 12 (2006) 424–448 447
Chen, G.M., Firth, M., Rui, O.M., 1998. The Economic Performance of Privatized Firms in the People’s Republic of
China. Working Paper. The Hong Kong Polytechnic University.
Chen, C.J.P., Chen, S., Su, X.J., 2001. Profitability regulation, earnings management, and modified audit opinions:
evidence from China. Auditing: A Journal of Practice and Theory 20, 1–30.
Chen, G.M., Firth, M., Rui, O.M., in press-a. Have China’s enterprise reforms led to improved efficiency and
profitability? Emerging Markets Review.
Chen, G.M., Firth, M., Gao, D.N., Rui, O.M., in press-b. Is China’s securities regulatory agency a toothless tiger? Journal
of Accounting and Public Policy.
Chidambaran, N.K., Prabhala, N.R., 2003. Executive stock option repricing, internal governance mechanisms, and
management turnover. Journal of Financial Economics 69, 153–189.
Chung, R., Firth, M., Kim, J.-B., 2002. Institutional monitoring and opportunistic earnings management. Journal of
Corporate Finance 8, 29–48.
Clarke, D.C., 2003. Corporate Governance in China: An Overview. Working Paper. University of Washington.
Dahya, J., McConnell, J.J., 2005. Outside directors and corporate board decisions. Journal of Corporate Finance 11,
85–106.
Dahya, J., Karbhari, Y., Xiao, J., Yang, M., 2003. The usefulness of the supervisory board report in China. Corporate
Governance: An International Review 11 (4), 308–321.
Daouk, H., Lee, C.M.C., Ng, D.T., 2006. Capital market governance: how do securities laws affect market performance?.
Journal of Corporate Finance 12, 560–593. doi:10.1016/j.jcorpfin.2005.03.003 (this issue).
DeAngelo, L., 1981. Auditor size and audit quality. Journal of Accounting and Economics 3, 183–199.
Dechow, P.M., Sloan, R.G., Sweeney, A.P., 1996. Cases and consequences of earnings manipulations: an analysis of
firms subject to enforcement actions by the SEC. Contemporary Accounting Research 13 (1), 1–36.
Demurger, S., Sachs, J.D., Woo, W.T., Bao, S., Chang, G., Mellinger, A., 2002. Geography, economic policy, and
regional development in China. Working Paper, vol. 8897. NBER.
Denis, D.J., Hanouna, P., Sarin, A., 2006. Is there a dark side to incentive compensation?. Journal of Corporate Finance
12, 467–488. doi:10.1016/j.jcorpfin.2005.08.006 (this issue).
Fama, E.F., Jensen, M.C., 1983. Separation of ownership and control. Journal of Law and Economics 26, 301–325
(June).
Fan, G., Wang, X., 2003. NERI Index of Marketization of China’s Provinces. Economics Science Press, Beijing (in
Chinese).
Firth, M., Mo, P., Wong, R., 2004. Auditors’ responsibilities for detecting frauds: a cause and consequence analysis of the
CSRC enforcement actions in China. Working Paper. Hong Kong Polytechnic University.
Gao, S., 1996. China’s Economic Reform. Macmillan Press, London.
Groves, T., Hong, Y., McMillan, J., Naughton, B., 1994. Autonomy and incentives in Chinese state enterprises. Quarterly
Journal of Economics 109, 181–209.
Gupta, N., 2005. Partial privatization and firm performance. Journal of Finance 60 (2), 987–1014.
Haw, I.-M., Hui, B., Hwang, L.-S., Wu, W., 2004. Ultimate ownership, income management, and legal and extra-legal
institutions. Journal of Accounting Research 42, 423–462.
Jensen, M.C., 1993. The modern industrial revolution, exit, and the failure of internal control systems. The Journal of
Finance 48, 831–880.
Khanna, T., Palepu, K., 2000. Emerging market business groups, foreign investors, and corporate governance. NBER
Working Paper 6955.
La Porta, R., Lopez-de-Silanes, F., Shleifer, A., Vishny, R.W., 1998. Law and finance. Journal of Political Economy 106,
1113–1155.
La Porta, R., Lopez-de-Silanes, F., Shleifer, A., Vishny, R.W., 2002. Investor protection and corporate valuation. Journal
of Finance 57, 1147–1170.
Li, J.G., 2001. A study on the asymmetry in the Chinese securities market. Finance and Trading Economics 12, 20–33
(in Chinese).
Li, H., Zhou, L.-A., 2005. Political turnover and economic performance: the incentive role of personnel control in China.
Journal of Public Economics 89 (9/10), 1743–1762.
Lin, Y.M., Zhu, T., 2001. Ownership restructuring in Chinese state industry: an analysis of evidence on initial
organizational changes. China Quarterly 166, 305–341.
Loebbecke, J.K., Eining, M.M., Willingham, J.J., 1989. Auditors’ experience with material irregularities: frequency,
nature, and detectability. Auditing: A Journal of Practice and Theory 9, 1–28 (Fall).
Maddala, G.S., 1991. A perspective on the use of limited-dependent and qualitative variables models in accounting
research. The Accounting Review 66, 788–807 (October).
G. Chen et al. / Journal of Corporate Finance 12 (2006) 424–448448
Mao, Z.R., 2002. The effect of penalties for information disclosure violation. Shenzhen Stock Exchange Research
Report, vol. 54 (in Chinese).
McMullen, D.A., 1996. Audit committee performance: an investigation of the consequences associated with audit
committees. Auditing: A Journal of Practice and Theory 16, 87–103 (Spring).
Palepu, K., 1986. Predicting takeover targets: a methodological and empirical analysis. Journal of Accounting and
Economics 8, 3–35.
Park, Y.W., Shin, H.-H., 2004. Board composition and earnings management in Canada. Journal of Corporate Finance 10,
431–457.
Peasnell, K.V., Pope, P.F., Young, S., 2000. Accrual management to meet earnings targets: U.K. evidence pre- and post-
Cadbury. British Accounting Review 32, 415–445.
Peasnell, K., Pope, P.F., Young, S., 2005. Board monitoring and earnings management: do outside directors influence
abnormal accruals? Journal of Business Finance and Accounting 32 (7/8), 1311–1346.
Poon, W., Firth, M., Fung, H.-G., 1998. Asset pricing in segmented capital markets: preliminary evidence from China-
domiciled companies. Pacific-Basin Finance Journal 6, 307–319.
Poirier, D.J., 1980. Partial observability in bivariate probit models. Journal of Econometrics 12, 209–217.
Qiu, A., 2004. Audit quality and earnings management: empirical evidence from China’s stock market. PhD dissertation,
The Hong Kong Polytechnic University.
Roe, M.J., 2002. Corporate law’s limits. Journal of Legal Studies 31, 233–271.
Summers, S.L., Sweeney, J.T., 1998. Fraudulently misstated financial statements and insider trading: an empirical
analysis. The Accounting Review 73, 131–146.
Tong, D., 2003. The state of corporate governance in China. Paper presented at the American Accounting Association
Conference, Hawaii.
Wang, T.Y., 2004. Economic Determinants of Corporate Fraud Propensity and Detection. Working Paper. University of
Maryland.
Uzun, H., Szewczyk, S.H., Varma, R., 2004. Board composition and corporate fraud. Financial Analysts Journal 60,
33–43.
Vafeas, N., 1999. Board meeting frequency and firm performance. Journal of Financial Economics 53, 113–142.
Xu, L., 2004. Types of Large Shareholders, Corporate Governance, and Firm Performance: Evidence from China’s Listed
Firms. Working Paper. Zhongshan University.
Yermack, D., 1996. Higher market valuations of companies with a small board of directors. Journal of Financial
Economics 40, 185–211.