bottom-up corporate governance - nyupages.stern.nyu.edu/~alandier/pdfs/governance.pdfbottom-up...
TRANSCRIPT
Bottom-Up Corporate Governance�
Augustin Landier y David Sraerz David Thesmarx
August 22, 2006
Abstract
We call �independent from the CEO�a top executive who joined the �rm before the current
CEO was appointed. In a very robust way, �rms with a smaller fraction of independent executives
exhibit (1) a lower level of pro�tability and (2) lower shareholder returns following large acqui-
sitions. These results are una¤ected when we control for traditional governance measures such
as board independence or other well-studied shareholder friendly provisions. One interpretation
is that �independently minded� top ranking executives act as a counter-power imposing strong
discipline on their CEO, even though they are formally under his authority.
1 Introduction
Academics and practitioners have known for long that in the absence of tight monitoring, CEOs of
large publicly held �rms may take actions that are detrimental to their shareholders: They commit
the �rm�s resources to value destroying �pet�projects, build unpro�table empires, prevent valuable
takeovers from happening, or even, in some rare yet highly publicized instances, engage in fraudulent
window dressing or asset tunneling. To set up counter-powers to the CEO, the consensus among
practitioners and regulators has been to rely on a strong board of directors, independent from the
management. In many countries, informal codes of corporate governance have been recommending
�For their helpful comments, we thank Yakov Amihud, Ulf Axelsson, Vincente Cunat, Denis Gromb, Steve Kaplan,Alexander Ljungqvist, Vinay Nair, Thomas Philippon, Per Stromberg, Eric Van Den Steen, as well as various seminarparticipants.
yNYU, Stern School of Business, [email protected] and GREMAQ, [email protected] and CEPR, [email protected]
1

the appointment of independent directors for more than a decade.1 In the US, the recent wave of
corporate scandals has triggered a stronger regulatory response, making the hiring of independent
directors mandatory for �rms listed on the major stock exchanges.2
Indeed, academic research has found boards to be e¢ cient tools of corporate governance. Inde-
pendent boards of directors seem to pay more attention to corporate performance when it comes
to CEO turnover or compensation (Weisbach (1988), Dahya, Mc Connel and Travlos (2002)). The
stock market hails the appointment of independent directors with abnormal returns (Rosenstein and
Wyatt (1990)). There is no evidence, however, that independent boards improve pro�tability or even
the value of corporate assets.3 One possibility, at least for large listed �rms, is that independent
boards, while still extremely valuable in times of crises, are too far away from day to day operations
to add much value to a �rm.
As a result, corporate governance scholars have recently shifted their attention away from or-
ganizational variables such as board composition towards other dimensions of corporate governance
apparent in corporate charters, bylaws or in state takeover laws. The main �nding of this recent
literature is that investor-friendly corporate governance provisions boost the price of �rms�assets by
making them more vulnerable to takeovers (Gompers, Ishii and Metrick (2003), Cremers, Nair and
John (2005),Bebchuk and Cohen (2004)).
This paper studies a new measure of the quality of corporate governance based on �organizational�
information. Our intuition is that there is some information to get on the functioning of a company
by focusing attention on the composition of the executive suite. After all, CEOs have to face their
subordinates on a daily basis, whereas boards of directors only meet a few times every year.
More precisely, we develop a measure of �internal governance� that captures the degree of �in-
1As a matter of fact, many large �rms have been eager to comply with their guidelines. For instance, the CadburyReport issued in the UK in 1992 recommends that �the majority of non-executives on a board should be independentof the company� . The 1998 �Viénot II� Report in France proposes that �independent directors should account forat least one-third of the Board of Directors�. Compliance with these guidelines was not mandatory, but widespread.For instance, by 1996, more than 50% of the UK �rms surveyed by Dahya, Mc Connel and Travlos (2002) claimed tocomply with the Cadbury Report recommendations.
2The NYSE and the NASDAQ require since 2003 a majority of independent directors on the board of companieslisted on their exchanges.
3 In fact, the correlation might even be negative. A likely reason for this is that poorly performing �rms tendto appoint more outside directors (Kaplan and Minton (1994)). Filtering out this endogeneity leads to no apparentcorrelation between pro�tability and board independence (Baghat and Black (2003), Hermalin and Weisbach (2003)).
2

dependence� of top executives from the CEO. On a panel of US listed corporations, we compute
the fraction of top ranking executives who joined the �rm before the current CEO was appointed.
We think of these executives as �independent�. As CEOs are typically involved in the recruting of
their subordinates, executives hired during their tenure are more likely to share the same preferences
and/or have an incentive to �return the favor�. Alternatively, executives who experienced previous
leadership are less likely to take orders as legitimate simply because they come from a superior.
We �rst provide evidence on corporate performance: We �nd that high internal governance (in-
dependent executives) predicts high future performance, using various pro�tability measures. Con-
versely, poor performance does not lead to a decrease in internal governance, suggesting a causal
e¤ect of internal governance on performance. Our �ndings are not a¤ected when we control for
traditional, �external�corporate governance measures. We also show that our results are not driven
by the departure of executives "leaving a sinking boat", i.e. quitting due to the anticipation of the
�rm�s future decline.
Our second piece of evidence is on the long-run value impact of large acquisitions. We show
that a lower fraction of independent executives is associated with signi�cantly lower returns for
the acquiror�s shareholders. Importantly, however, regular indices of external governance are not
correlated with the long-term shareholders�losses made after an acquisition. The board of director,
takeover pressure or the design of corporate charter seem less e¢ cient at preventing bad/expansive
acquisitions from happening.
We believe an important contribution of our paper is to exhibit an organizational �rm-level
variable with strong systematic predictive power on future performance. Our internal governance
variable might simply be a measure of the extent of CEO power over the �rm: "powerful CEOs" might
be both prone to do ine¢ cient acquisitions and to replace executives with their own friends with no
link between the two. However, we �nd that internal governance is only very weakly correlated with
traditional measures of "CEO power" such as whether the CEO is chairman of the board. Another
intepretation of our results is that independent executives may act as a �bottom-up governance�
mechanism, making it costly to the CEO to take bad decisions.
Such a mechanism is modelled in Landier, Sraer, and Thesmar (2005). In their theory, when
3

a CEO takes a poor decision, �independent� executives may be more prone to disagree and as a
result may become less willing to put energy into implementing decisions that they consider to be
ine¢ cient.4 Such a need to elicit his top executives�support is taken into account by the CEO. This
�implementation constraint�forces the CEO to take better decisions on average.5
Our study may have two normative implications for practioneers of corporate governance. First,
we learn from our statistical analysis that the intensity of such internal governance can be at least
partly observed and could be included in the various indexes of the quality of a �rm�s corporate
governance. This implication does not depend on our interpretation of our results: be it the sign
of executives �leaving the sinking boat�, of an autocratic CEOs, or of the healthy discipline of
having to convince one�s subordinates, the share of independent executives as we measure it predicts
performance. A second implication hinges on our �bottom-up governance�interpretation: in addition
to management monitoring and advising, a key role of the board should also consist in designing the
optimal balance of power within the �rm. Put otherwise, the human resource role of the board is
not limited to the usually emphasized CEO succession problem.
The paper has �ve more sections. Section 2 describes the datasets we use and how we construct
our index of internal governance. Section 3 looks at the relationship between internal governance
and corporate performance. Section 4 looks at the costs of acquisitions. Section 5 discusses the
relation between our internal governance index and usual corporate governance measures. Section 6
concludes on theoretical questions raised by our �ndings.
4Such internal governance mechanism need not arise through an open con�ict between the CEO and his subordinates,or through public denouncement of corporate malpractices (�whistleblowing�). On the contrary, because an executive�sjob is di¢ cult, complex and hard to monitor, it is always easy for unconvinced subordinates to shirk, slightly modifyorientations or even lie about the feasibility of the CEO�s strategy.
5Obviously, a possible cost of diversity of opinion among executive is the potential paralysis of the chain of command;as executives are in general skeptical towards the CEO�s orientations, they are less enthusiastic. Such organisation makesprobably less mistakes, but is also less likely to engage with full strength into a particular direction.Which e¤ect dominates is an empirical question; particular features of the industry may tilt the tradeo¤ in one
direction or another. In the context of corporate governance, the evidence presented in this paper points toward netbene�ts of internal governance.
4

2 Data and Measurement Issues
We �rst describe the datasets we use to complete our study. We then discuss the construction of our
index of �internal governance�and outline its strengths and weaknesses.
2.1 Datasets
We use �ve datasets. EXECUCOMP provides us with the �rm level organizational variables with
which we proxy for internal governance. COMPUSTAT provides us with �rm level accounting infor-
mation. IRRC�s corporate governance and director dataset allows us to obtain standard measures of
external corporate governance. Acquisitions are drawn from SDC Platinium, and stock returns from
CRSP.
2.1.1 Internal Governance
The �rst dataset is the EXECUCOMP panel of (at least) the �ve best paid executives of the largest
American corporations. We use this data source to measure the extent of �internal governance� in
the �rm. We do this by computing the fraction of executives hired after the CEO took o¢ ce (i.e.
the fraction of non-independent executives). Thus, internal governance is said to be poor when this
fraction is high.
Initially, each observation is an executive (or the CEO) in a given �rm in a given year. We focus
on years from 1992 to 2002; we start by removing observations for which the executive identifying
number is missing. We also exclude duplicate observations. In this (nearly) raw dataset, there are
120,762 observations, which correspond to some 1,840 �rms per year (20,230 �rm-years) with an
average of six executives each (including the CEO). As it turns out, 3,499 �rm-year observations
have no CEO (using the CEOANN dummy variable indicating which executive is the CEO). In some
cases, it is possible to infer the CEO�s identity because, for one of the executives, the BECAMECE
variable (date at which the executive became CEO) is non missing, even though the CEOANN
dummy is missing (misleadingly indicating that the executive is not the CEO). By �lling in these
gaps, we obtain 2,472 �rm year observations, and end up with 19,203 �rm-years for which we know
the identity of the CEO (a total of 115,933 observations in the executive-�rm-year dataset).
5

To compute the fraction of non independent executives, we will need to compare the CEO�s
tenure to the executives�seniorities within the company. A �rst approach - which corresponds to
the results listed in the paper - is to rely on the seniority (within the �rm) and tenure (within the
position) variables reported in EXECUCOMP. The BECAMECE variable gives us, for the current
CEO, the precise date at which he(she) was appointed as CEO whether he(she) was hired from inside
or outside the �rm. Other executives�seniorities can be recovered using the JOINED_C variable,
which reports the date at which the executive actually joined the �rm. Unfortunately, these variables
are often missing: we lose 2,291 �rm-years (12,262 executives-�rm-years) by focusing on �rms where
the CEO�s date of appointment is non missing. We then lose a further 6,760 �rm years (39,695
executives-�rm-years) by restricting ourselves to �rms where we have non missing seniority for at
least one executive. We end up with 11,179 �rm-years, from 1992 to 2002, for which we can now
compute the fraction of executives hired after the current CEO. We call this measure of executive
dependence FRAC1.
Overall, we lose 19,203-11,179=8,024 �rm-year observations in the process of constructing our
measure of internal governance, mostly because many executives do not report their seniority within
the �rm. In 4,307 of our remaining 11,179 �rm-years, internal governance is measured by comparing
the CEO�s tenure with the seniority of only one executive.
This means that FRAC1 will be a very noisy measure of executive dependence; while this does
not create an obviously spurious correlation with corporate performance or returns to acquisitions,
it is going to bias our estimates of the e¤ect of internal governance downwards, as measurement
error often does. A second approach would be to dispense wih the seniority and tenure variables
altogether and make direct use of the fact that we can follow individuals in the EXECUCOMP panel.
To remove left censorship (the panel starts in 1992), we need to restrict ourselves to �rms where
we observe at least one episode of CEO turnover. Once the new CEO has been appointed, we can
compute the fraction of executives that were not listed in the dataset before the new CEO started
(we name this alternative variable FRAC2). The main advantage of this approach is that we can
dispense of both BECAMECE and JOINED_C variables, which are often missing. The cost is that
the need to observe CEO turnover restricts the number of �rm-years to 6,617. This is less that the
6

11,179 observations available to compute FRAC1. Also, focusing on �rms with at least one CEO
turnover over the course of ten years may mechanically overweight �rms facing governance problems.
Finally, executives enter the panel when they either (1) are hired by the �rm, (2) make it into the �ve
best paid people list, or (3) the �rm decides to report their pay in its annual report/proxy. Hence,
entry in the panel is a very noisy measure of hiring.
In spite of its shortcomings, the second - panel based - variable FRAC2 has a correlation coe¢ cient
of 0.41 with the �rst - seniority based - variable FRAC1. Both approaches led to results very similar
in terms of size and signi�cance, so we chose to focus here on the �rst measurement approach. Of
course, estimates based on FRAC2 are available from the authors upon request.
2.1.2 Corporate Accounts
Our tests will correlate internal governance with corporate performance. Thus, for each �rm-year
observation from our EXECUCOMP sample, we retrieve �rm level accounting information from
COMPUSTAT (we lose only 161 observations, for which we cannot �nd the book value of assets,
in the merging process). We match by GVKEY identi�er. We compute pro�tability as return on
assets (ROA).6 We construct Market to Book as the ratio of the �rm�s assets market value to their
book value, as in Gompers, Ishii and Metrick (2003).7 We proxy �rm size by log(total assets). We
proxy �rm age by taking the di¤erence between the current year and the �rst year of presence in
the COMPUSTAT panel. We construct the 48 Fama-French industry dummies using the �rm�s 4
digit SIC industry code. Variable constructions are presented in detail in appendix B. Finally, we
winsorize some variables (ROA, Market to Book) at the 1% and 99% levels.
2.1.3 External Governance
We will also look at how our measure of internal governance correlates with traditionnal corporate
governance measures. Thus, for each �rm year observation, we gather information on corporate
6Return on Assets is Operating Income Before Depreciation (item 13) minus Depreciation and Amortization (item14) over Total Assets (item 6).
7Market to Book is the ratio of market to book value of assets (item 6). The market value is computed as TotalAssets (item 6) plus the number of common shares outstanding (item 25) times share price at the end of the �scal year(item 199) minus Common Equity (item 60) minus Deferred Taxes (item 74).
7

governance from IRRC�s corporate governance and directors dataset. This dataset provides us with
commonly used proxies for corporate governance, namely, the fraction of independent directors, the
number of directors sitting on the board and the fraction of former employees sitting on the board.
These variables are available for the 1996-2001 period only, and mostly for large �rms. Out of
11,179 �rm-year observations where we can measure internal governance, only 4,531 observations
have information from IRRC.
We will also look at the increasingly popular Gompers, Ishii, and Metrick�s (hereafter GIM)
index of corporate governance, which compiles various corporate governance provisions included in
the CEO�s compensation package, in the corporate charter and the board structure. The GIM index
is available for 1990, 1993, 1995, 1998 and 2001. In other years, we assume that it takes the value
that it had in the most recent year when it was non missing. Again, just over a half (5,872 over
11,179) of our observations have a de�ned GIM index.
2.1.4 Acquisitions
To see if top ranking executives are able to constrain major CEO decisions, we focus on the e¤ect of
internal governance on the acquisition performance. We obtain the list of �rms who made signi�cant
acquisitions from SDC Platinium (deals of value larger than $ 300 million). SDC provides us with
the bidder�s CUSIP and the transaction value of the deal. We focus on completed deals where the
bidder bought at least 50% of the target�s shares.
For each �rm-year observation in our EXECUCOMP sample, we compute the number of targets
acquired during that year and the overall amount spent on the deal(s). In our base sample of 11,179
�rm-years where the internal governance measure FRAC1 is available, 22% of the observations cor-
respond to �rms making at least one acquisition; 1998 and 1999 are the peak years, with more than
26% of �rms making at least one acquisition. Most acquirers make only one deal per year, but there
are a few serial acquirers (three percent of the observations correspond to at least �ve deals carried
out during the year).
8
2.1.5 Stock Returns
We are also interested in computing the net bene�t of acquisitions. To do this, we compute long run
abnormal stock returns following the acquisition, for each acquirer.
We merge the above SDC extract with our base sample from EXECUCOMP. We end up with a
list of 818 deals for which we know the acquirer, the date of the acquisition, and FRAC1 (the share
of executives appointed after the CEO took o¢ ce). Serial acquirers are overrepresented. Out of 818
deals, 188 involve one time buyers, while 368 involve �rms carrying out at least four large deals.
Overall, our sample features 359 di¤erent acquirers.
We then match this deal dataset with the acquirer�s stock returns as provided by CRSP. More
precisely, we retrieve monthly acquirer stock returns from a period extending 48 months prior to
each acquisition to 48 months after the deal. We remove deals with less that 48 months of acquirer
returns history before the acquisition. This reduces our sample size to 669 deals. We then estimate
a three factor Fama-French model for each acquirer using the 48 pre-acquisition months available.
We use the returns of the MKTRF, SMB, and HML portfolios from Kenneth French�s web site. We
then use this model to compute abnormal returns both before and after the deal.
2.2 Constructing an Internal Governance Index
The assumption underlying the internal governance measure is that the CEO is directly or indirectly
involved in the recruitment process of top executives. Hence, executives appointed during his tenure
are more likely to be loyal to him and/or share his preferences than executives who were picked by
a predecessor.
However, one needs to be careful with the mechanical drivers of FRAC1. As a CEO�s seniority
increases, a larger fraction of executives have (mechanically) been appointed during his tenure.
Conversely, executives who have been with the �rm longer are on average more likely to have been
hired before the current CEO. This suggests that FRAC1 is positively correlated with CEO tenure,
and negatively with executive seniority. Also, externally appointed CEOs often have the mandate to
arrange an �executive shake-up.�When recruited from the outside, CEOs have enough bargaining
power vis à vis the board of directors to bring in their own teams. Hence, FRAC1 should be
9
mechanically larger in the presence of outsider CEOs. Finally, a new CEO�s appointment is sometimes
followed by immediate waves of executive departures and arrivals that might be unrelated to internal
governance (for example, top executives hoping for the top job leave the �rm and need to be replaced).
It might be tempting to see these mechanical sources of variation in the proportion of aligned
executives as exogenous shocks to internal governance, but they might be related to �rm performance
for reasons orthogonal to internal governance. Ignoring these sources of variation would thus lead to
biased estimates of the e¤ect of internal governance on performance. For example, CEO tenure may
directly a¤ect corporate performance simply because experience on the job matters. Also, if the �rm
is in really bad shape, a new CEO will have to inject more �fresh blood� into the corporate suite
(Hayes, Oyer, and Schaefer, 2005), which mechanically increases executive turnover. We therefore
choose be to as conservative as possible and �lter out these mechanical e¤ects when we seek to
measure �internal governance.�Also, we will include them as controls in all performance regressions.8
More precisely, our internal governance (henceforth IG) index is de�ned as the residual of the
fraction of �dependent�executives regressed on its expected mechanical correlates:
FRAC1it = a+ b:CEOTENit + c:EXECSENit + d:OUTSIDEit
+e:KNOWNit + f:FRAC1_1Yit + �t + "it (1)
where, for �rm i in year t, CEOTENit stands for CEO�s tenure (in years), EXECSENit for average
executive seniority within the �rm, OUTSIDEit is a dummy indicating whether the CEO comes from
outside the �rm, KNOWNit is the fraction of executives for which seniority is reported in the data,
and FRAC1_1Yit the fraction of executives that arrived within a year of the CEO�s nomination.
We also include year dummies �t. We de�ne our Internal Governance (hereafter IG) index as the
residual "it. It is larger when more executives than expected were hired after the current CEO was
appointed. Hence, high values of the IG index mean poor internal governance (consistently with the
Gompers-Ishi-Metrick external governance index).
8By virtue of the Frisch Waugh theorem, the two approaches are equivalent. However, our residual approach willbe helpful when we look at stock returns following acquisitions, since we will simply compare �rms with negative andpositive residuals.
10

The regression results are reported in Table 1, which has four columns. Column 1 includes the
seniority variables (EXECSEN for executives and CEOTEN for the CEO). Column 2 adds the
fraction of executives for which seniority is actually reported in EXECUCOMP (KNOWN , which
we include to control for potential selection biases), and the fact that the CEO has been appointed
from the outside (OUTSIDE). Column 3 adds the fraction of executives appointed within a year
of the CEO�s nomination, to control for management "shake-ups." Column 4 includes �rm size, age
and industry as additionnal regressors. As it turns out, all these mechanical correlates of FRAC1
work as we expected them to. FRAC1 is positively and strongly correlated with CEO tenure and
negatively correlated with executive tenure (Columns 1 to 4). These two variables alone explain 25%
of the variance of FRAC1 (column 1). FRAC1 is positively correlated with the fraction of executives
whose seniority is reported: Hence, more "transparent" �rms tend to have executives appointed after
the CEO. FRAC1 is also strongly associated with the presence of outside CEOs. There are at least
two possible interpretations for this. First, outside CEOs are often given a mandate to reshu e
the top management, and as a result the fraction of executives who joined the company with them
is large. As it turns out, the coe¢ cient on OUTSIDE is somewhat reduced when we also include
FRAC1_1Y in column 3. But it remains positive and signi�cant, which leaves room for additional
explanations: the appointment of outside CEOs triggers the departure of talented executives who
were hoping to get the top job. Another possibility could simply be that management shake-ups
tend to happen when the �rm is doing badly, which may also generate departures. In any case, the
need to replace the lost executives mechanically increases our index. Finally, �rm level variables
(industry, age, or even size) are not strongly correlated with FRAC1, and accordingly explain little
of its variance. Thus, in the following analysis, we use estimates from column (3), i.e., compute IG
using CEO and executives�characteristics (which account for 71% of the variance of FRAC1), but
not the �rm level variables (which account for a mere 2%).
Last, one possible concern could be that our internal governance index may be correlated with
intense merger activity in the past. After many mergers, top executives from the targets join the
executive suite, mechanically increasing our index. If the �rm still has trouble �digesting� its past
acquisitions, it is likely to underperform on both accounting and stock price measures. To address
11

this concern, we correlated our residual IG index with the number of past acquisitions for a cross
section of �rms in 2000. We found no evidence that high IG index �rms had bought a particularly
large number of �rms in the 1990s. This is robust to various controls and to the year chosen. Our
index is thus not a proxy for M&A �indigestion.�
3 Internal Governance and Corporate Performance
We start by investigating the correlation between internal governance and corporate performance.
Figure 1 provides a �rst look at the relationship between our IG index and corporate performance.
In this �gure, we split the sample distribution of our IG index into �ve quantiles. Then, for each
quantile, we compute the mean industry9 adjusted performance, as well as the 95% con�dence band
assuming normality. Performance is measured through ROA (left panel) and market to book value
of assets (right panel). Figure 1 shows a positive and statistically signi�cant association between
good internal governance (low values of our IG index) and corporate performance.
3.1 Basic Results
As discussed above, some mechanical correlates of internal governance may be correlated with cor-
porate performance. For example, junior CEOs or executives may be on average worse performers
simply because they lack experience. We thus move to a multivariate analysis that allows us to
capture these "human capital" e¤ects. We run the following regression:
Yit = �+ �IGit�1 + (IG controls)it + (Firm controls)it + "it (2)
where Yit measures corporate performance (ROA, market to book value of assets). IGit�1 is our
measure of internal governance, lagged one period.10 We include two sets of controls. First, the
mechanical correlates of our index are included since it may be argued that they directly a¤ect
corporate performance (CEO tenure, mean executive seniority, share of executive hired right after
9We used the Fama-French 48 industries (Fama and French (1997)).10We seek to partially avoid obvious simultaneity biases, such as the ones we discuss below. As it turns out, our
results are insensitive to the time-lag used.
12

the CEO, a dummy indicating if the CEO is an insider or not). However, we must bear in mind that,
because of the Frisch Waugh theorem, their inclusion does not a¤ect our estimate of � (the IG index
is by de�nition orthogonal to these variables, so they do not create any �omitted variable bias�).
Secondly, we add �rm level controls that are traditionnally strong correlates of performance: log(�rm
age+1), log(assets), year dummies, and 48 Fama-French industry dummies. Since we have several
observations per �rm (corresponding to di¤erent years), and because IGit is strongly persistent, it
is likely that the "it are not independent from di¤erent observations of the same �rm i. Hence, we
correct for this form of heteroskedasticity by looking at Hubert-White-Sandwich estimates.
The sample correlation between performance and the IG index is strong and stable across years
(results available from the authors). Multivariate regression results are reported in Table 2. Columns
1 to 3 use ROA as dependent variable in equation (2); columns 4 to 6 use market to book value of
assets.11 Columns 1 and 4 report regression results only with �rm level controls, and columns 2 and
5 include the mechanical correlates of the index. As expected, the di¤erence is negligible, and stems
from the fact that the sample on which the index is estimated (Table 1, column 3) is slightly di¤erent
from the sample used for the performance regressions (2). Columns 3 and 6 further control for initial
performance, as a limited attempt to control for �xed e¤ects.12 Each time, our index of governance
is signi�cantly and robustly correlated with performance: a one standard deviation increase in IG
results in a decrease of about 1.5 ROA percentage point and about 10% of market value of assets. The
explanatory power of this e¤ect is not very large (some 10% of standard deviation of the explained
variable), but, as we will see, it is consistently signi�cant and easily surpasses the usual �external�
corporate governance measures. Also, the small size of our coe¢ cients should not surprise us given
the noise of our internal governance measure FRAC1 (see section 2.1).
3.2 Robustness Checks and Causality
Table 3 checks whether the performance-IG correlation reported in Table 2 is driven by any particular
subperiod. In this table, we report, for both measures of corporate performance, the point estimate
11Similar results are obtained with Return on Equity, but we did not report them because of space limitation.12We have also run, but not reported, regressions of corporate performance on FRAC1, the fraction of executives hired
after the CEO took o¢ ce, as well as various controls. FRAC1 turned out to be highly signi�cant in all speci�cationswe tested. This is not surprising by virtue of Frisch Waugh theorem.
13

of � in (2) where internal governance is measured by IG, including both �rm level and mechanical
controls as in columns 2 and 5 of table 2, except that one regression is run for each year. As it turns
out, the point estimate is fairly stable across periods and signi�cant in most years. As a consistency
check, we veri�ed that we get similar magnitudes and signi�cance levels by regressing directly on
FRAC1, our un�ltered measure of internal governance, rather than on our internal governance index.
There are many stories consistent with the relation between IG and performance found in Tables
2 and 3. Our favored interpretation is that strong internal governance is a way for shareholders to
�hold the CEO on a tight leash�and prevent the CEO from undertaking �crazy�projects or building
an empire. One could argue, however, that the causality runs in the opposite direction: declining
performance may actually trigger an increase in IG (a drop in our measure of internal governance).
One plausible story could be based on management turnover. In most �rms, poor performance
triggers a change in the management team. In this scenario, internal governance worsens because
performance declines, not the contrary.
While we have no �smoking gun�to assess the causal relation between internal governance and
corporate performance, we can at least take two preliminary steps to reduce the likelihood of reverse
causation.
First, we look at the joint dynamics of internal governance and corporate performance. Do
changes in corporate performance happen before or after changes in internal governance? To test
these two hypotheses, we run the following two regressions:
Yit = �+ �IGit�L + Yit�L + controlsit + "it (3)
IGit = a+ bIGit�L + cYit�L + controlsit + "it (4)
where we use one and two year lags (L = 1; 2) and Yit is the �rm�s corporate performance at date
t. If changes in corporate performance tend to lead changes in IG, we should not be able to reject
that c > 0 and = 0. Such a test can be thought of as the panel data version of causality tests à la
Granger in time series analysis.
Estimates of equations (3)-(4) are reported in Table 4. All regressions include �rm level controls
14

(age, size, year and industry dummies). Column (1) reports the estimates of � and of equation (3),
while column (2) reports the estimates of b and c from (4). The top panel reports the regression results
assuming L = 1. The bottom panel assumes L = 2. The results suggest that, in general, changes
in internal governance happen before changes in corporate performance as estimates of c are never
signi�cantly di¤erent from zero, while estimates of � are. This �nding is consistent with Hadlock
and Fee (2004) who establish that once controlling for CEO dismissals (as we do in the construction
of the IG index), aggregate �rm performance has only low explanatory power on non-CEO executive
turnover.
Another endogeneity concern, which is not ruled out by our time-series evidence is the follow-
ing: executives might tend to leave companies when they anticipate poor performance (for example
because they want to avoid the danger of getting �red). If executives have private information on fu-
ture performance, IG would rise before performance declines, but without being the cause of decline.
One justi�cation for such anticipation e¤ects is that executives can observe the CEO�s ability, or the
evolution of the �rm�s markets, before they materialize in corporate accounts.
As a consequence, our IG index might be simply proxying for executive turnover, which would
itself be a predictor of performance decline. We thus add to equation 2 the fraction of executives that
left the �rm in the previous year as a control. This turnover control is constructed as the fraction of
the �rm�s year t�1 executives who are no longer reported as working for the company at year t in the
EXECUCOMP data. To be fair, they can drop out of our sample either because they are no longer
employees of the company, or because they do not belong any more to the most paid employees of
the company. But this is as far as EXECUCOMP allows us to go to measure executive departure.
Controlling for such measure of executive turnover means that we compell the identi�cation of the
coe¢ cient on our IG index to rely exclusively on the comparison between the year the CEO started
his/her tenure, and the year top execs started to work for the �rm.
We present the new estimation results in 5, using the same �rm level controls as in 2. As it turns
out, executive turnover indeed has a signi�cant negative impact on �rm performance, con�rming the
idea that unexepectedly high executive turnover is an early sign of bad performance. Nevertheless,
adding this control does not a¤ect the magnitude and signi�cance of the impact of our internal
15

governance measure on performance, either measured as ROA or Market to Book. Overall, Table 4
and Table 5 point toward a causal link going on from high Internal Governance to bad performance.
4 Internal Governance and Acquisitions
To test whether internal governance increases the quality of the �rm�s strategy by constraining the
CEO in his choices, a natural place to look is at the �rm�s acquisition policy. There is substantial
debate among �nancial economists as to whether long-run acquisition returns are positive or negative
for the acquiring �rm. Loughran and Vijh (1997) �nd that the returns to long-run investors in
acquiring �rms are on average negative, in particular when the deal is �nanced with stock issues.
Mitchell and Sta¤ord (1999), among others, criticize their estimates, partly because post acquisition
returns tend not to be independent events, as acquisitions generally cluster around stock market
booms. The main problem with this literature is that there is considerable heterogeneity among
types of acquisitions and their performance. Thus, �nancial economists lose substantial information
on their entire distribution by focusing on average returns and average pro�tability. In attempt to
reduce this heterogeneity, some recent papers have outlined the size of acquisitions as a key factor
for success or failure (Moeller, Schlingemann, and Stulz (2005), Bradley and Sundaram (2004)).
The evidence they present is consistent with �small�acquisitions as value-creating, and large ones
as value-destroying. Following up on these papers, we look at the e¤ect of internal governance on
shareholder losses (gains) in large acquisitions.
But before looking at gains, we �rst focus on the relation between internal governance and
acquisition policy. We �nd that �rms with good internal governance do not make fewer acquisitions
and that their acquisitions do not correspond to smaller purchases. We follow Gompers, Ishii and
Metrick (2003), and use SDC to compute, for each �rm-year of our EXECUCOMP extract: (1)
the number of deals of more than $10 million in value and (2) the overall amount of all deals
struck within the year (the sum of all transaction values if there are several deals), normalized by
the acquirer�s market capitalisation. None of these measures of acquisition intensity proved to be
correlated with our IG-index. Moreover, we �nd that the IG index is not correlated with the number
of past acquisitions, which means that selecting �rms with poor internal governance does not select
16

"serial acquirers."
We then turned to the impact of internal governance on acquisition quality. As argued above,
we focus on large acquisitions (whose value exceeds $300 million $). To measure the performance
of acquisitions, we �rst follow Loughran and Vijh (1997) and focus here on the acquirer�s long term
abnormal stock returns, which we compute using a four factor pricing model (the Fama-French (1996)
three factors plus Carhart�s (1997) momentum factor) estimated at the �rm level in the 48 months
preceeding the acquisition. We restrict ourselves to the 1993-2002 period, in order to be able to use
EXECUCOMP information.
We split the sample of transactions into two parts (each comprising some 400 deals): deals where
the acquirer has above-median IG index (poor internal governance), and deals where the acquirer has
below-median IG index (good internal governance) in the year preceding the acquisition. Columns
1 and 2 of Table 6 report, separately for good and poor internal governance acquirers, the average
cumulative abnormal returns, starting 12 months before the deal up to 48 months after the deal.
Column 3 reports the di¤erence in cumulative returns, and tests for the equality of average returns
using a standard t-test, without assuming equality of variances. Figure 2 plots cumulative abnormal
returns for each month, separately for poor (left panel) and good (right panel) internal governance
acquirers.
We �nd that �rms with poor internal governance make largely underperforming acquisitions.
Four years after the acquisition, �rms with good internal governance have on average lost some 15%
of shareholder value, which is signi�cantly di¤erent from zero. However, �rms with poor internal
governance have lost almost 30%, which is both signi�cantly di¤erent from zero and from the wealth
lost by long term shareholders of well governed �rms. This di¤erence is robust to (1) the way we
split the sample, on condition that each contains enough observations in each category (good/poor
governance) and (2) to the pricing model (results are almost similar when we omit the momentum
factor; they are somewhat noisier, but still point in the right direction if we use the CAPM or if we
merely substract the market return from stock returns).
As a robustness check, we then look at the signi�cance of our results using a calendar time
portfolio method as recommended e.g., by Mitchell and Sta¤ord (1997). This method addresses the
17

critique that, due to their time overlap, post-event returns are not independent. Another problem is
that measurement errors inherent in the computation of individual abnormal returns are compounded
by calculating cumulative returns.
For our sample of acquisitions, we therefore construct two equally weighted portfolios of �rms that
completed at least one acquisition within the last n months. The �rst portfolio is long in acquirers
whose internal governance index one year prior to the acquisition is below-median (the �good internal
governance�portfolio). The second portfolio is long in acquiring �rms with above median IG index
(the �poor internal governance�portfolio). Both portfolios are therefore rebalanced each month as
acquirers whose deal occurred more than n months ago leave and new acquirers enter. Let RPn;t
(resp. RGn;t) be the monthly return of the poor (resp. good) internal governance portfolios.
We then estimate the abnormal returns of the two portfolios with a four-factor asset pricing
model (the three Fama French factors plus the momentum factor, all available from the Kenneth
French website). We also estimate the abnormal returns of a portfolio that is long in good internal
governance, and short in poor internal governance acquirers, as in equation (7):
E�RGn;t �Rfn;t
�= �Gn + �
Gn (Rmt �Rft) + sGn : SMBt (5)
+hGn : HMLt + uGn .UMDt
E�RPn;t �Rfn;t
�= �Pn + �
Pn (Rmt �Rft) + sPn : SMBt (6)
+hPn : HMLt + uPn .UMDt
E�RGn;t �RPn;t
�= �G�Pn + �G�Pn (Rmt �Rft) + sG�Pn : SMBt (7)
+hG�Pn : HMLt + uGn .UMDt
The intercepts of these regressions �Gn , �Pn , and �
G�Pn represent the average monthly abnormal
returns, given the model. These "alphas" are reported in Table 7, for n = 12, 24, 36 and 48 months.
First, notice that the long-run abnormal returns of all acquisitions (which we report as a benchmark
in the �rst line of Table 7) are slightly positive and marginally signi�cant, in contrast with the results
of long run stock returns, which are negative and signi�cant. This discrepancy is at the heart of the
18

methodological controversy on long-run stock return studies.13
When we sort by internal governance value, results con�rm our cumulative abnormal returns
analysis: Abnormal returns to good internal governance �rms after major acquisitions are positive
and signi�cant (some 0.5% per month) within 1, 2, 3 or 4 years following the deal announcement.
They are small and insigni�cant for poor internal governance �rms. Our long-short portfolio�s alphas
are positive and signi�cant when the selection window is su¢ ciently large (last 24, 36 or 48 months),
and less so in the short run (last 12 months). This is to some extent consistent with evidence from
Table 6, where the di¤erence in value destroyed widens over time.
5 External Versus Internal Governance
We have shown that our measure of �internal governance�correlates well with (1) overall corporate
performance and (2) the e¢ ciency of some crucial strategy choices (acquisitions). However, one
possible story consistent with such evidence is that we are proxying for corporate governance in the
�traditional�sense: �rms with weak shareholders, weak boards and imperial CEOs could also be the
ones where the CEO has all the power to appoint faithful executives. Hence, a well-entrenched CEO
is more likely to replace executives who do not show su¢ cient loyalty, which makes our IG index
rise. At the same time, weak boards do not have the means to oppose large, wasteful acquisitions.
This alternative story puts external governance back to the fore: when �external� governance
is poor, the �rm performs less well, and most executives have had less time on the job than the
CEO. If this were true, however, the existing literature on �external� governance would have had
no trouble in �nding a positive statistical relation between corporate performance and measures
of governance quality. Existing contributions have repeatedly failed to �nd a positive correlation
between the share of outsiders in the board and pro�tability (see Baghat and Black (2003), and also
Hermalin and Weisbach (2003) for a survey). Using corporate charter-based governance measures,
Gompers, Ishii, and Metrick (2003) do not �nd a consistent correlation between investor-friendly
13When looking at three year returns on acquiring �rms, Mitchell and Sta¤ord (2000) �nd an equal weighted monthlyalpha of -0.2%, which is statistically signi�cant. The di¤erence between our result and theirs may stem from the timeperiod chosen (we look at 1993-2002, while their time frame is 1961-1993). Another possibility is that �rms are selectedon the basis of their belonging to EXECUCOMP (we will return to this issue below). This, however, should not a¤ectthe comparison between poor and good governance �rms.
19
�rm-level institutions and operating performance. Thus, the available evidence casts doubts on
internal governance as a proxy of external governance in our regressions.
We look directly at the correlations between our measure of internal governance and some mea-
sures of �external� governance that are used in the literature. To do this, we regress our internal
governance index on (1) the Gompers-Ishii-Metrick index of governance, which takes large values
for management-friendly corporate charters, (2) the fact that the CEO is also the chairman of the
board, which measures the CEO�s degree of power on the board (see, for example, Adams, Almeida
and Ferreira (2004)), (3) the size of the board (Yermack (1996) shows that �rms with large boards
are less e¢ cient), (4) the share of current employees, and (5) of past employees as corporate direc-
tors. The �rst measure is available for a subset of our main sample - the largest �rms. The second
measure is available for our whole sample as it is extracted from EXECUCOMP. The third, fourth,
and �fth measures are extracted from IRRC�s boards and directors database and so available only
for a subsample of our main dataset.
Overall, the evidence is not consistent with internal governance being a proxy of external gov-
ernance. Regression results, controlling for both �rm level variables and mechanical correlates of
IG, are reported in Table 8. Columns 1-3 include the external governance indexes separately, while
column 4 combines all of them. Some results point slightly toward a correlation between the two
governance measures. Our index is correlated with the charter based GIM index (the coe¢ cient is
small and signi�cant at 5%). Also, internal governance is worse when the CEO is chairman, suggest-
ing that CEOs who are powerful inside the �rm are also powerful in the boardroom. The only other
signi�cant relation is more surprising: internal governance turns out to be better when there are
more employees sitting on the board of directors. The literature on independent directors reports
this correlation: it is usually interpreted as evidence that bad performing �rms tend to appoint
outsiders on the board (Hermalin and Weisbach (2003), Kaplan and Minton (1994)). One other,
more daring, interpretation of this negative correlation between internal and external governance is
the following. The particularity of these board members (employees) is their intimate knowledge of
human capital and the power struggles within the �rm. Insiders sitting on the board therefore have
enough information about the competence of executives to e¢ ciently interfere with the CEO in the
20

nominating process. By preventing the CEO from appointing new subordinates, they enforce a good
level of internal governance. This interpretation does, however, reverse the conventional wisdom on
employee-directors.
Table 8 suggests there might be some weak correlation between internal and external governance.
We thus provide new estimates of equation (2) in table 9 including an external governance measure
as further control. Columns 1-3 focus on ROA as a measure of performance, while columns 4-6 look
at the e¤ects on the market valuation of assets. Columns 1 and 4 include the GIM index only, and
the �rm controls and mechanical correlates of (2). Columns 2 and 5 add our internal governance IG
index. Columns 3 and 6 include the other external governance indexes.
Consistent with Gompers, Ishii and Metrick (2003), the GIM index is negatively correlated with
market to book, but not with operating performance. However, this correlation with market to book
disappears once we include the index of internal governance. To be fair, the coe¢ cient estimate
becomes noisier, but not smaller, partly because the number of observations where our index and
the GIM index overlap is less than 5,000. Notice that in columns 2 and 5, the coe¢ cient on internal
governance is identical to some results in Table 2.
Finally, the inclusion of the other external governance indexes shows that (1) most are not really
correlated with corporate performance, which is consistent with the existing literature, (2) the share
of inside directors is positively correlated with performance and (3) the e¤ect of our index remains
una¤ected by the inclusion of these controls, even though they considerably reduce the sample size.
Before concluding, we run a similar horse race between external and internal governance for our
acquisition returns results. The simplest way to do this is to ask whether after an acquisition, the
long-run stock returns of acquirers with poor external governance underperform those of acquirers
with good external governance. To do this, we repeat the exercise in section 4 by computing long-run
cumulative abnormal returns for acquirers with an above- and below-median GIM index. Average
long-run returns are reported in columns 4-6 of table 6, as well as in �gure 4. Column 4 displays
returns to long-term shareholders of management-friendly companies, column 5 does the same for
shareholder-friendly companies. Column 6 computes the di¤erence, and tests for equality. As is
apparent from both the Table and the �gure, the two subgroups display strong negative returns
21

for large acquisitions (10-15% after four years); the di¤erence between them, however, is small and
insigni�cant statistically.
6 Conclusion
This paper argues that the careful design of the chain of command within the �rm a¤ects the
e¢ ciency of the decisions that are taken. Our informal argument is that independently-minded
executives always impose more constraints on the CEO than executives who owe him their jobs.
These constraints may prevent controversial decisions from being taken, and have in general the
useful e¤ect of de-biasing the CEO. To do this, top executives do not have to formally disobey, or
enter in open con�ict with their boss. They may simply choose to be less enthusiastic in their work.
This argument is explored theoretically in a companion paper (Landier, Sraer and Thesmar
(2005)). Our framework is very simple: a �rm has to choose between two projects, A and B. A CEO
receives a private signal as to which project is best, and orders his executives to carry out the project
that he wants implemented. The executives can put in various degrees of e¤ort. Importantly, both
CEO and executives have intrinsic preferences toward A or B (they are biased). Their biases can be
similar (executive dependence) or di¤erent (executive independence). We make two key assumptions.
First, the CEO has privileged information on the project�s quality. Second, the top executives have
to carry out the project that they are ordered to implement, and cannot openly disobey.
We �nd that it might be optimal, from an (unbiased) shareholder perspective to have executives
who disagree with the CEO over the preferred course of action. The reason is that the CEO has to
�elicit the executive�s support,�i.e., he needs them to put in high e¤ort. This constraint will reduce
the CEO�s bias and lead to an improvement in decision-making. The e¤ect will be reinforced by
increasing credibility: executives know that the CEO will be less biased, and will, in consequence,
believe his orders more often. With independent executive, the CEO gains legitimacy. But dissent
will also be costly because it will �paralyze� the chain of command: executives will be ordered to
carry out projects they dislike more often, and will put in less e¤ort.
22
7 References
ADAMS, R. B., H. ALMEIDA, and D. FERREIRA, 2002, �Powerful CEOs and their Impact on
Corporate Performance,�Review of Financial Studies (forthcoming).
BAGHAT, S., and B. BLACK, 2003, �The Non-Correlation Between Board Independence and
Long Term Firm Performance,�Journal of Corporation Law.
BEBCHUK, L., and A. COHEN, 2004, �The Costs of Entrenched Boards,�Journal of Financial
Economics (forthcoming).
BRADLEY, M., and SUNDARAM, A., 2004, �Do Acquisitions Drive Performance or Does Per-
formance Drive Acquisitions?�, mimeo
CARHART, M., 1997, "On Persistence in Mutual Fund Performance." Journal of Finance, 52:1,
pp 57-82.
CREMERS, M., K. JOHN, and V. NAIR, 2005, �Takeovers, Governance and the Cross-Section
of Returns,�mimeo.
DAHYA, J., J. MC CONNEL, and N. TRAVLOS, 2002, �The Cadbury Commitee, Corporate
Performance and Top Management Turnover,�The Journal of Finance, 67, 461�480.
FAMA, E. and K. FRENCH, 1996, �Multifactor Explanations of Asset Pricing Anomalies�,
Journal of Finance, 51, 55-84
FAMA, E. and K. FRENCH, 1997, �Industry Costs of Equity�, Journal of Financial Economics,
43:2, 153-193
FEE, C.E., and C.J. HADLOCK, 2004, �Management Turnover across the Corporate Hierarchy,�
Journal of Accounting and Economics, Vol. 37, pp. 3-38.
GOMPERS, P., J. ISHII, and A. METRICK, 2003, �Corporate Governance and Equity Prices,�
Quaterly Journal of Economics, 118.
23
HAYES, R., P. OYER, and S. SCHAEFFER, 2006, �Co-Worker Complementarity and the Stabil-
ity of Top Management Teams,�Journal of Law, Economics and Organization, 22, Spring, 184-212.
HERMALIN, B., and M. WEISBACH, 2003, �Boards of Directors as an Endogenously Deter-
mined Institution: A Survey of the Economic Evidence,�Economic Policy Review, 9, 7�26.
KAPLAN, S. and MINTON, B., 1994, �Appointment of Outsiders in Japanese Boards: Deter-
minants and Implications for Managers,�Journal of Financial Economics, 36, 225�258.
LANDIER, A., SRAER, D. and THESMAR, D., 2005, �Optimal Dissent in Organizations,�
mimeo
LOUGHRAN, T. and VIJH, A., 1997, �Do Long-Term Shareholders Bene�t from Corporate
Acquisitions?�, Journal of Finance, 52
LYON, J.D., BARBER, B.M., and TSAI, C. 1999. �Improved Methods for Tests of Long-Run
Abnormal Stock-Returns,�Journal of Finance, 54.
MITCHELL, M.L., and STAFFORD, E., 2000, �Managerial Performance and Long-Term Stock-
price Performance," Journal of Business, 73:287-320
MOELLER, S., SCHLINGEMANN, F., and STULZ, R., 2005, �Wealth Destruction on a Massive
Scale? A Study of Acquiring-Firm Returns in the Recent Merger Wave,� Journal of Finance, 60,
757-782
MORCK, R., SHLEIFER, A., and R. VISHNY, 1989, �Alternative Mechanisms of Corporate
Control,�American Economic Review, 79: 842-852
ROSENSTEIN, S., and J. WYATT, 1990, �Outside Directors, Board Independence and Share-
holder Wealth,�Journal of Financial Economics, 26, 175�191.
VAFEAS, N., 1999, �Board Meeting Frequency and Firm Performance,� Journal of Financial
Economics, 53, 113�142.
VAN DEN STEEN, E., 2005, �Organizational Beliefs and Managerial Vision,�Journal of Law,
24

Economics and Organization, 21, 256�283.
WEISBACH, M., 1988, �Outside Directors and CEO Turnover,�Journal of Financial Economics,
20, 431�460.
YERMACK, D., 1996, �Higher Market Valuation of Companies with a Smaller Board of Direc-
tors,�Journal of Financial Economics, 40, 185�211.
ZINGALES, L., 2004, �Want to Stop Corporate Fraud? Pay O¤Those Whistle-Blowers,�Wash-
ington Post (outlook section).
25

A Figures
Figure 1: Abnormal Economic Performance by Quintile of Governance Index
26
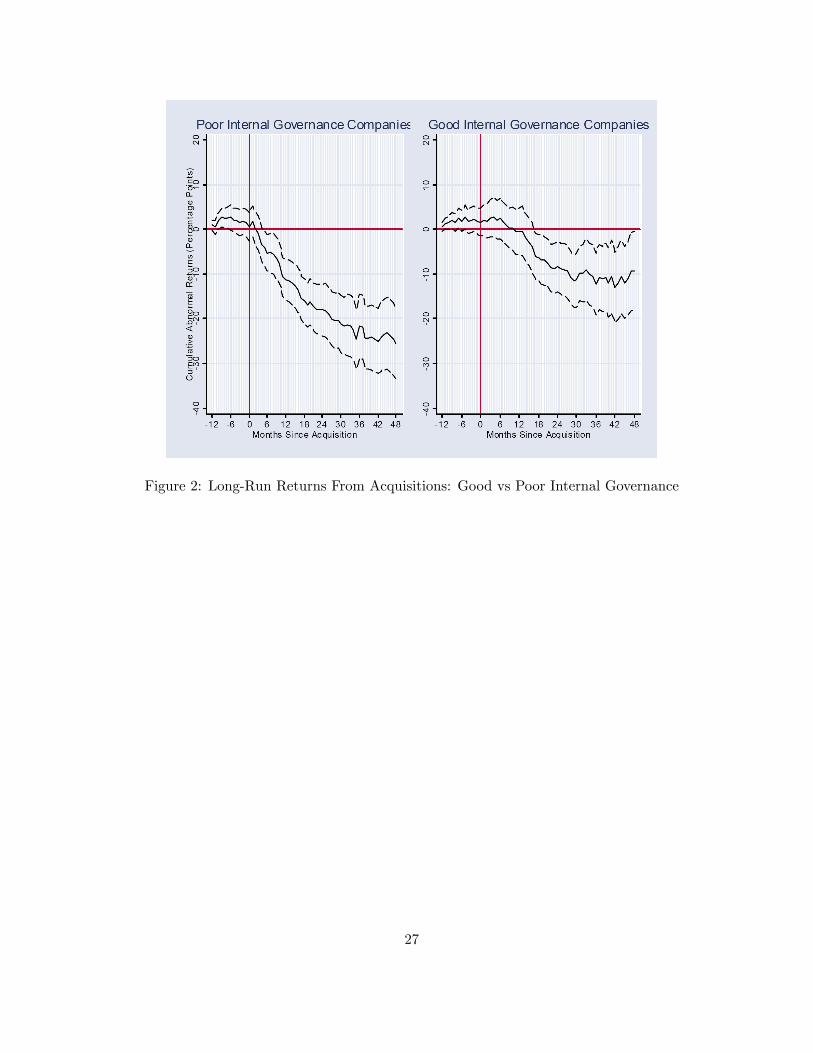
Figure 2: Long-Run Returns From Acquisitions: Good vs Poor Internal Governance
27

Figure 3: Long-Run Returns From Acquisitions: Good vs Poor External Governance
28

B Tables
Table 1: Mechanical Correlates of Internal Governance
Fraction of executivesappointed after the CEO (�100)(1) (2) (3) (4)
CEO seniority 1.3��� 1.3��� 1.4��� 1.5���
(0.1) (0.1) (0.1) (0.7)Executives�mean seniority -1.2��� -1.0��� -0.9��� -0.8���
(0.0) (0.0) (0.0) (0.0)Fraction of executives whose - 0.6��� 0.5��� 0.4���
seniority is reported (�100) (0.0) (0.0) (0.0)CEO from outside - 9.3��� 6.9��� 6.3���
(0.8) (0.7) (0.7)Fraction of executives appointed - - 0.5��� 0.5���
in the year foll. CEO nomination (�100) (0.0) (0.0)Ln(Firm Age) - - - -1.0��
(0.5)Firm Size - - - -0.0
(0.2)
48 industry dummies No No No YesYear dummies Yes Yes Yes YesR2 0.25 0.62 0.71 0.73Observations 11,147 8,728 8,728 8,166
Source: OLS estimates, allowing for heteroskdastic residuals, clustered at the �rm level. The fraction ofexecutives appointed after the CEO is regressed on various variables suspected to be mechanically correlated:column 1 controls for the fact that the CEO is an outsider, the CEO seniority, as well as for the mean seniorityof executives; column 2 adds the number of executives appointed in the �rst two years following the CEOnomination; column 3 adds �rm speci�c control, namely Firm Size as measured by log of Asset, log of FirmAge and the 48 Fama French industries. �, �� and ��� means statistically di¤erent from zero at 10,5 and 1%level of signi�cance. Our Internal Governance Index is de�ned as the residual of column (2) regression.
29

Table 2: Accounting Performance and Internal Governance
Return on Assets (�100) Market to BookExplanatory variables (1) (2) (3) (1) (2) (3)
Internal governance index -7.1��� -7.3��� -3.7��� -0.6��� -0.6��� -0.4��
(delayed by 1 year) (1.5) (1.5) (1.2) (0.2) (0.2) (0.2)[-1.1] [-1.1] [-0.6] [-0.1] [-0.1] [-0.1]
Controls:
Firm initial pro�tability No No Yes No No YesCEO, Executive characteristics No Yes Yes No Yes YesFirm log(assets), log(age) Yes Yes Yes Yes Yes YesYear, Industry FE Yes Yes Yes Yes Yes Yes
Source: Huber-White-Sandwich estimates, allowing for correlation of all observations of a given �rm. �InternalGovernance Index� is the share of EXECUCOMP executives who joined the company after the CEO wasappointed, �ltered from mechanical e¤ects. It is de�ned as the residual of the column (3) regression in table1. Corporate performance is measured through Return on Assets (�rst three columns) and through marketvaluation of assets (last three columns). All regressions use log(book assets), log(�rm age), year dummies andthe 48 Fama French industry dummies. In columns 2 and 5, we add the CEO and executives characteristicsthat serve as regressors in table 1. Column 3 (resp. column 6) further adds the �rm�s ROA (resp. marketto book) computed in its �rst year of presence in COMPUSTAT after 1991, as a limited attempt to controlfor �rm level unobserved heterogeneity. �, �� and ��� means statistically di¤erent from zero at 10,5 and 1%level of signi�cance. The term reported in brackets is the marginal e¤ect of one standard deviation change ingovernance index on the dependent variable.
30

Table 3: Accounting Performance and Internal Governance - Year by Year Results
ROA Market To Book
1993 -9.1��� -0.4(3.0) (0.4)
1994 -9.9��� -0.9���
(3.5) (0.3)1995 -10.3��� -0.5
(2.7) (0.3)1996 -10.6��� -0.5�
(2.6) (0.3)1997 -5.3�� -0.8���
(2.3) (0.3)1998 -9.7��� -1.1���
(2.4) (0.3)1999 -5.9��� -0.9���
(2.3) (0.3)2000 -7.1��� -0.8��
(2.6) (0.3)2001 -3.8 -0.2
(2.6) (0.3)2002 -5.2�� -0.3
(2.4) (0.3)
Fama-Mac Beth -7.7��� -0.6���
(0.8) (0.1)
Source: OLS estimates. Regressions of corporate performance on internal governance index and controlsare run separately each year. The coe¢ cients on internal governance and their standard error are reported.Each column corresponds to the choice of one corporate performance measure (ROA or M/B). Corporateperformance is then regressed on one-year-lagged internal governance index, controlling for CEO and executiveseniority, fraction of executives reporting seniority, CEO�s origin, log(assets), log(�rm age), sales growth and48 industry-dummies. The speci�cation is identical to the regression presented in table 2, columns 2 and 5.The bottom row indicates the Fama-Mac Beth estimate. �, �� and ��� means statistically di¤erent from zeroat 10,5 and 1% level of signi�cance.
31

Table 4: Accounting Performance and Internal Governance - GrangerCausality
Internal ROAGovernance (�100)
One-year-lag speci�cation:Internal governance index (-1) 0.8��� -1.8���
(0.0) (0.5)ROA (-1) -0.5 0.8���
(�100) (1.3) (0.0)
Two-year-lag speci�cation:Internal governance index (-2) 0.7��� -2.0���
(0.0) (0.8)ROA (-2) -0.9 0.6���
(�100) (2.4) (0.0)
Controls :Firm log(assets),log(age) Yes YesYear, Industry FE Yes Yes
Source: Hubert-White-Sandwhich estimates, allowing for residuals correlated across all observations of each�rm. In the top panel, column 1 reports the estimate of a regression of internal governance on one-year laggedinternal governance and one-year lagged corporate performance. Column 2 reports the result of a regressionof corporate performance on one-year lagged internal governance and one-year lagged corporate performance.Both regressions control for �rm age and size, industry and year �xed e¤ects. The bottom panel reports thesame regression results, taking two-year-lags as explanatory variables, instead of one-year-lags. Corporateperformance is measured through Return on Assets. Standard errors are between parentheses. �, �� and ���
means statistically di¤erent from zero at 10,5 and 1% level of signi�cance.
32

Table 5: Accounting Performance and Internal Governance - Controlling for Executives Turnover
ROA Market to BookExplanatory variables (1) (2)
Internal governance index �2:2��� �0:3���(delayed by 1 year) (.56) (.09)
[-.4] [-.05]
Controls:
Executives Turnover �3:1��� �0:2���at year t-1 (.66) (.08)
[-.5] [.-03]
Firm initial pro�tability Yes YesCEO, Executive characteristics Yes YesFirm log(assets), log(age) Yes YesYear, Industry FE Yes Yes
Source: Huber-White-Sandwich estimates, allowing for correlation of all observations of a given �rm. �InternalGovernance Index� is the share of EXECUCOMP executives who joined the company after the CEO wasappointed, �ltered from mechanical e¤ects. It is de�ned as the residual of the column (3) regression in table1. Corporate performance is measured through Return on Assets (�rst three columns) and through marketvaluation of assets (last three columns). Executive Turnover at year t � 1 measures the fraction of the�rm�s year t � 1 executives who are no longer reported as working for the company at year t inthe EXECUCOMP data. All regressions use log(book assets), log(�rm age), year dummies, the 48 FamaFrench industry dummies, CEO and executives characteristics, and �rm�s initial ROA (resp. market to book)computed in its �rst year of presence in COMPUSTAT after 1991. �, �� and ��� means statistically di¤erentfrom zero at 10,5 and 1% level of signi�cance. The term reported in brackets is the marginal e¤ect of onestandard deviation change in governance index on the dependent variable.
33

Table 6: Long Run Abnormal Returns Following a Major Acquisition
Internal Governance External GovernancePoor Good Di¤erence Poor Good Di¤erence
Months since acquisition-12 - - - - - --6 2.7 1.9 -0.8 1.7 1.6 -0.10 0.6 1.6 1.0 1.0 1.2 0.3+6 -5.3 2.5 7.8��� -3.3 0.6 3.9+12 -11.4 -0.4 10.9��� -5.5 -2.8 2.7+18 -16.0 -6.4 9.6��� -11.8 -4.5 7.3��
+24 -18.0 -8.4 9.6�� -15.1 -5.3 9.7��
+30 -21.2 -11.4 9.8�� -14.0 -9.0 4.8+36 -21.7 -12.3 9.4� -14.3 -11.3 3.0+42 -25.0 -12.9 12.0�� -14.2 -14.8 -0.6+48 -25.4 -9.4 16.2��� -11.8 -15.3 -3.5
Source: 818 acquisitions from SDC Database. Abnormal returns are computed after estimating, for eachacquirer, a Fama French 3 factor model + momentum on the 48 months preceeding the acquisition. Cumulativeabnormal returns, starting 12 months before the deal, are computed for each �rm. Column 1 reports, every6 months, the average cumulative abnormal returns of acquirers with internal governance lower than median.Column 2 does the same for above median internal governance acquirers, while column 3 reports the di¤erence.�, �� and ��� means statistically di¤erent from zero at 10,5 and 1% level of signi�cance, using a standard testof equality, assuming away the equality of variances.
34
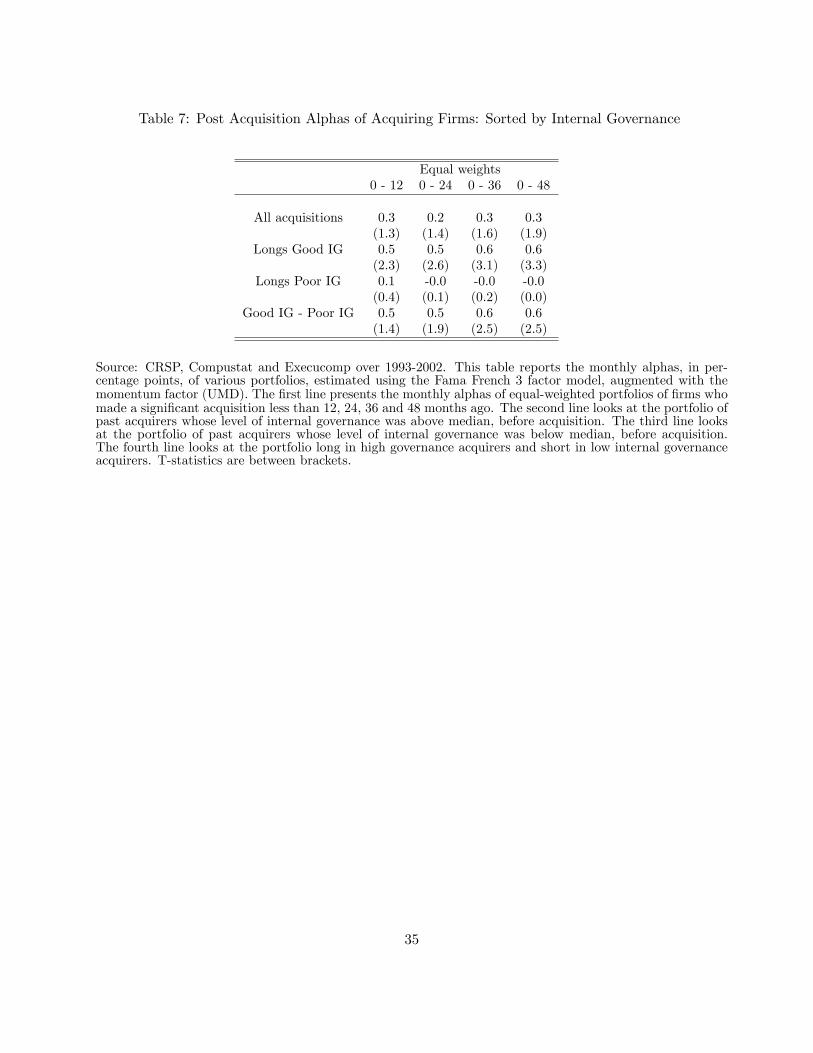
Table 7: Post Acquisition Alphas of Acquiring Firms: Sorted by Internal Governance
Equal weights0 - 12 0 - 24 0 - 36 0 - 48
All acquisitions 0.3 0.2 0.3 0.3(1.3) (1.4) (1.6) (1.9)
Longs Good IG 0.5 0.5 0.6 0.6(2.3) (2.6) (3.1) (3.3)
Longs Poor IG 0.1 -0.0 -0.0 -0.0(0.4) (0.1) (0.2) (0.0)
Good IG - Poor IG 0.5 0.5 0.6 0.6(1.4) (1.9) (2.5) (2.5)
Source: CRSP, Compustat and Execucomp over 1993-2002. This table reports the monthly alphas, in per-centage points, of various portfolios, estimated using the Fama French 3 factor model, augmented with themomentum factor (UMD). The �rst line presents the monthly alphas of equal-weighted portfolios of �rms whomade a signi�cant acquisition less than 12, 24, 36 and 48 months ago. The second line looks at the portfolio ofpast acquirers whose level of internal governance was above median, before acquisition. The third line looksat the portfolio of past acquirers whose level of internal governance was below median, before acquisition.The fourth line looks at the portfolio long in high governance acquirers and short in low internal governanceacquirers. T-statistics are between brackets.
35
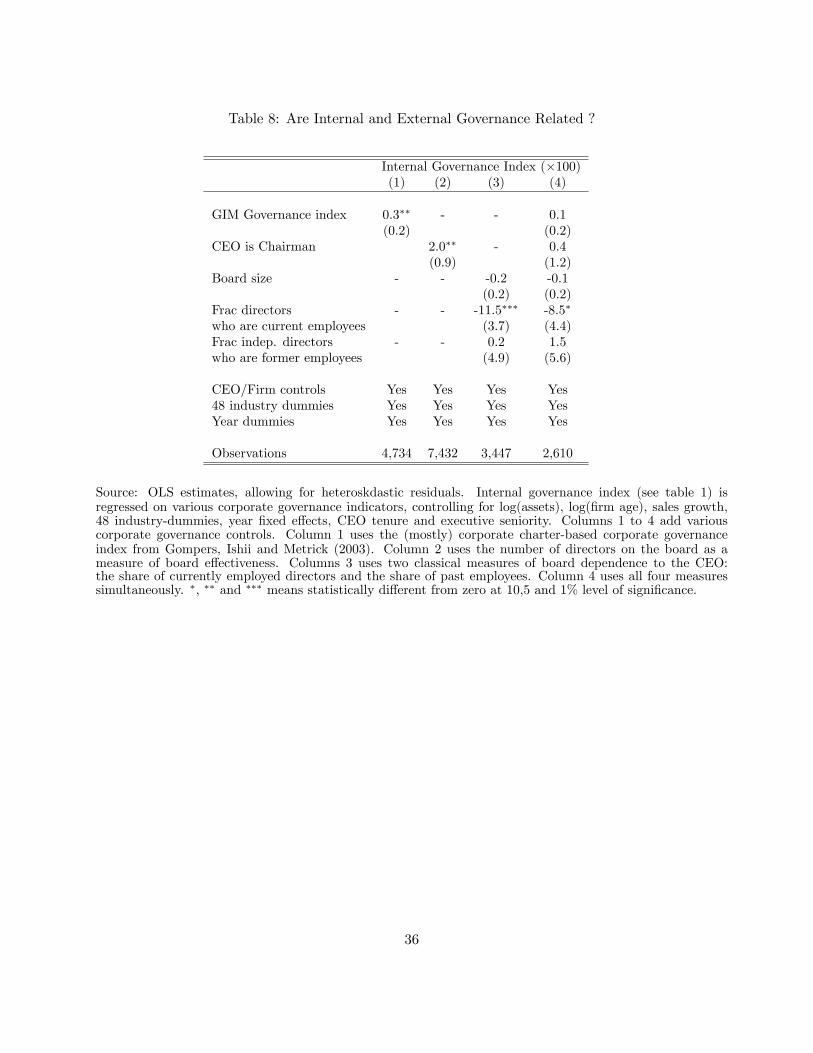
Table 8: Are Internal and External Governance Related ?
Internal Governance Index (�100)(1) (2) (3) (4)
GIM Governance index 0.3�� - - 0.1(0.2) (0.2)
CEO is Chairman 2.0�� - 0.4(0.9) (1.2)
Board size - - -0.2 -0.1(0.2) (0.2)
Frac directors - - -11.5��� -8.5�
who are current employees (3.7) (4.4)Frac indep. directors - - 0.2 1.5who are former employees (4.9) (5.6)
CEO/Firm controls Yes Yes Yes Yes48 industry dummies Yes Yes Yes YesYear dummies Yes Yes Yes Yes
Observations 4,734 7,432 3,447 2,610
Source: OLS estimates, allowing for heteroskdastic residuals. Internal governance index (see table 1) isregressed on various corporate governance indicators, controlling for log(assets), log(�rm age), sales growth,48 industry-dummies, year �xed e¤ects, CEO tenure and executive seniority. Columns 1 to 4 add variouscorporate governance controls. Column 1 uses the (mostly) corporate charter-based corporate governanceindex from Gompers, Ishii and Metrick (2003). Column 2 uses the number of directors on the board as ameasure of board e¤ectiveness. Columns 3 uses two classical measures of board dependence to the CEO:the share of currently employed directors and the share of past employees. Column 4 uses all four measuressimultaneously. �, �� and ��� means statistically di¤erent from zero at 10,5 and 1% level of signi�cance.
36
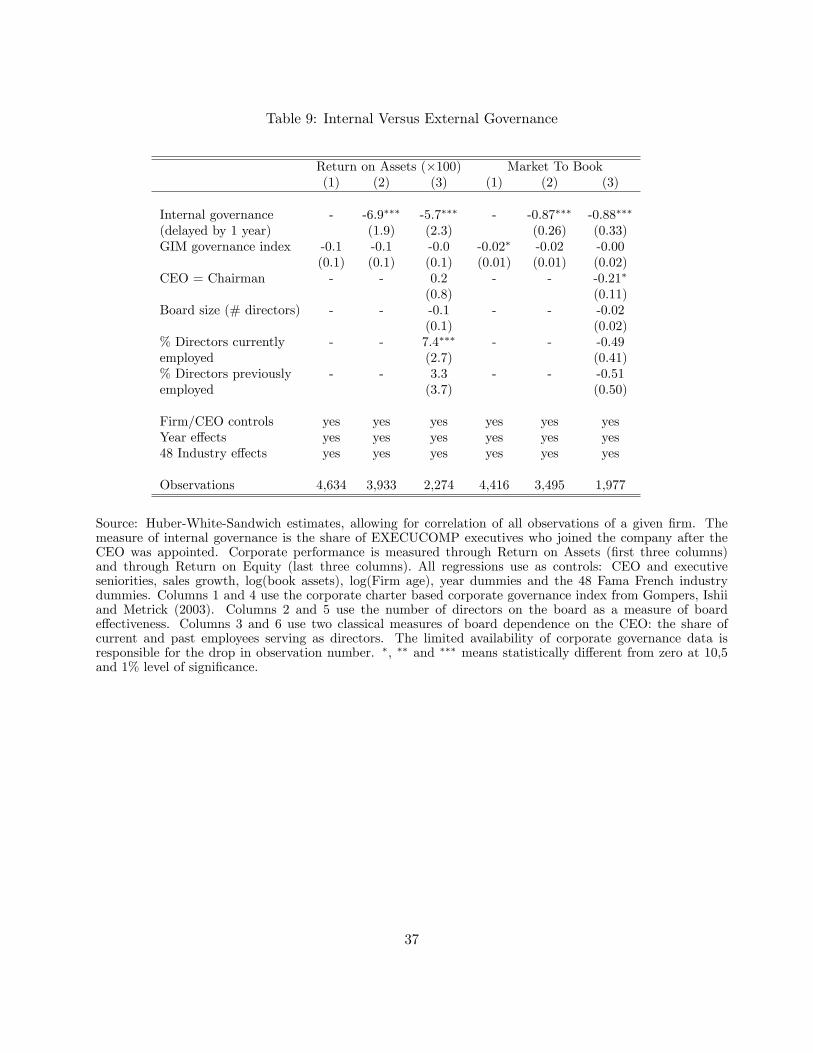
Table 9: Internal Versus External Governance
Return on Assets (�100) Market To Book(1) (2) (3) (1) (2) (3)
Internal governance - -6.9��� -5.7��� - -0.87��� -0.88���
(delayed by 1 year) (1.9) (2.3) (0.26) (0.33)GIM governance index -0.1 -0.1 -0.0 -0.02� -0.02 -0.00
(0.1) (0.1) (0.1) (0.01) (0.01) (0.02)CEO = Chairman - - 0.2 - - -0.21�
(0.8) (0.11)Board size (# directors) - - -0.1 - - -0.02
(0.1) (0.02)% Directors currently - - 7.4��� - - -0.49employed (2.7) (0.41)% Directors previously - - 3.3 - - -0.51employed (3.7) (0.50)
Firm/CEO controls yes yes yes yes yes yesYear e¤ects yes yes yes yes yes yes48 Industry e¤ects yes yes yes yes yes yes
Observations 4,634 3,933 2,274 4,416 3,495 1,977
Source: Huber-White-Sandwich estimates, allowing for correlation of all observations of a given �rm. Themeasure of internal governance is the share of EXECUCOMP executives who joined the company after theCEO was appointed. Corporate performance is measured through Return on Assets (�rst three columns)and through Return on Equity (last three columns). All regressions use as controls: CEO and executiveseniorities, sales growth, log(book assets), log(Firm age), year dummies and the 48 Fama French industrydummies. Columns 1 and 4 use the corporate charter based corporate governance index from Gompers, Ishiiand Metrick (2003). Columns 2 and 5 use the number of directors on the board as a measure of boarde¤ectiveness. Columns 3 and 6 use two classical measures of board dependence on the CEO: the share ofcurrent and past employees serving as directors. The limited availability of corporate governance data isresponsible for the drop in observation number. �, �� and ��� means statistically di¤erent from zero at 10,5and 1% level of signi�cance.
37