overview of the pm hot-spot requirements and … of the pm hot-spot requirements and guidance for...
TRANSCRIPT
Overview of the PM Hot-spot Requirements and Guidance for
Transportation Conformity
Meg Patulski, U.S. EPA
TRB Annual Meeting January 22, 2012
1

Outline of Presentation
Background on conformity requirements
Overview of PM hot-spot guidance
EPA and DOT training efforts
2

3
Statutory and Regulatory Requirements CAA section 176(c) requires that federally supported
transportation projects in nonattainment and maintenance areas cannot: » Cause or contribute to new air quality violations, » Worsen existing violations, or » Delay timely attainment of the NAAQS or interim milestones
Transportation conformity rule is at 40 CFR parts 51 and 93
» Applies only in nonattainment and maintenance areas for transportation-related NAAQS
Section 93.101 defines a hot-spot analysis as an estimation
of likely future localized pollutant concentrations and a comparison to the relevant NAAQS » This is smaller than an entire nonattainment or maintenance area

Focus of PM Hot-spot Analysis
4

Relevant PM NAAQS
PM hot-spot analyses are done only for the PM NAAQS for which the area is designated nonattainment or maintenance: » 1997 Annual PM2.5 NAAQS – 15.0 µg/m3 » 1997 24-hour PM2.5 NAAQS – 65 µg/m3 » 2006 24-hour PM2.5 NAAQS – 35 µg/m3 » 1987 24-hour PM10 NAAQS – 150 µg/m3
Areas may be designated nonattainment for more than
one PM NAAQS
5

Projects of Local Air Quality Concern
Section 93.123(b)(1) requires a PM hot-spot analysis only for projects of local air quality concern » PM hot-spot analyses are not required for other projects
Examples of projects that require a PM hot-spot analysis: » A project on a new highway or expressway that serves a significant
volume of diesel truck traffic, such as facilities with greater than 125,000 AADT and 8% or more of such AADT is diesel truck traffic
» New exit ramps and other highway facility improvements to connect a highway or expressway to a major freight, bus, or intermodal terminal
» A major new bus or intermodal terminal that is considered to be a “regionally significant project” under section 93.101 that involves a significant number of diesel buses or trucks
6

7
How is Conformity Met in a Hot-spot Analysis?
Project meets conformity requirements, if at each appropriate receptor: PM concentration of build < NAAQS, or PM concentration of build < PM concentration of no-build
Example: Conformity is met at a receptor in a 2006 PM2.5 NAAQS area in either of these cases:
Build (with project) 34 µg/m3 NAAQS: 35 µg/m3
or, if:
Build (with project) 36 µg/m3 (above the NAAQS) No-build (without project) 37 µg/m3
Guidance Reference:
Section 2.4

New Guidance and Models
On December 20, 2010, EPA released PM Hot-spot Guidance » Transportation Conformity Guidance for Quantitative Hot-spot Analyses
in PM2.5 and PM10 Nonattainment and Maintenance Areas
Guidance is consistent with existing regulations and guidance for conformity, the PM NAAQS, SIPs, and other regulatory programs » Does not change the conformity requirements (such as what projects
require PM hot-spot analyses)
EPA also approved MOVES2010a for use in PM and CO hot-spot analyses and EMFAC2007 for PM hot-spot analyses in California » 2-year conformity grace period ends December 20, 2012
8

When Are Quantitative PM Hot-spot Analyses Required?
Beginning December 20, 2012, quantitative PM hot-spot analyses are required » Exception: a qualitative PM hot-spot analysis begun before December
20, 2012 can be completed
Until December 20, 2012: » Any PM hot-spot analyses required can continue to be done
qualitatively » Quantitative analyses can be completed, if desired
Hot-spot analysis grace period is separate from MOVES2010
grace period for regional conformity analyses
9

10
Step 1 Determine Need for
Analysis
Step 2 Determine Approach,
Models, and Data
Step 4 Estimate Emissions
from Road Dust, Construction, and
Additional Sources
Step 9
Document Analysis
Step 7 Calculate Design
Values and Determine Conformity
Step 8 Consider Mitigation or Control Measures
Step 5 Select Air Quality
Model, Data Inputs, and Receptors
Step 6 Determine
Background Concentrations
Step 3 Estimate On-Road Motor
Vehicle Emissions Is project located in California?
Estimate using MOVES
Estimate using EMFAC
Yes
No
Completing a PM Hot-spot Analysis
Reminder: Interagency consultation process is essential throughout
Guidance Reference:
Exhibit 3-1

PM Hot-spot Analysis Requirements
Section 93.116(a) requires that project cannot cause new NAAQS violations, worsen existing violations, or delay timely attainment over timeframe of transportation plan or regional conformity analysis
Sections 93.110 and 93.111 requires hot-spot analyses to be based on latest planning assumptions and latest emissions models
Section 93.105(c)(1)(i) requires interagency consultation procedures to be used to “evaluate and choose models and associated methods and assumptions”
Section 93.123(c) includes general requirements for PM hot-spot analyses
11

General Regulatory Requirements
Section 93.123(c) requires that PM hot-spot analyses must: Estimate the total emissions burden of direct PM emissions: project
and background Include the entire transportation project, after identifying the major
design features that will significantly impact local concentrations Use assumptions consistent with those used in regional emissions
analyses for inputs required in both analyses (e.g., temperature, humidity)
Assume mitigation or control measures only where written commitments have been obtained
Consider emissions increases from construction-related activities only if they occur during the construction phase and last more than five years at any individual site
» PM hot-spot analyses are not required to consider temporary increases
12
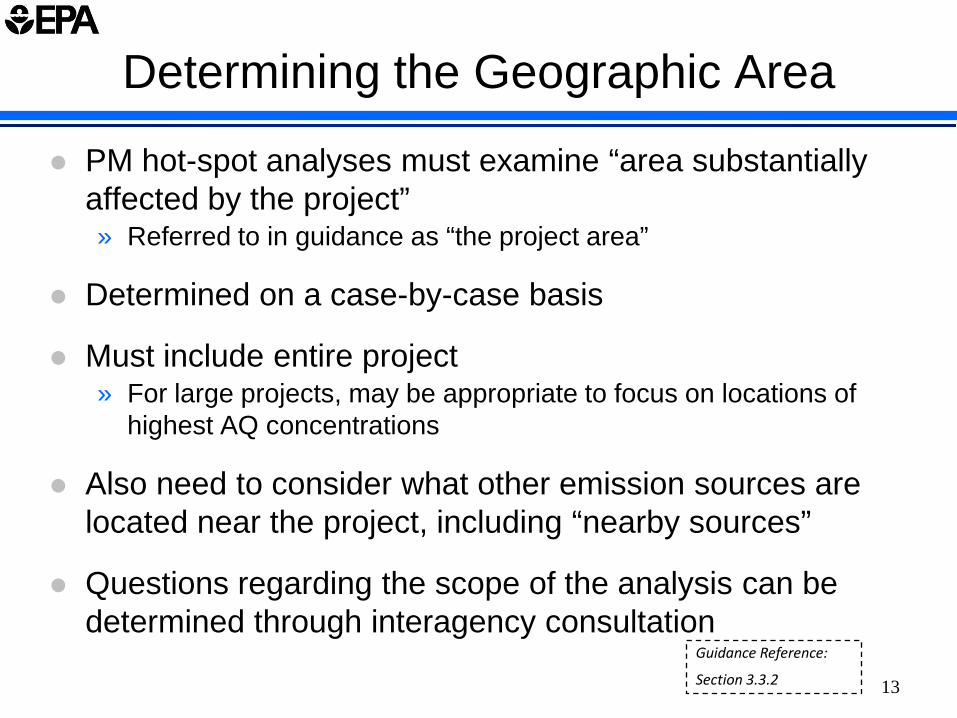
Determining the Geographic Area
PM hot-spot analyses must examine “area substantially affected by the project” » Referred to in guidance as “the project area”
Determined on a case-by-case basis
Must include entire project » For large projects, may be appropriate to focus on locations of
highest AQ concentrations
Also need to consider what other emission sources are located near the project, including “nearby sources”
Questions regarding the scope of the analysis can be determined through interagency consultation
13
Guidance Reference:
Section 3.3.2

500 m
Roads affected by project Emissions modeling Project area Air quality modeling
1/2 mile
Hypothetical situation Example of Project Area

Analysis Year(s) and Quarters Evaluated
Need to choose an analysis year(s) during when: » Peak emissions from project are expected, and » New or worsened violation would most likely occur due to cumulative impacts
of project and background concentrations
Need to consider changes in vehicle fleets, traffic volumes, speeds, VMT, and expected trends in background concentrations in project area and impacts of any nearby sources (e.g., those affected by project)
A hot-spot analysis for the annual PM NAAQS would cover all 4 quarters of the analysis year
Hot-spot analyses for the 24-hour PM10 or PM2.5 NAAQS would typically cover all 4 quarters of the analysis year, unless future violations and peak emissions are expected for one quarter
15
Guidance Reference:
Section 2.8. 3.3.3, & 3.3.4

Data, Models, and Methods
Latest planning assumptions at time of analysis required » Project-specific data for both emissions and AQ modeling is critical
Latest emissions models required (pending grace period) » MOVES2010a » EMFAC2007 in California » For future model releases, EPA will explain how and when new
models and revisions apply for PM hot-spot analyses
When applicable, complete emissions modeling for dust (e.g., AP-42) or nearby sources affected by the project (e.g., locomotives at an expanded freight terminal)
Important to select AQ model early in process (needed to prepare emissions modeling) » AERMOD » CAL3QHCR
16
Guidance Reference:
Sections 3.3.6 &3.3.7

General MOVES Guidance
Define a project’s links in MOVES to accurately capture emissions where they occur
Include segments with similar traffic/activity conditions and characteristics
In general, the definition of a link will depend on how much the vehicle activity (accel, decel, cruise, or idle) changes over the length of roadway, data availability, and the modeling approach used
Guidance Reference:
Section 4.2 17

Defining MOVES Links (with Average Speed)

Defining MOVES Links (with Average Speed)

General Overview of Air Quality Modeling
Includes: » Selecting the air quality model » Characterizing emissions sources » Obtaining meteorological (met) data » Specifying receptors in project area » Running the AQ model
PM Hot-spot Guidance is consistent with the
recommendations for AQ modeling in 40 CFR 51, App. W
Project sponsors will need to refer to the latest user guides and available guidance for complete instructions
20
Selecting an Appropriate Air Quality Model
21
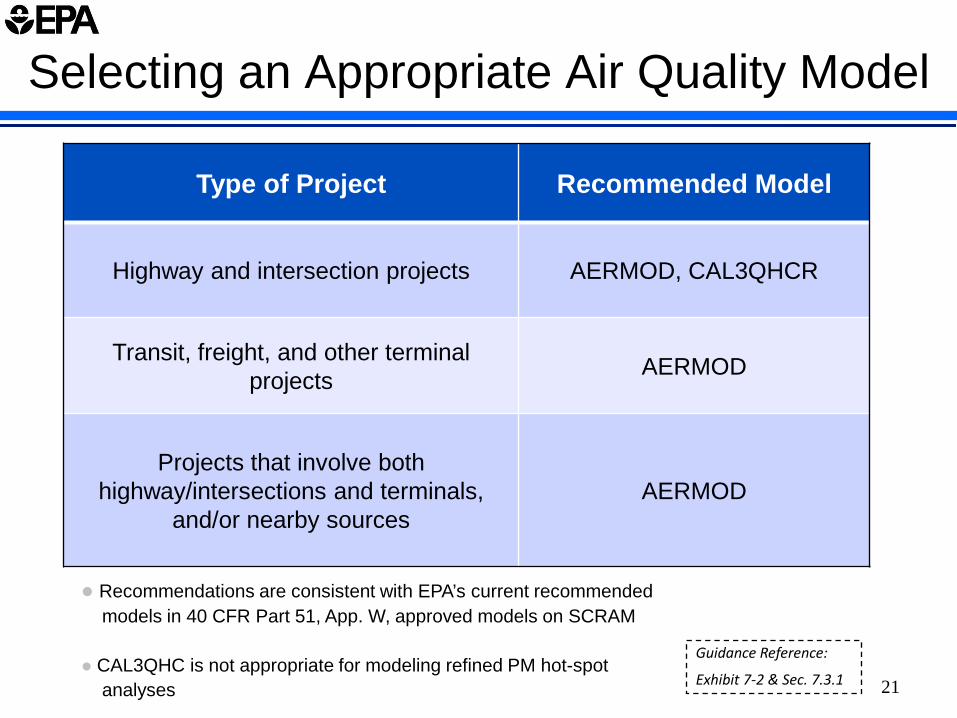
Type of Project Recommended Model
Highway and intersection projects AERMOD, CAL3QHCR
Transit, freight, and other terminal projects AERMOD
Projects that involve both highway/intersections and terminals,
and/or nearby sources AERMOD
Guidance Reference:
Exhibit 7-2 & Sec. 7.3.1
Recommendations are consistent with EPA’s current recommended models in 40 CFR Part 51, App. W, approved models on SCRAM
CAL3QHC is not appropriate for modeling refined PM hot-spot analyses
Types of Emission Sources
22
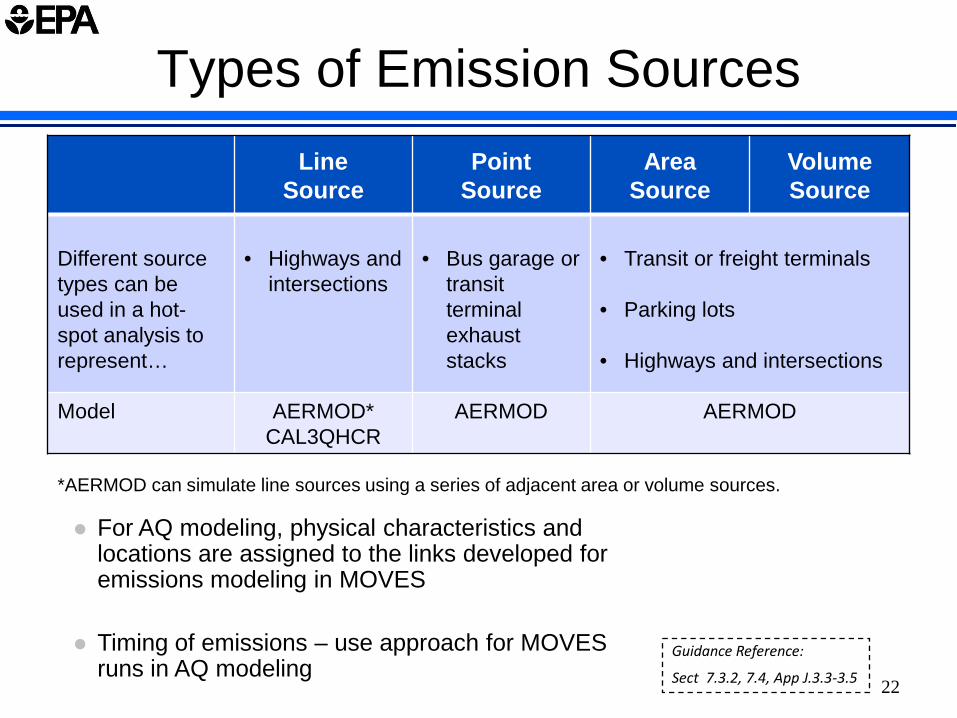
Line Source
Point Source
Area Source
Volume Source
Different source types can be used in a hot-spot analysis to represent…
• Highways and
intersections
• Bus garage or
transit terminal exhaust stacks
• Transit or freight terminals • Parking lots • Highways and intersections
Model AERMOD* CAL3QHCR
AERMOD AERMOD
Guidance Reference:
Sect 7.3.2, 7.4, App J.3.3-3.5
For AQ modeling, physical characteristics and locations are assigned to the links developed for emissions modeling in MOVES
Timing of emissions – use approach for MOVES runs in AQ modeling
*AERMOD can simulate line sources using a series of adjacent area or volume sources.

Selecting Meteorological Data For Air Quality Modeling
Using meteorological (met) data representative of project area is critical for PM hot-spot analyses » Key factor in producing credible results
Following met data is typically required…
» Upper air data » Surface data » Surface characteristics » Population data to account for urban heat island effect
State and local air agencies have experience finding
representative met data » May have preprocessed met data available (typically for use with
AERMOD)
23
Guidance Reference:
Section 7.5

What Do Background Concentrations Include?
24
Guidance Reference:
Section 8.1
Background concentrations are those emissions not from the project that also affect the project area » From nearby sources and other sources
Nearby sources: Individual sources other than the project
that contribute to ambient PM concentrations in the project area; in general only included in AQ modeling when affected by the project » Example: a port, rail yard, or intermodal terminal where emissions
will increase as result of a highway project Other sources: Emissions not from project or any nearby
source that is modeled
State and local AQ agencies and EPA Regions are key resources
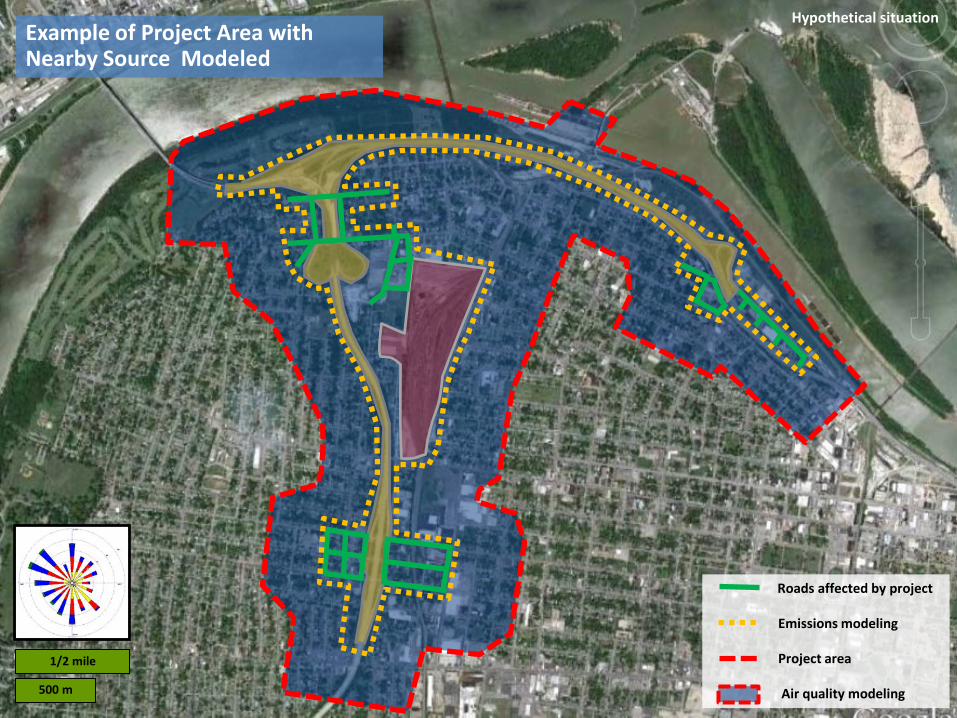
Hypothetical situation
500 m
Roads affected by project Emissions modeling Project area Air quality modeling
1/2 mile
Example of Project Area with Nearby Source Modeled

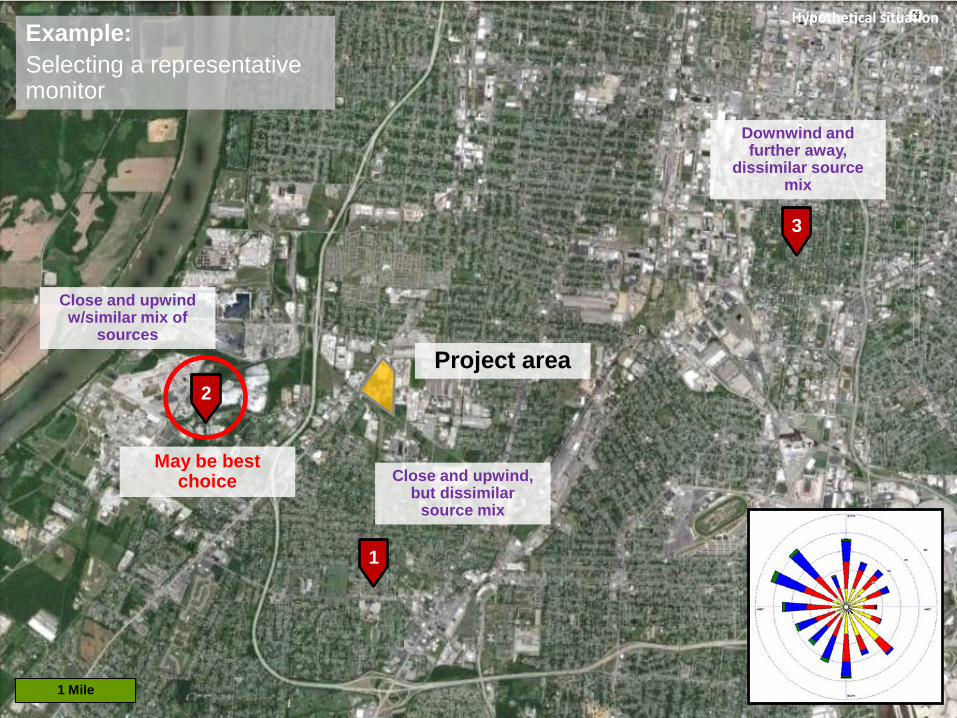
Background for Other Sources
Options include: 1. Using data from one or more air quality monitors 2. Using a chemical transport model (CTM) 3. Using an on-road mobile source adjustment factor 4. Other options as considered by EPA
Use same background concentrations for build
and no-build scenarios at all receptors
26
Guidance Reference:
Section 8.3
Annual PM2.5 NAAQS Design Value
27 1 Mile
3
2
1
Example: Selecting a representative monitor
Close and upwind w/similar mix of
sources
Close and upwind, but dissimilar
source mix
Downwind and further away,
dissimilar source mix
May be best
choice
Project area
Hypothetical situation

For conformity purposes, a “design value” is a statistic that
describes future air quality concentrations in the project area that can be compared to a particular NAAQS
Calculated by combining: » Results of AQ model (project and nearby source concentrations)
with » Representative background concentrations
Each NAAQS calculates design values differently
Result of this step: design values for the project that are then
used to determine if project conforms
EPA has developed tips for calculating design values, including a MySQL script for the 24-hour PM2.5 NAAQS
28
Calculating Design Values and Determining Conformity
Guidance Reference:
Section 3.8 & 9

PM Hot-spot Training: 3-Day Course
EPA and FHWA have developed a 3-day technical course that focuses on applying models for conformity PM hot-spot analyses: » MOVES at the project scale (EMFAC in CA) » AERMOD, and » CAL3QHCR
Course includes: » Additional tools & tips » Simple hands-on exercises to apply models » “Example analysis” to demonstrate how models used in practice
29

Course Outline: Day 1
Module 1: Overview of PM Hot-Spot Analysis Requirements and Process
Module 2: Using MOVES at the Project Level
Begin the example analysis using MOVES
30

Course Outline: Day 2
Module 3: Selecting an Air Quality Model, Data Inputs, and Receptors
Module 4: Using AERMOD for PM Hot-Spot Analyses
Continue the example analysis using AERMOD
31

Course Outline: Day 3
Module 5: Using CAL3QHCR for PM hot-spot analyses (continue the example analysis)
Module 6: Determining Background Concentrations
Module 7: Calculating Design Values and Determining Conformity
Calculate design values for the example analysis
32
PM Hot-spot Training: 3-Day Course
Seven trainings have been done so far: » Columbus, Seattle, Newark, Sacramento, Atlanta, Phoenix,
Baltimore
Currently determining other dates & locations » Email us at [email protected] with potential training
locations » Contact Meg Patulski at (734) 214-4842 or [email protected]
Website will be updated as dates/locations are determined » See www.epa.gov/otaq/stateresources/transconf/training.htm » Emails also to be sent to stakeholder groups, TRB, and via EPA’s
mobile listserver
33

For More Information
See EPA’s conformity website for: » Regulations, policy guidance, FR notices, training » www.epa.gov/otaq/stateresources/transconf/policy.htm#project
See EPA’s MOVES website for: » Software, MOVES MySQL scripts, technical documentation, and
other helpful background materials » www.epa.gov/otaq/models/moves/
Questions? » Specific questions on a particular project analysis
– Contact appropriate EPA Region or DOT field office
» General questions on PM hot-spot guidance – [email protected]
» Technical questions about guidance document – [email protected] 34